Sample Category Title
EUR/USD Mid-Day Outlook
Daily Pivots: (S1) 1.0842; (P) 1.0859; (R1) 1.0884; More...
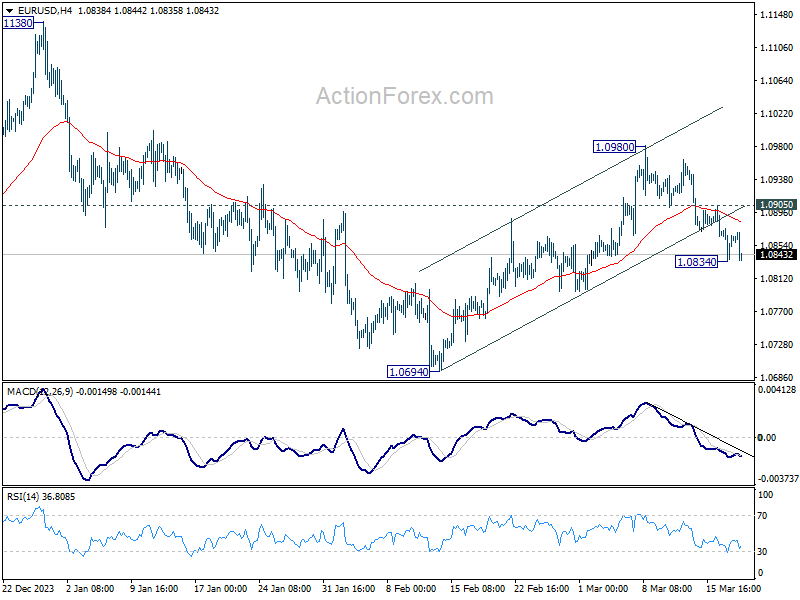
Intraday bias in EUR/USD remains neutral for consolidation above 1.0834 temporary low. Further decline is in favor as long as 1.0905 resistance holds. On the downside, sustained trading below 55 D EMA (now at 1.0856) will argue that rebound from 1.0694 has completed and bring retest of this low. However, above 1.0905 will turn bias back to the upside for 1.0980 resistance instead.
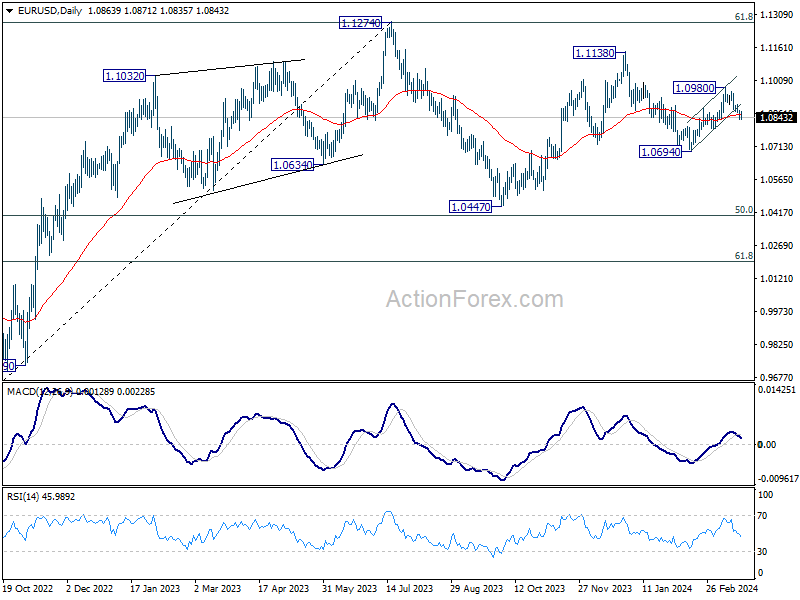
In the bigger picture, price actions from 1.1274 are viewed as a corrective pattern to rise from 0.9534 (2022 low). Rise from 1.0447 is seen as the second leg. While further rally could cannot be ruled out, upside should be limited by 1.1274 to bring the third leg of the pattern. Meanwhile, sustained break of 1.0694 support will argue that the third leg has already started for 1.0447 and possibly below.
GBP/USD Mid-Day Outlook
Daily Pivots: (S1) 1.2681; (P) 1.2708; (R1) 1.2747; More...
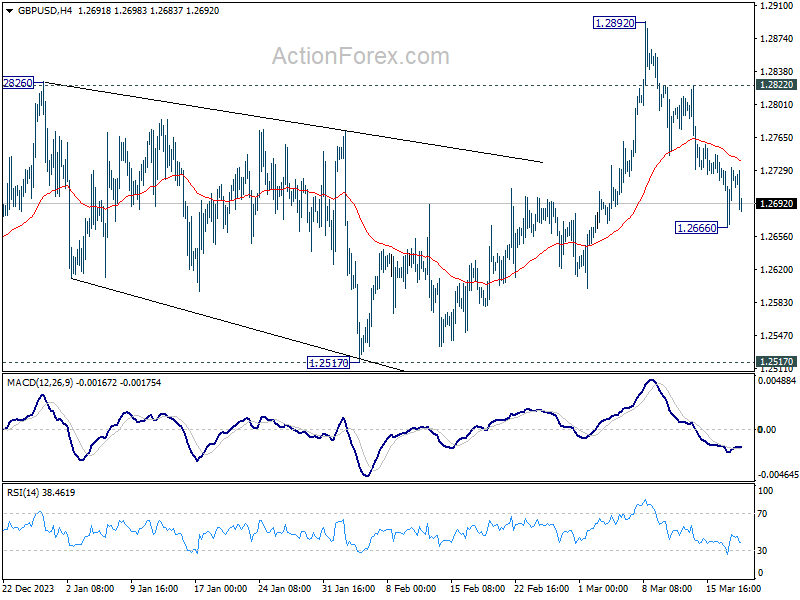
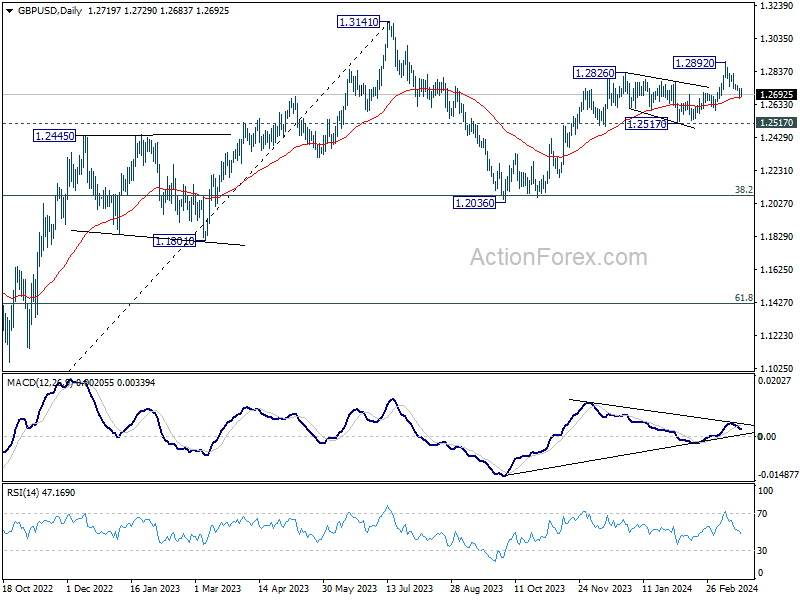
Intraday bias in GBP/USD remains neutral for consolidations above 1.2666 temporary low. Deeper decline is still in favor as long as 1.2822 resistance holds. On the downside, sustained break of 55 D EMA (now at 1.2677) will target 1.2517 structural support next.
In the bigger picture, price actions from 1.3141 medium term top are seen as a corrective pattern to up trend from 1.0351 (2022 low). Rise from 1.2036 is seen as the second leg, which is still in progress. But upside should be limited by 1.3141 to bring the third leg of the pattern. Meanwhile, break of 1.2517 support will argue that the third leg has already started for 38.2% retracement of 1.0351 (2022 low) to 1.3141 at 1.2075 again.
USD/JPY Mid-Day Outlook
Daily Pivots: (S1) 149.58; (P) 150.27; (R1) 151.55; More...
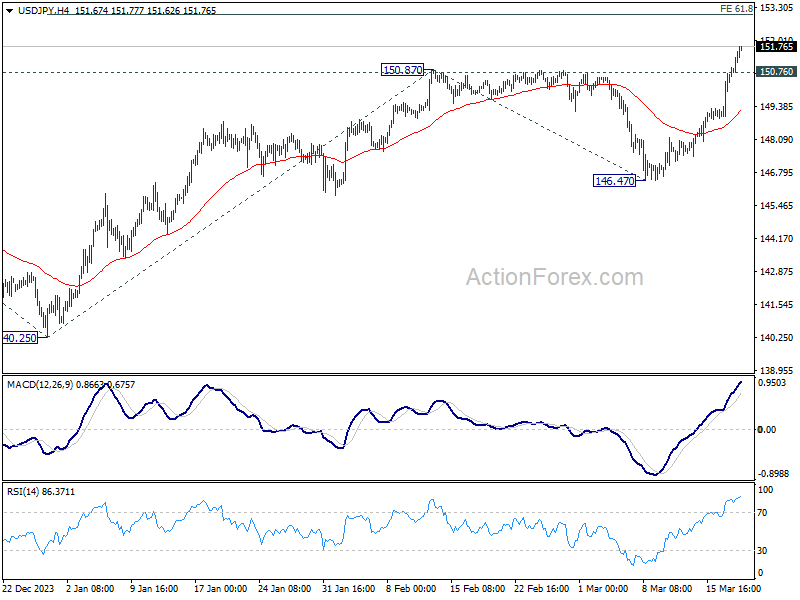
Intraday bias in USD/JPY remains on the upside at for 151.93 key resistance. Decisive break there will confirm long term up trend resumption. Next near term target will be 61.8% projection of 140.25 to 150.87 from 146.47 at 153.03. On the downside, below 150.76 minor support will turn intraday bias neutral and bring consolidations first. But outlook will stay bullish as long as 55 4H EMA (now at 149.18) holds.
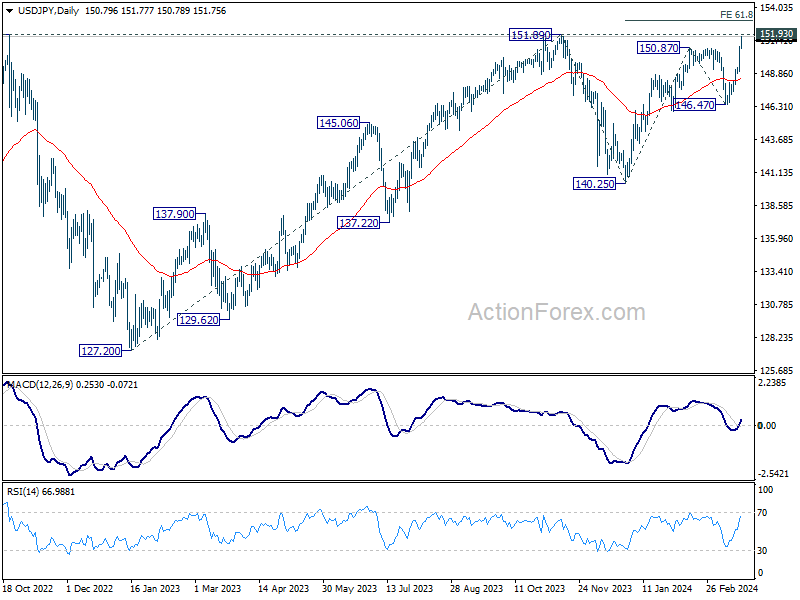
In the bigger picture, correction from 151.87 (2023) high could have completed at 140.25 already. Rise from 127.20 (2023 low), as part of the long term up trend, is probably ready to resume. Decisive break of 151.93 resistance (2022 high) will confirm this bullish case. Next medium term target will be 61.8% projection of 127.20 to 151.89 from 140.25 at 155.20. This will remain the favored case as long as 146.47 support holds, in case of another pullback.
USD/CHF Mid-Day Outlook
Daily Pivots: (S1) 0.8866; (P) 0.8882; (R1) 0.8898; More....
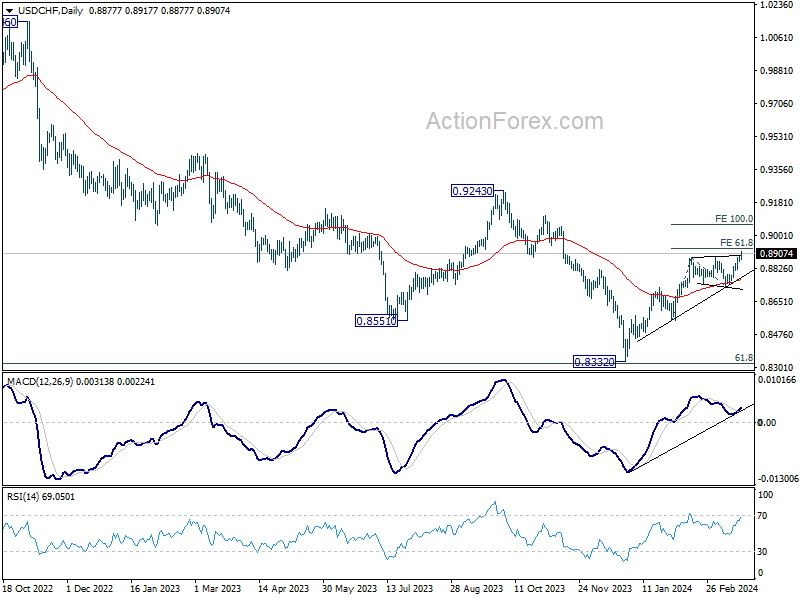
USD/CHF's rally from 0.8332 is still in progress and intraday bias stays on the upside for 61.8% projection of 0.8550 to 0.8884 from 0.8728 at 0.8934. Firm break there will target 100% projection at 0.9062 next. On the downside, break of 0.cminor support will turn intraday bias neutral and bring consolidations first, before staging another rally.
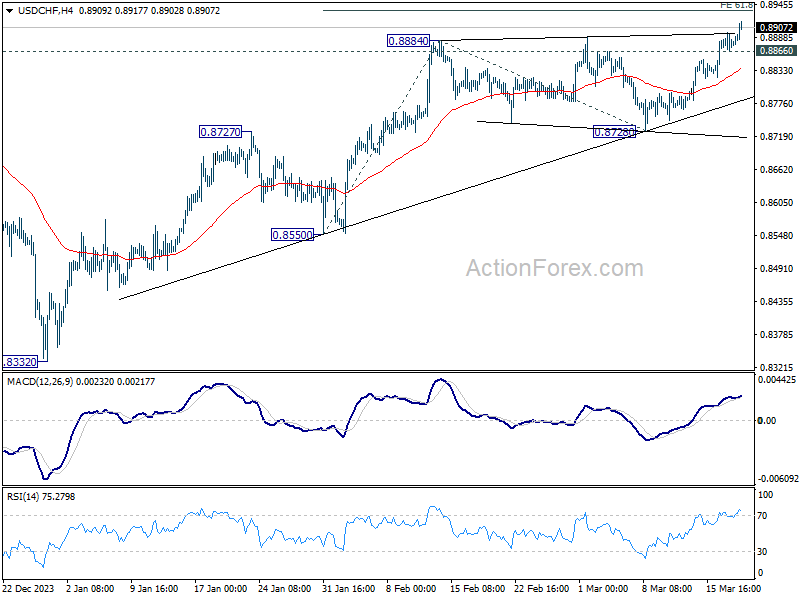
In the bigger picture, price actions from 0.8332 medium term bottom as seen as developing into a corrective pattern to the down trend from 1.0146 (2022 high). Further rise would be seen as long as 0.8555 support holds. But upside should be limited by 0.9243 resistance, at least on first attempt.
Dollar Holds Strength Ahead of Fed Dot Plot Update
Dollar stands firm as the day's strongest currency, with the financial markets on edge for the Fed's impending announcement. While interest rate is widely anticipated to hold steady at 5.25-5.50%, the spotlight is on the potential adjustments to Fed's dot plot. December's projections hinted at three rate cuts for the year, yet the consensus was narrowly divided—11 members forecasting three or more cuts, against 8 envisaging two or fewer. A pivotal shift of just two dots could recalibrate expectations to merely two rate cuts, a scenario that could bolster Dollar, at least in the short term.
In the broader market context, Australian and Canadian Dollars trail behind Dollar by some distance. Yen languishes as the day's weakest currency, followed closely by Kiwi. European majors, with Euro slightly ahead, occupy the middle ground, even as ECB President Christine Lagarde reaffirms conditional guidance towards a June rate cut. Swiss Franc faces downward pressure, partly due to risks of a dovish surprise SNB tomorrow. Sterling's progress is tempered by CPI figure that fell short of expectations and the looming BoE decision, also due tomorrow.
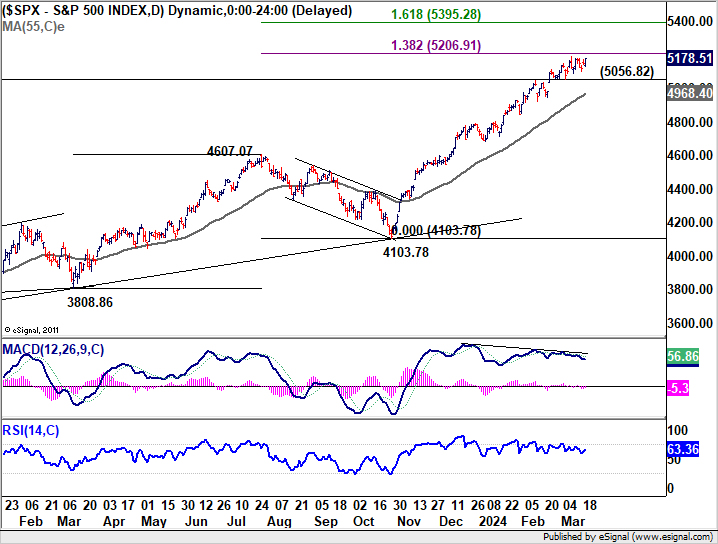
Technically, stock markets' reactions to FOMC are also important to monitor. Bearish divergence condition in D MACD in S&P 500 is a factor that could cap its rally at 138.2% projection of 3808.86 to 4607.07 from 4103.78 at 5206.91. Break of 5056.82 support will confirm short term topping and bring deeper correction to 55 D EMA (now at 4968.40). Nevertheless, decisive break of 5206.91 would pave the way to 161.8% projection at 5395.28 before topping.
In Europe, at the time of writing, FTSE is down -0.18%. DAX is up 0.20%. CAC is down -0.64%. UK 10-year yield is down -0.0320 at 4.133. Germany 10-year yield is down -0.0228 at 2.433. Earlier in Asia, Japan was on holiday. Hong Kong HSI rose 0.08%. China Shanghai SSE rose 0.55%. Singapore Strait Times rose 0.12%.
ECB's Lagarde sets conditions for June rate cut
ECB President Christine Lagarde provided clarity in a speech on the conditions that would lead to a rate cut in June, highlighting reliance on "two important pieces of evidence" as pivotal to the central bank's confidence on dialing back monetary restrictions. .
Firstly, ECB anticipates receiving data on negotiated wage growth for Q1 by the end of May. Secondly, by June, ECB will have access to a new set of economic projections, enabling it to verify the validity of the inflation path forecasted in its March projection.
After the first move, Lagarde emphasized to "confirm on an ongoing basis" that incoming data aligns with its inflation outlook. This approach underscores a commitment to data-driven policy decisions, maintaining a "meeting-by-meeting" stance that eschews any pre-commitment to a fixed rate path.
Furthermore, Lagarde noted the enduring significance of ECB's policy framework in processing incoming data and determining the appropriate policy stance. However, she also mentioned that the relative importance of the three criteria guiding these decisions would require regular reassessment.
UK CPI slows to 3.4% in Feb, core down to 4.5%
UK CPI slowed from 4.0% yoy to 3.4% yoy in February, below expectation of 3.5% yoy. CPI core (excluding energy, food, alcohol and tobacco) slowed from 5.1% yoy to 4.5% yoy, below expectation of 4.6% yoy.
CPI goods annual rate slowed from 1.8% yoy to 1.1% yoy, while CPI services annual rate eased from 6.5% yoy to 6.1% yoy.
On a monthly basis, CPI rose 0.6% mom, below expectation of 0.7% mom.
New Zealand Westpac consumer confidence rises to 93.2 in Q1, yet pessimism lingers
New Zealand Westpac Consumer Confidence rose from 88.9 to 93.2 in Q1, marking its highest level in over two years. Despite this rise, the index continues to hover below the pivotal 100 mark, indicating prevailing sense of pessimism among New Zealanders regarding economic conditions. Present Conditions Index saw significant uplift from 77.1 to 85.1, while Expected Conditions Index advanced modestly from 96.7 to 98.6.
Westpac's analysis highlights that households are gradually feeling more optimistic about their financial situations, which has subsequently spurred an increase in "spending appetites". This positive shift in consumer sentiment is observed across all income brackets, with "middle-income households exhibiting" the most marked improvement.
USD/CHF Mid-Day Outlook
Daily Pivots: (S1) 0.8866; (P) 0.8882; (R1) 0.8898; More....
USD/CHF's rally from 0.8332 is still in progress and intraday bias stays on the upside for 61.8% projection of 0.8550 to 0.8884 from 0.8728 at 0.8934. Firm break there will target 100% projection at 0.9062 next. On the downside, break of 0.8866 minor support will turn intraday bias neutral and bring consolidations first, before staging another rally.
In the bigger picture, price actions from 0.8332 medium term bottom as seen as developing into a corrective pattern to the down trend from 1.0146 (2022 high). Further rise would be seen as long as 0.8555 support holds. But upside should be limited by 0.9243 resistance, at least on first attempt.
Economic Indicators Update
| GMT | Ccy | Events | Actual | Forecast | Previous | Revised |
|---|---|---|---|---|---|---|
| 20:00 | NZD | Westpac Consumer Survey Q1 | 93.2 | 88.9 | ||
| 21:45 | NZD | Current Account (NZD) Q4 | -7.84B | -7.80B | -11.47B | -10.97B |
| 07:00 | EUR | Germany PPI M/M Feb | -0.40% | -0.20% | 0.20% | |
| 07:00 | EUR | Germany PPI Y/Y Feb | -4.10% | -3.80% | -4.40% | |
| 07:00 | GBP | CPI M/M Feb | 0.60% | 0.70% | -0.60% | |
| 07:00 | GBP | CPI Y/Y Feb | 3.40% | 3.50% | 4.00% | |
| 07:00 | GBP | Core CPI Y/Y Feb | 4.50% | 4.60% | 5.10% | |
| 07:00 | GBP | RPI M/M Feb | 0.80% | 0.80% | -0.30% | |
| 07:00 | GBP | RPI Y/Y Feb | 4.50% | 4.50% | 4.90% | |
| 07:00 | GBP | PPI Input M/M Feb | -0.40% | 0.20% | -0.80% | -0.10% |
| 07:00 | GBP | PPI Input Y/Y Feb | -2.70% | -2.70% | -3.30% | -2.80% |
| 07:00 | GBP | PPI Output M/M Feb | 0.30% | 0.10% | -0.20% | 0.00% |
| 07:00 | GBP | PPI Output Y/Y Feb | 0.40% | -0.10% | -0.60% | -0.30% |
| 07:00 | GBP | PPI Core Output M/M Feb | 0.20% | 0.20% | 0.30% | |
| 07:00 | GBP | PPI Core Output Y/Y Feb | 0.30% | -0.40% | -0.30% | |
| 09:00 | EUR | Italy Industrial Output M/M Jan | -1.20% | 0.10% | 1.10% | |
| 14:30 | USD | Crude Oil Inventories | -0.9M | -1.5M | ||
| 15:00 | EUR | Eurozone Consumer Confidence Mar P | -15 | -16 | ||
| 17:30 | CAD | BoC Summary of Deliberations | ||||
| 18:00 | USD | Fed Interest Rate Decision | 5.50% | 5.50% | ||
| 18:30 | USD | FOMC Press Conference |
USD: FOMC Meeting Takes Centre Stage
Today's FOMC meeting is the highlight of the week, and Antje Praefcke, FX Analyst at Commerzbank, discusses the USD outlook ahead of the announcement. Praefcke believes there's low risk of the Dollar declining post-meeting due to unlikely dovish surprises, especially after strong inflation readings. Instead, the Fed may emphasize caution and confirm market expectations, limiting potential USD losses. The focus shifts to how much further the Dollar can strengthen, depending on how closely the Fed aligns with market expectations and Powell's stance on interest rate cuts during the press conference. Overall, while expectations are present, the extent of Dollar gains remains uncertain.
AUDUSD- H4 Timeframe
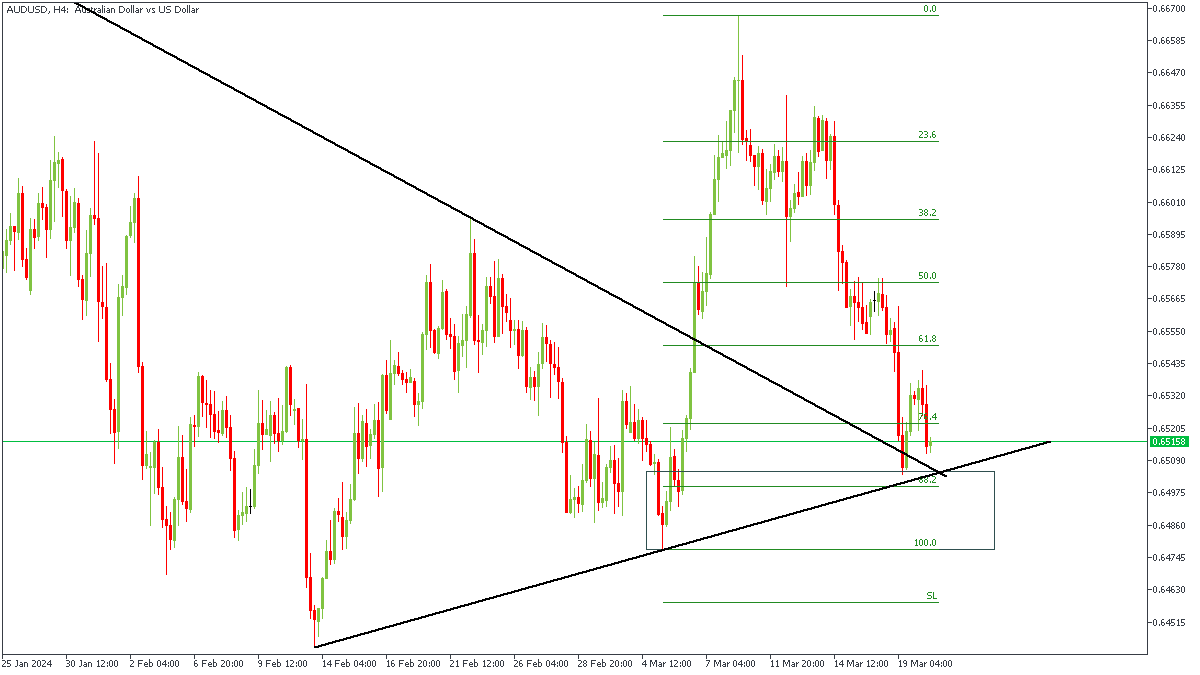
AUDUSD on the 4-hour chart recently broke above the previous high, as well as the previous trendline resistance. This break of structure thus presents us with a turncoat trendline, as well as a demand zone. Combining the powers of the double trendline support, Fibonacci retracement level, and the drop-base-rally demand zone, I vote in favour of the bulls in this case.
Analyst’s Expectations:
- Direction: Bullish
- Target: 0.66075
- Invalidation: 0.64764
EURUSD - H1 Timeframe
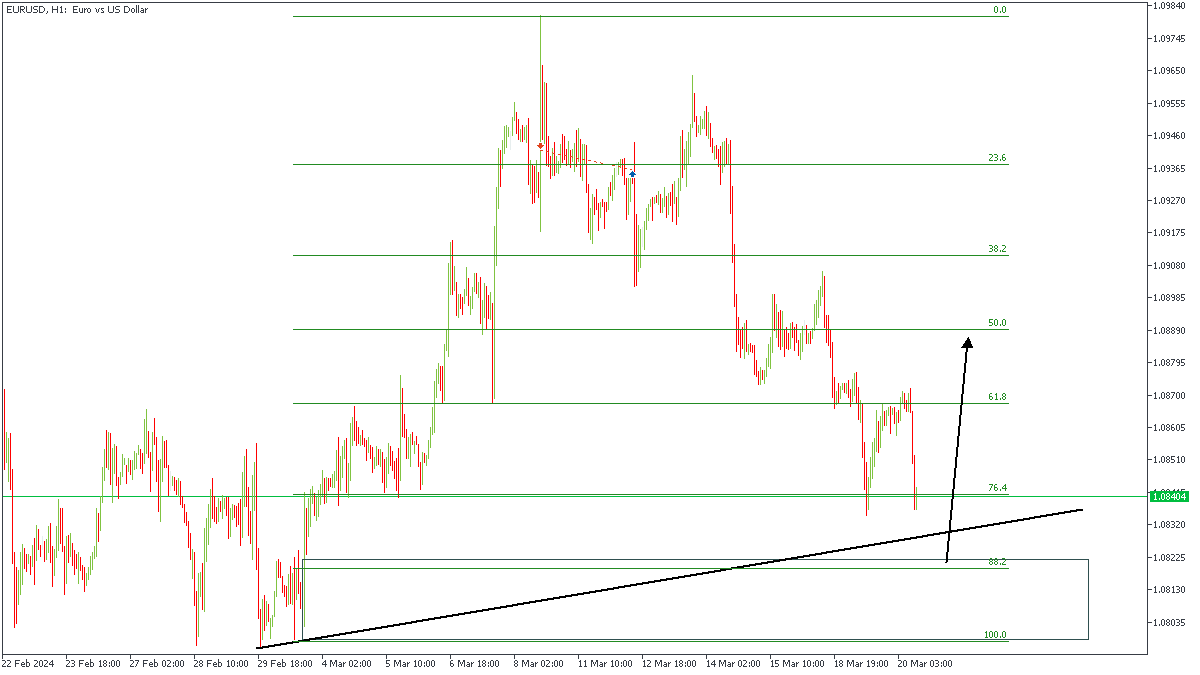
Similar to what was presented on the AUDUSD chart discussed above, I can see the clear break of structure in the case of the EURUSD chart too; as well as the trendline support and the Fibonacci retracement level. As before, my verdict in this case remains as bullish as earlier mentioned.
Analyst’s Expectations:
- Direction: Bullish
- Target: 1.08962
- Invalidation: 1.07964
GBPUSD - H1 Timeframe
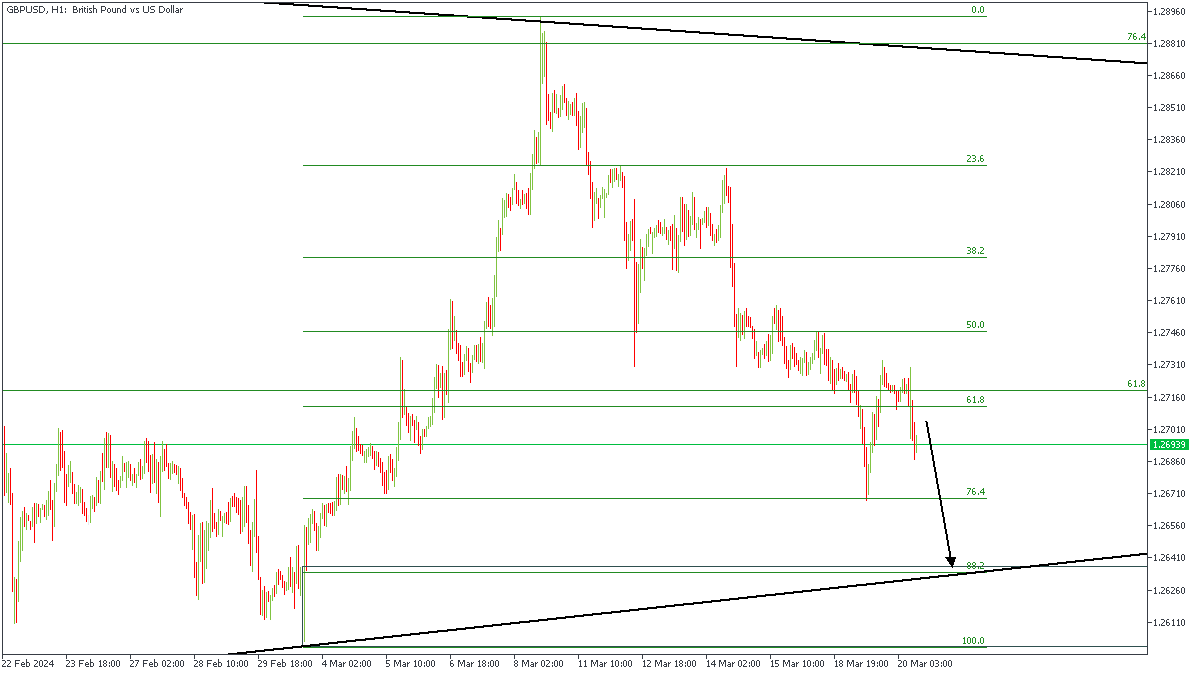
In the case of GBPUSD, we are presented with a clumsy price action movement. Here, price is a couple of pips away from the intended area of support, which only leads me to believe that price would do a nosedive into the demand zone, before we see the actual impact of the FOMC data on the markets.
Analyst’s Expectations:
- Direction: Bearish
- Target: 1.26387
- Invalidation: 1.27345
CONCLUSION
The trading of CFDs comes at a risk. Thus, to succeed, you have to manage risks properly. To avoid costly mistakes while you look to trade these opportunities, be sure to do your due diligence and manage your risk appropriately.
Gold Technical: A Potential Minor Corrective Pull-back in Play as FOMC Looms
- Gold (XAU/USD) has traded in a tight range of 2% in the past two weeks after it printed a fresh all-time high of US$2,195 on 8 March.
- The biggest risk event for today will be the latest Fed FOMC’s dot plot projection on the trajectory of its Fed funds rate; a reduction to two cuts from three cuts for 2024 cannot be ruled out.
- Technical analysis suggests potential short-term weakness in Gold (XAU/USD).
- Watch the key short-term resistance at US$2,180 on Gold (XAU/USD).
The price actions of Gold (XAU/USD) have staged the expected bullish breakout and rallied by +7.4% to print a new fresh all-time high of US$2,195 on 8 March.
In the past two weeks, the price actions of Gold (XAU/USD) have started to consolidate ahead of today’s major risk event, the US central bank, FOMC monetary policy decision outcome, latest “dot plot projections”, and Fed Chair Powell press conference.
The US monetary policy outcome will likely be a non-event as market participants have been “guided” by the latest slew of Fed Speak as well as a not-so-soft inflationary trend (February’s CPI and PCE data) in the US to price in a no-change to the Fed funds rate at 5.25%-5.50% for the 6th consecutive meeting as indicated by the CME FedWatch tool with a 99% probability of such an outcome.
Fed funds rate futures is still pricing a total of three cuts for 2024
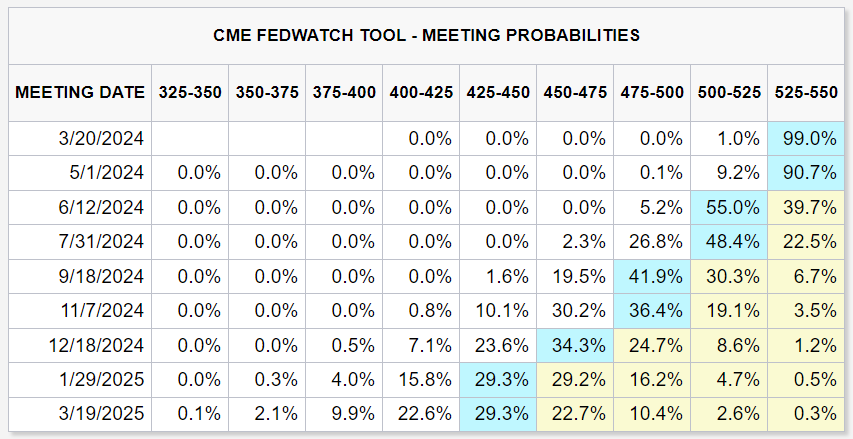
Fig 1: Fed FOMC meeting probabilities as of 20 Mar 2024 (Source: CME FedWatch Tool, click to enlarge chart)
The biggest risk will be a change to the dot-plot projection of the forecasted trajectory of Fed funds rate for 2024; in the previous dot-plot released during the December 2023 FOMC meeting, three cuts have been pencilled in which is now in line with market participants’ expectations as priced by the CME FedWatch Tool. It now reflects only three interest rate cuts by the Fed before 2024 ends, down from six cuts at the start of 2024.
If the latest Fed officials’ median projection on the trajectory of the Fed funds rate for 2024 indicates a reduction to two cuts from three (below market expectations) which in turn may trigger a further potential rebound in the US 10-year Treasury yield to surpass the 4.3% level.
This scenario is likely to be detrimental for Gold at least in the short-term because the opportunity costs for holding Gold increase as it is “a zero-yielding asset”.
A minor corrective pull-back may be in play for Gold
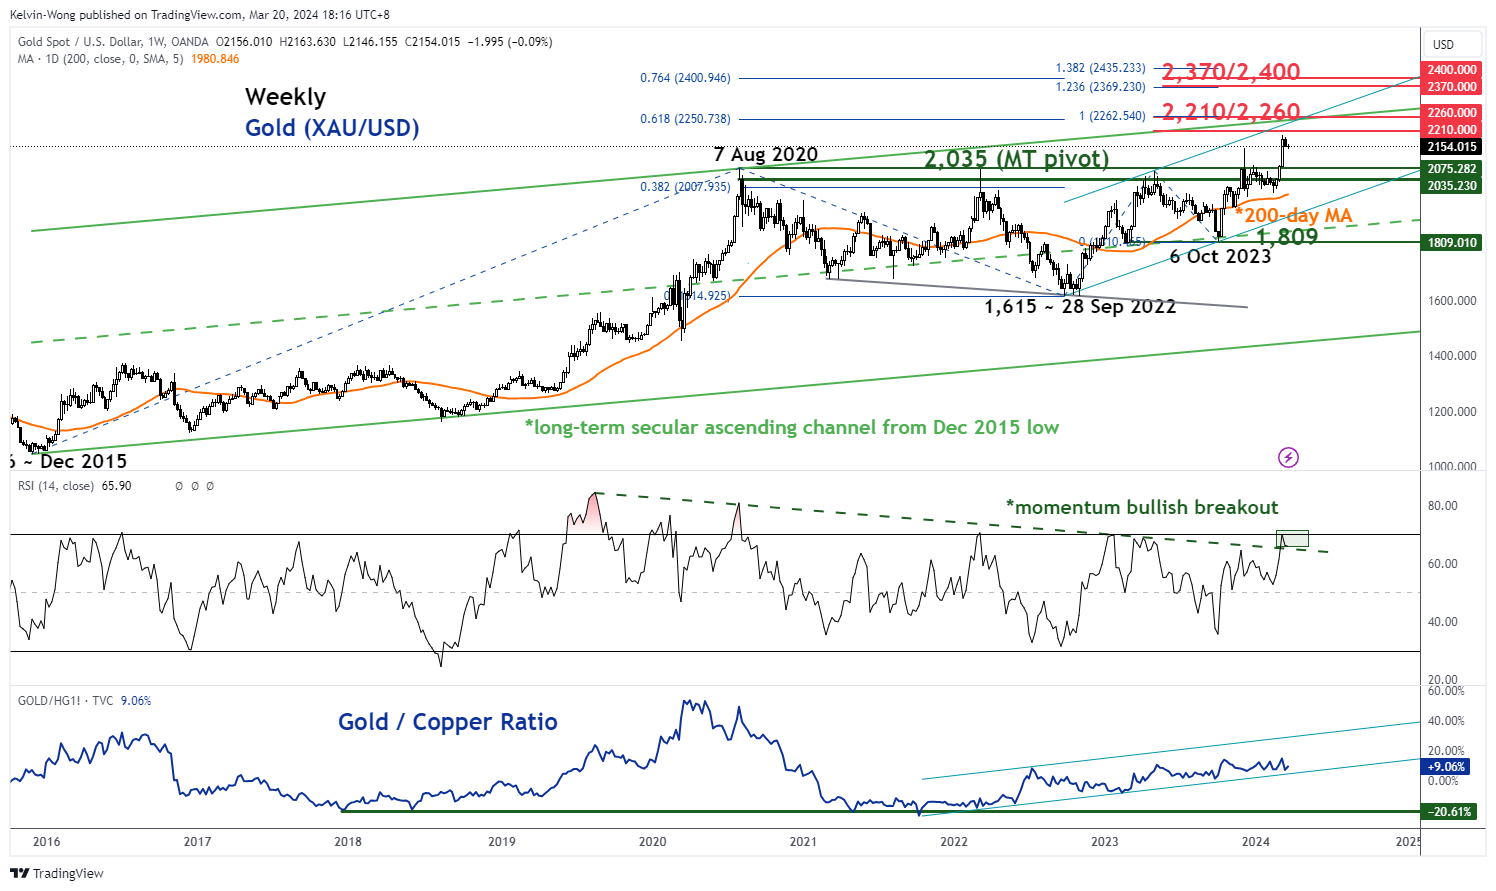
Fig 2: Gold (XAU/USD) major trend as of 20 Mar 2024 (Source: TradingView, click to enlarge chart)
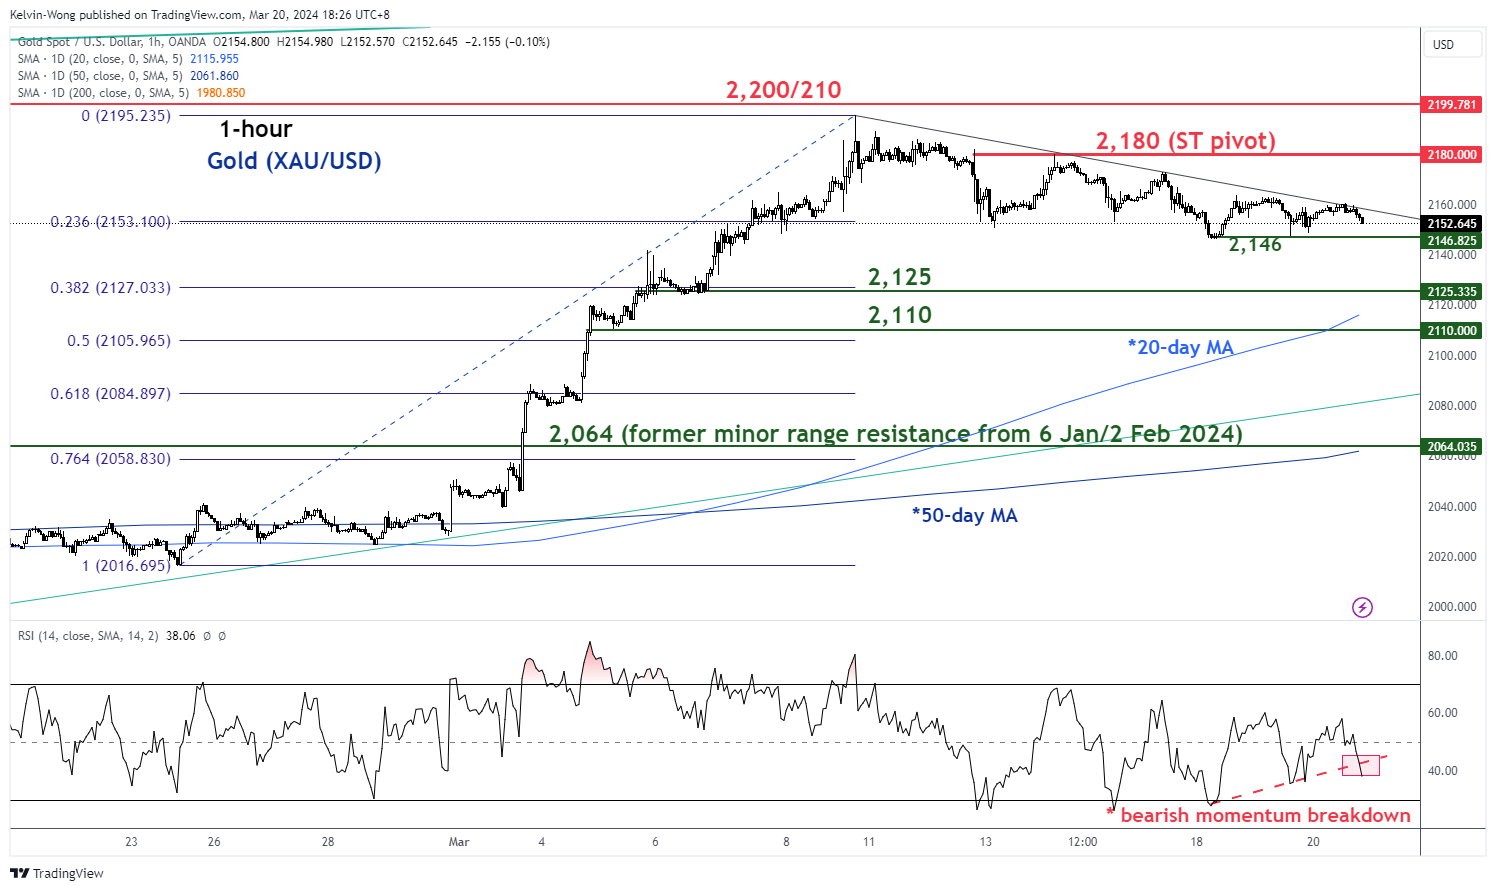
Fig 3: Gold (XAU/USD) short-term trend as of 20 Mar 2024 (Source: TradingView, click to enlarge chart)
Technically speaking, the price actions of Gold (XAU/USD) are still evolving within a major uptrend phase in place since the 28 September 2022 low of US$1,615 supported by an upward trajectory of the Gold/Copper ratio (see Fig 2).
In the lens of technical analysis, price actions of highly liquid tradable instruments do not move vertically up or down but oscillate within a trending phase.
In the short term, Gold (XAU/USD) has started to turn “soft” after a rapid rally from 23 February to 8 March, and price actions have been capped by a minor descending trendline in the past week.
In addition, the hourly RSI momentum indicator has just staged a bearish momentum breakdown from its parallel ascending support at the 43 level which translates to further potential weakness in price action (see Fig 3).
Watch the US$2,180 short-term pivotal resistance for Gold (XAU/USD), a break below the US$2,146 near-term support may see further weakness to expose the next intermediate supports at US$2,125 and US$2,110 (also the upward-sloping 20-day moving average).
On the flip side, a clearance above US$2,180 invalidates the corrective pull-back scenario to kickstart another bullish impulsive sequence for the next intermediate resistance to come in at US$2,200/210 in the first step.
UK Inflation Sets Up a Marathon for BoE
UK inflation has come in slightly weaker than expected, but this does not significantly bring the rate cut date any nearer.
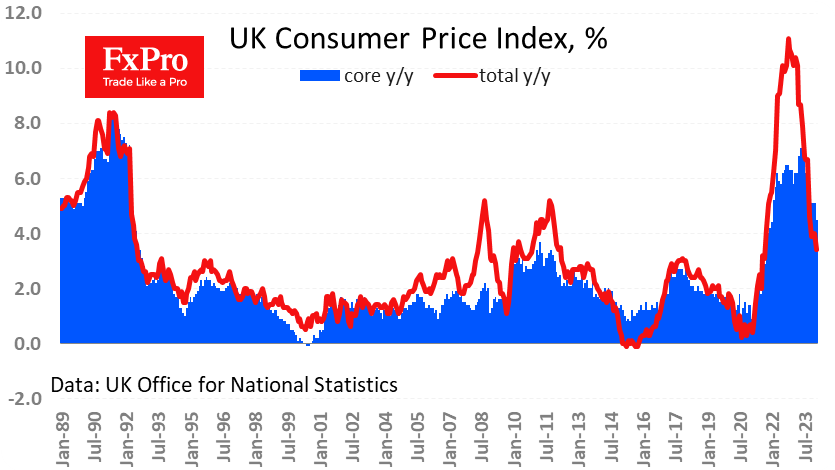
The CPI rose by 0.6% in February after a similar fall in January. Annual inflation slowed to 3.4% from 4.0%, vs expected 3.5%. Core CPI slowed its rise to 4.5% y/y in February after three months of stabilising at 5.1%.
Rising prices for services are driving core inflation. This is a very sluggish component, making it a marathon rather than a sprint for the Bank of England.
Input Producer prices fell 0.4% in February and are down 2.7% y/y. The index has retreated to May 2022 levels thanks to lower prices for energy, metals, and a range of agricultural products.
Output PPI have not shown much momentum over the past three quarters. Rising wage costs have offset the fall in input prices. The generally strong labour market is allowing manufacturers to regain profitability.
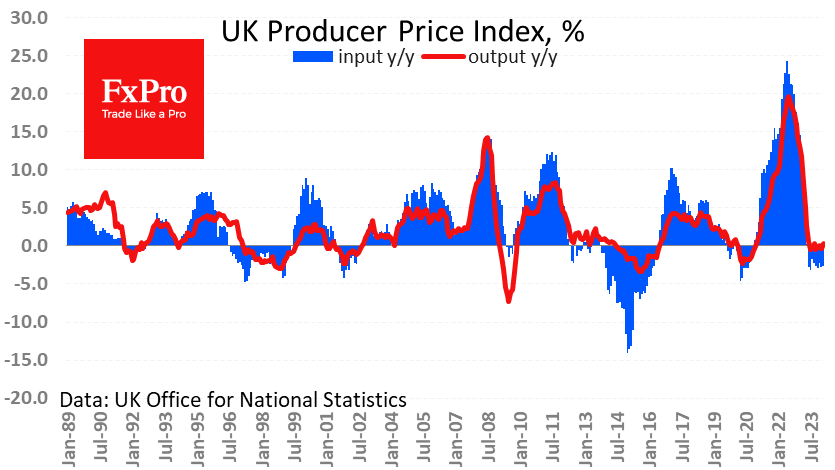
This is not bad news for the economy as it indicates business confidence, which is often self-sustaining.
Sterling rose by 0.1% against the general downtrend following the inflation release but very quickly returned to the general downtrend against the dollar.
Inflation is one of the variables that influences central bank decisions. Now, the markets are in a wait-and-see mode for the outcome of the FOMC meeting on Wednesday night and the Bank of England meeting on Thursday afternoon.
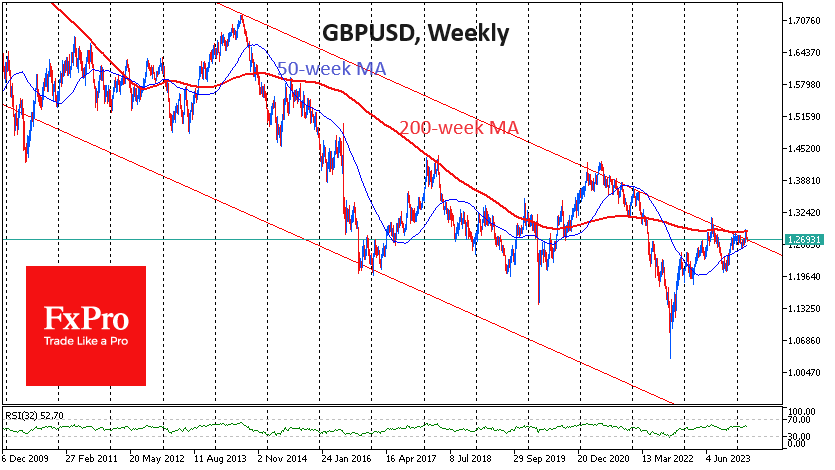
GBPUSD has lost ground over the past two weeks, failing to make gains after a long period of consolidation. Cable has now erased the recent gains and is back near 1.27.
In the weekly timeframe, GBPUSD is near the upper boundary of a descending corridor that has been in place since 2008. A break above would be a significant event, but the basic scenario in such cases is a reversal to the downside with a hold within the range. This week’s events have enough potential to put an end to this consolidation.
GBP/USD Dips as UK Inflation Lower Than Expected
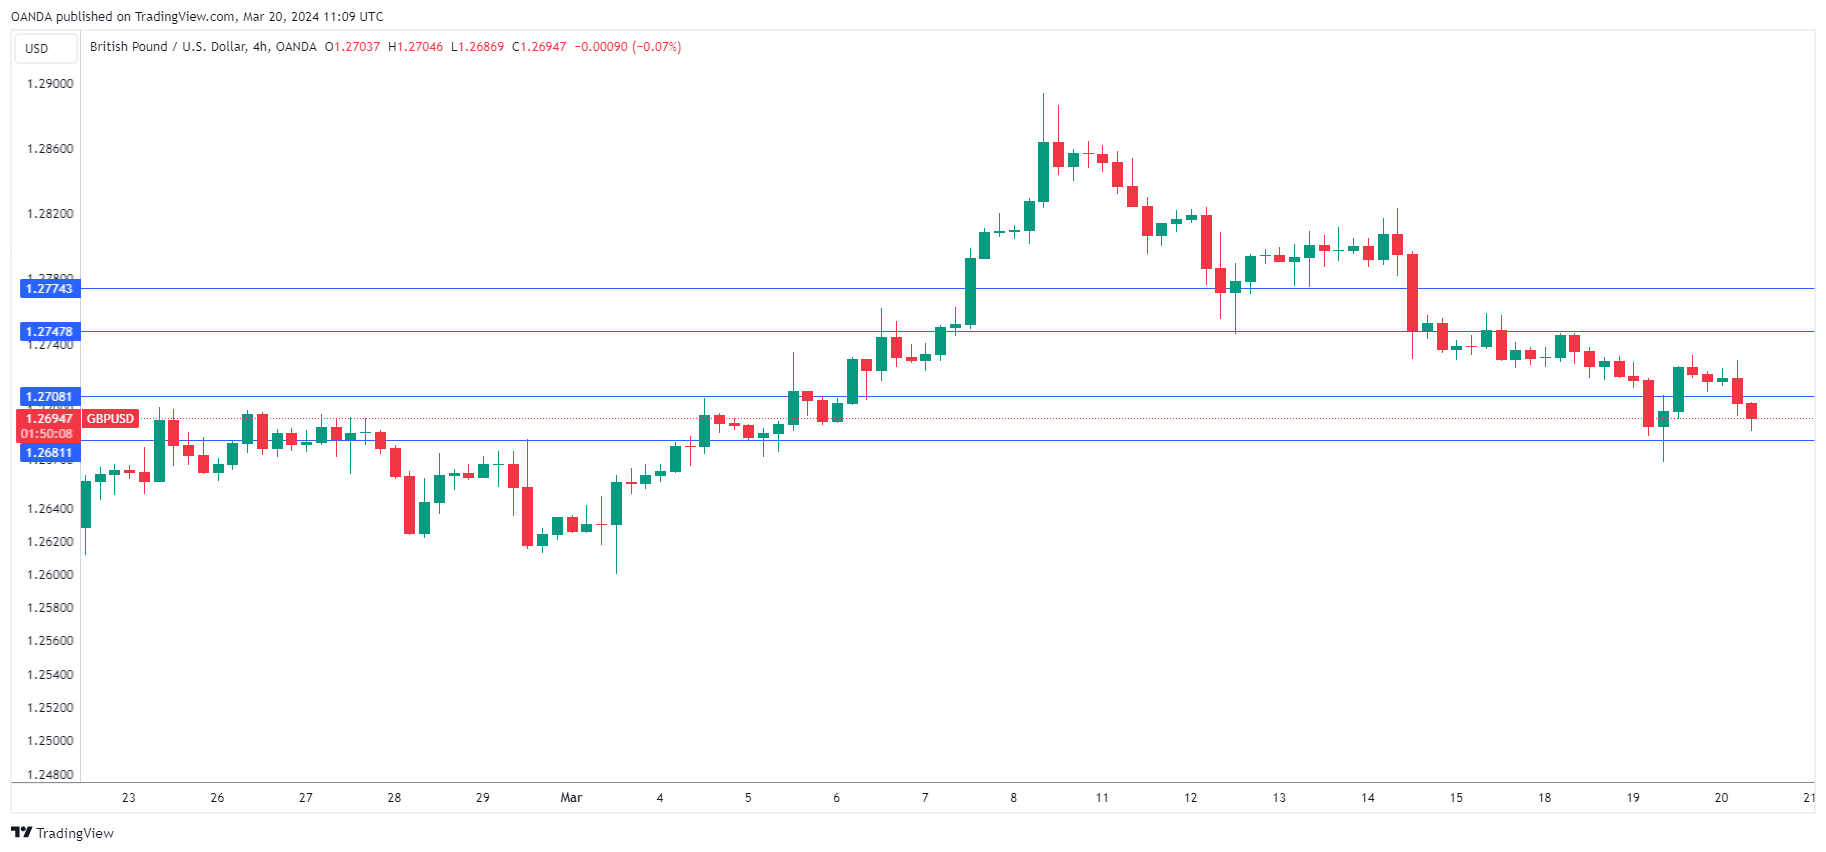
The British pound has extended its losses on Wednesday. In the European session, GBP/USD is trading at 1.2695, down 0.21%. The pound has been on a slide and is down about 1.2% since March 13.
UK inflation falls by 3.4%
Households in the UK haven’t had much to smile about when it comes to the economy, but there was some good news today as UK inflation dropped to 3.4% y/y in February, down from 4% in January and just below the market estimate of 3.5%. This was the lowest rate since September 2021.
The driver of the drop in CPI was a slowdown in food inflation, while housing and fuel prices showed less of a decline in February than a month earlier, putting upward pressure on inflation. Monthly, CPI rose 0.6%, up from -0.6% in January but below the market estimate of 0.7%.
Core CPI eased to 4.5% y/y, compared to 5.1% in January and below the market estimate of 4.6%. Monthly, core CPI rose 0.6%, up from -0.9% but below the market estimate of 0.7%.
The Bank of England will no doubt be encouraged by the inflation data, which showed a significant drop in February and was lower than expected. The BoE meets on Thursday and is widely expected to maintain the cash rate at 5.25% for a sixth straight time.
The Bank has not yet bought into rate cuts and we can expect a cautious message from Governor Bailey acknowledging that inflation is on a downtrend but that the battle ain’t over yet. There is a concern among BoE policy makers that lowering rates too soon could lead to inflation rebounding, which would force the central bank to zigzag and raise rates.
GBP/USD Technical
- GBP/USD is testing support at 12708. Below, there is support at 1.2681
- There is resistance at 1.2747 and 1.2774
Dollar Index: Bulls Hold Grip on Expectations that Fed Will Keep Hawkish Stance
The dollar index continues to trend higher and hit two-week high on Wednesday, benefiting from the hawkish outlook from the Fed, as the central bank will deliver its monetary policy decision later today.
The central bank is not expected to make any changes to the policy, with high interest rates to be kept for extended period and further contribute to positive environment for the greenback.
Recent solid economic data from the US signal that the economy is resilient and can stand higher borrowing cost for some time, while inflation remains sticky and likely to produce increased headwinds to the pace of expected rate cuts this year, which will boost positive outlook for the dollar from the fundamental side.
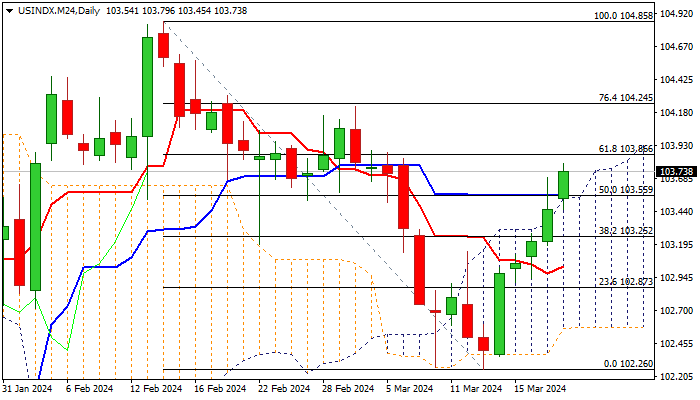
Technical picture on daily chart is also improving, as the recovery leg from 102.26 (Mar 13 low) extends into the fifth straight day and generated bullish signal from Tuesday’s close above the top of thickening daily Ichimoku cloud.
Today’s fresh extension higher broke above 200DMA (103.47) and 50% retracement of 104.85/102.26 (103.55) with sustained break above these levels to further strengthen near-term structure and open way for probes above next pivotal barrier at 103.86 (Fibo 61.8%).
However, caution is still required as 14-d momentum stays in the negative territory and stochastic is overbought, but near-term bulls are expected to hold grip while the price stays above daily cloud top/200DMA.
Res: 103.86; 104.25; 104.85; 105.47.
Sup: 103.47; 103.38; 103.25; 102.96.