Sample Category Title
ECB’s Lagarde sets conditions for June rate cut
ECB President Christine Lagarde provided clarity in a speech on the conditions that would lead to a rate cut in June, highlighting reliance on "two important pieces of evidence" as pivotal to the central bank's confidence on dialing back monetary restrictions. .
Firstly, ECB anticipates receiving data on negotiated wage growth for Q1 by the end of May. Secondly, by June, ECB will have access to a new set of economic projections, enabling it to verify the validity of the inflation path forecasted in its March projection.
After the first move, Lagarde emphasized to "confirm on an ongoing basis" that incoming data aligns with its inflation outlook. This approach underscores a commitment to data-driven policy decisions, maintaining a "meeting-by-meeting" stance that eschews any pre-commitment to a fixed rate path.
Furthermore, Lagarde noted the enduring significance of ECB's policy framework in processing incoming data and determining the appropriate policy stance. However, she also mentioned that the relative importance of the three criteria guiding these decisions would require regular reassessment.
EURGBP Struggles to Surpass 23.6% Fibo
- EURGBP remains in sideways channel
- Technical oscillators lose steam
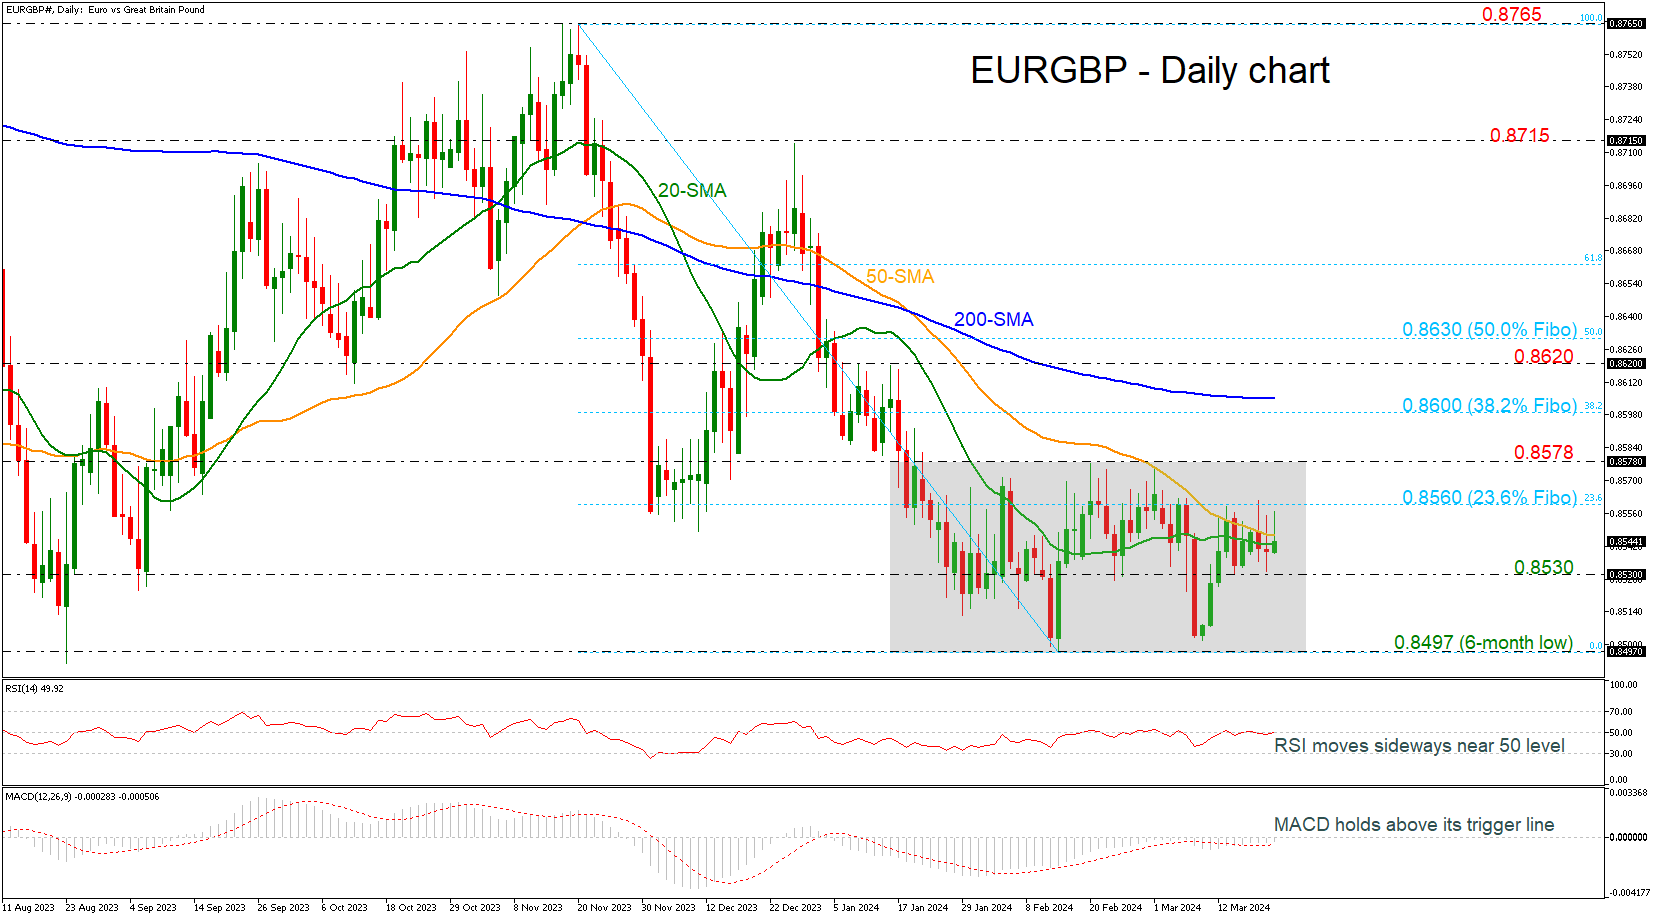
EURGBP is finding another strong obstacle to surpass within the medium-term trading range of 0.8497 to 0.8578. Specifically, the 23.6% Fibonacci retracement level of the down leg from 0.8765 to 0.8497 at 0.8560.
The pair is also flirting with the 20- and the 50-day simple moving averages (SMAs) and the technical oscillators are showing some weak signals. The RSI is flattening near the neutral threshold of 50, while the MACD is standing above its trigger line in the negative territory.
If the market slips beneath the mid-level of the range of 0.8530 then it may retest the lower boundary of 0.8497. Steeper decreases could open the way towards the 0.8400 handle, registered back in August, changing the outlook to a more bearish one.
On the flip side, a jump above the 23.6% Fibonacci of 0.8560 could lead the pair until the 0.8578 barricade. A climb towards the 38.2% Fibonacci of 0.8600 and the 200-day SMA at 0.8605 may switch the bias to bullish, meeting the 0.8620 resistance.
In a nutshell, EURGBP has been trading without clear direction since January 17. A closing session above or below the consolidation area could show the next path.
Bitcoin and Ethereum Seek Support
Market picture
The crypto market correction continues to deepen, although there have been some signs of stabilisation since the start of the day on Wednesday. The decline has continued for a whole week, reducing the market cap by almost 15%. The total cap was down to $2.28 trillion on Wednesday morning, rising to $2.35 trillion (-2.5% in 24 hours) by the start of active trading in Europe.
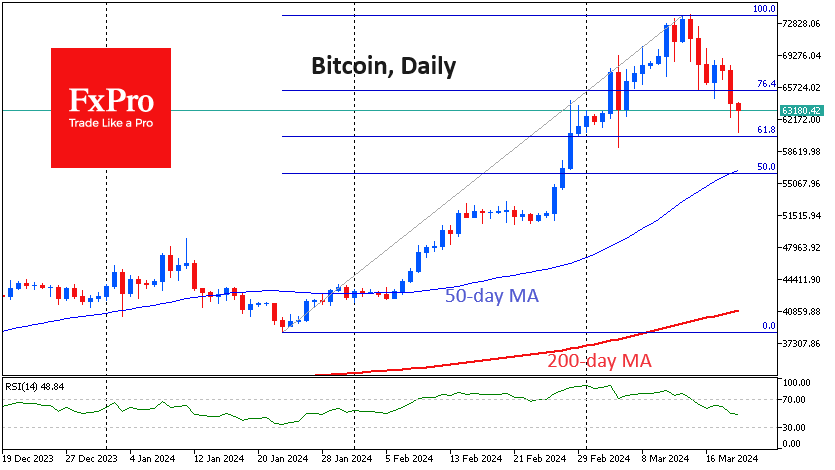
Bitcoin is down 13.6% in seven days, trading at $62.8K and dipping below $61.0K in the early session. Technically, it remains in a downtrend, with a series of lower lows and lower highs. We will pay attention to the first cryptocurrency’s dynamics at the following support levels: $60.3K (correction to 61.8% of the last rally), $56K area (50-day average and 50% level) and $51.5K (consolidation area in February).
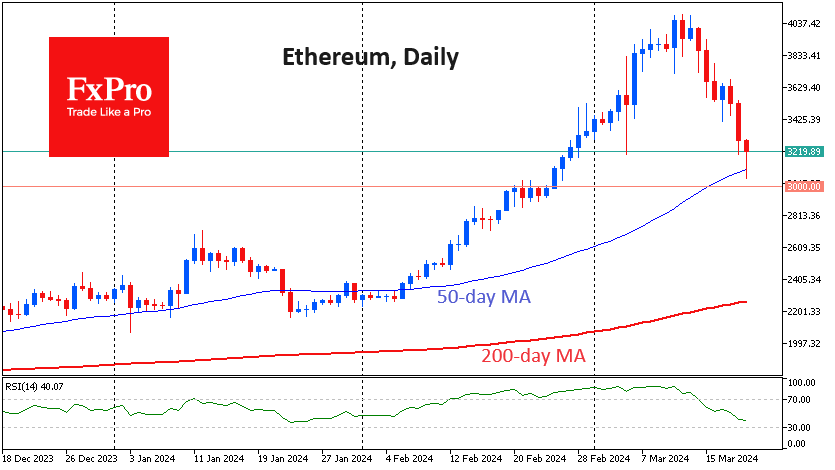
Ethereum approached $3050, but a temporary break below the 50-day moving average spurred buyers. Some traders are seeing the situation as an opportunity to join the global bull market after profit-taking. However, crypto traders should now keep a close eye on the appetite for risk in the financial markets. Today, it will be heavily influenced by the FOMC and other major central bank meetings later in the week.
News background
Against the backdrop of the first cryptocurrency to rally above $70K, holders have turned to sellers to lock in profits, according to Glassnode. Bitcoin’s current correction offers an opportunity to “buy on the lows” ahead of the April halving, according to Bernstein.
Michael van de Poppe, founder of MN Trading, called the correction “sharp”. “But remember, you don’t want to buy altcoins when they’re going up. You want to buy them when they’re down 25-60 per cent. That’s when the real profits come in,” he added.
MicroStrategy bought 9,245 BTCs between 11 and 18 March at an average price of $67,382, according to founder Michael Saylor. MicroStrategy’s total cryptocurrency reserves reached 214,246 BTC, which is more than 1% of the total digital gold issued.
CryptoQuant founder and CEO Ki Yoon Ju expressed concern about the boom in the meme-token segment. In his opinion, such projects only harm the crypto industry. Yoon Ju compared the situation to the ICO boom in 2018, which resulted in most investors simply losing their invested funds.
Fidelity Investments has amended its proposal to launch a spot Ethereum ETF to include staking in its provision.
Total client assets on Binance have surpassed $100 billion, according to the exchange. According to DeFi Llama, $109 billion is held on the platform, with Bitcoin (32%), USDT (21%) and BNB (15%) making up the majority of assets.
Correction in Crypto Markets: BTC/USD Rate Drops to $60,000
On March 18, we wrote that bears became more active near the $70,000 level.
As the BTC/USD chart shows, today the price of Bitcoin is already close to the psychological level of USD 60k, while the price of Ethereum is close to USD 3,000.
According to MarketWatch, experts consider the decline to be a correction that is “long overdue” as part of an upward trend. According to Fundstrat, Monday saw net outflows from BTC ETFs for the first time since March 1, amounting to about $154.3 million.
What's next?
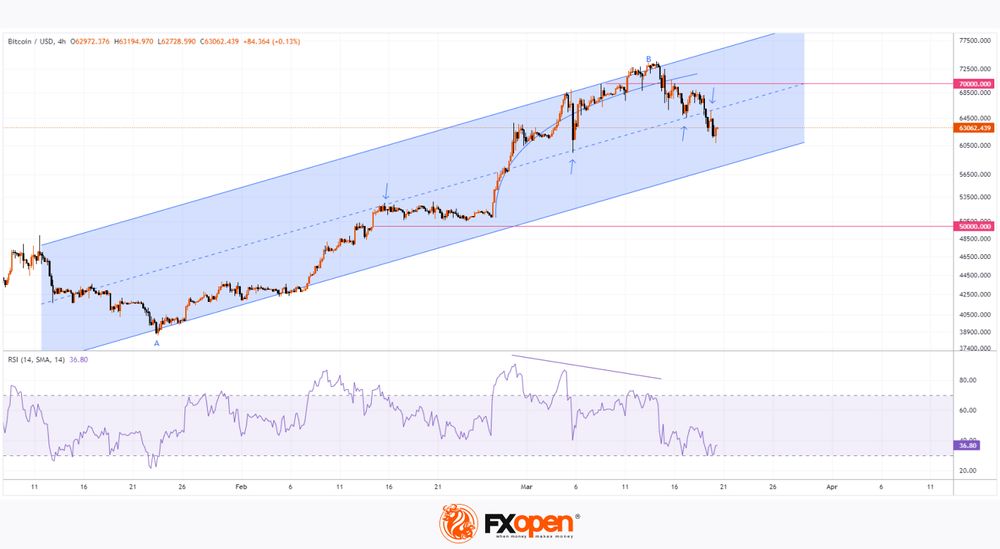
From a technical analysis point of view, the price of Bitcoin, given an increase of approximately 90% from point A (around USD 38.8k) to point B (around USD 73.4k), a normal correction of 50% indicates the prospect of a decline to the area of USD 56.1k.
Having constructed a channel (shown in blue), taking into account extrema A and B, as well as turning points (indicated by arrows), it is permissible to assume that the price of Bitcoin will drop to the lower boundary of the channel in the area of $57k, where it currently lies.
Thus, the USD 56-57k area can be seen as a target for the bears, who have seized the initiative after the upward momentum has exhausted itself (judging by the divergence on the RSI indicator).
In the event of a deeper correction, a test of the psychological mark of USD 50k per Bitcoin cannot be ruled out.
However, despite the significant decline (about 15% over the last 6 days), the Bitcoin market can be considered bullish:
→ the blue ascending channel has not yet been broken;
→ the approaching halving is seen as a growth driver;
→ according to the new Bitcoin price forecast from Standard Chartered, the target has been increased to USD 150k by the end of 2024 and USD 250k by the end of 2025.
FXOpen offers the world's most popular cryptocurrency CFDs*, including Bitcoin and Ethereum. Floating spreads, 1:2 leverage — at your service. Open your trading account now or learn more about crypto CFD trading with FXOpen.
*At FXOpen UK and FXOpen AU, Cryptocurrency CFDs are only available for trading by those clients categorised as Professional clients under FCA Rules and Professional clients under ASIC Rules respectively. They are not available for trading by Retail clients.
This article represents the opinion of the Companies operating under the FXOpen brand only. It is not to be construed as an offer, solicitation, or recommendation with respect to products and services provided by the Companies operating under the FXOpen brand, nor is it to be considered financial advice.
NZDUSD in the Red Again Ahead of Fed
- NZD remains on the back foot against USD
- NZDUSD has finally broken below its one-year-long rectangle
- Momentum indicators acknowledge the current bearish move
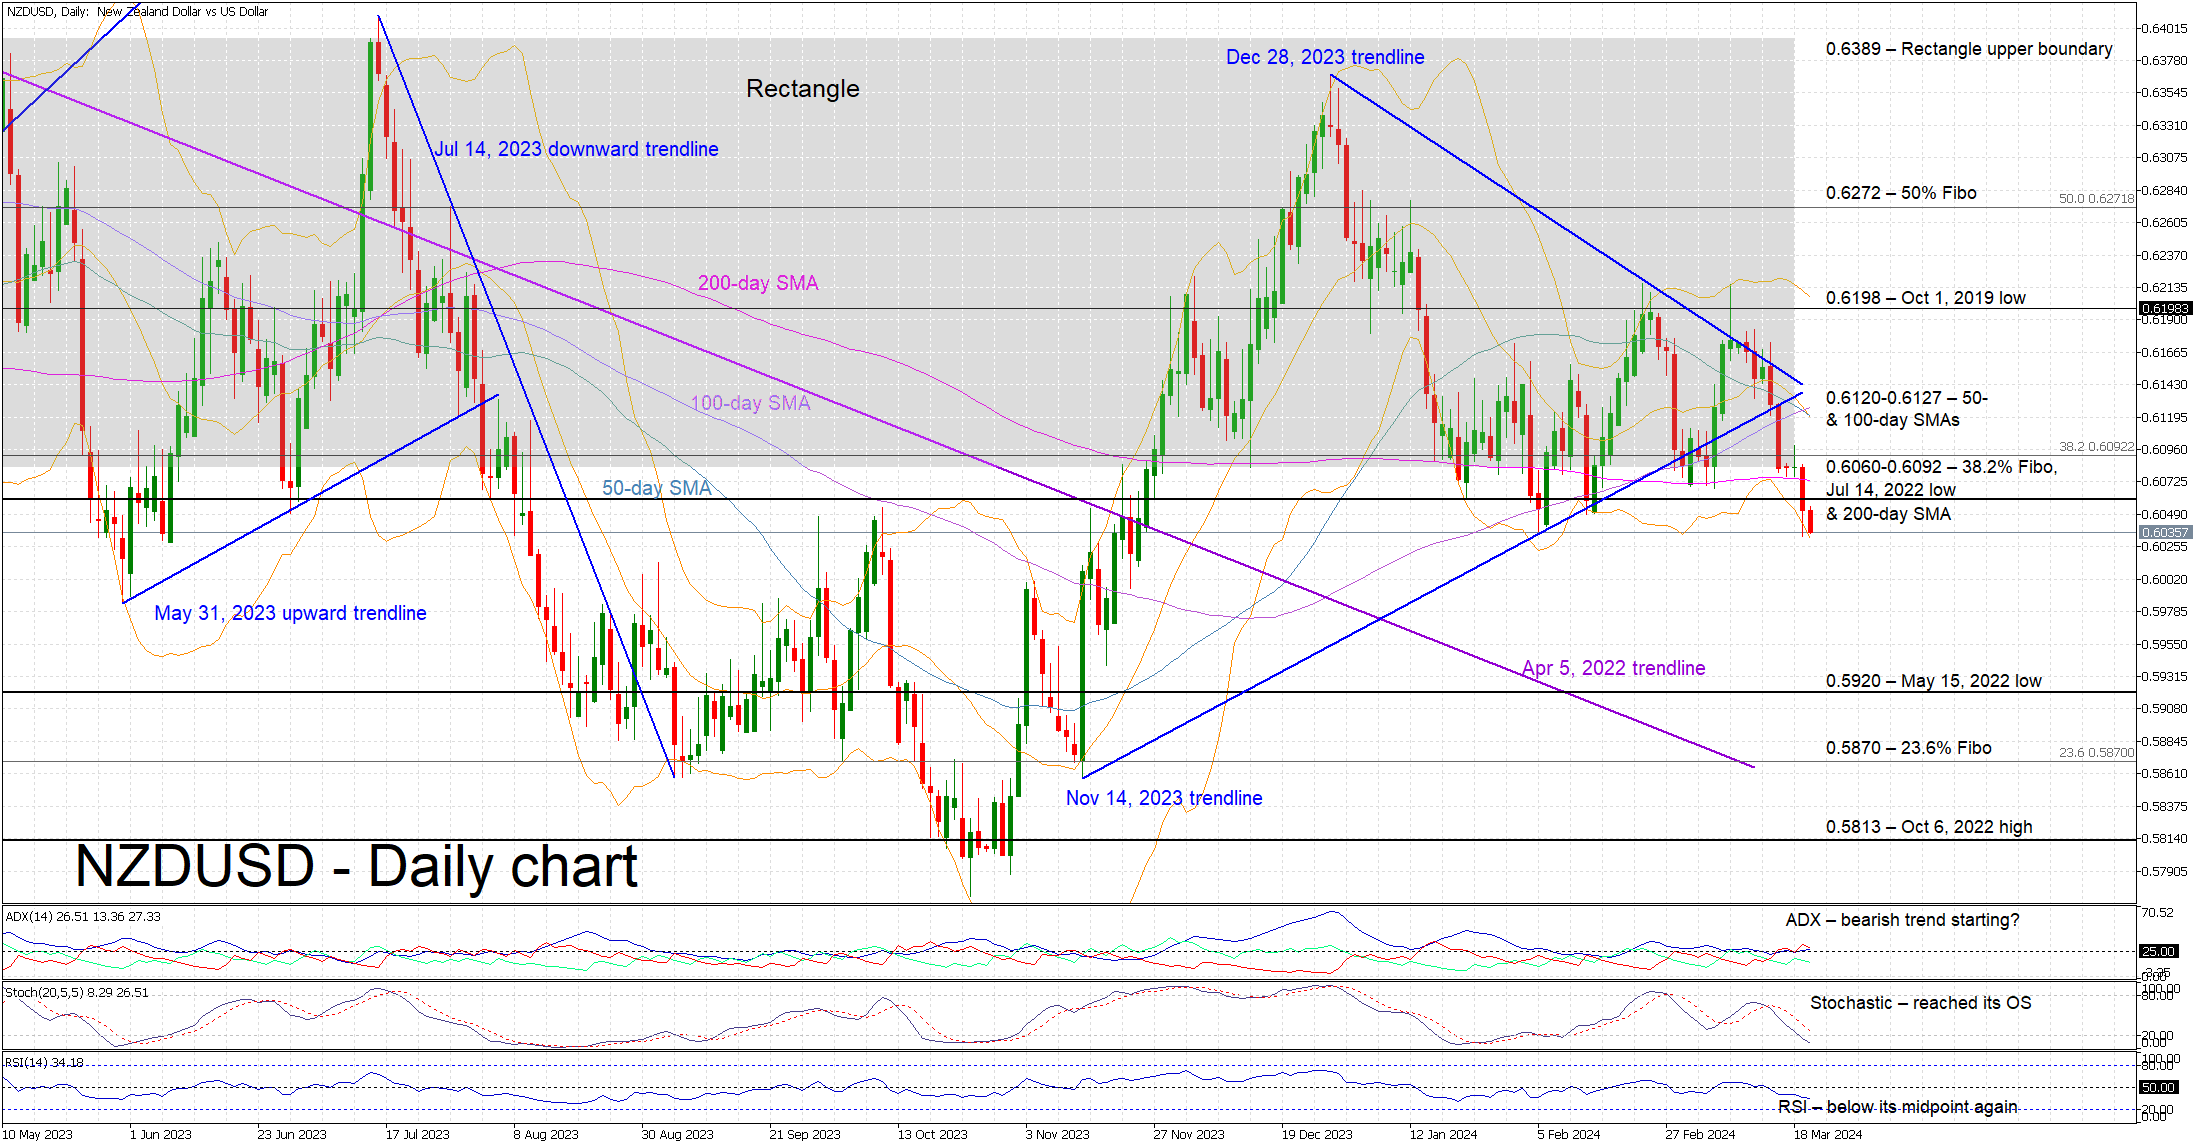
NZDUSD is recording another red candle today and it is trading below the lower boundary of the one-year-old rectangle and the busy 0.6060-0.6092 area. It has actually registered a new 2024 low with the market now turning its focus to the critical Fed meeting, which could result in increased volatility in NZDUSD as made evident by the convergence of the 50- and 100-day simple moving averages (SMAs).
In the meantime, the momentum indicators are mostly on the bears’ side. More specifically, the RSI has dropped below its 50-midpoint and it is thus pointing to increasing bearish pressure. Similarly, the Average Directional Movement Index (ADX) is tentatively hovering above its 25-threshold and thus signalling the presence of a weak bearish trend in NZDUSD. More importantly, the stochastic oscillator has reached its oversold territory (OS) but maintains a good gap from its moving average.
If the bulls decide to retake the market reins, they could try to lead NZDUSD higher towards the 0.6060-0.6092 range, which is populated by the 38.2% Fibonacci retracement, the July 14, 2022 low and the 200-day simple moving average (SMA), and then back inside the aforementioned rectangle. Even higher, the 0.6120-0.6127 range defined by the 50- and 100-day SMAs appears to be a key resistance area.
On the flip side, the bears appear ready to take advantage of the current momentum and push NZDUSD lower. The 0.6000 level is probably the first key support level with the May 15, 2022 low at 0.5920 possibly being the next plausible target.
To sum up, NZDUSD bears have recorded a new 2024 low but market events could offer them the opportunity for an even stronger correction towards the November 2023 levels.
USDJPY Advances in BoJ Aftermath
- USDJPY storms to fresh 2024 high after BoJ’s rate hike
- The pair is within breathing distance from 33-year peak
- Momentum indicators point to overbought conditions
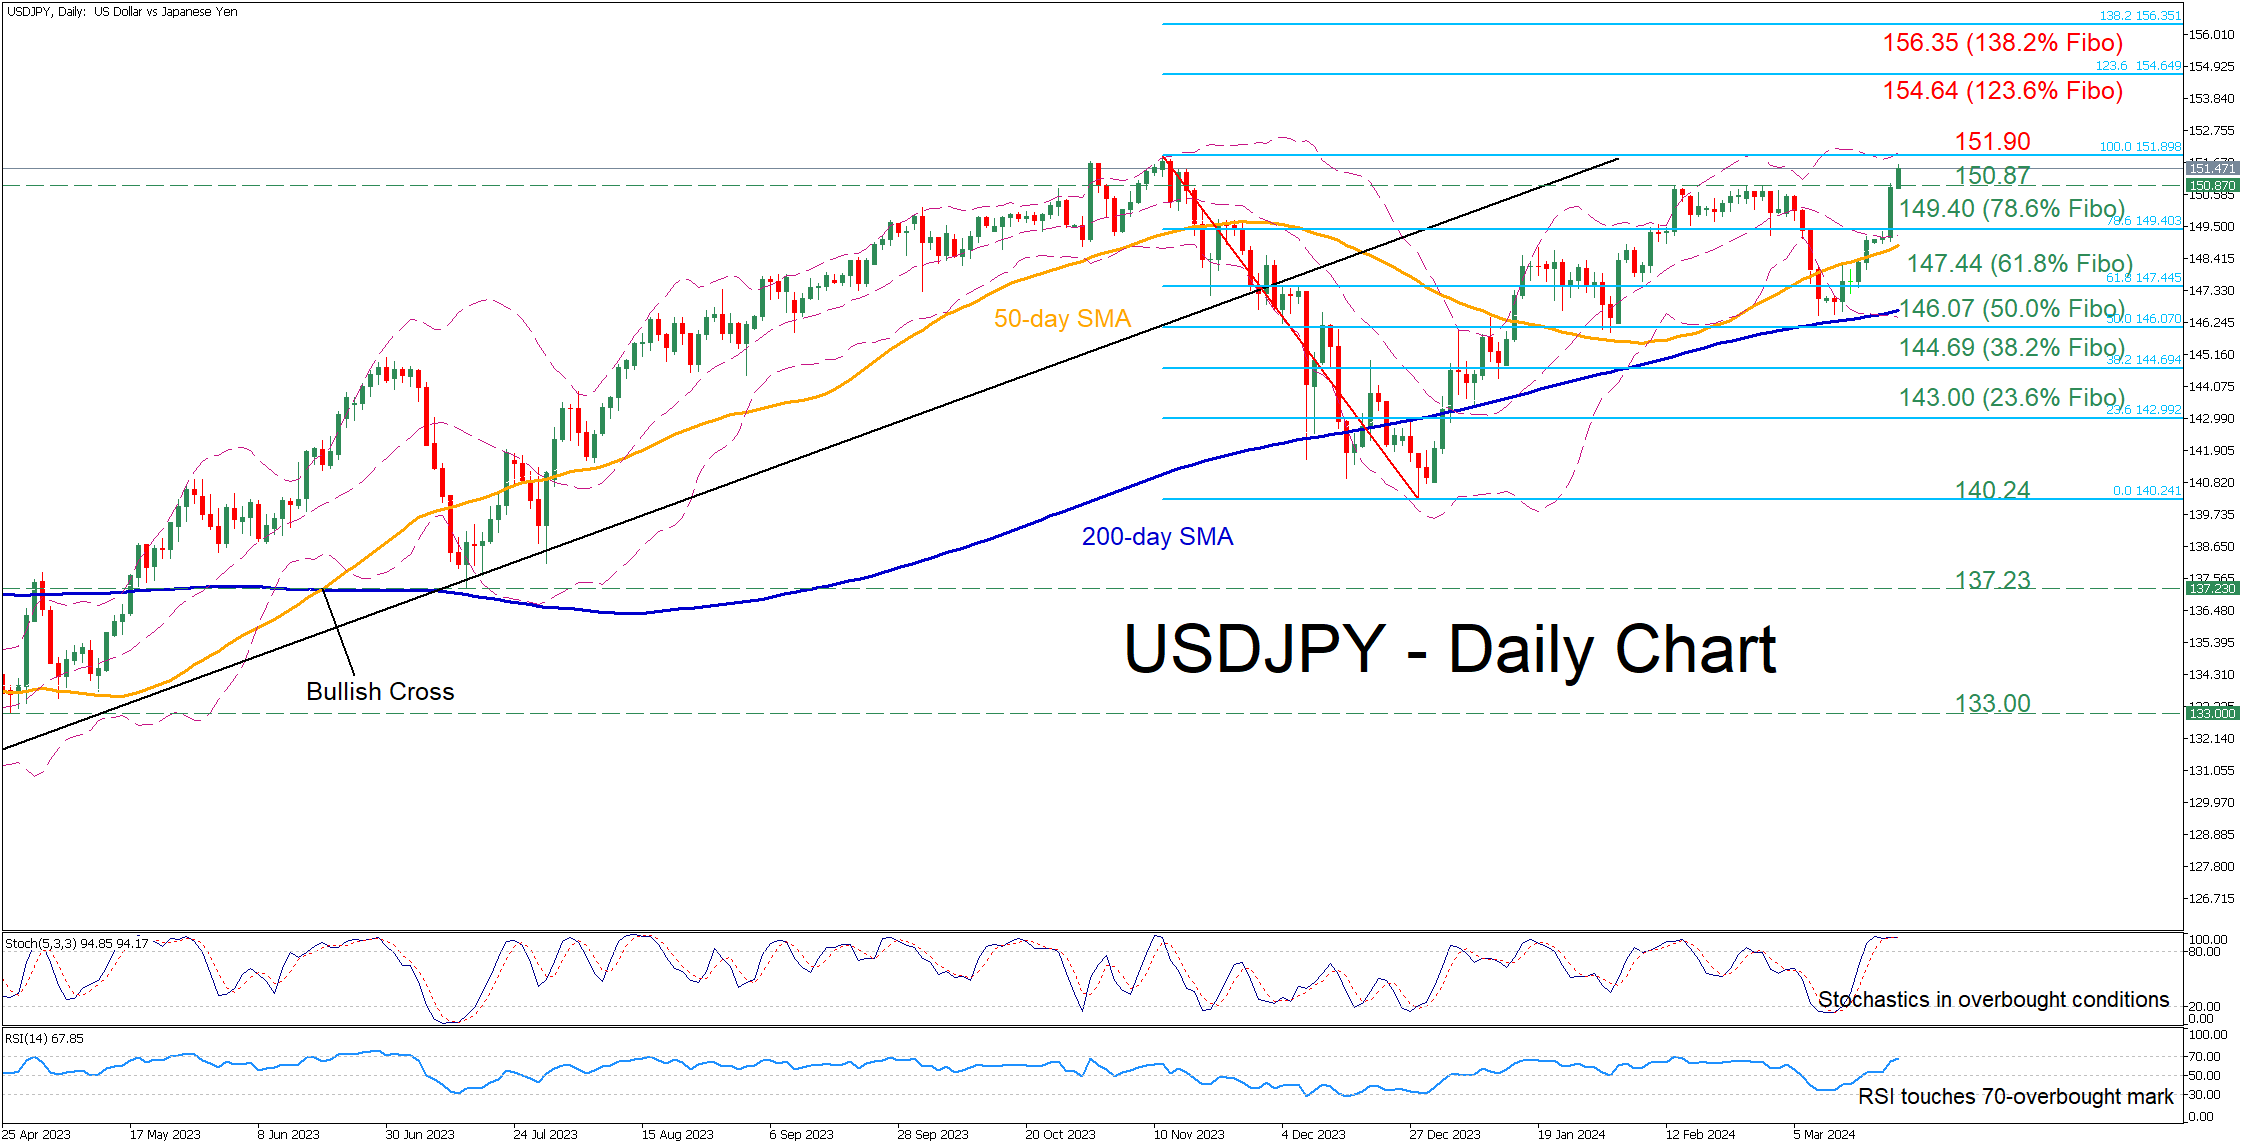
USDJPY has been in a steady uptrend after finding its feet a tad above the 200-day simple moving average (SMA) in early March. Meanwhile, the pair posted a fresh 2024 high following a dovish hike by the BoJ on Tuesday, while it has been extending its losses ahead of the FOMC meeting later today.
Should bullish pressures persist, the price might revisit the 2023 high of 151.90 ahead of the 33-year peak of 151.94 registered in 2022. Further advances could then cease at 154.64, which is the 123.6% Fibonacci extension of the 151.90-140.24 downleg. Conquering this barricade, the bulls could then attack the 138.2% Fibo of 156.35.
On the flipside, if the pair reverses lower, the 2024 resistance region of 150.87 could now serve as initial support. Even lower, the price could encounter strong support at the 78.6% Fibo of 149.40. A violation of that hurdle may set the stage for the 61.8% Fibo of 147.44.
Overall, USDJPY’s advance accelerated following the dovish hike by the BoJ, while the FOMC meeting later today could induce more upside pressures. Therefore, traders should be aware that there might be a battle around the 33-year high of 151.94 in the upcoming sessions.
Gold in a Descending Correction Mode
- Gold creates bearish triangle after bullish rally
- MACD and RSI look weak
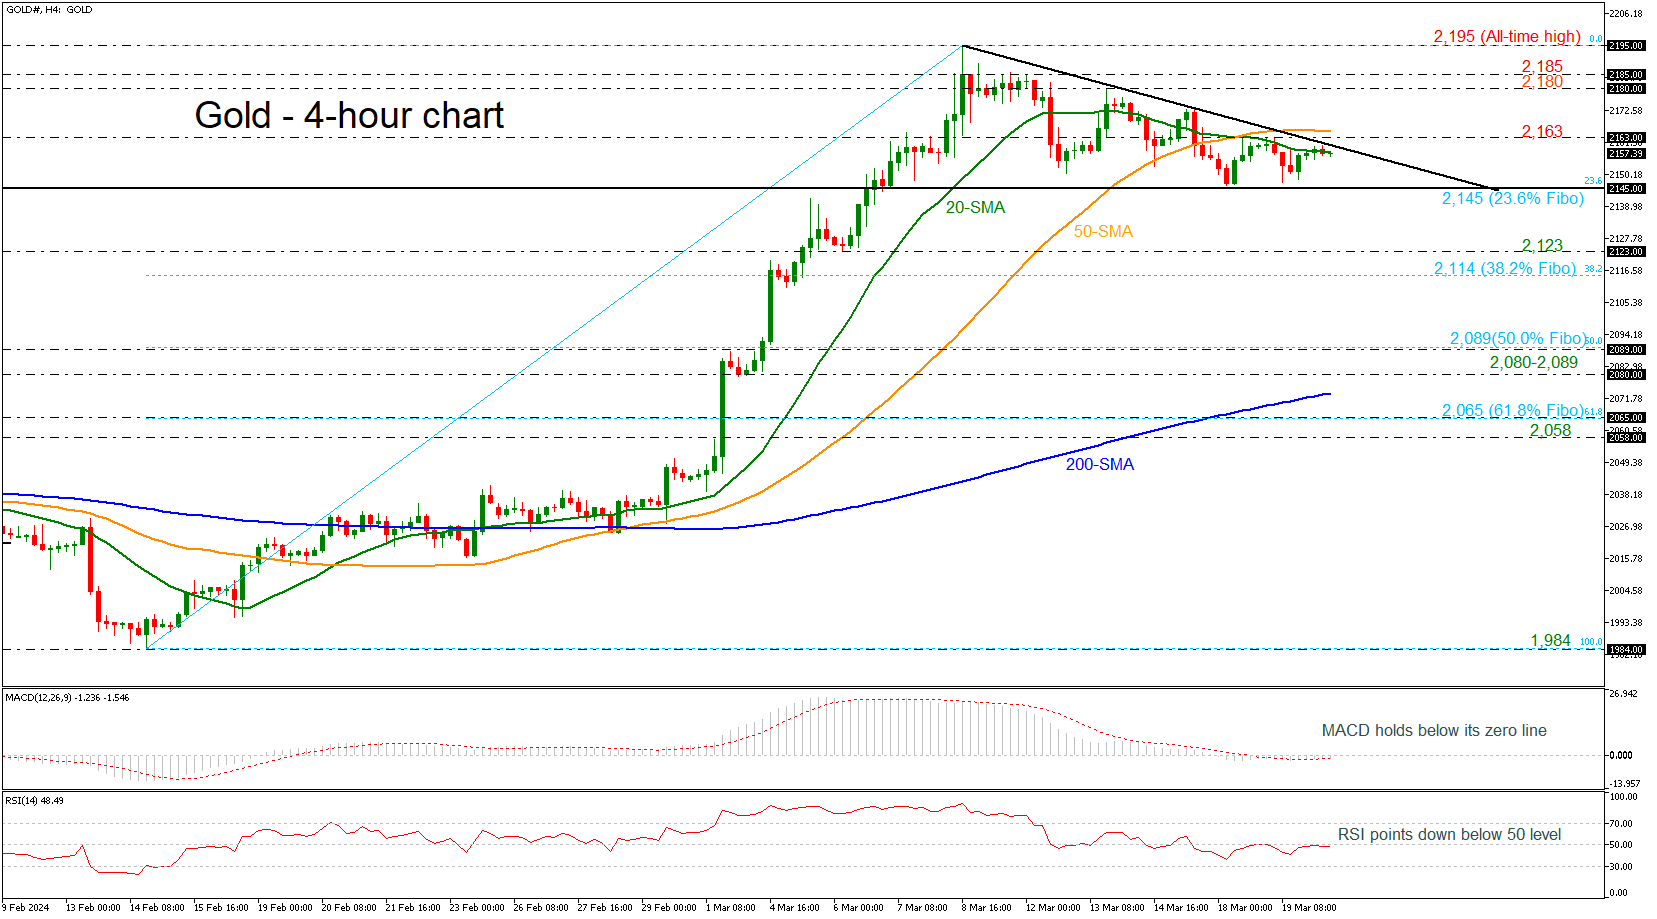
Gold prices have been developing within a descending triangle in the 4-hour chart, after the rally towards the new all-time high of 2,195 on March 8. The price is posting a bearish correction with the technical oscillators indicating weak momentum. The MACD is moving horizontally beneath the zero level, while the RSI is pointing down below the 50 level.
If resistance at 2,163 stands firm though, the precious metal could plummet again towards the 23.6% Fibonacci retracement level of the up leg from 1,984 to 2,195 at 2,145. The 2,123 support might tackle selling pressures, ahead of the 38.2% Fibonacci of 2,114. Then, if the bears breach the 2,100 psychological mark, the bearish wave might pick up pace towards the 50.0% Fibonacci of 2,089.
In the positive scenario, where gold jumps above its 20 and 50-period simple moving averages (SMAs) and the near-term descending trend line, traders might pay attention to the 2,180-2,185 restrictive region. A bounce higher could take a breather around the record peak of 2,195.
All in all, despite the negative mood in the market, broader outlook leaves the door open to another upturn. A rebound above 2,163 could renew buying appetite.
Fed Risks Tilted Towards Hawkish Surprise
Markets
We can’t but start with the Japanese yen again. Including this morning’s price action, USD/JPY (151.57) is an inch away from the 2022 multi-decade yen lows (at 151.95). EUR/JPY (164.68) already surpassed the 2023 high to trade at the strongest level since 2008. The cautious exit by the BoJ from ultra-easy monetary policy completely backfired. The lack of perspective on follow-up rate hikes when markets increasingly ponder the likes of the Fed’s maneuvering room for cuts in the face of stubborn inflation is a deadly cocktail. BoJ governor Ueda during the press conference yesterday already said that if JPY affects the outlook significantly, he’ll consider a policy response. We fear the BoJ will get there pretty fast. On markets ex-Japan we witnessed some profit-taking on Treasury shorts ahead of the important March Fed policy meeting. Front-end US yields eased a little less than 5 bps, longer maturities lost 0.7-3.2 bps. German Bunds underperformed by shedding 3.3 bps at the front and adding 1.1 bp in the 30-y tenor. Yield differentials and an improved equity sentiment brought the US dollar down from its intraday highs. DXY called off a test of the 104 big figure, EUR/USD rebounded from a low at 1.0835 to close at 1.0866.
It’s Fed-day. But in the run-up to tonight we’ll get some distraction from the 2024 ECB and its Watchers Conference. The three debates center around the inflation surge and whether it is over, monetary policy transmission and the implications of geopolitics & structural change. Speakers include president Lagarde, chief economist Lane and board member Schnabel. UK inflation numbers triggered a kneejerk move lower in GBP on a minor headline (3.4%) and core (4.5%) miss. But above-consensus services CPI (6.1%) complicates the picture going into tomorrow’s Bank of England policy decision. Turning to the Fed, risks are tilted towards a hawkish surprise. Inflation forecasts are to be revised upwards for this (and perhaps next) year against the background of a resilient economy and labour market. Our base case assumes the three rate cuts projected in the December dot plot to show up again in the March edition. But the case for less and a late(r) start is visibly strengthening given that base effects will support inflation readings in the months ahead (through the summer) while financial conditions are the easiest since mid-2022. We’ll also look out whether the median estimate of the neutral rate has finally shifted higher. Ceteris paribus that would mean that any given policy rate level north of neutral is by definition less restrictive than previously thought. This may in particular be of importance for the rate projections in 2025 (4 cuts) and 2026 (3 cuts). Finally: quantitative tightening. The current pace, $95bn/month, could be slowed based on some recent Fed comments. We don’t expect it to materially impact markets to the extent it means the rundown can last longer in the future instead of the Fed being forced to stop abruptly (as in 2018). We believe tonight’s FOMC meeting to sustain the recent momentum in US yields. Moving beyond the YtD highs is likely to trigger a technical acceleration. 4.82% and 4.4% mark the next resistance levels in the 2-y and 10-y tenor. The dollar should easily stand out against the euro, for which the ECB is preparing a June rate cut. EUR/USD 1.0793 is followed by 1.0695 on the technical charts.
News & Views
The US Department of the Treasury yesterday published Treasury International Capital data for January. Total overseas holdings of US Treasuries declined by $32.4bn from a record $8.05tn in December 2023 to $8.02tn. The stockpile of the largest holder of Treasuries, Japan, increased by $14.9bn to $1.15tn. The holdings of number two on the list, China, fell by $18.6bn to $797.7bn after a brief uptick last December. Chinese holdings have been gradually declining since the Trump presidency from levels north of $1.2tn in the 2011-2015 period. UK holdings, completing the podium, were almost flat at $735.5bn. Holdings of the Cayman Islands, proxy for hedge funds accounts, rose by $13.3bn to $318.5bn.
An ECB spokesman told Bloomberg news agency that the ECB will make its internal wage trackers, designed to deliver data on salaries in a speedy manner and often referred to by central bankers, publicly available later this year. ECB president Lagarde put a quite some weight on the outcome of Q1 wage negotiations as key input to determining the timing of a first rate cut. More frequent wage data can help guide markets as the ECB turns to a less restrictive policy in the coming quarters.
GBP/JPY Daily Outlook
Daily Pivots: (S1) 190.32; (P) 191.24; (R1) 192.84; More.....
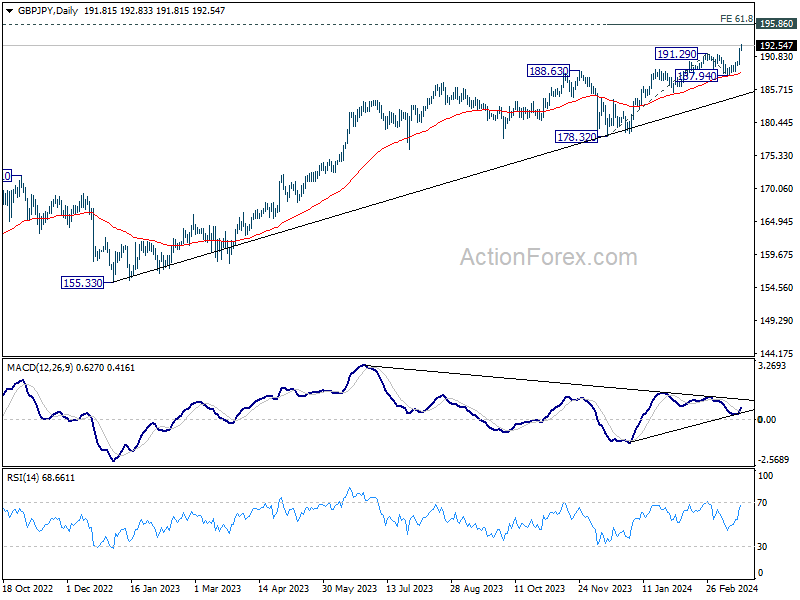
GBP/JPY's up trend resumed by breaking through 191.29 resistance and there is no sign of topping yet. Intraday bias remains on the upside for 61.8% projection of 178.32 to 191.29 from 187.94 at 195.95, which is close to 195.86 long term resistance. On the downside, below 191.78 minor support will turn intraday bias neutral and bring consolidations first, before staging another rally.
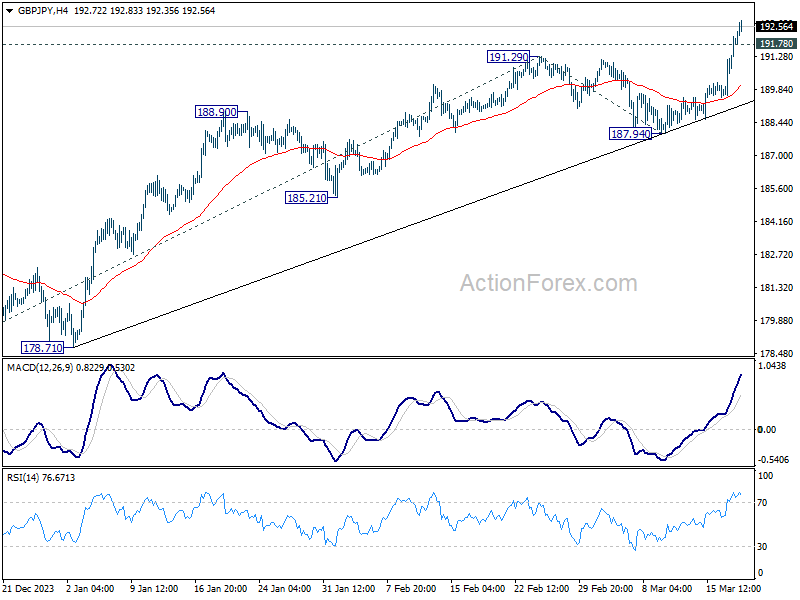
In the bigger picture, current rally is part of the uptrend from 123.94 (2020 low), and is in progress for long term resistance (2015 high). Break of 187.94 support is needed to be the first sign of medium term topping. Otherwise, outlook will remain bullish in case of retreat.
EUR/JPY Daily Outlook
Daily Pivots: (S1) 162.64; (P) 163.32; (R1) 164.61; More...
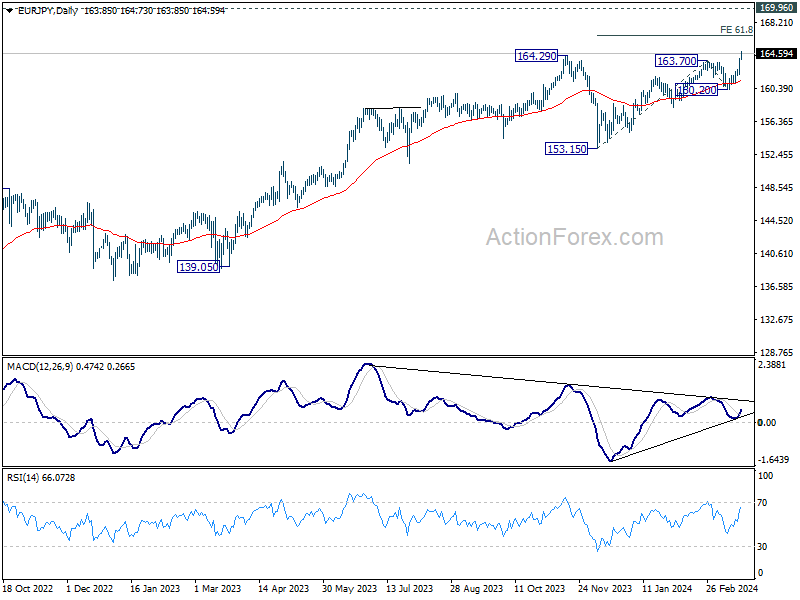
EUR/JPY's long term up trend resumed by breaking through 164.29 resistance. Intraday bias stays on the upside. Next near term target will be 61.8% projection of 153.15 to 163.70 from 160.20 at 166.71. On the downside, Below 163.81 minor support will turn intraday bias neutral and bring consolidations first, before staging another rally.
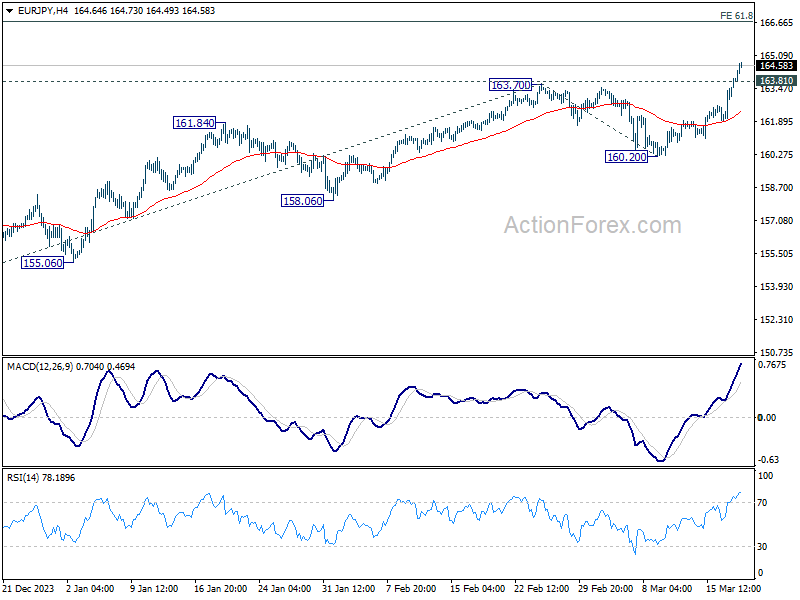
In the bigger picture, current rally is part of the up trend from 114.42 (2020 low), which is still in progress. Next target is 169.96 (2008 high). Break of 160.20 support is needed to be the first sign of medium term topping. Otherwise, outlook will stay bullish in case of retreat.