Sample Category Title
EUR/CHF Daily Outlook
Daily Pivots: (S1) 0.9446; (P) 0.9459; (R1) 0.9472; More...
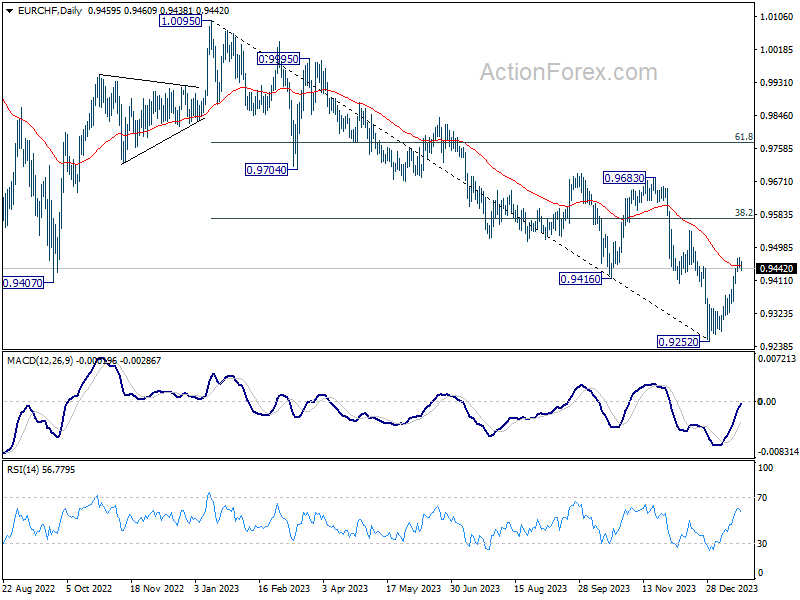
Intraday bias in EUR/CHF is turned neutral with current retreat. Some consolidations could be seen but further rally is expected as long as 0.9404 minor support holds. Above 0.9471 will resume the rebound from 0.9252, as a correction to whole decline from 1.0095. Next target will be 38.2% retracement of 1.0095 to 0.9252 at 0.9574. However, break of 0.9404 will turn bias to the downside for deeper fall.
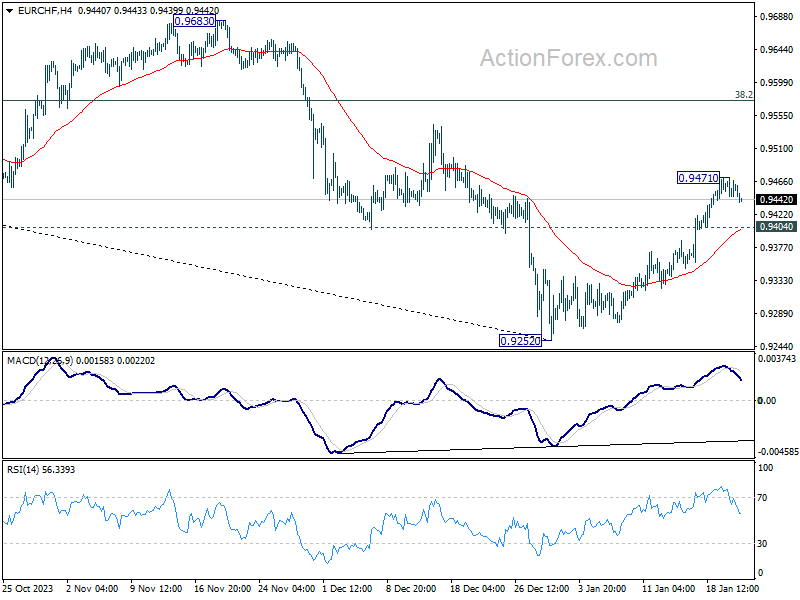
In the bigger picture, medium term outlook remains bearish as long as 0.9683 resistance holds. Current fall from 1.2004 (2018 high) is part of the multi-decade down trend. Another decline is in favor after rebound from 0.9252 completes. However, firm break of 0.9683, and sustained trading above 55 W EMA (now at 0.9659) will argue that EUR/CHF is already in a medium term rally, even as a corrective move.
USD/CAD Daily Outlook
Daily Pivots: (S1) 1.3435; (P) 1.3459; (R1) 1.3503; More...
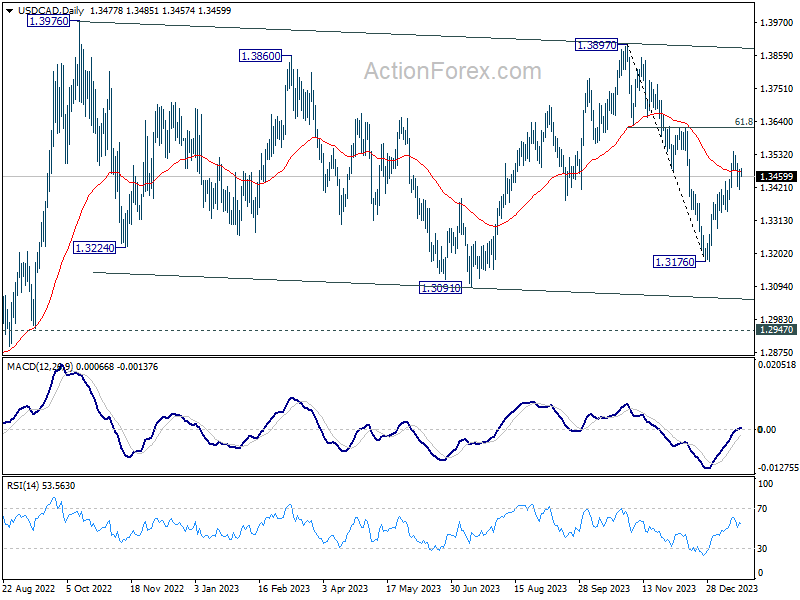
Intraday bias in USD/CAD stays neutral as consolidation from 1.3540 is still extending. But further rally is expected as long as 1.3342 minor support holds. Fall from 1.3897 should have completed at 1.3716. Break of 1.3540w ill target 1.3617 cluster resistance (61.8% retracement of 1.3897 to 1.3176 at 1.3622). Decisive break there will pave the way to 1.3897/3976 key resistance zone.
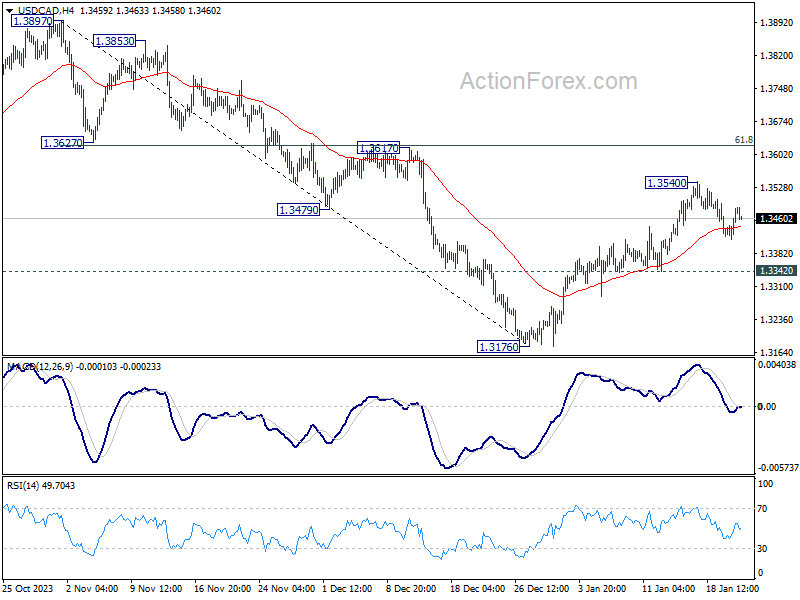
In the bigger picture, price actions from 1.3976 (2022 high) are viewed as a corrective pattern only. In case of another fall, strong support should emerge above 1.2947 resistance turned support to bring rebound. Overall, larger up trend from 1.2005 (2021 low) is still expected to resume through 1.3976 at a later stage.
AUD/USD Daily Report
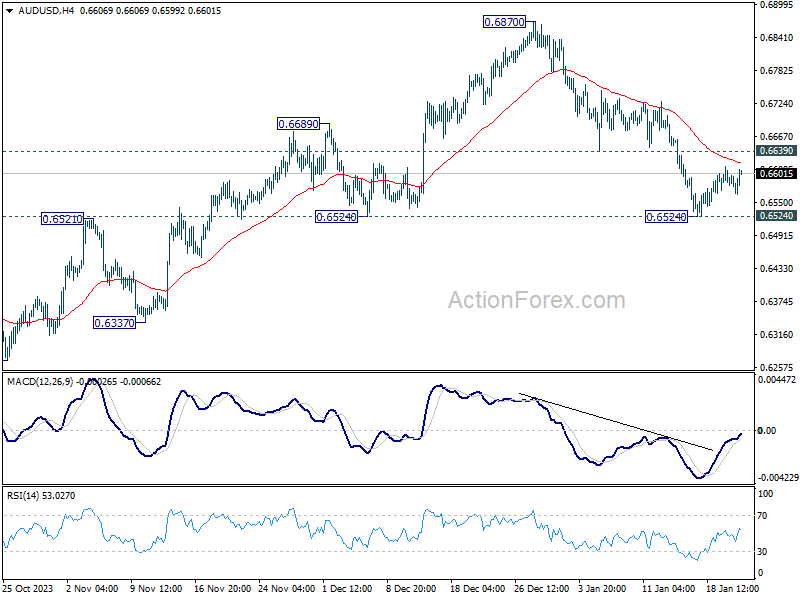
Daily Pivots: (S1) 0.6553; (P) 0.6584; (R1) 0.6600; More...
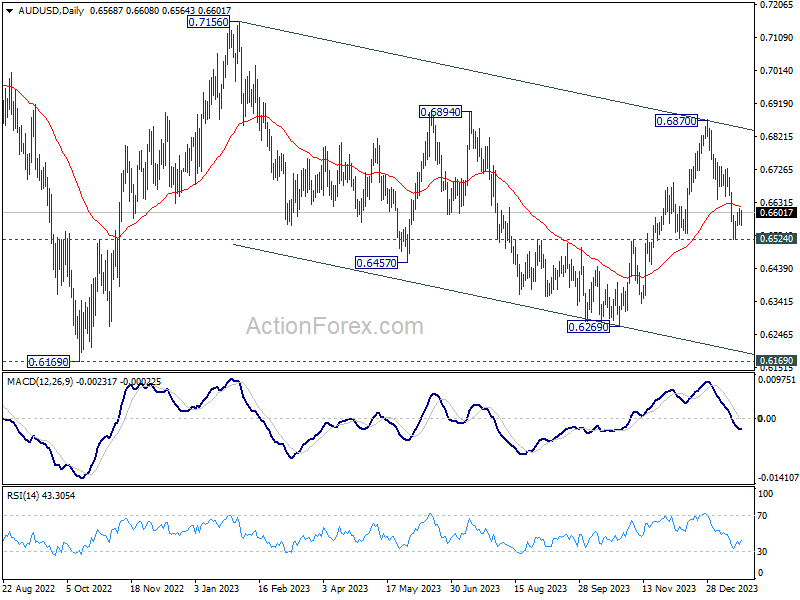
Intraday bias in AUD/USD remains neutral as consolidation from 0.6524 is extending. But further decline is expected as long as 0.6639 support turned resistance holds. Firm break of 0.6524 support will argue that whole rebound from 0.6269 has completed, and bring deeper fall to this support.
In the bigger picture, price actions from 0.6169 (2022 low) are seen as a medium term corrective pattern to the down trend from 0.8006 (2021 high). Sideway trading could continue in range of 0.6169/7156 for some more time. But as long as 0.7156 holds, an eventual downside breakout would be mildly in favor.
EUR/USD Daily Outlook
Daily Pivots: (S1) 1.0872; (P) 1.0891; (R1) 1.0902; More...
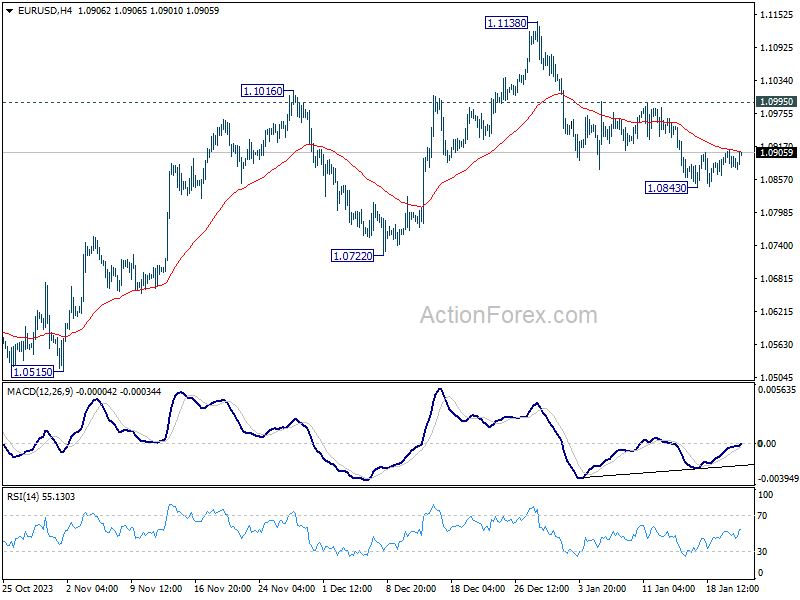
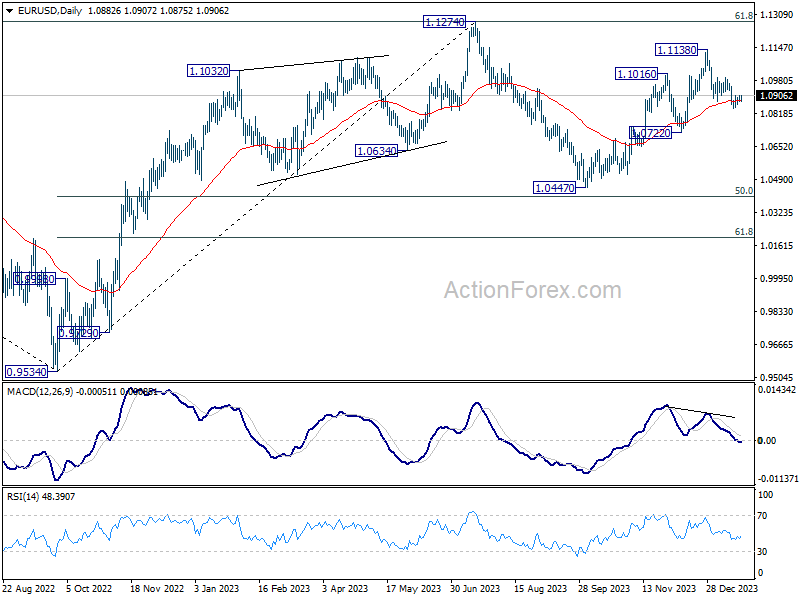
Intraday bias in EUR/USD remains neutral as consolidation from 1.0843 is still extending. Further decline is expected as long as 1.0995 resistance holds. Below 1.0843 will target 1.0722 support next. Decisive break there will argue that whole rise from 1.0447 has completed, and target this low.
In the bigger picture, price actions from 1.1274 are viewed as a corrective pattern to rise from 0.9534 (2022 low). Rise from 1.0447 is seen as the second leg. While further rally could cannot be ruled out, upside should be limited by 1.1274 to bring the third leg of the pattern. Meanwhile, sustained break of 1.0722 support will argue that the third leg has already started for 1.0447 and below.
GBP/USD Daily Outlook
Daily Pivots: (S1) 1.2686; (P) 1.2710; (R1) 1.2732; More...
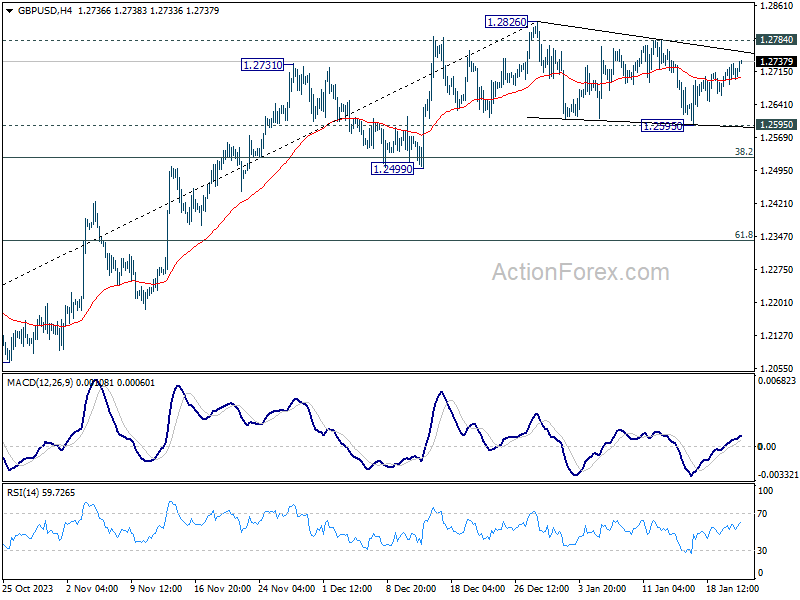
Intraday bias in GBP/USD remains neutral for the moment. Consolidation from 1.2826 could extend further. On the downside, break of 1.2595 support will target 1.2499 support. On the upside, however, firm break of 1.2784 resistance will suggest that the consolidation pattern has completed. Further rally should then resume through 1.2826 towards 1.3141 high.
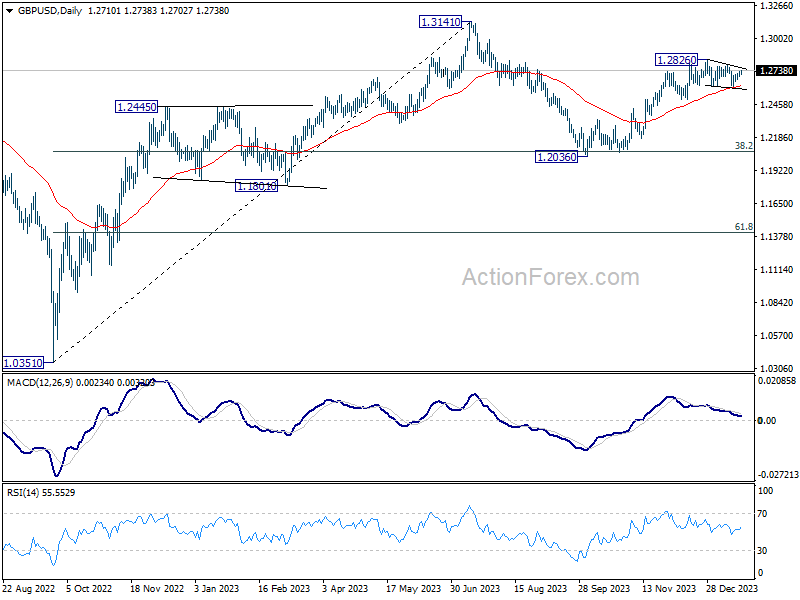
In the bigger picture, price actions from 1.3141 medium term top are seen as a corrective pattern to up trend from 1.0351 (2022 low). Rise from 1.2036 is seen as the second leg that's in progress. Upside should be limited by 1.3141 to bring the third leg of the pattern. Meanwhile, break of 1.2499 support will argue that the third leg has already started for 38.2% retracement of 1.0351 (2022 low) to 1.3141 at 1.2075 again.
USD/CHF Daily Outlook
Daily Pivots: (S1) 0.8671; (P) 0.8686; (R1) 0.8706; More....
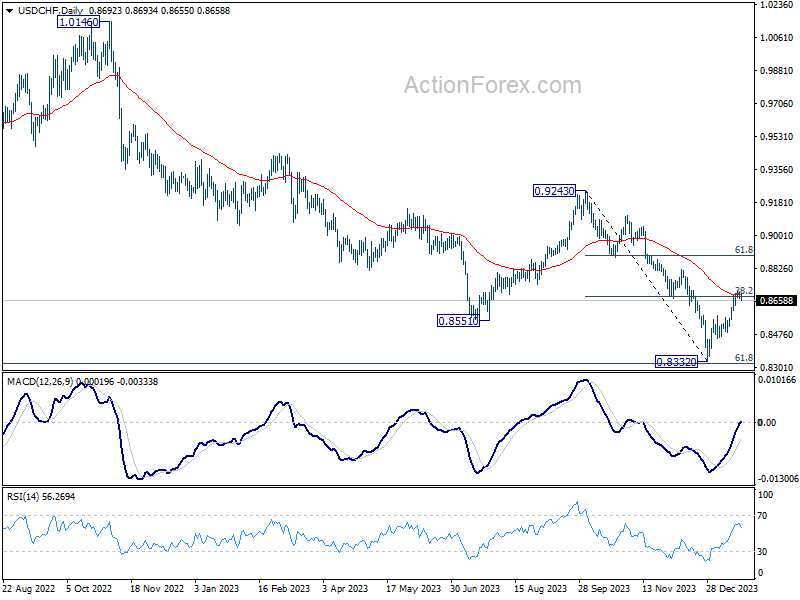
No change in USD/CHF's outlook and intraday bias remains neutral. Focus stays on 38.2% retracement of 0.9243 to 0.8332 at 0.8680, which coincides 55 D EMA (now at 0.8686). Decisive break there will turn near term outlook bullish for 61.8% retracement 0.8995. Nevertheless, break of 0.8565 minor support will turn intraday bias back to the downside for retesting 0.8332 low.
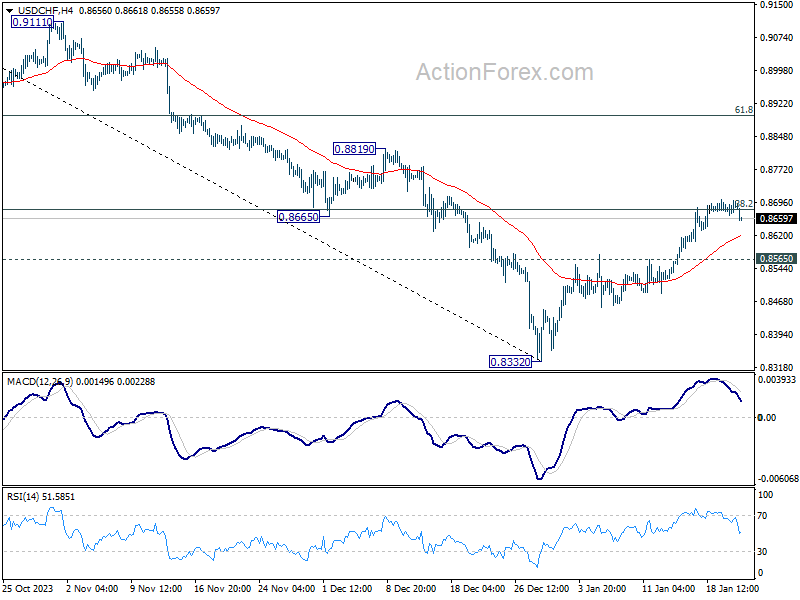
In the bigger picture, while rebound from 0.8332 could be strong, there is no clear sign of medium term bottoming yet. This rebound is tentatively seen as a corrective move for now. Also, outlook will stay bearish as long as 0.9243 resistance holds. Larger down trend from 1.0146 (2022 high) should resume through 0.8332 low at a later stage.
USD/JPY Daily Outlook
Daily Pivots: (S1) 147.71; (P) 148.03; (R1) 148.44; More...
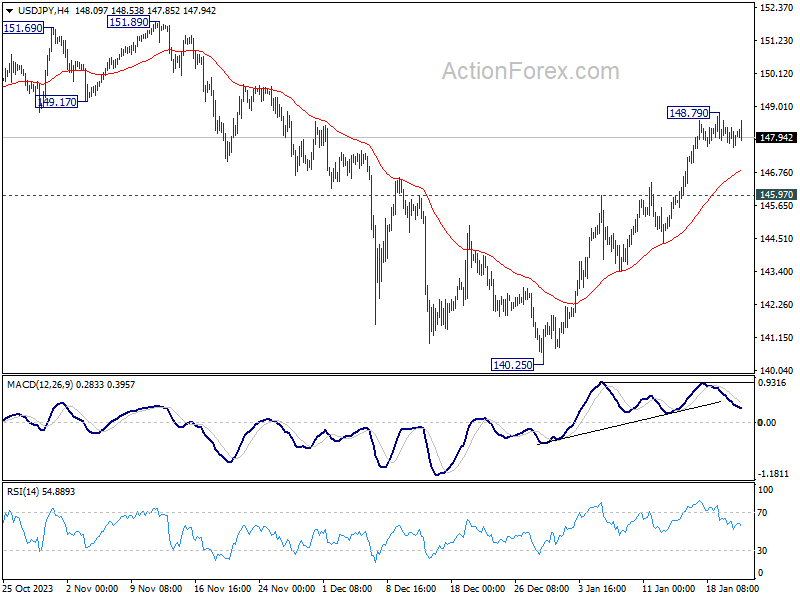
Intraday bias in USD/JPY remains neutral for the moment. Consolidation from 148.79 temporary top could extend further, and deeper retreat cannot be ruled out. But further rally is expected as long as 145.97 resistance turned support holds. Corrective fall from 151.89 should have completed at 140.25 already. Break of 148.79 will resume the rise from there for retesting 151.89/93 key resistance zone.
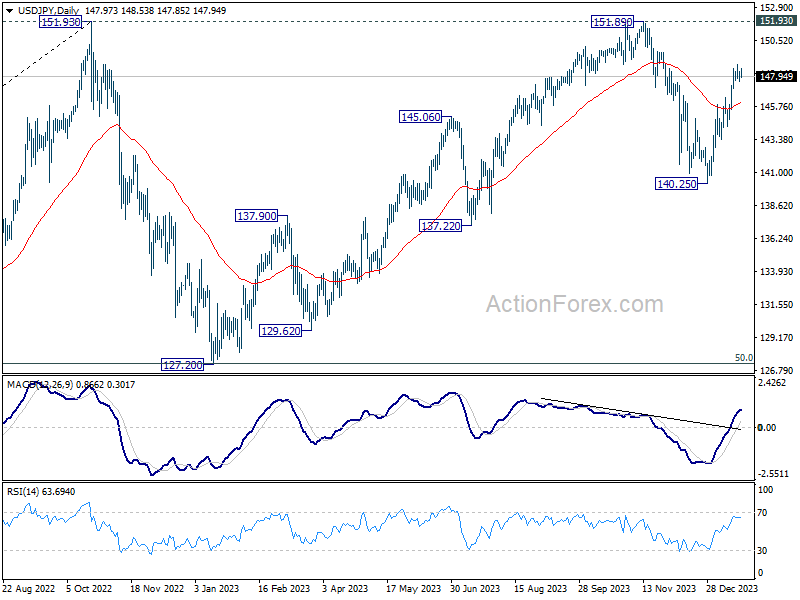
In the bigger picture, stronger than expected rebound from 140.25 dampened the original bearish review. Strong support from 55 W EMA (now at 141.89) is also a medium term bullish sign. Fall from 151.89 could be a correction to rise from 127.20 only. Decisive break of 151.89/93 will confirm resumption of long term up trend. This will now be the favored case as long as 140.25 support holds.
Yen Steady After Brief Ripples from BoJ, Dollar Softens Mildly
Yen weakened momentarily after BoJ left monetary policy unchanged as widely expected, but swiftly regained stability. This quick recovery underscores the market's assessment that the conditions for a BoJ rate hike in April remain intact. This viewpoint is bolstered by unchanged CPI core-core forecast, which holds steady at 1.9% for the upcoming two fiscal years. However, BoJ refrained from offering any immediate signals for such a policy shift. The decision on whether to raise interest rates will depend heavily on the outcomes of the Spring wages negotiations, especially in terms of the breadth of wage growth. Given these circumstances, Yen still faces potential downside risks in the near term.
Meanwhile, Dollar softened mildly in Asian session, correlating with recovery in Hong Kong stock markets. After enduring a prolonged downturn, HSI is showing early signs of stabilization. News that China is mulling a USD 278B stock market rescue package is lifting sentiment mildly. However, it's still too soon to declare a definitive reversal of the down trend. Risk-off sentiment in Hong Kong and China would continue to support the greenback, and pressure commodity currencies.
The broader currency market remains relatively inactive, with most major pairs and crosses are stuck inside yesterday's range. Dollar is the worst performer, followed by Canadian and then Yen. Aussie and Kiwi are the stronger ones with Swiss Franc. Euro and Sterling are mixed. The market is likely to experience a lull in volatility today, given the light economic calendar. However, activity is expected to pick up with tomorrow's release of New Zealand's CPI and global PMI data, which could trigger more pronounced movements.
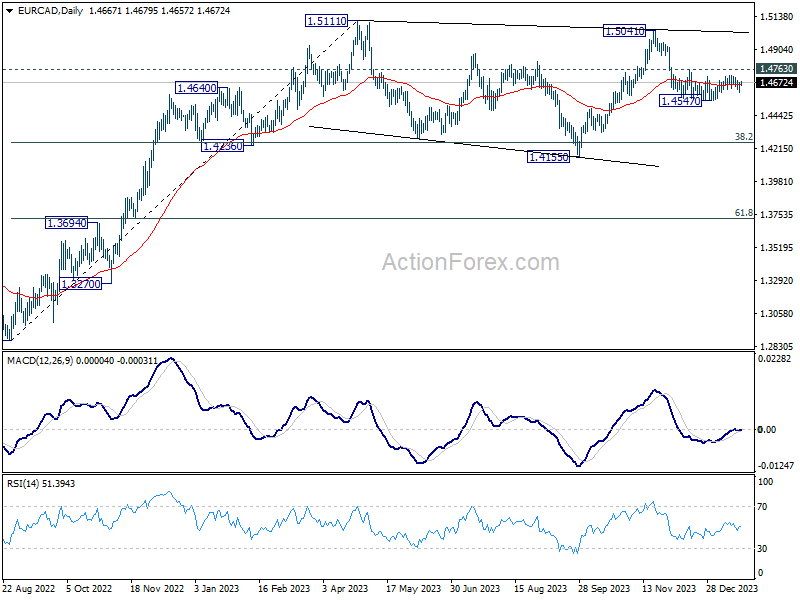
Technically, EUR/CAD is extending the consolidation from 1.4547 at this point. Further decline is in favor as long as 1.4763 minor resistance holds. Below 1.4547 will resume the fall from 1.5041. However, as price actions from 1.5111 are seen as a sideway pattern only, strong support should emerge around 1.4155 to bring rebound. Meanwhile, break of 1.4763 will bring retest of 1.5041 resistance instead. Given that both BoC (Wednesday) and ECB (Thursday) will announce interest rate decision this week, EUR/CAD is a pair that's worth some attention.
In Asia, at the time of writing, Nikkei is up 0.09%. Hong Kong HSI is up 2.92%. China Shanghai SSE is up 0.36%. Singapore Strait Times is up 0.03%. Japan 10-year JGB yield is down -0.0089 at 0.645. Overnight, DOW rose 0.36%. S&P 500 rose 0.22%. NASDAQ rose 0.32%. 10-year yield fell -0.052 to 4.094.
BoJ holds steady, with CPI core-core projected at 1.9% in next two fiscal years
BoJ let monetary policy unchanged as widely expected. The forecast for fiscal 2024 CPI core was downgraded, whereas fiscal 2025 CPI core forecast saw a slight upgrade. Notably, CPI core-core forecasts for fiscal 2024 and 2025 were left unchanged at 1.9%, indicating a steady path towards achieving Japan's 2% inflation target sustainably.
Under Yield Curve Control, BoJ kept short-term policy interest rate unchanged at -0.1%. Additionally, target for 10-year JGB yield remains around 0%, with an allowance for fluctuation below 1.0% upper bound. These decisions were made by unanimous vote.
BoJ noted, "Consumer inflation is likely to increase gradually toward the BoJ's target as the output gap turns positive, and as medium- to long-term inflation expectations and wage growth heighten." The central bank also acknowledged the growing "likelihood" of realizing this outlook, albeit with an emphasis on the continued "high uncertainties" surrounding future developments.
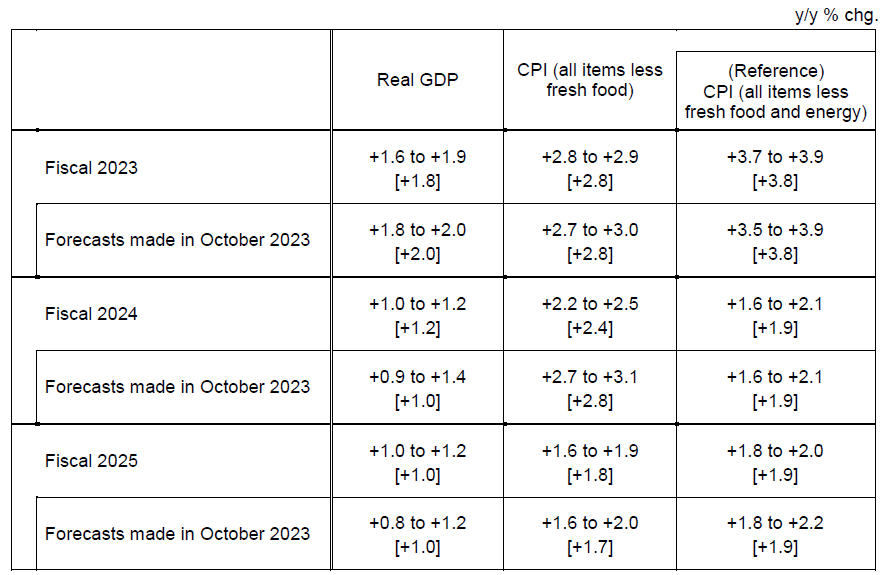
In the median economic projections:
- Fiscal 2023 GDP growth at 1.8% (down from October's 2.0%).
- Fiscal 2024 GDP growth at 1.2% (up from 1.0%).
- Fiscal 2025 GDP growth at 1.0% (unchanged).
On the inflation front:
- Fiscal 2023 CPI core at 2.8% (unchanged).
- Fiscal 2024 CPI core at 2.4% (down from 2.8%).
- Fiscal 2025 CPI core at 1.8% (up from 1.7%).
- Fiscal 2023 CPI core-core at 3.8% (unchanged).
- Fiscal 2024 CPI core-core at 1.9% (unchanged).
- Fiscal 2025 CPI core-core at 1.9% (unchanged).
Australia's NAB business confidence rises to -1 amidst slowing price growth
Australia NAB Business Confidence fell rose from -8 to -1 in December. However, Business Conditions fell from 9 to 7. The decline was observed across several key areas: Trading conditions dropped from 13 to 10, while Employment conditions also decreased slightly from 8 to 7. Profitability conditions remained steady at 6.
NAB Chief Economist Alan Oster noted that "confidence and conditions are softest in manufacturing, retail and wholesale," attributing this to consumers cutting back on spending over time. Although there was a pickup in confidence within the retail sector in December, Oster expressed caution, stating that "it remains to be seen if this will be maintained."
Another significant development was the sharp decline in price and cost growth. Labor cost growth eased to 1.8% in quarterly equivalent terms, down from 2.3%. Purchase cost growth also declined from 2.5% to 1.6%. Overall price growth slowed from 1.2% to 0.9%, with notable decrease in retail price growth from 1.8% to 0.6%.
Oster highlighted the significance of this decline in retail price growth, attributing it in part to the sales periods around Black Friday and Christmas. He remarked, "The marked fall in retail price growth in December... is nonetheless an encouraging sign that inflation may have eased at the end of the quarter."
New Zealand BNZ services falls to 48.8, back in contraction
New Zealand BusinessNZ Performance of Services Index fell from 51.1 to 48.8 in December, back into contraction territory. This downturn also brings the index below long-term average of 53.4. The increase in negative sentiment is evident, with the proportion of negative comments rising from 54.0% to 58.7%. The primary concerns expressed by businesses revolve around seasonal factors, increasing costs of living, and an overall economic slowdown.
Breaking down the PSI, several key components showed declines. Activity and sales dropped from 48.7 to 47.1, employment fell from 50.6 to 47.5, and new orders/business dipped from 52.2 to 51.2. Additionally, stocks and inventories decreased from 55.0 to 51.5, while supplier deliveries also saw a reduction from 52.8 to 50.5.
Stephen Toplis, BNZ's Head of Research noted that the softening in PSI, combined with the previously reported weakness in Performance of Manufacturing Index, paints a concerning picture for New Zealand's near-term economic growth and employment. While tourism has been a critical driver for the services sector and is expected to continue supporting the economy, Toplis emphasized that it cannot solely bear the burden of economic revitalization.
Looking ahead
UK public sector net borrowing, Eurozone consumer, and Canada new housing prices are the only features in the calendar today.
USD/JPY Daily Outlook
Daily Pivots: (S1) 147.71; (P) 148.03; (R1) 148.44; More...
Intraday bias in USD/JPY remains neutral for the moment. Consolidation from 148.79 temporary top could extend further, and deeper retreat cannot be ruled out. But further rally is expected as long as 145.97 resistance turned support holds. Corrective fall from 151.89 should have completed at 140.25 already. Break of 148.79 will resume the rise from there for retesting 151.89/93 key resistance zone.
In the bigger picture, stronger than expected rebound from 140.25 dampened the original bearish review. Strong support from 55 W EMA (now at 141.89) is also a medium term bullish sign. Fall from 151.89 could be a correction to rise from 127.20 only. Decisive break of 151.89/93 will confirm resumption of long term up trend. This will now be the favored case as long as 140.25 support holds.
Economic Indicators Update
| GMT | Ccy | Events | Actual | Forecast | Previous | Revised |
|---|---|---|---|---|---|---|
| 21:30 | NZD | Business NZ PSI Dec | 48.8 | 51.2 | 51.1 | |
| 00:30 | AUD | NAB Business Conditions Dec | 7 | 9 | ||
| 00:30 | AUD | NAB Business Confidence Dec | -1 | -9 | ||
| 03:09 | JPY | BoJ Rate Decision | -0.10% | -0.10% | -0.10% | |
| 07:00 | GBP | Public Sector Net Borrowing (GBP) Dec | 11.2B | 13.4B | ||
| 13:30 | CAD | New Housing Price Index M/M Dec | 0.00% | -0.20% | ||
| 15:00 | EUR | Eurozone Consumer Confidence Jan P | -14 | -15 |
S&P 500 (SPX) Looking for Further Upside
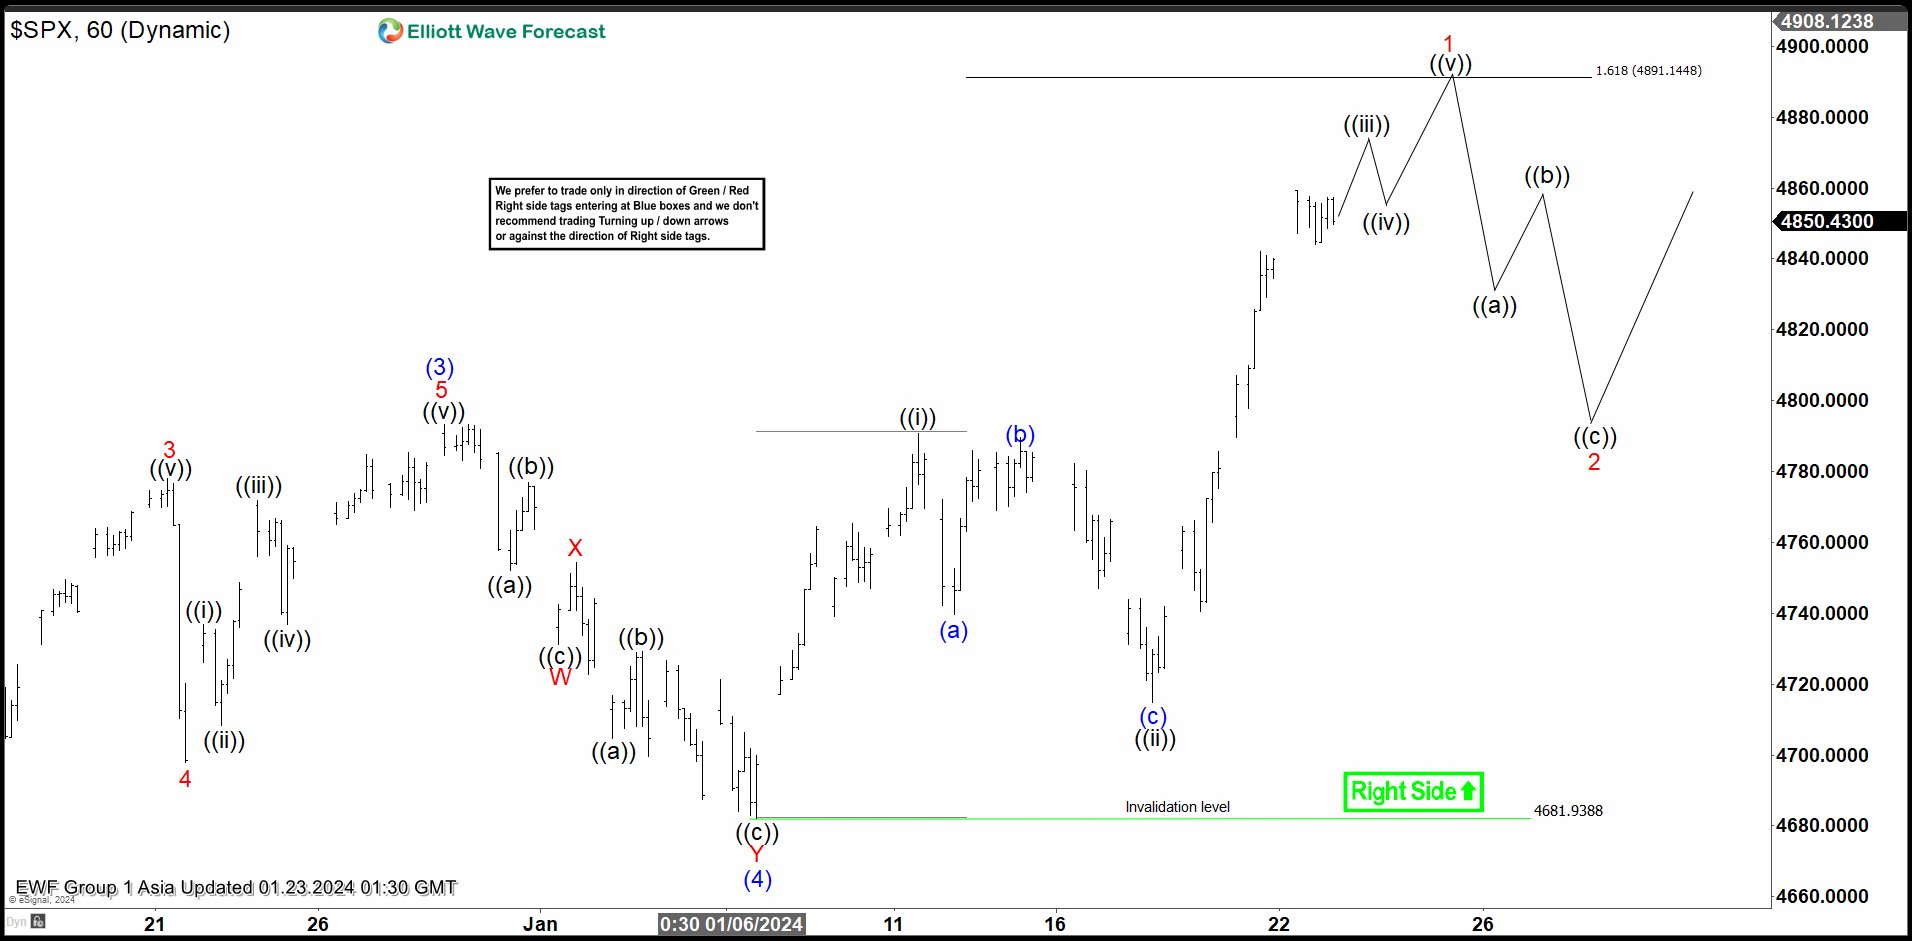
Short term Elliott Wave View in S&P 500 (SPX) suggests that rally to 4793.3 ended wave (3). Pullback in wave (4) is unfolding as a double three Elliott Wave structure. Down from wave (3), wave ((a)) ended at 4752 and wave ((b)) rally ended at 4776.9. Wave (c)) lower ended at 4731.17 which completed wave W in higher degree. Wave X rally ended at 4754.33. Index then resumed lower in wave Y. Down from wave X, wave ((a)) ended at 4704.72, wave ((b)) ended at 4729.29 and wave ((c)) lower ended at 4681.94. This completed wave Y of (4).
The Index then turned higher in wave (5). Internal subdivision of wave (5) is unfolding as an impulse in lesser degree. Up from wave (4), wave ((i)) ended at 4790.80 and wave ((ii)) pullback subdivided into a zigzag structure. Wave (a) ended at 4739.58, wave (b) ended at 4789.52, and wave (c) lower ended at 4714.82 which completed wave ((ii)). Expect wave ((iii)) to end soon, then it should pullback in wave ((iv)) before turning higher again in wave ((v)) to complete wave 1 in higher degree. Afterwards, Index should pullback in wave 2 to correct cycle from 1.6.2024 low in 3, 7, or 11 swing before the rally resumes. Near term, as far as pivot at 4681.94 low stays intact, expect dips to find support in 3, 7, 11 swing for further upside.
S&P 500 (SPX) 60 Minutes Elliott Wave Chart
SPX Elliott Wave Video
https://www.youtube.com/watch?v=yH37hdr75GE
Technical Outlook and Review
DXY:
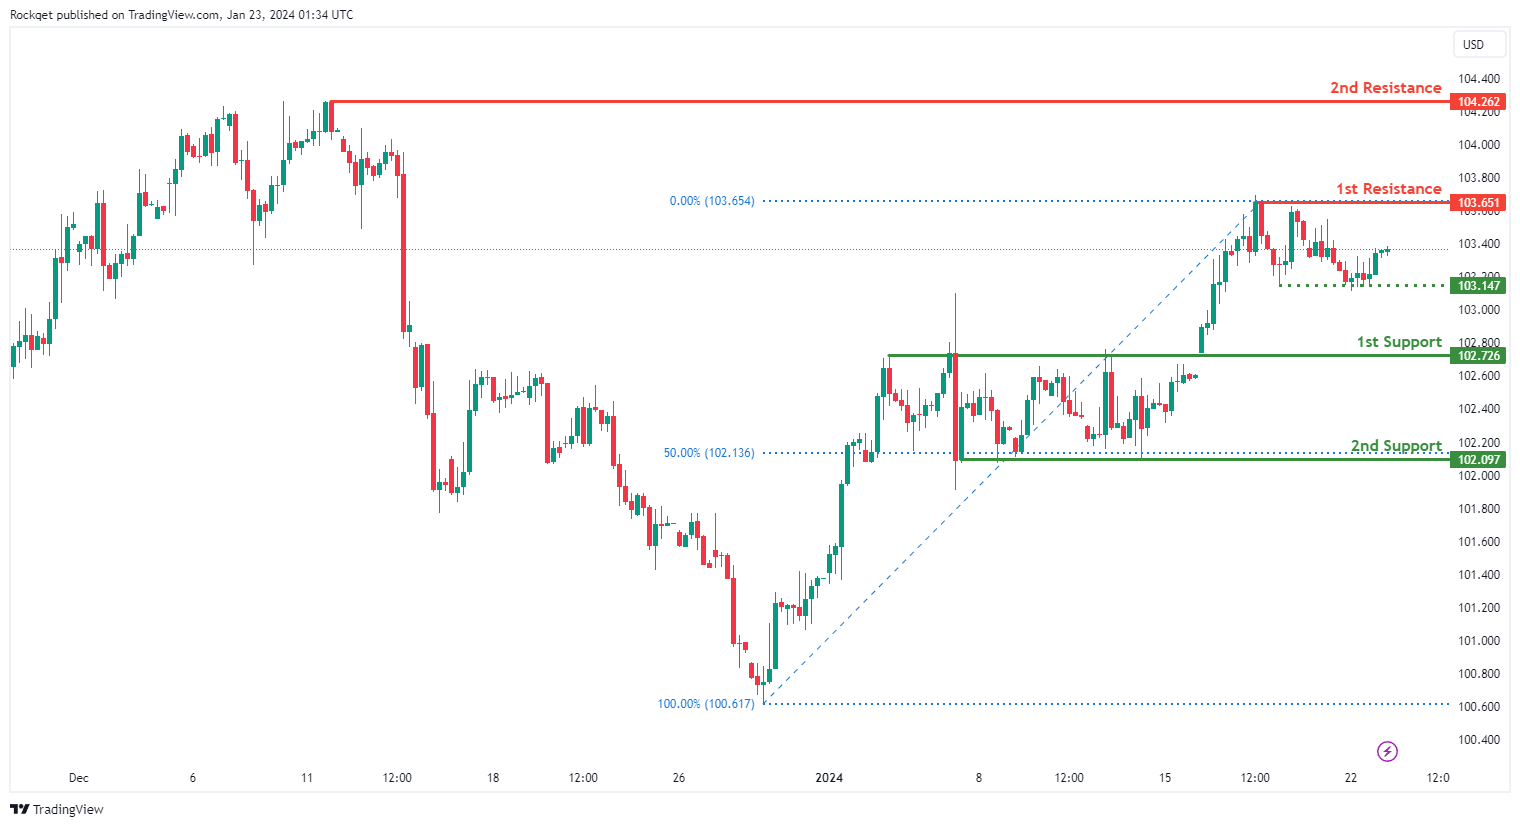
The DXY (US Dollar Index) chart currently exhibits an overall bullish momentum. In this context, there is a potential scenario for price to fall towards the intermediate support before resuming the uptrend towards the 1st resistance.
The intermediate support level at 103.14 is identified as a pullback support while the 1st support at 102.72 is also noted as a pullback support. Further below, the 2nd support level at 102.09 is also marked as a pullback support that aligns with the 50.00% Fibonacci retracement level, reinforcing this level as a key support area.
On the resistance side, the 1st resistance level at 103.65 is recognized as a pullback resistance. Higher up, the 2nd resistance level at 104.26 is also identified as a pullback resistance, highlighting its potential as a significant resistance zone.
EUR/USD:
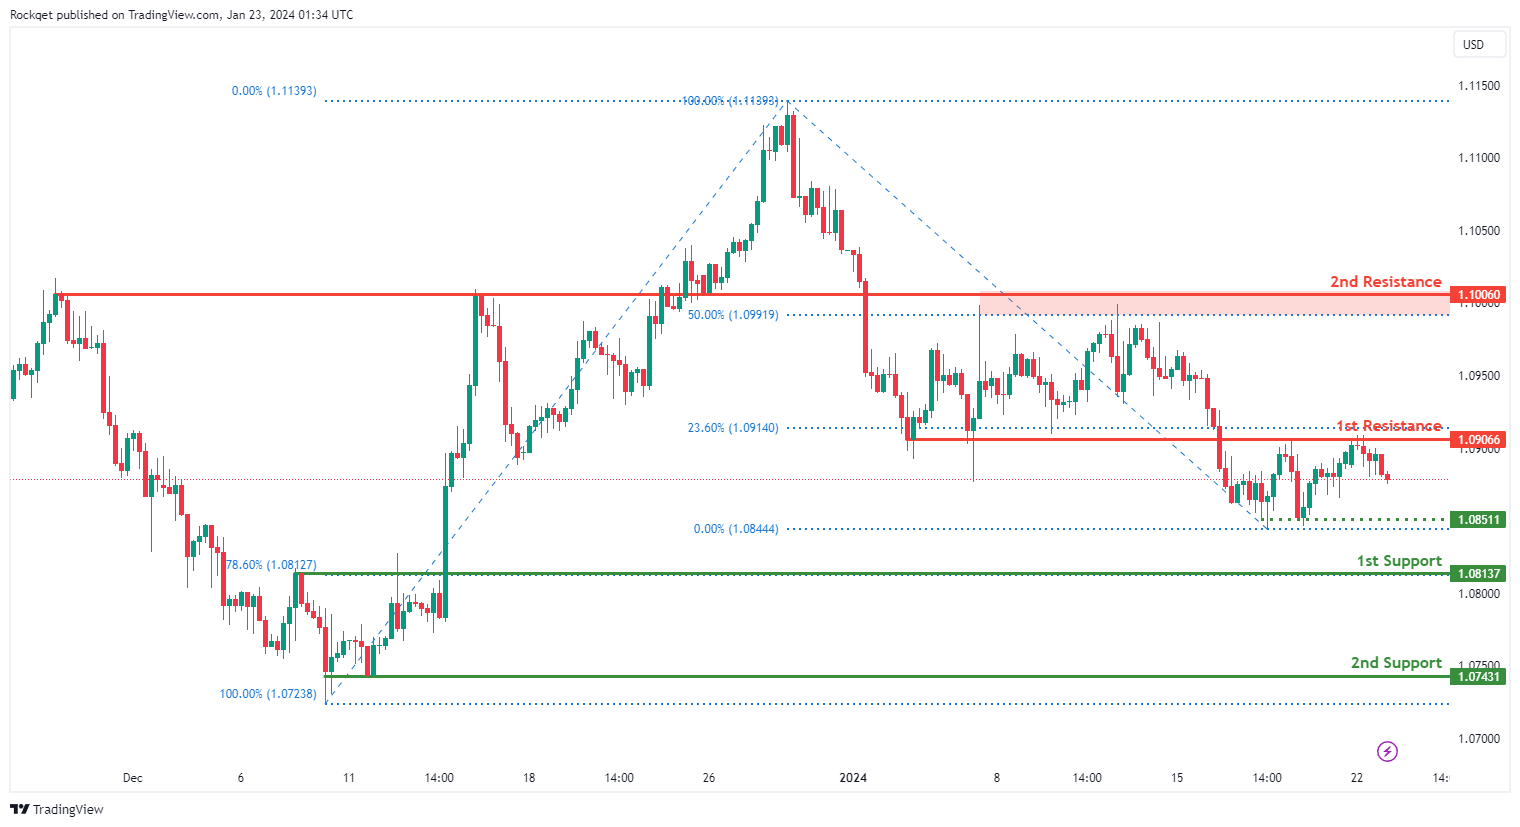
The EUR/USD chart currently exhibits an overall bearish momentum. In this context, there is a potential scenario for price to retrace higher towards the 1st resistance before resuming the downtrend.
The 1st resistance level at 1.0906 is identified as an overlap resistance that aligns close to the 23.60% Fibonacci retracement level. Higher up, the 2nd resistance level at 1.1006 is also noted as an overlap resistance that aligns close to the 50.00% Fibonacci retracement level, suggesting a potential barrier for further upside movement.
To the downside, the intermediate support level at 1.0851 is identified as a pullback support while the 1st support level at 1.0813 is also noted as a pullback support that aligns with the 78.60% Fibonacci retracement level. Further below, the 2nd support level at 1.0743 is marked as a swing-low support, further reinforcing its importance as a key support level.
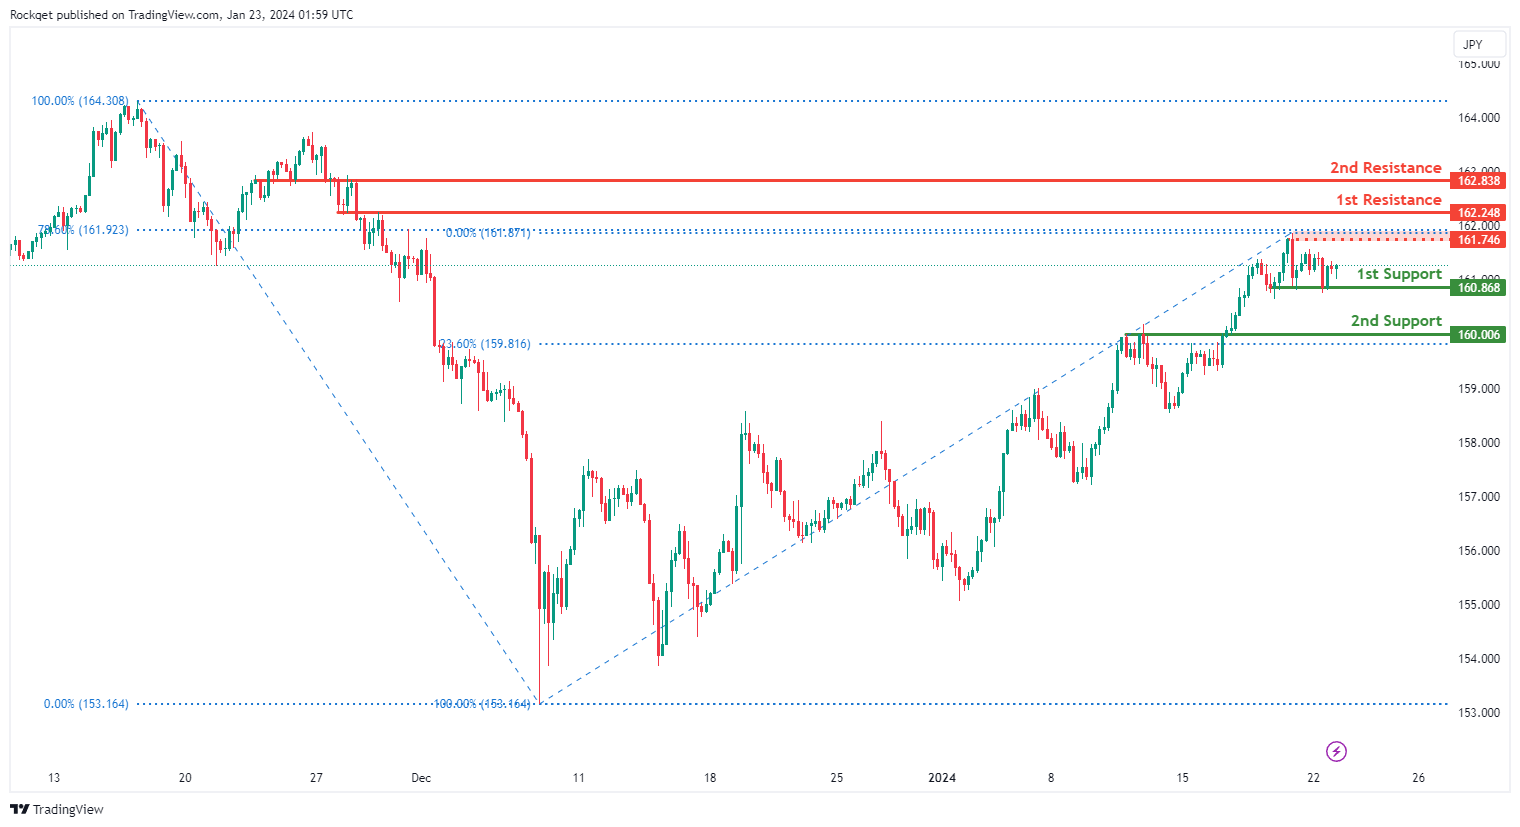
EUR/JPY:
The EUR/JPY chart currently shows a bearish overall momentum, indicating a downward trend direction. There is a potential scenario where the price could continue its bearish movement towards the 1st support level.
The 1st support at 160.87 is considered favorable as it aligns with multiple swing lows, suggesting a historical level where buying interest has previously emerged. Additionally, the 2nd support at 160.01 is identified as an overlap support and coincides with the 23.60% Fibonacci Retracement, adding confluence to its potential as a support level.
On the resistance side, the 1st resistance at 162.25 is recognized as an overlap resistance, indicating a historical level where selling interest has been present. The 2nd resistance at 162.84 is also acknowledged as an overlap resistance.
Furthermore, an intermediate resistance level at 161.75 is identified, marked by a swing high resistance and the 78.60% Fibonacci Retracement. This level adds additional strength to the potential resistance zone.
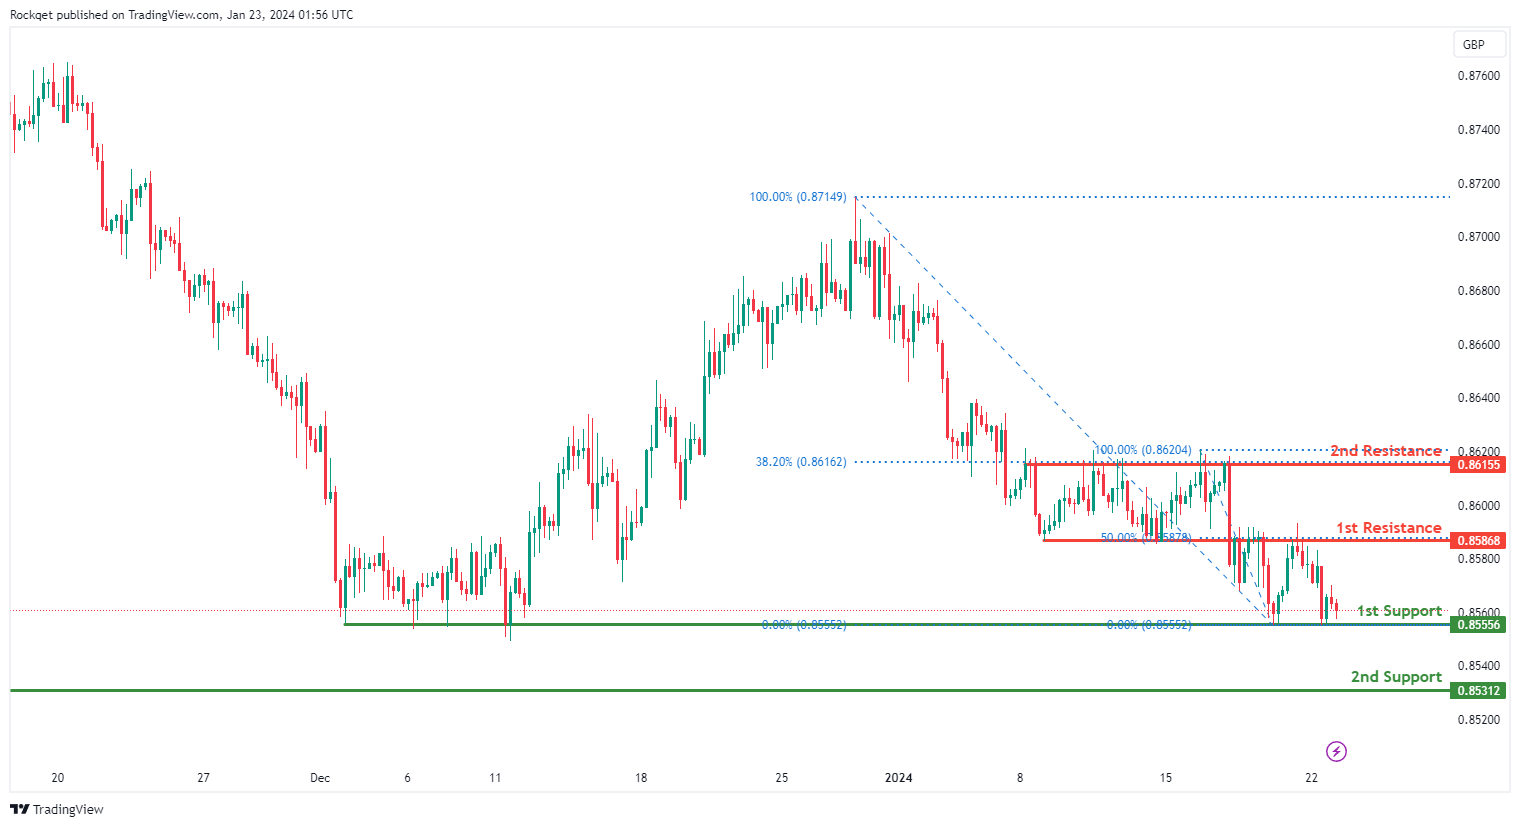
EUR/GBP:
The EUR/GBP chart currently demonstrates a bullish overall momentum, indicating a positive trend direction. In the short term, there is a potential scenario where the price could experience a drop to the 1st support level before bouncing from there and subsequently rising towards the 1st resistance.
The 1st support at 0.8556 is considered a favorable level due to its identification as a swing low support, suggesting historical significance as a level where buying interest has previously emerged. Additionally, the 2nd support at 0.8531 is recognized as a multi-swing low support, providing additional strength to the support zone.
On the resistance side, the 1st resistance at 0.8587 is identified as an overlap resistance and corresponds to the 50% Fibonacci Retracement. This confluence of technical factors adds strength to the potential resistance level. Furthermore, the 2nd resistance at 0.8616 is acknowledged as a multi-swing high resistance and aligns with the 38.20% Fibonacci Retracement, adding significance to this potential resistance zone.
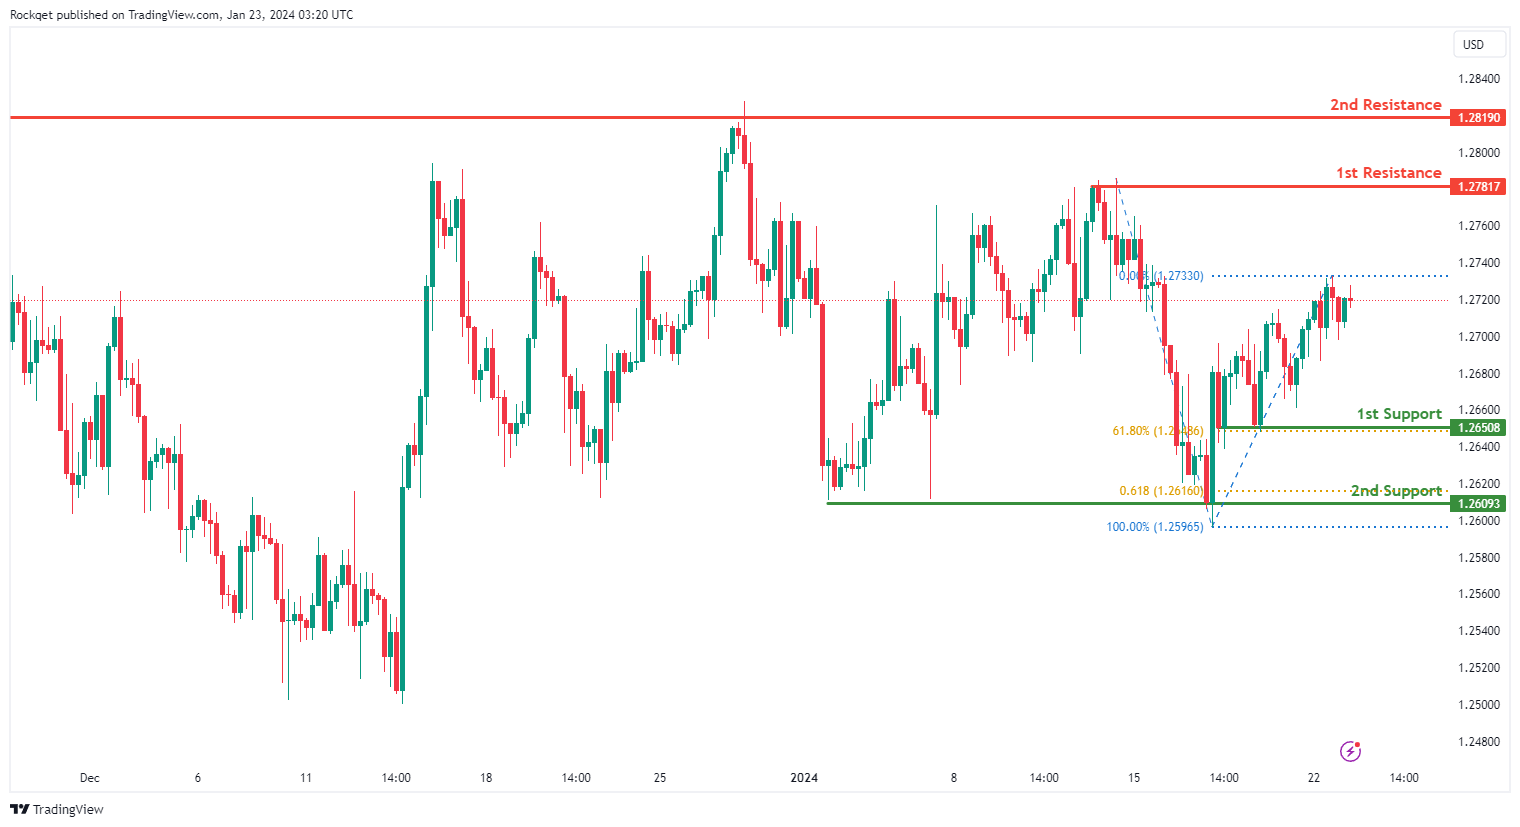
GBP/USD:
The GBP/USD chart currently exhibits a neutral bias. In this context, there is a potential scenario for price to fluctuate between the 1st resistance and the 1st support.
The 1st support level at 1.2650 is identified as a pullback support that aligns with the 61.80% Fibonacci retracement level. Further below, the 2nd support level at 1.2609 is noted as a multi-swing-low support that aligns with the 61.80% Fibonacci projection level, reinforcing its potential as a key support level.
On the resistance side, the 1st resistance level at 1.2781 is recognized as a swing-high resistance. Higher up, the 2nd resistance level at 1.2819 is marked as a multi-swing-high resistance, reinforcing its significance as a potential resistance zone.
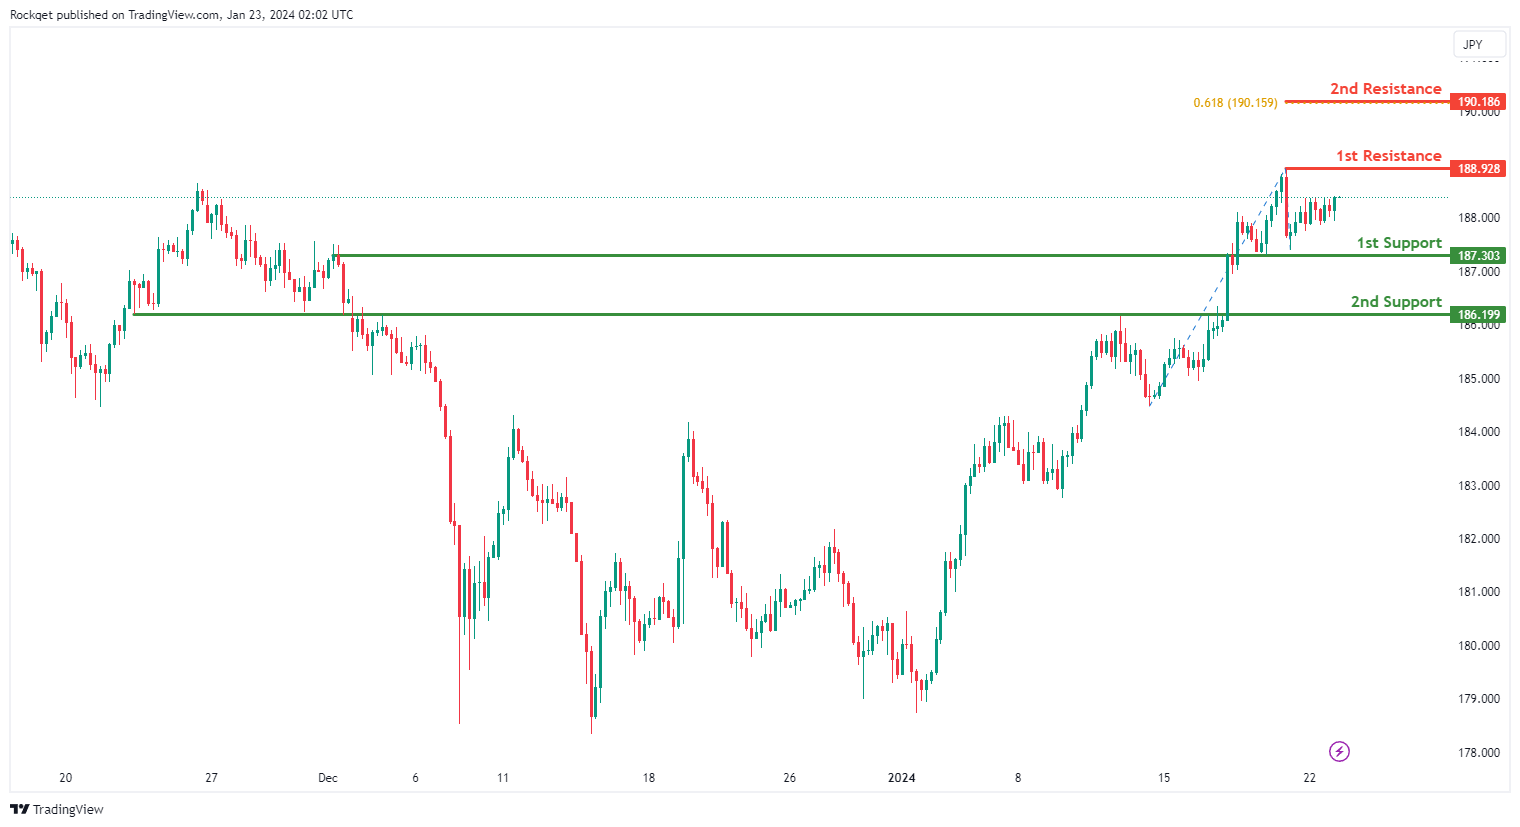
GBP/JPY:
The GBP/JPY chart currently exhibits a bullish overall momentum, indicating a positive trend direction. There is a potential scenario where the price could continue its bullish movement towards the 1st resistance.
The 1st support at 187.30 is considered favorable due to its identification as an overlap support, suggesting historical significance as a level where buying interest has previously emerged. Additionally, the 2nd support at 186.20 is recognized as another overlap support, providing additional strength to the support zone.
On the resistance side, the 1st resistance at 188.93 is identified as a swing high resistance, marking a level where selling interest has been historically observed. Furthermore, the 2nd resistance at 190.19 is noteworthy for the presence of the 61.80% Fibonacci Projection, adding significance to this potential resistance level.
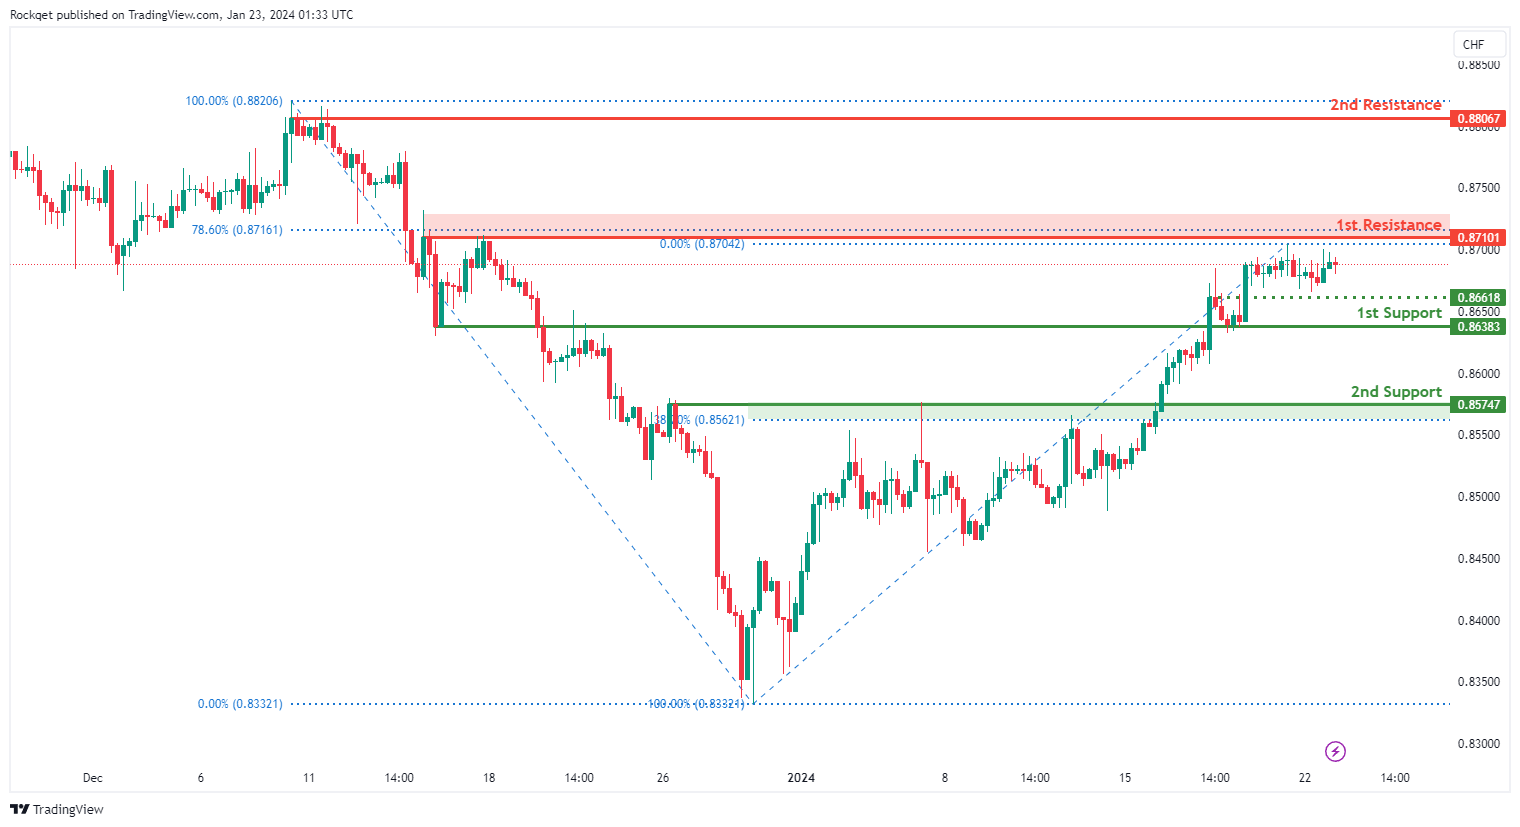
USD/CHF:
The USD/CHF chart currently exhibits an overall bullish momentum. In this context, there is a potential scenario for price to rise towards the 1st resistance.
The 1st resistance level at 0.8710 is identified as a pullback resistance that aligns with the 78.60% Fibonacci retracement level. Higher up, the 2nd resistance level at 0.8806 is also noted as a pullback resistance, further reinforcing its significance as a potential resistance zone.
To the downside, the intermediate support level at 0.8661 is identified as an overlap support while the 1st support level at 0.8638 is also noted as an overlap support. Further below, the 2nd support level at 0.8574 is marked as a pullback support that aligns close to the 38.20% Fibonacci retracement level, further reinforcing its importance as a key support level.
USD/JPY:
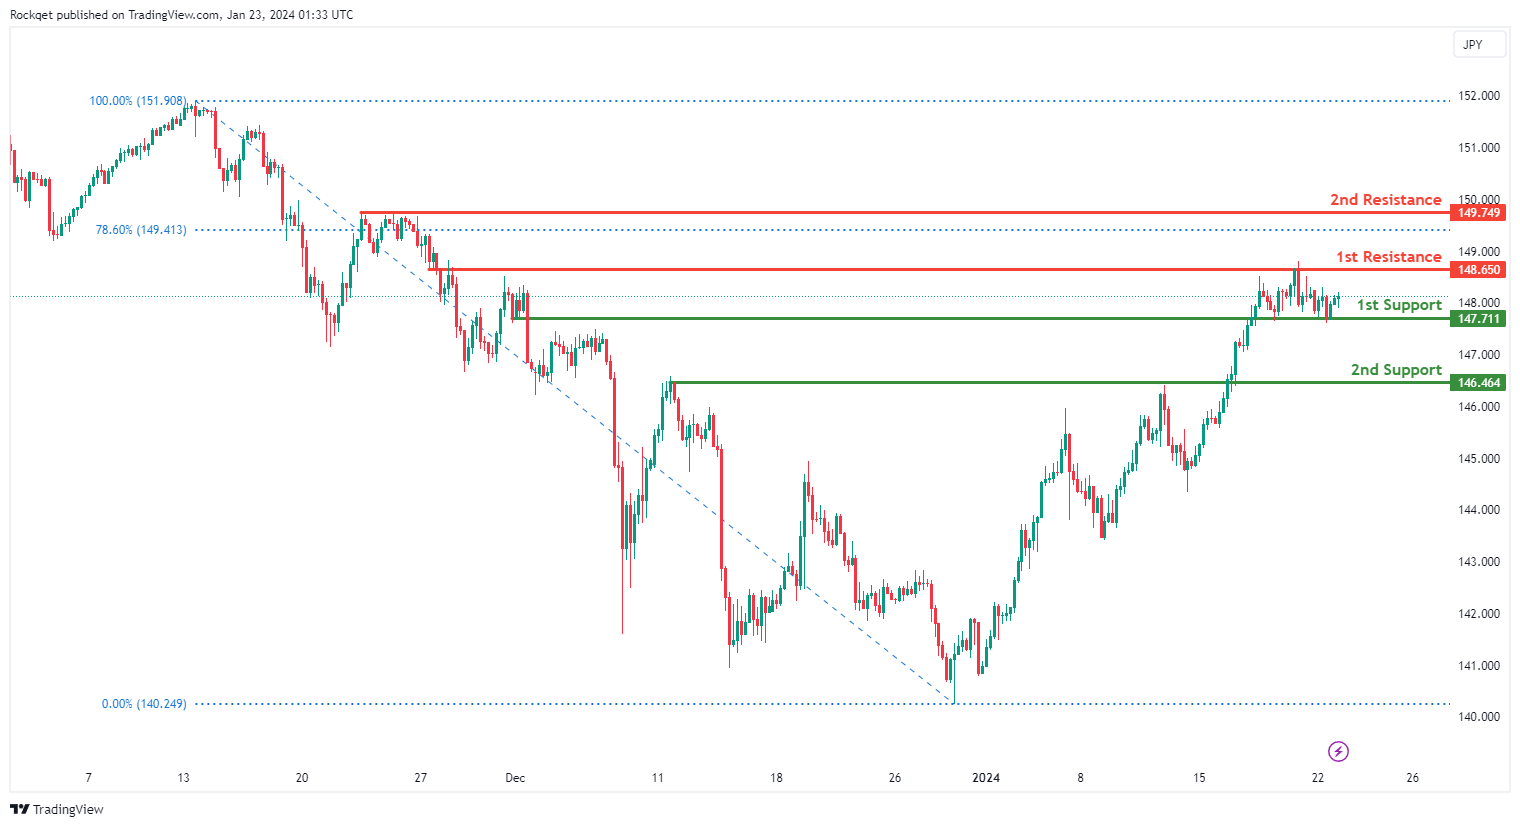
The USD/JPY chart currently exhibits an overall bullish momentum. In this context, there is a potential scenario for price to rise towards the 1st resistance.
The 1st resistance level at 148.65 is identified as an overlap resistance. Higher up, the 2nd resistance level at 149.74 is noted as a pullback resistance that aligns close to the 78.60% Fibonacci retracement level, further reinforcing its significance as a potential resistance zone.
To the downside, the 1st support level at 147.71 is identified as a pullback support. Further below, the 2nd support level at 146.46 is also marked as a pullback support, further reinforcing its importance as a key support level.
USD/CAD:
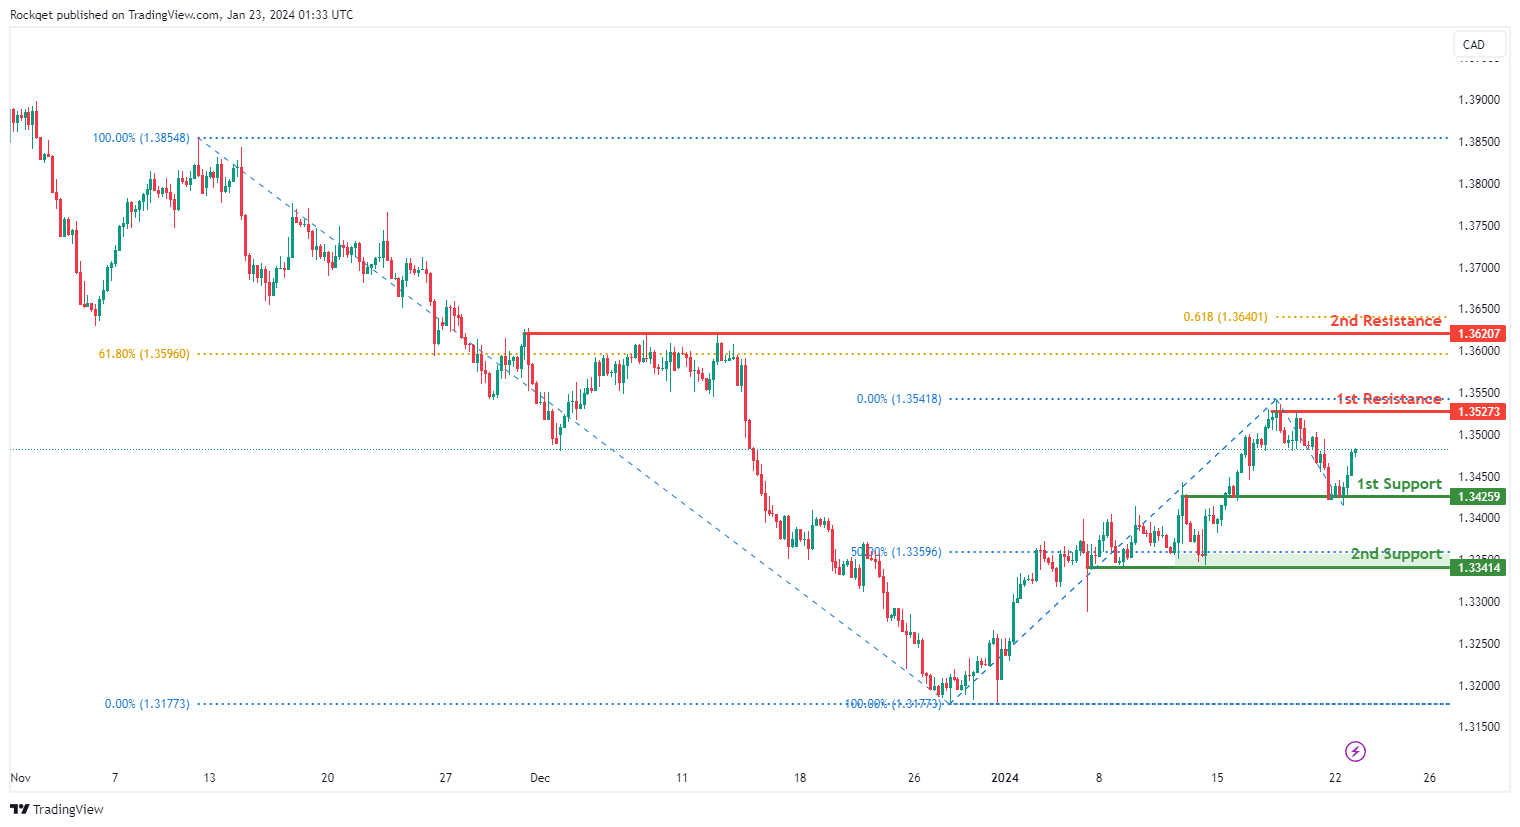
The USD/CAD chart currently exhibits an overall bullish momentum. In this context, there is a potential scenario for price to rise towards the 1st resistance.
The 1st resistance level at 1.3527 is identified as a pullback resistance. Higher up, the 2nd resistance level at 1.3620 is also noted as a pullback resistance that aligns close to a confluence of Fibonacci levels i.e. the 61.80% retracement and the 61.80% projection, further reinforcing its significance as a potential resistance zone.
To the downside, the 1st support level at 1.3425 is identified as an overlap support. Further below, the 2nd support level at 1.3341 is marked as a pullback support that aligns close to the 50.00% Fibonacci retracement level, further reinforcing its importance as a key support level.
AUD/USD:
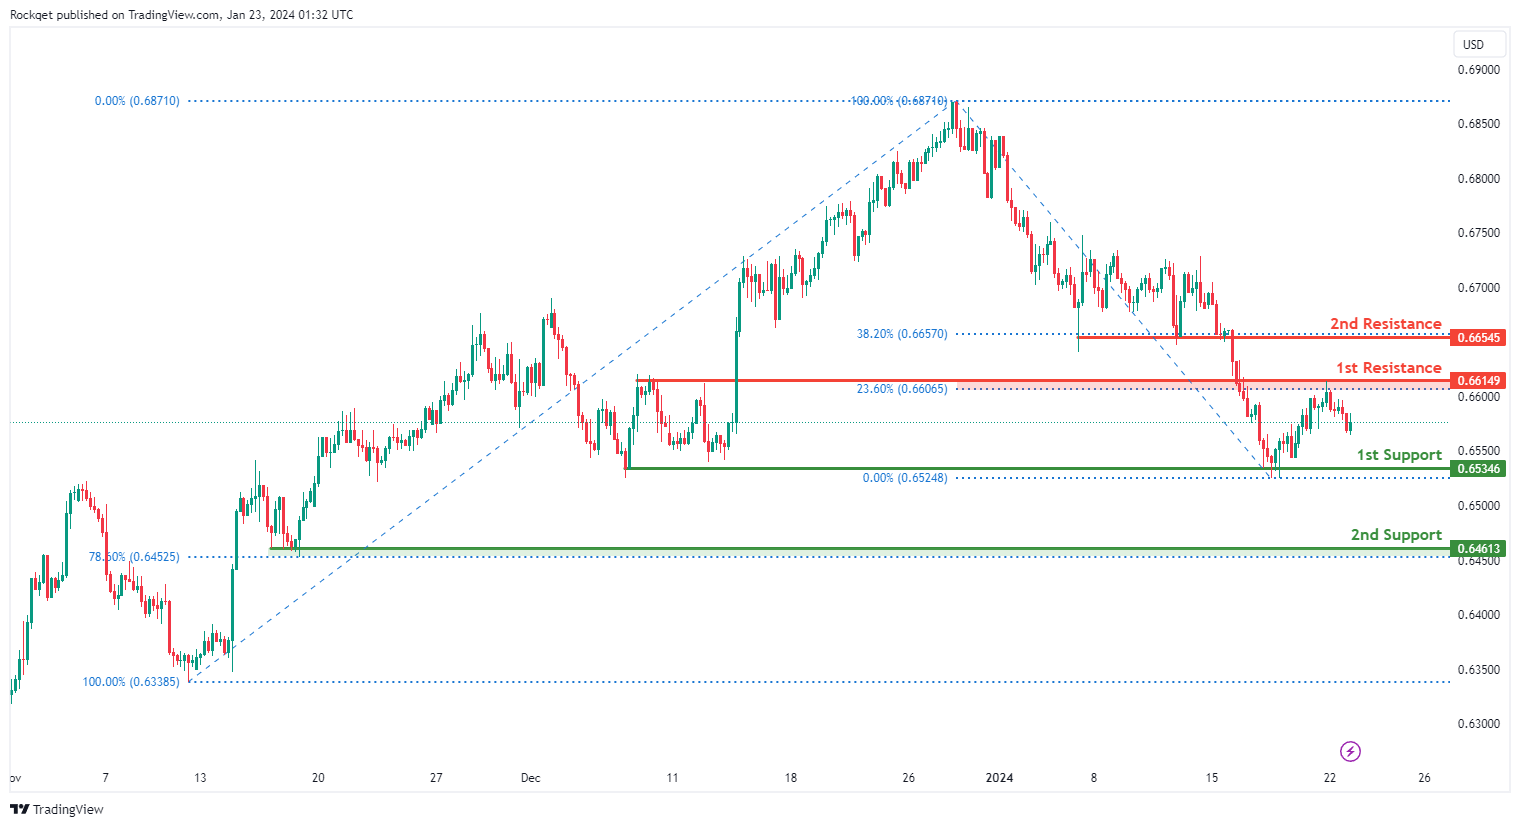
The AUD/USD chart currently exhibits an overall bearish momentum. In this context, there is a potential scenario for price to retrace higher towards the 1st resistance before resuming the downtrend.
The 1st resistance level at 0.6614 is identified as a pullback resistance that aligns with the 23.60% Fibonacci retracement level. Higher up, the 2nd resistance level at 0.6654 is also noted as a pullback resistance that aligns with the 38.20% Fibonacci retracement level, suggesting a potential barrier for further upside movement.
To the downside, the 1st support level at 0.6534 is identified as a pullback support. Further below, the 2nd support level at 0.6461 is also marked as a pullback support that aligns with the 78.60% Fibonacci retracement level, further reinforcing its importance as a key support level.
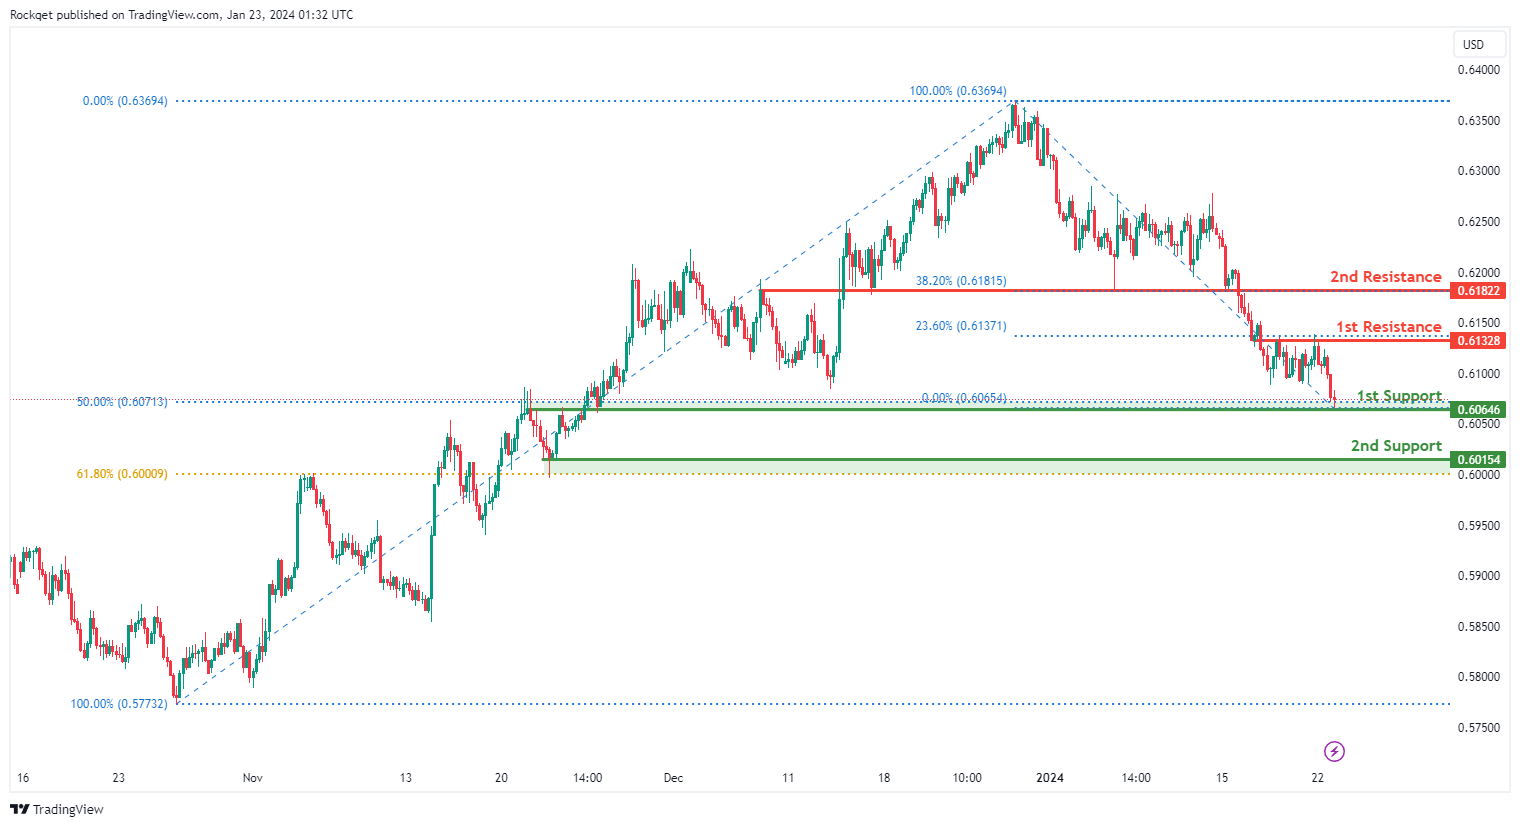
NZD/USD
The NZD/USD chart currently exhibits an overall bearish momentum. In this context, there is a potential scenario for price to retrace higher towards the 1st resistance before resuming the downtrend.
The 1st resistance level at 0.6132 is identified as an overlap resistance that aligns with the 23.60% Fibonacci retracement level. Higher up, the 2nd resistance level at 0.6182 is also noted as an overlap resistance that aligns with the 38.20% Fibonacci retracement level, suggesting a potential barrier for further upside movement.
To the downside, the 1st support level at 0.6064 is identified as an overlap support that aligns close to the 50.00% Fibonacci retracement level. Further below, the 2nd support level at 0.6015 is marked as a pullback support that aligns close to the 61.80% Fibonacci retracement level, further reinforcing its importance as a key support level.
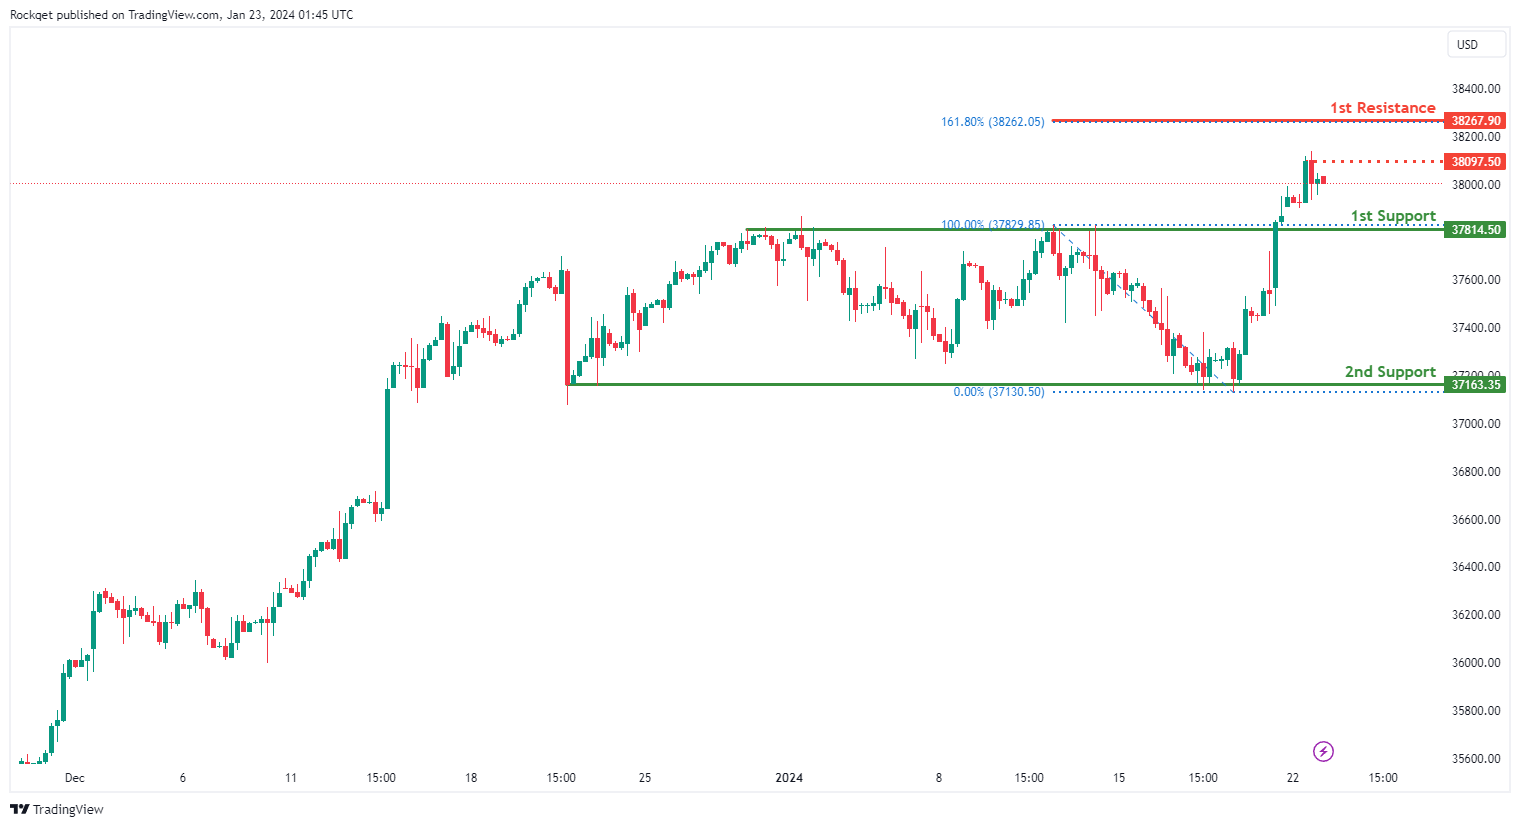
DJ30:
The DJ30 chart currently displays a neutral overall momentum, indicating a lack of a clear trend direction. There is a potential scenario where the price could fluctuate between the 1st resistance and 1st support levels.
The 1st support at 37814.50 is considered favorable as it is identified as a pullback support, suggesting historical significance as a level where buying interest has previously emerged. Additionally, the 2nd support at 37163.35 is recognized as a multi-swing low support, providing additional strength to the support zone.
On the resistance side, the intermediate resistance at 38097.50 is identified as a pullback resistance, suggesting a level where selling interest may be observed. Furthermore, the 1st resistance at 38267.90 is noteworthy for the presence of the 161.80% Fibonacci Extension, adding significance to this potential resistance level.
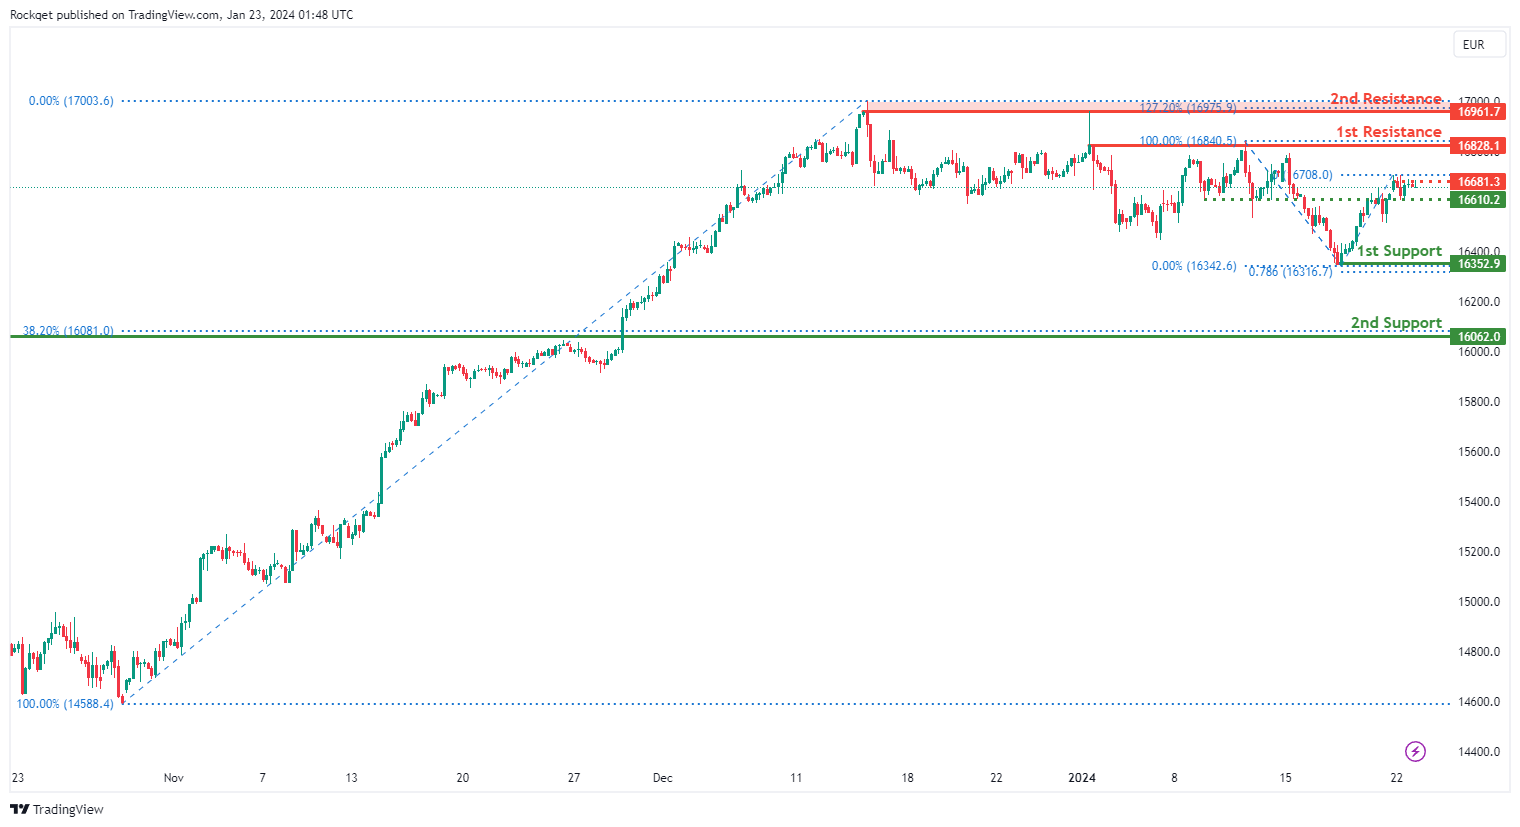
GER40:
The GER40 chart currently exhibits a weak bullish overall momentum with low confidence, indicating a tentative upward bias. Several factors contribute to this weak bullish momentum, and as a result, the price could potentially make a bullish continuation towards the 1st resistance.
The intermediate support at 16610.20 is recognized as a pullback support, suggesting a level where buying interest may emerge. Additionally, the 1st support at 16352.90 is considered favorable as a multi-swing low support, indicating historical significance as a level where buyers have been active. This support level also aligns with the 78.60% Fibonacci Projection, adding confluence to its potential as a support zone.
On the resistance side, the 1st resistance at 16828.10 is identified as a multi-swing high resistance, suggesting a historical point where selling interest has emerged. The 2nd resistance at 16961.70 is noteworthy for the presence of the 127.20% Fibonacci Extension, adding significance to this potential resistance level.
Furthermore, the intermediate resistance at 16681.30 is recognized as a pullback resistance, suggesting a level where selling interest may be observed, and it corresponds to the 78.60% Fibonacci Retracement.
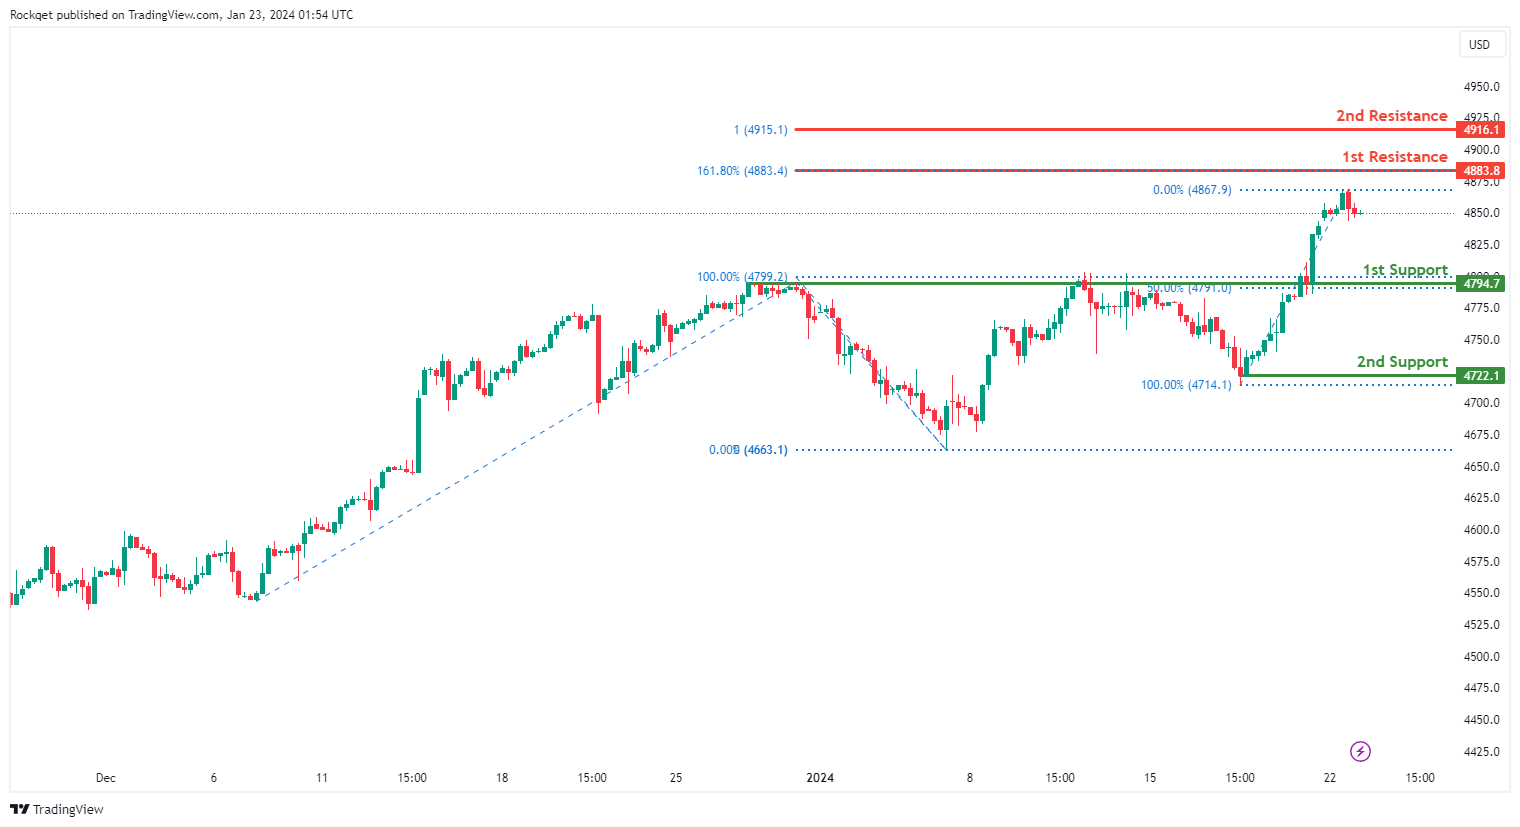
US500:
The US500 chart currently demonstrates a weak bullish overall momentum with low confidence, suggesting a tentative upward bias. Several factors contribute to this weak bullish momentum, and as a result, the price could potentially make a bullish continuation towards the 1st resistance.
The 1st support at 4794.7 is considered favorable due to its identification as an overlap support and coincides with the 50% Fibonacci Retracement, indicating historical significance as a level where buying interest has previously emerged. Additionally, the 2nd support at 4722.1 is recognized as a swing low support, providing additional strength to the support zone.
On the resistance side, the 1st resistance at 4883.8 is identified as a potential level for selling interest, and it corresponds to the 161.80% Fibonacci Extension, adding significance to this potential resistance level. Moreover, the intermediate resistance at 4818.4 is recognized for the presence of the 100% Fibonacci Projection, providing additional confluence to the potential resistance zone.
BTC/USD:
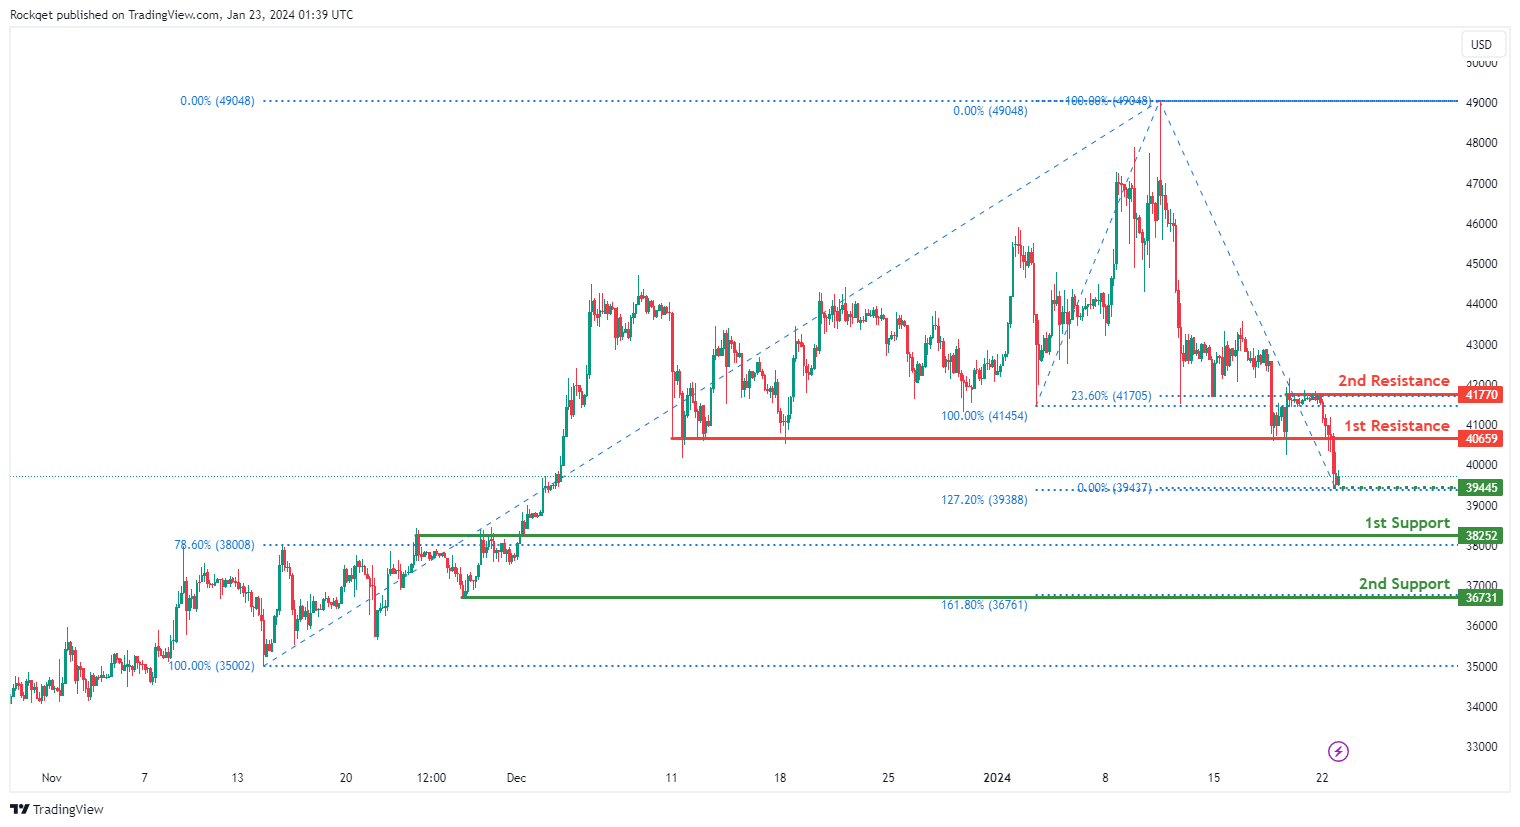
The BTC/USD chart currently exhibits a bearish overall momentum, indicating a downward trend in prices. There are several key levels that traders should pay attention to, suggesting a potential bearish continuation.
The 1st support at 38252 is identified as a critical level due to its designation as an overlap support and aligns with the 78.60% Fibonacci Retracement. This level has historical significance, representing a strong area where buying interest has previously emerged. Additionally, the 2nd support at 36731 is recognized as a swing low support and coincides with the 161.80% Fibonacci Extension, adding further strength to the support zone.
On the resistance side, the 1st resistance at 40659 is noted as a level where selling interest may intensify. This level corresponds to a pullback resistance, suggesting potential barriers to upward movement. Furthermore, the 2nd resistance at 41770 is significant for being a multi-swing high resistance and aligns with the 23.60% Fibonacci Retracement, providing additional confluence to this potential resistance zone.
ETH/USD:
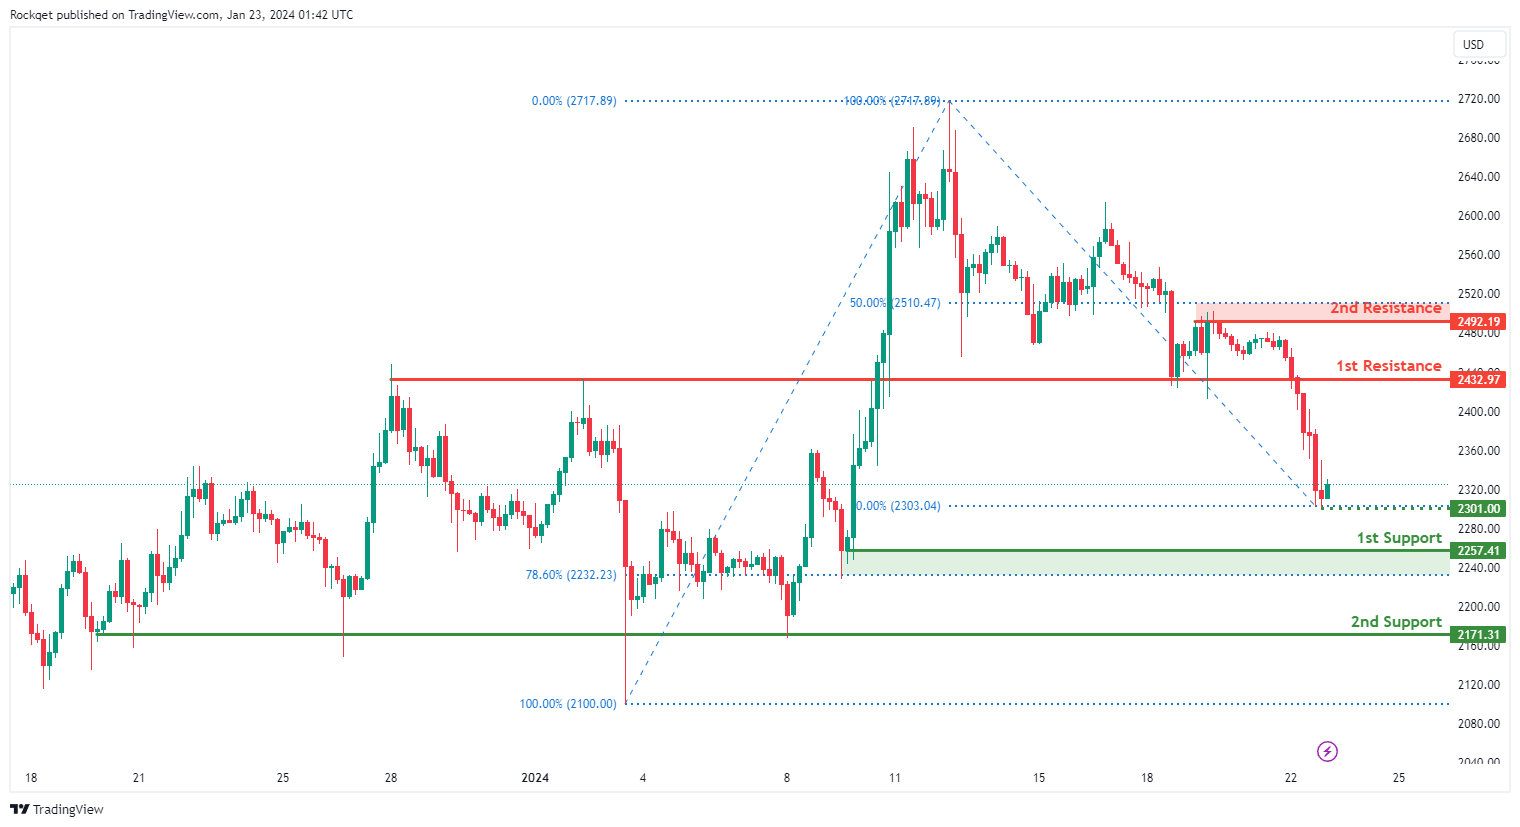
The ETH/USD chart currently displays a bearish overall momentum, suggesting a downward trend in prices. Traders should take note of key levels indicating a potential bearish continuation.
The 1st support at 2257.41 is considered a crucial level as it is identified as a pullback support and coincides with the 78.60% Fibonacci Retracement. This level holds historical significance, indicating a strong area where buying interest has previously emerged. Additionally, the 2nd support at 2171.31 is recognized as a multi-swing low support, providing added strength to the support zone.
On the resistance side, the 1st resistance at 2432.97 represents a level where selling interest may intensify. This level corresponds to an overlap resistance, suggesting potential barriers to upward movement. Furthermore, the 2nd resistance at 2492.19 is noteworthy for being a pullback resistance and aligns with the 50% Fibonacci Retracement, adding confluence to this potential resistance zone.
An intermediate support level at 2301.00 is also highlighted as a swing low support, providing an additional reference point for potential price reactions.
WTI/USD:
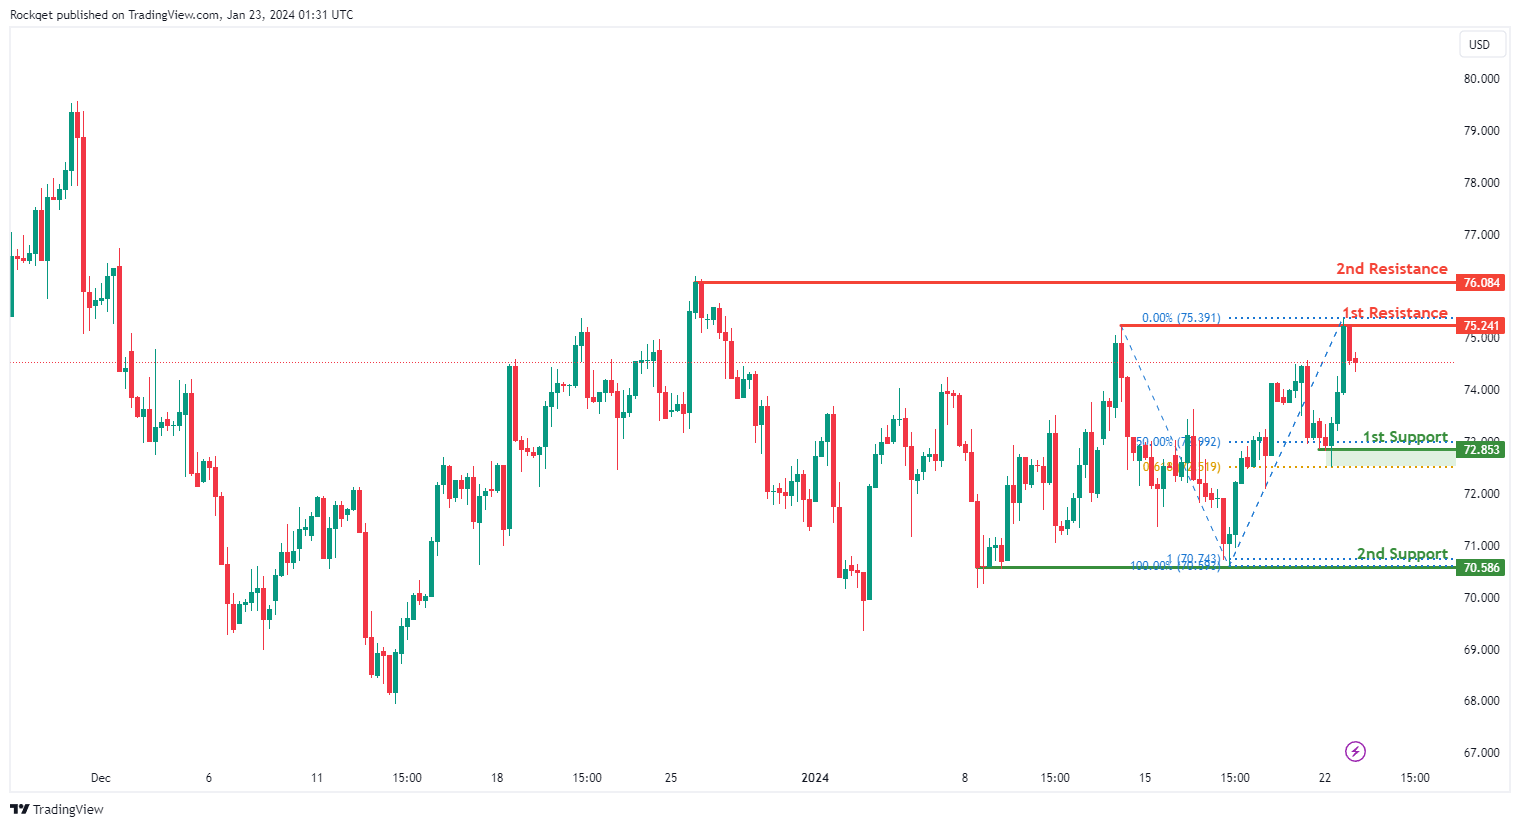
The WTI (West Texas Intermediate) chart currently exhibits a neutral bias. In this context, there is a potential scenario for price to fluctuate between the 1st resistance and the 1st support.
The 1st resistance level at 75.24 is identified as a pullback resistance. Higher up, the 2nd resistance level at 76.08 is also noted as a swing-high resistance, suggesting a potential barrier for further upside movement.
To the downside, the 1st support level at 72.85 is identified as a pullback support that aligns with a confluence of Fibonacci levels i.e. the 50.0% retracement and the 61.80% projection. Further below, the 2nd support level at 70.58 is marked as a pullback support, further reinforcing its importance as a key support level.
XAU/USD (GOLD):
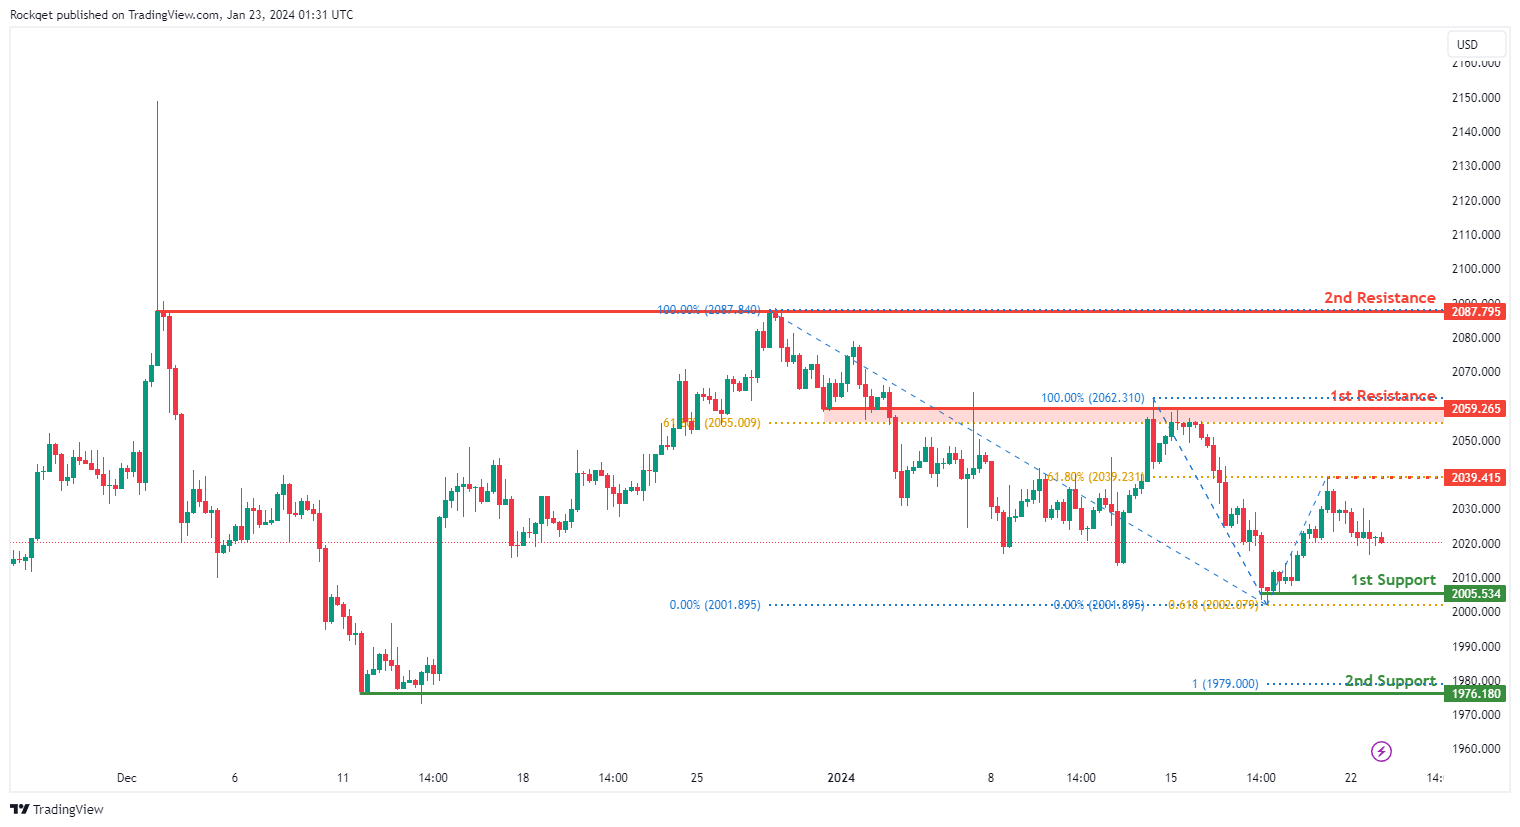
The XAUUSD (Gold/US Dollar) chart presently displays an overall bearish momentum. In this context, there is a potential scenario for price to fall towards the 1st support.
The 1st support level at 2,005.53 is recognized as a pullback support that aligns with the 61.80% Fibonacci projection level. Further below, the 2nd support level at 1,976.18 is categorized as a swing-low support that aligns with the 100.00% Fibonacci projection level, further reinforcing its importance as a key support level.
To the upside, the intermediate resistance level at 2,039.41 is identified as a pullback resistance that aligns with the 61.80% Fibonacci retracement level while the 1st resistance level at 2,059.26 is noted as an overlap resistance that aligns with the 61.80% Fibonacci retracement level. Higher up, the 2nd resistance level at 2,087.79 is marked as a multi-swing-high resistance, signifying its significance as a potential hurdle for further upward price movement.