Sample Category Title
EUR/USD Mid-Day Outlook
Daily Pivots: (S1) 1.0877; (P) 1.0888; (R1) 1.0908; More...
EUR/USD is extending the consolidation from 1.0843 temporary low, and intraday bias stays neutral. Further decline is expected as long as 1.0995 resistance holds. Below 1.0843 will target 1.0722 support next. Decisive break there will argue that whole rise from 1.0447 has completed, and target this low.
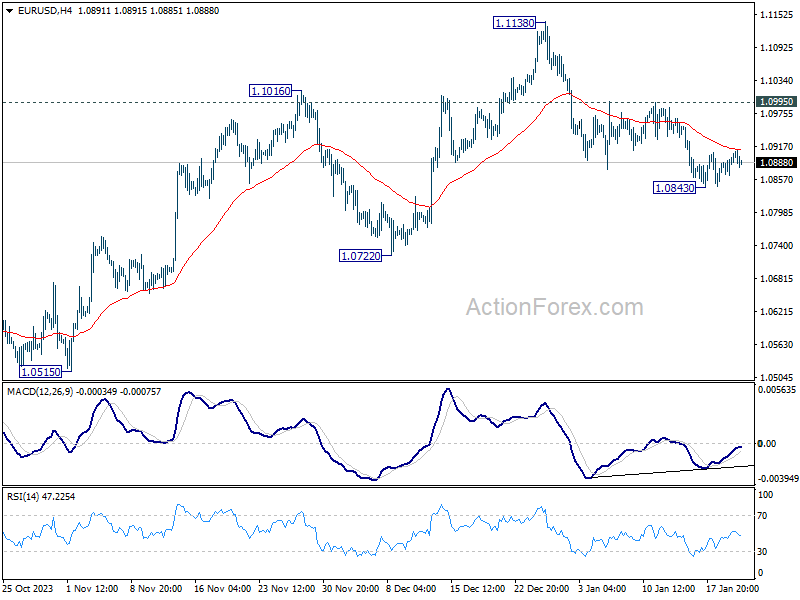
In the bigger picture, price actions from 1.1274 are viewed as a corrective pattern to rise from 0.9534 (2022 low). Rise from 1.0447 is seen as the second leg. While further rally could cannot be ruled out, upside should be limited by 1.1274 to bring the third leg of the pattern. Meanwhile, sustained break of 1.0722 support will argue that the third leg has already started for 1.0447 and below.
GBP/USD Mid-Day Outlook
Daily Pivots: (S1) 1.2672; (P) 1.2694; (R1) 1.2725; More...
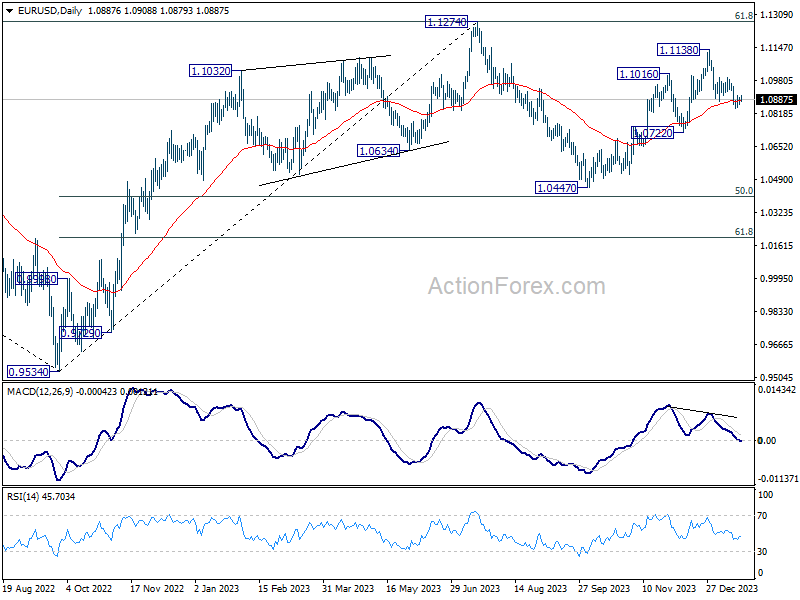
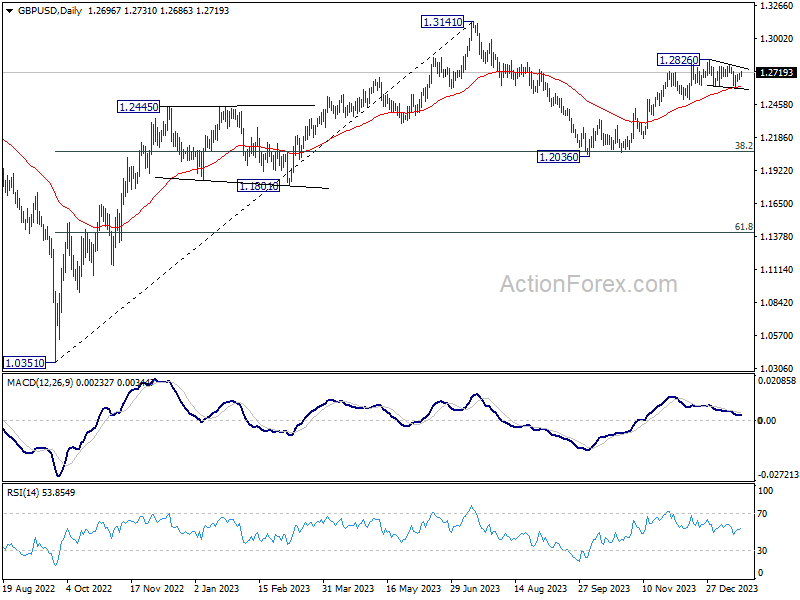
GBP/USD is still extending the consolidation pattern from 1.2826 and intraday bias stays neutral. Break of 1.2595 support will target 1.2499 support. On the upside, however, firm break of 1.2784 resistance will suggest that the consolidation pattern has completed. Further rally should then resume through 1.2826 towards 1.3141 high.
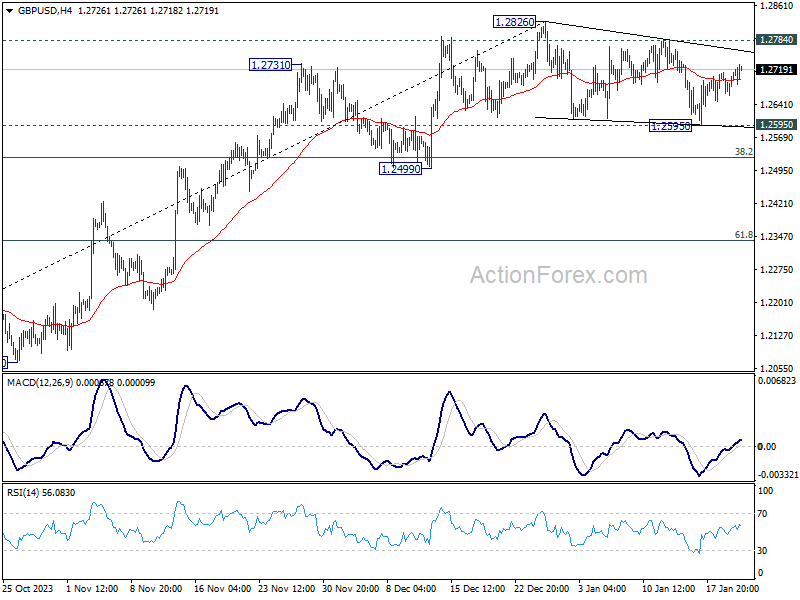
In the bigger picture, price actions from 1.3141 medium term top are seen as a corrective pattern to up trend from 1.0351 (2022 low). Rise from 1.2036 is seen as the second leg that's in progress. Upside should be limited by 1.3141 to bring the third leg of the pattern. Meanwhile, break of 1.2499 support will argue that the third leg has already started for 38.2% retracement of 1.0351 (2022 low) to 1.3141 at 1.2075 again.
USD/CHF Mid-Day Outlook
Daily Pivots: (S1) 0.8666; (P) 0.8685; (R1) 0.8700; More....
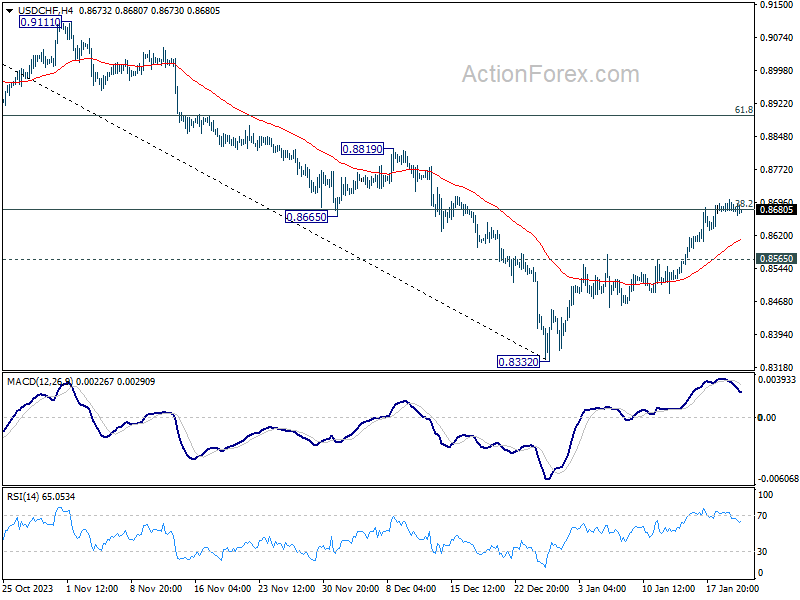
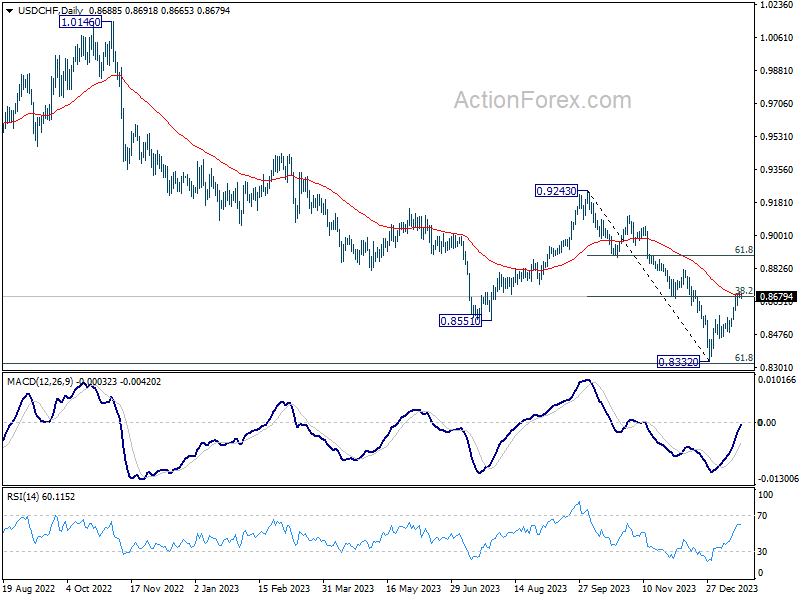
Intraday bias in USD/CHF stays neutral, with focus on 38.2% retracement of 0.9243 to 0.8332 at 0.8680, which coincides 55 D EMA (now at 0.8687). Decisive break there will turn near term outlook bullish for 61.8% retracement 0.8995. Nevertheless, break of 0.8565 minor support will turn intraday bias back to the downside for retesting 0.8332 low.
In the bigger picture, while rebound from 0.8332 could be strong, there is no clear sign of medium term bottoming yet. This rebound is tentatively seen as a corrective move for now. Also, outlook will stay bearish as long as 0.9243 resistance holds. Larger down trend from 1.0146 (2022 high) should resume through 0.8332 low at a later stage.
USD/JPY Mid-Day Outlook
Daily Pivots: (S1) 147.74; (P) 148.28; (R1) 148.71; More...
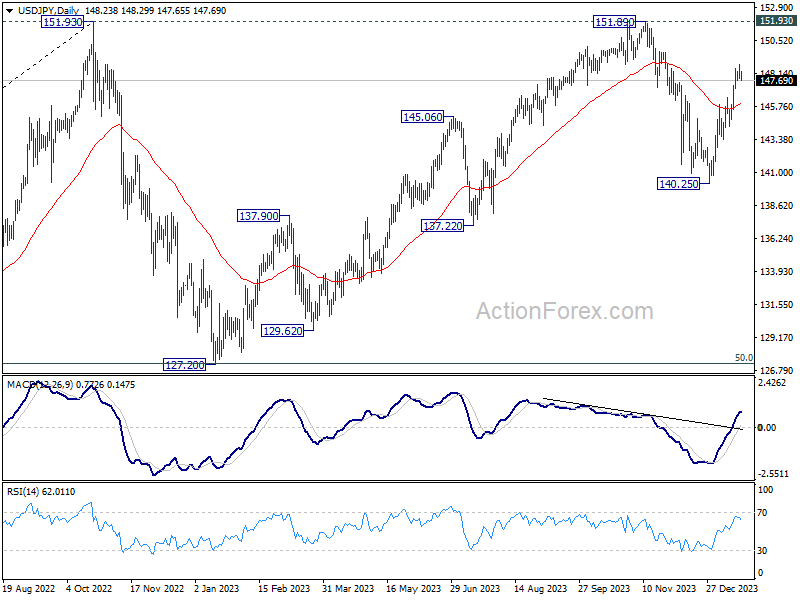
USD/JPY is extending the consolidation from 148.79 temporary top and intraday bias remains neutral. While deeper retreat cannot be ruled out, further rally is expected as long as 145.97 resistance turned support holds. Corrective fall from 151.89 should have completed at 140.25 already. Break of 148.79 will resume the rise from there for retesting 151.89/93 key resistance zone.
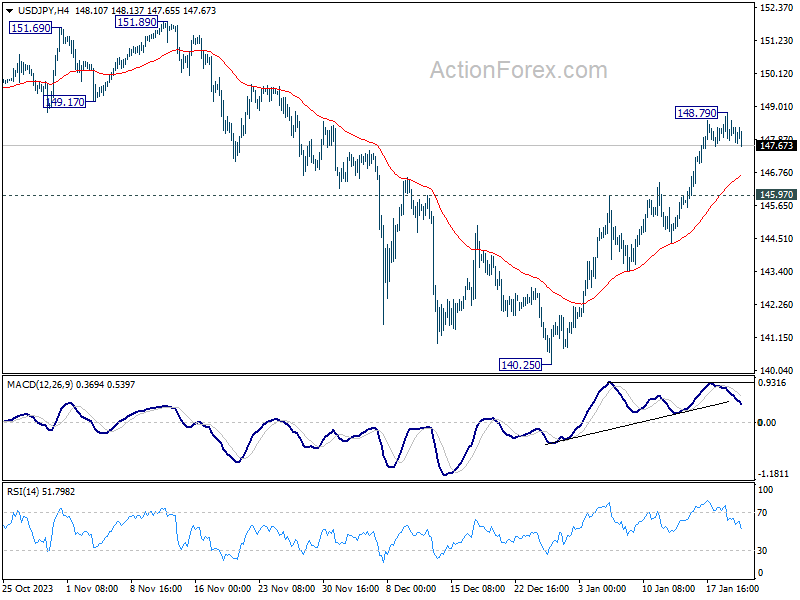
In the bigger picture, stronger than expected rebound from 140.25 dampened the original bearish review. Strong support from 55 W EMA (now at 141.89) is also a medium term bullish sign. Fall from 151.89 could be a correction to rise from 127.20 only. Decisive break of 151.89/93 will confirm resumption of long term up trend. This will now be the favored case as long as 140.25 support holds.
Yen Strengthens Modestly Ahead of BoJ Decision; Forex Markets Quiet
Yen trades mildly firmer in tight range today, as markets are now keenly awaiting BoJ rate decision in the upcoming Asian session. No change in monetary policy is expected as BoJ should stick to negative interest rate for now. There is also no need to tweak the parameters of Yield Curve Control, with the yield curve being smooth without any distortion.
A critical aspect of the BoJ meeting will be the new quarterly economic projections. The market is particularly interested in whether the central bank projects core inflation to remain around 2% target throughout the forecast period. This projection is a key prerequisite to continue speculating on a rate hike in April.
In the broader forex markets, trading activity has been relatively subdued today, with most major currency pairs and crosses remaining within the range set on Friday. Yen has emerged as the stronger one, followed by Sterling and New Zealand Dollar. On the weaker side, Euro, Australian Dollar, and Swiss Franc are lagging, while Dollar and Canadian are showing mixed performance.
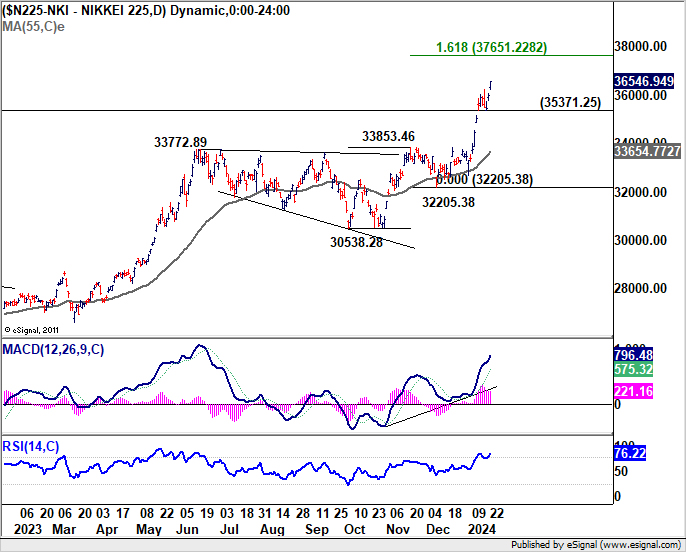
Technically, Nikkei's up trend resumed today and hit another 34-year high. Near term outlook will stay bullish as long as 35371.25 support holds. Next target is 161.8% projection of 30538.28 to 33853.46 from 32205.38 at 37651.22.
In Europe, at the time of writing, FTSE is up 0.07%. DAX is up 0.40%. CAC is up 0.39%. UK 10-year yield is down -0.0535 at 3.882. Germany 10-year yield is down -0.064 at 2.284. Earlier in Asia, Nikkei rose 1.62%. Hong Kong HSI fell -2.27%. China Shanghai SSE fell -2.68%. Singapore Strait Times fell -0.10%. Japan 10-year JGB yield is down -0.0152 at 0.654.
Silver tumbles amid rate cut expectation adjustments
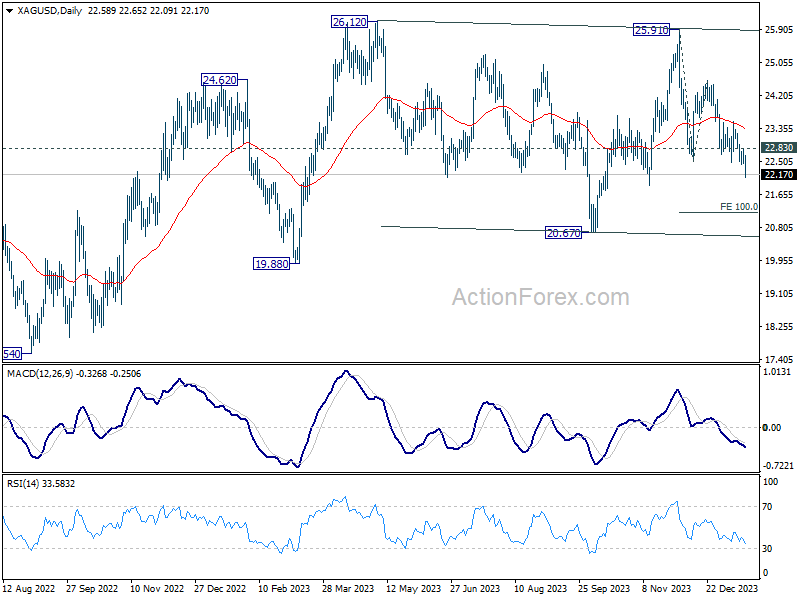
Silver falls steeply today as the decline from 25.91 resumes. This steep selloff in the precious metal is interpreted, at least partly, as a reaction to the recent market adjustments in global central bank rate cut expectations. With the anticipation of prolonged high interest rates, the opportunity cost of holding precious metals like Gold and Silver remains elevated, putting additional pressure on their prices.
Technically, near term outlook in Silver will stay bearish as long as 22.83 resistance holds. Next target is 100% projection of 25.91 to 22.50 from 24.59 at 21.18.
Price actions from 26.12 are seen as a sideway consolidation pattern from with decline 25.91 as the third leg. While break of 20.67 cannot be ruled out, strong support should be seen 19.88 and 20.67 to conclude the fall from 25.91, as well as the sideway pattern.
PBoC holds 1-yr and 5-yr LPR steady
People's Bank of China announced today that it would maintain one-year loan prime rate at 3.45%, a level unchanged since August last year. Similarly, five-year rate, critical for mortgage financing, remains steady at 4.2%, consistent since its last reduction in June. This decision follows PBoC's unexpected move last week to keep its medium-term lending facility rate stable.
PBoC's decision to hold rates steady comes amid a sluggish economic environment in China, coupled with increasing deflationary pressures. Despite these challenges, the central bank appears reluctant to employ interest rate reductions as a tool to stimulate the economy, primarily due to concerns over the depreciating Yuan. PBoC might continue to avoid further rate cuts until Yuan regains some stability, to prevent exacerbating the currency's depreciation.
USD/JPY Mid-Day Outlook
Daily Pivots: (S1) 147.74; (P) 148.28; (R1) 148.71; More...
USD/JPY is extending the consolidation from 148.79 temporary top and intraday bias remains neutral. While deeper retreat cannot be ruled out, further rally is expected as long as 145.97 resistance turned support holds. Corrective fall from 151.89 should have completed at 140.25 already. Break of 148.79 will resume the rise from there for retesting 151.89/93 key resistance zone.
In the bigger picture, stronger than expected rebound from 140.25 dampened the original bearish review. Strong support from 55 W EMA (now at 141.89) is also a medium term bullish sign. Fall from 151.89 could be a correction to rise from 127.20 only. Decisive break of 151.89/93 will confirm resumption of long term up trend. This will now be the favored case as long as 140.25 support holds.
Economic Indicators Update
| GMT | Ccy | Events | Actual | Forecast | Previous | Revised |
|---|---|---|---|---|---|---|
| 15:00 | USD | Leading Index M/M Dec | -0.30% | -0.50% |
ECB Meeting: Summer Rate Cut in Focus Amid Pushback by the Hawks
- ECB faces a communication challenge in first meeting of the year
- Timing of rate cut likely to dominate discussion, but hawks to resist
- Mixed messages unhelpful to euro ahead of the decision on Thursday (13:15 GMT)
- Flash PMIs on Wednesday (11:00 GMT) on the agenda too
Progress on inflation may be slowing
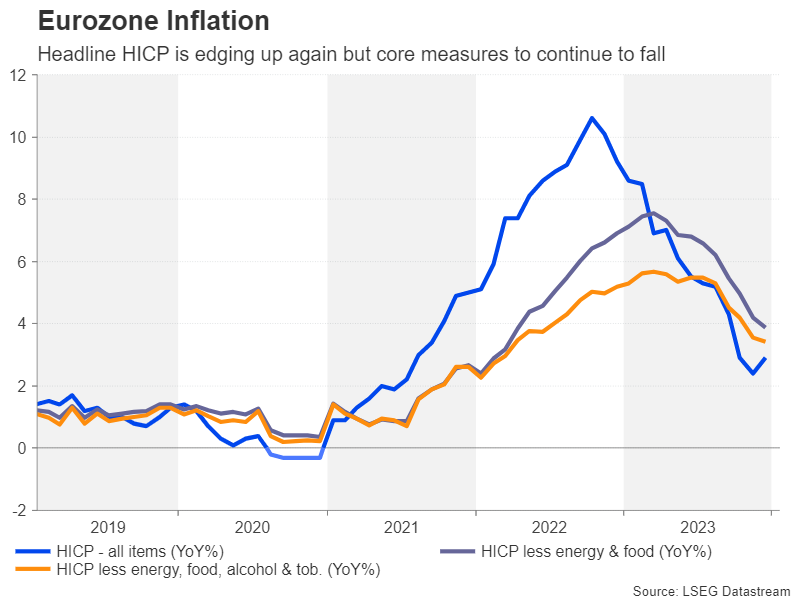
After inflation shot up to double digits in 2022, it’s fair to say that 2023 has been a more successful year for the European Central Bank. The annual rate of change in the Eurozone’s Harmonised Index of Consumer Prices (HICP) started the year at 8.6%. By December, it had fallen to 2.9%.
However, this was an uptick on November’s figure of 2.4%, marking the first increase since April. Policymakers expect this unwelcome reversal to continue in the first few months of 2024. With last year’s plunge in energy prices slowly dropping out of the calculations and energy subsidies across the bloc being phased out, HICP will likely soon pop back above 3.0%.
On the bright side, underlying inflation in the euro area has maintained its downward trajectory, so policymakers are reasonably confident that inflation is well on its way to hit their 2% target by 2025.
ECB wary of upside risks to inflation
There are risks, however. Wage growth in the Eurozone remains elevated despite sluggish economic growth. President Christine Lagarde has hinted that how the wage landscape evolves by late spring will be crucial to any decision on policy easing. But perhaps a bigger threat in the fight against inflation is the latest crisis in the Middle East.
The attacks by Houthi rebels on vessels passing through the Red Sea have intensified to the extent that many companies are suspending shipping through this route, instead rerouting ships around the Horn of Africa. This significantly increases the cost for European businesses importing goods from Asia. Without a de-escalation of tensions in the region, this temporary supply shock could turn into a major headache for the ECB.
Flash PMIs eyed as Eurozone on verge of recession
It’s likely therefore that policymakers will maintain their data-dependent approach on Thursday, while repeating that “policy rates will be set at sufficiently restrictive levels for as long as necessary”. In the absence of fresh macroeconomic projections at the January meeting, investors will turn to Lagarde’s press briefing at 13:45 GMT for an updated view on the economy and the inflation outlook.
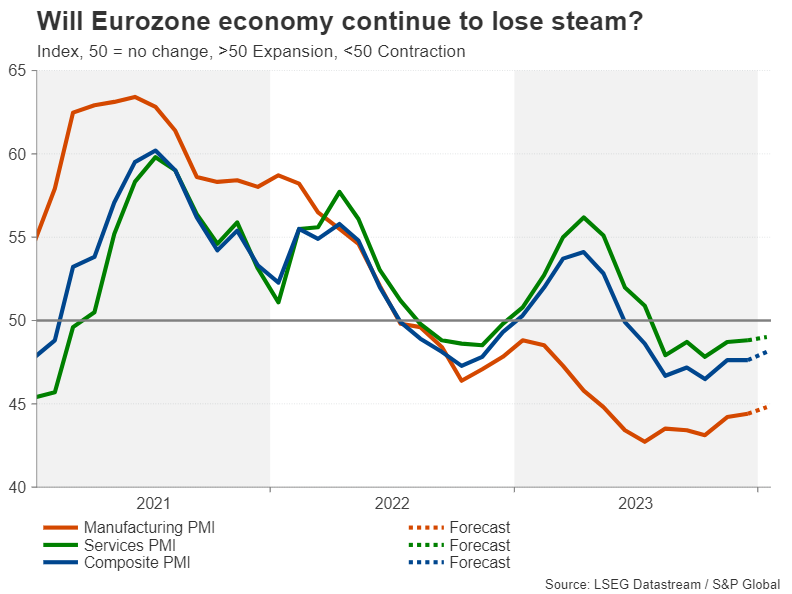
Recession risks have heightened again lately for the euro area, as business activity has failed to pick up substantially from the summer dip. The PMI surveys suggest Eurozone GDP is headed for a second consecutive quarter of contraction in the final three months of 2023. The flash readings for January are due a day before the ECB meeting and should they point to more misery for businesses at the start of the new year, the euro will probably go into the ECB decision on the backfoot.
Can euro’s uptrend stay intact?
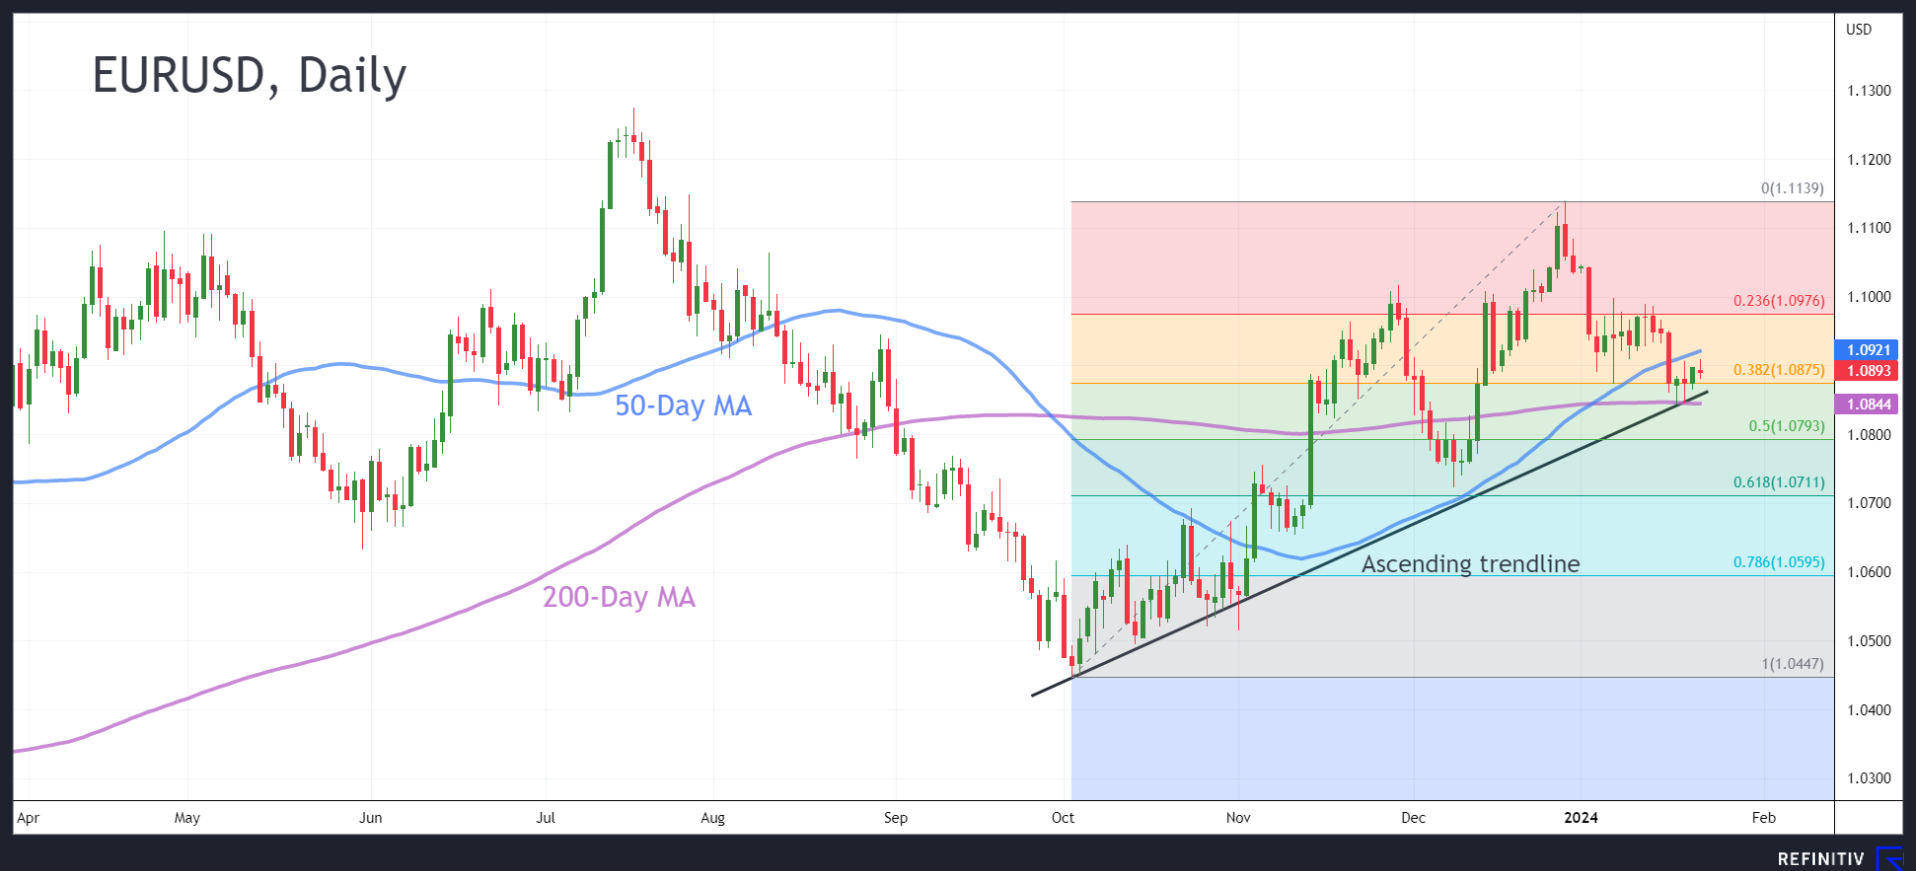
Gloomy PMI numbers and a not-so-hawkish tone by Lagarde would potentially be the worst outcome for the single currency this week. The euro could breach its medium-term ascending trendline in such a scenario, which would set the stage for a test of the 50.0% and 61.8% Fibonacci retracement levels of this upleg at $1.0793 and $1.0711, respectively.
Alternatively, if Lagarde draws attention to June as the earliest time when policymakers will have enough data to consider whether rates should be cut, euro/dollar could stabilize around its 200-day moving average (MA) in the $1.0845 region. But for the pair to recover, Lagarde would need to additionally throw cold water on the prospect of the ECB slashing rates by anywhere near as much as what markets have priced in. Even after the latest pushbacks, cumulative bets for 2024 stand at 130 basis points. An improvement in the PMIs would also be essential for a euro rally.
Any rebound in euro/dollar could stretch towards the December peak of $1.1139, with obstacles likely to be found at the 50-day MA near $1.0920 and the 23.6% Fibonacci of $1.0976.
Davos deals a blow to dovish bets
ECB officials attending the World Economic Forum in Davos last week signalled they’re open to rate cuts in the summer if inflation stays on the right path, with Lagarde throwing her weight behind this timeline too. The more hawkish members of the Governing Council have been somewhat more reluctant to commit to a specific timeframe. But what is increasingly certain is that any hope of a March pivot has been dashed, and until the ECB is ready to flag its first rate cut, the euro could end up drifting sideways.
Forex and Cryptocurrencies Forecast
EUR/USD: Reasons Behind the Dollar's Strengthening
The past week was notably sparse in terms of macroeconomic statistics. Consequently, the market participants' sentiment largely depended on the statements made at the World Economic Forum in Davos (WEF). It's worth noting that this event, held annually at a ski resort in Switzerland, gathers representatives of the global elite from over 120 countries. There, amidst the sparkling, crystal-clear snow glistening in the sunlight, the world's power players discuss economic issues and international politics. This year, the 54th edition of the forum took place from January 15 to 19.
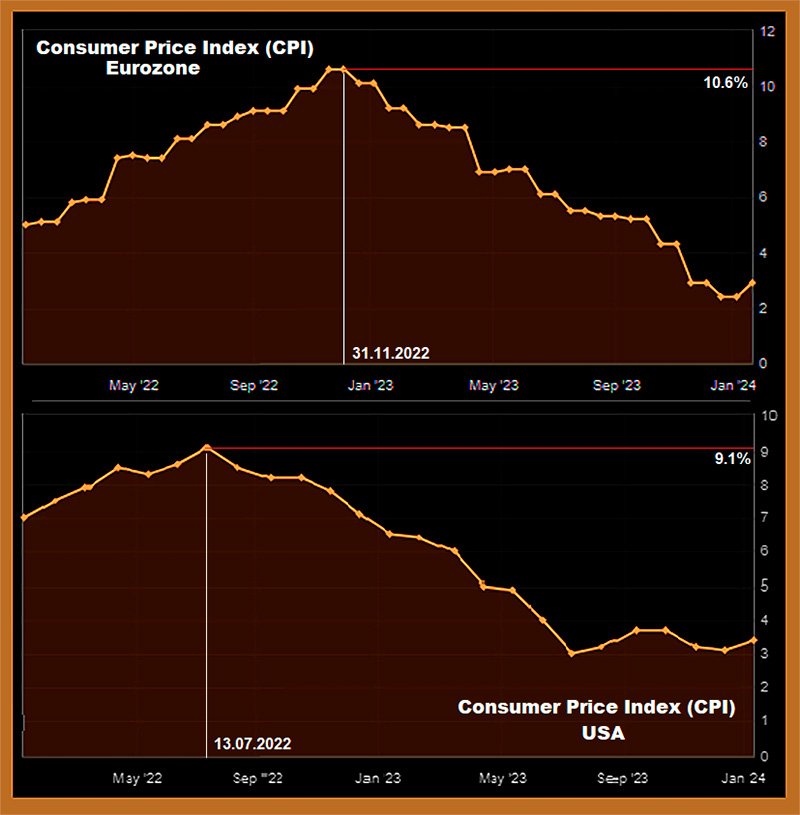
Speaking at the World Economic Forum on January 16, the President of the European Central Bank, Christine Lagarde, expressed her confidence that inflation would reach the target level of 2.0%. This statement did not raise any doubts, as the Consumer Price Index (CPI) in the Eurozone shows a steady decline. From a level of 10.6% at the end of 2022, the CPI has now fallen to 2.9%. Isabel Schnabel, a member of the ECB's Executive Board, did not rule out the possibility of a soft landing for the European economy and a return to the target inflation level by the end of 2024.
According to a Reuters survey of leading economists on the future monetary policy of the ECB, the majority expect the regulator to lower interest rates as early as the second quarter, with 45% of respondents believing that this decision will be made at the June meeting.
On the other hand, inflation in the United States has been unable to surpass the 3.0% mark since July 2023. The figures published on January 11th showed that the annual Consumer Price Index (CPI) increased by 3.4%, which was above the consensus forecast of 3.2% and the previous value of 3.1%. In monthly terms, consumer inflation also rose, registering at 0.3% against a forecast of 0.2% and a previous value of 0.1%.
In light of this, and considering that the U.S. economy appears quite stable, the likelihood of the Federal Reserve lowering interest rates in March started to diminish. This shift in sentiment led to a slight strengthening of the dollar, moving EUR/USD from the 1.0900-1.1000 range to the 1.0845-1.0900 zone. Additionally, the weak performance of the Asian stock markets exerted some pressure on the European currency.
According to economists at the Dutch Rabobank, long positions on the euro may face further challenges. This could happen if Donald Trump continues his movement towards a potential second term in the White House. "Although President Biden's Inflation Reduction Act meant that the past four years were not always easy for Europe, Trump's stance on NATO, Ukraine, and possibly climate change could prove costly for Europe and enhance the appeal of the U.S. dollar as a safe asset," the Rabobank experts write. "Based on this, we see a possibility of EUR/USD falling to 1.0500 in a three-month perspective."
EUR/USD closed last week at 1.0897. Currently, the majority of experts predict a rise in the U.S. dollar in the near future. 60% voted in favour of the dollar's strengthening, 20% sided with the euro, and the remaining 20% took a neutral stance. Oscillator readings on the D1 chart confirm the analysts' forecast: 80% are coloured red, indicating a bearish trend, and 20% are in neutral grey. Among the trend indicators, there is a 50/50 split between red (bearish) and green (bullish) signals.
The nearest support levels for the pair are located in the zones of 1.0845-1.0865, followed by 1.0725-1.0740, 1.0620-1.0640, 1.0500-1.0515, and 1.0450. On the upside, the bulls will face resistance at 1.0905-1.0925, 1.0985-1.1015, 1.1110-1.1140, 1.1230-1.1275, 1.1350, and 1.1475.
Unlike the past week, the upcoming week promises to be more eventful. On Tuesday, January 23, we will see the publication of the Eurozone Bank Lending Survey. Wednesday, January 24, will bring a deluge of preliminary statistics on business activity (PPI) in various sectors of the German, Eurozone, and U.S. economies. The main event on Thursday, January 25, will undoubtedly be the European Central Bank's meeting, where a decision on the interest rate will be made. It is expected to remain at the current level of 4.50%. Investors will therefore be paying close attention to what the ECB leaders say at the subsequent press conference. For reference, the FOMC meeting of the Federal Reserve is scheduled for January 31. Additionally, on January 25, we will learn about the GDP and unemployment data in the United States, and the following day, data on personal consumption expenditures of residents of this country will be released.
GBP/USD: High Inflation Leads to High Rates and a Stronger Pound
Unlike the United States and the Eurozone, there was a significant amount of important statistics released last week concerning the state of the British economy. On Wednesday, January 17, traders were focused on the December inflation data. The data revealed that the Consumer Price Index (CPI) in the United Kingdom rose from -0.2% to 0.4% month-on-month (against a consensus forecast of 0.2%) and reached 4.0% year-on-year (compared to the previous value of 3.9% and expectations of 3.8%). The core CPI remained at the previous level of 5.1% year-on-year.
Following the release of the report showing inflation growth, UK Prime Minister Rishi Sunak moved quickly to reassure the markets. He stated that the government's economic plan remains correct and continues to work, having reduced inflation from 11% to 4%. Sunak also noted that wages in the country have been growing faster than prices for five months, suggesting that the trend of weakening inflationary pressure will continue.
Despite this optimistic statement, many market participants believe that the Bank of England (BoE) will postpone the start of easing its monetary policy until the end of the year. "Concerns that the disinflation process might slow down have likely intensified as a result of the latest inflation data," economists at Commerzbank write. "The market will probably bet on the Bank of England responding accordingly and, therefore, being more cautious regarding the first interest rate cut."
Clearly, if the BoE does not rush to ease monetary policy, this will create ideal conditions for the long-term strengthening of the British pound. This prospect already allowed the GBP/USD pair to bounce off the lower boundary of its five-week channel at 1.2596 on January 17th, rising to the channel's midpoint at 1.2714.
It is quite possible that GBP/USD would have continued its upward trajectory, but it was hindered by weak retail sales data in the United Kingdom, which were published at the end of the workweek on Friday, January 19th. The data showed a decline in this indicator by 4.6%, from +1.4% in November to -3.2% in December (against a forecast of -0.5%). If the upcoming Purchasing Managers' Indexes and business activity indicators, due to be released on January 24th, paint a similar picture, it could exert even more pressure on the pound. The Bank of England might fear that a stringent monetary policy could overly decelerate the economy and might consider easing it. According to analysts at ING (Internationale Nederlanden Groep), a reduction in the key interest rate by 100 basis points could lead to GBP/USD falling to the 1.2300 zone over a one to three-month horizon.
ING analysts also believe that the UK budget announcement on March 6 will significantly impact the pound, with tax cuts on the agenda. "Unlike in September 2022," the experts write, "we believe this will be a real tax cut, financed by the reduced cost of debt servicing. This could add 0.2-0.3% to the UK's GDP this year and lead to the Bank of England maintaining higher rates for a longer period."
GBP/USD ended the last week at 1.2703. Looking ahead to the coming days, 65% voted for the pair's decline, 25% were in favour of its rise, and 10% preferred to remain neutral. Contrary to the specialists' opinions, the trend indicators on D1 show a preference for the British currency: 75% indicate a rise in the pair, while 25% point to a decline. Among the oscillators, 25% are in favor of the pound, the same proportion (25%) for the dollar, and 50% hold a neutral position. If the pair moves southward, it will encounter support levels and zones at 1.2650, 1.2595-1.2610, 1.2500-1.2515, 1.2450, 1.2330, 1.2210, 1.2070-1.2085. In case of an upward movement, the pair will meet resistance at 1.2720, 1.2785-1.2820, 1.2940, 1.3000, and 1.3140-1.3150.
No significant events related to the United Kingdom's economy are anticipated for the upcoming week, other than the previously mentioned events. The Bank of England's next meeting is scheduled for Thursday, February 1.
USD/JPY: The 'Moon Mission' Continues
According to data published by the Japanese Statistics Bureau on Friday, January 19, Japan's National Consumer Price Index (CPI) for December was 2.6% year-on-year, compared to 2.8% in November. The National CPI, excluding fresh food, was 2.3% year-on-year in December, down from 2.5% the previous month.
Given that inflation is already decreasing, the question arises: why raise the interest rate? The logical answer: there is no need. This is why the market's consensus forecast suggests that the Bank of Japan (BoJ) will leave the rate unchanged at its meeting on Tuesday, January 23rd, maintaining it at the negative level of -0.1%. (It is worth remembering that the last time the regulator changed the rate was eight years ago, in January 2016, when it was lowered by 200 basis points.).
As usual, Japan's Finance Minister Shunichi Suzuki made another round of verbal interventions on Friday, and as usual, he said nothing new. "We are closely monitoring currency movements," "Forex market movements are determined by various factors," "it's important for the currency to move stably, reflecting fundamental indicators": these are statements that market participants have heard countless times. They no longer believe that the country's financial authorities will move from persuasion to real action. As a result, the yen continued to weaken, and USD/JPY continued its upward movement. (Interestingly, this aligns precisely with the wave analysis we provided two weeks ago.)
The past week's high for USD/JPY was recorded at 148.80, with the week closing near that level at 148.14. In the near future, 50% of experts anticipate further strengthening of the dollar, 30% are siding with the yen, and 20% hold a neutral position. As for the trend indicators and oscillators on D1, all 100% point north, though a quarter of the latter are in the overbought zone. The nearest support level is located in the 147.65 area, followed by 146.90-147.15, 146.00, 145.30, 143.40-143.65, 142.20, 141.50, and 140.25-140.60. Resistance levels are set in the following areas and zones: 148.50-148.80, 149.85-150.00, 150.80, and 151.70-151.90.
In addition to the Bank of Japan's meeting, another significant event related to the Japanese economy to note for the upcoming week is the publication of the Consumer Price Index (CPI) data for the Tokyo region, which is scheduled for Friday, January 26.
CRYPTOCURRENCIES: Numerous Predictions, Uncertain Outcome
Last week, the long-awaited regulatory saga finally concluded: as expected, on January 10th, the U.S. Securities and Exchange Commission (SEC) approved a batch of all 11 applications from investment companies to launch spot exchange-traded funds (ETFs) based on bitcoin. This news initially caused a spike in bitcoin's price to around $49,000. However, the cryptocurrency then depreciated by about 15%, falling to $41,400. Experts cite overbought conditions or what is known as "market overheating" as the main reason for this decline. As Cointelegraph reports, the SEC's positive decision was already factored into the market price. In 2023, bitcoin had grown 2.5 times, with a significant part of this growth occurring in the fall when the approval of the ETFs became almost inevitable. Many traders and investors, especially short-term speculators, decided to lock in profits rather than buy the now more expensive asset. This is a classic example of the market adage, "Buy on rumors (expectations), sell on facts."
It cannot be said that this price collapse was unexpected. In the lead-up to the SEC's decision, some analysts had predicted a downturn. For instance, experts at CryptoQuant talked about a potential drop in prices to $32,000. Other forecasts mentioned support levels at $42,000 and $40,000. "Bitcoin failed to break through the $50,000 level," analysts at Swissblock wrote. "The question arises whether the leading cryptocurrency can regain the momentum it has lost."
Our previous review was titled "D-Day Has Arrived. What Next?". More than a week has passed since the approval of the Bitcoin ETF, but judging by the BTC/USD chart, the market still hasn't decided on an answer to this question. According to Michael Van De Poppe, head of MN Trading Consultancy, the price is stuck between several levels. He believes that resistance lies at $46,000, but bitcoin could test support in the range between $37,000 and $40,000. In reality, for almost the entire past week, the primary cryptocurrency moved in a narrow sideways channel: between $42,000 and $43,500. However, on January 18-19, bitcoin experienced another bear attack, recording a local minimum at $40,280.
Evaluating the impact of the launch of spot bitcoin ETFs will require some time. Suitable data for analysis is expected to accumulate around mid-February. However, as noted by Cointelegraph, these funds have already attracted over $1.25 billion. On the first day alone, the trading volume of these new financial market instruments reached $4.6 billion.
Andrew Peel, Head of Digital Assets at investment bank Morgan Stanley, points out that the weekly inflow of funds into these new products already exceeds billions of dollars. He believes that the launch of spot bitcoin ETFs could significantly accelerate the process of de-dollarization of the global economy. He is quoted as saying, "Although these innovations are still in their infancy, they open up opportunities for challenging the hegemony of the dollar. Macro investors should consider how these digital assets, with their unique characteristics and growing adoption, can change the future dynamics of the dollar." Andrew Peel reminds us that the popularity of BTC has been growing steadily over the last 15 years, with over 106 million people worldwide now owning the first cryptocurrency. Meanwhile, Michael Van De Poppe notes that the events of January 10 will change the lives of many people around the world. However, he warns that "this will be the last 'easy' cycle for bitcoin and cryptocurrencies" and that it "will take longer than before."
The impact of the newly launched bitcoin ETFs on the global order has also been a topic of discussion among many influencers at the top of the power pyramid, underscoring the significance of this event. For instance, Elizabeth Warren, a member of the U.S. Senate Banking Committee, criticized the SEC's decision, expressing concerns that it could harm the existing financial system and investors. In contrast, Kristalina Georgieva, the Managing Director of the International Monetary Fund (IMF), holds a different view. She believes that cryptocurrencies are a class of assets, not money, and it's crucial to make this distinction. Therefore, she argues, bitcoin will not be able to replace the U.S. dollar. Additionally, the IMF head disagrees with those who expect that bitcoin ETFs will contribute to the mass adoption of the first cryptocurrency.
Bitcoin's price is projected to reach $100,000 - $150,000 by the end of 2024 and $500,000 within the next five years, according to Tom Lee, co-founder of the analytics firm Fundstrat, in an interview with CNBC. "In the next five years, supply will be limited, but with the approval of spot bitcoin ETFs, we have potentially huge demand, so I think something around $500,000 is quite achievable within five years," the expert stated. He also highlighted the upcoming halving in the spring of 2024 as an additional growth factor.
ARK Invest CEO Cathy Wood, also speaking on CNBC, predicted a bullish scenario where the first cryptocurrency could reach $1.5 million by 2030. Her firm's analysts calculated that even under a bearish scenario, the price of the digital gold would grow to at least $258,500.
Another forecast was given by Anthony Scaramucci, founder of SkyBridge Capital and former White House Communications Director. "If bitcoin is at $45,000 during the halving, then by mid-to-late 2025, it will be worth $170,000. Whatever the price of bitcoin is on the day of the halving in April, multiply it by four, and it will reach that figure within the next 18 months," said the SkyBridge founder in Davos, ahead of the World Economic Forum.
It's interesting to see how different AI chatbots have provided varied predictions for the price of bitcoin by December 31, 2024. Claude Instant from Anthropic predicted $85,000, while Pi from Inflection expects a rise to $75,000. Bard from Gemini forecasts that the price of BTC will exceed $90,000 by that date, though it cautions that unforeseen economic obstacles could limit the peak to around $70,000. ChatGPT-3.5 from OpenAI sees a price range of $75,000 to $85,000 as plausible but not guaranteed. A more conservative estimate from ChatGPT-4 suggests a range of $40,000 to $60,000, factoring in potential market fluctuations and investor caution, but doesn't rule out a rise to $80,000. Lastly, Bing AI from Co-Pilot creative predicts a price around $75,000, based on the information it has gathered.
These diverse predictions from AI systems reflect the inherent uncertainty and complexity in forecasting cryptocurrency prices, highlighting a range of factors that could influence market dynamics over the next few years.
As of the evening of January 19, BTC/USD was trading around $41,625. The total market capitalization of the cryptocurrency market stood at $1.64 trillion, down from $1.70 trillion a week earlier. The Bitcoin Fear & Greed Index, a measure of market sentiment, has dropped from 71 to 51 points over the week, moving from the 'Greed' zone to the 'Neutral' zone. This shift indicates a change in investor sentiment, reflecting a more cautious approach in the cryptocurrency market.
In conclusion regarding the growing market speculation about the imminent launch of spot ETFs on Ethereum, in our previous review, we cited a statement by SEC Chairman Gary Gensler, who clarified that the regulator's positive decision applies exclusively to exchange-traded products based on bitcoin. According to Gensler, this decision "does not signal readiness to approve listing standards for crypto assets that are considered securities." It's important to note that the regulator still classifies only bitcoin as a commodity, while "the vast majority of crypto assets are seen as investment contracts (i.e., securities)."
Now, analysts from the investment bank TD Cowen have confirmed pessimism regarding ETH-ETFs. Based on the information they have; it seems unlikely that the SEC will begin reviewing applications for this investment instrument in the first half of 2024. "Before approving ETH-ETFs, the SEC will want to gain practical experience with similar investment instruments in bitcoin," commented Jaret Seiberg, head of TD Cowen Washington Research Group. TD Cowen believes that the SEC will revisit the discussion of Ethereum ETFs only after the U.S. presidential elections in November 2024.
Nikolaos Panagirtzoglou, a senior analyst at JP Morgan, also does not expect a quick approval of spot ETH-ETFs. He opines that for the SEC to make a decision, it needs to classify Ethereum as a commodity rather than a security. However, JP Morgan considers such a development unlikely in the near future.
Silver tumbles amid rate cut expectation adjustments
Silver falls steeply today as the decline from 25.91 resumes. This steep selloff in the precious metal is interpreted, at least partly, as a reaction to the recent market adjustments in global central bank rate cut expectations. With the anticipation of prolonged high interest rates, the opportunity cost of holding precious metals like Gold and Silver remains elevated, putting additional pressure on their prices.
Technically, near term outlook in Silver will stay bearish as long as 22.83 resistance holds. Next target is 100% projection of 25.91 to 22.50 from 24.59 at 21.18.
Price actions from 26.12 are seen as a sideway consolidation pattern from with decline 25.91 as the third leg. While break of 20.67 cannot be ruled out, strong support should be seen 19.88 and 20.67 to conclude the fall from 25.91, as well as the sideway pattern.
January Flashlight for the FOMC Blackout Period
Summary
- We share the near-universally held view that the FOMC will leave the fed funds rate and pace of quantitative tightening (QT) unchanged at the conclusion of its upcoming meeting on January 31.
- The FOMC's decision last month to leave the fed funds rate unchanged for a third consecutive meeting made it increasingly clear that the most aggressive tightening cycle since the 1980s has come to an end. Consequentially, overall financial conditions have eased considerably since the last policy meeting.
- We also look for the FOMC to remain in a holding pattern in terms of its policy guidance, and we expect only minor changes to the post-meeting statement relative to December. A change to the statement we would not be surprised to see at this meeting is the removal of the paragraph on the U.S. banking system and financial conditions.
- Overall, we view this meeting as one where the Committee will buy time to discern if inflation is indeed on a sustainable path back to 2% and serve as an opportunity to build consensus around the conditions for eventual policy easing.
- Market chatter about changes to the existing pace of QT has picked up recently, and we expect the meeting will include a discussion about the path forward for the Federal Reserve's balance sheet.
- Our base case is that the FOMC will announce a plan to slow the pace of QT at its June meeting, although we would not be shocked if the Committee decided to do so one meeting earlier in May.
- Specifically, we expect the runoff caps for Treasury securities to be reduced to $30 billion while MBS caps are dropped to $20 billion starting on July 1. We anticipate this slower pace of QT running until year-end 2024. Under this scenario, the Fed's balance sheet would reach a trough of $6.8 trillion or so at year-end 2024 and begin growing gradually again thereafter.
The Less Said the Better?
We share the near-universally held view that the FOMC will leave the fed funds rate and pace of quantitative tightening (QT) unchanged at the conclusion of its upcoming meeting on January 31. The FOMC's decision last month to leave the fed funds rate unchanged for a third consecutive meeting made it increasingly clear that the most aggressive tightening cycle since the 1980s has come to an end. The December post-meeting statement continued to signal that, in the near term, any adjustment to the policy rate is still more likely to be up than down. However, a small tweak sent a big signal that the Committee believes additional tightening is increasingly less likely. Specifically, the insertion of "any" to the sentence "In determining the extent of any additional policy firming that may be appropriate..." indicated that the Committee is more confident that the current policy setting is sufficient to return inflation to 2% on a sustained basis.
Moreover, in the post-meeting press conference, Chair Powell underscored the Committee's shifting focus away from potential further hikes and toward eventual policy easing. Not only did the FOMC continue to discuss how long the fed funds rate may need to remain restrictive, but the Committee discussed when it may be appropriate to remove current policy restraint—a discussion that is the first step on the road to eventually easing.
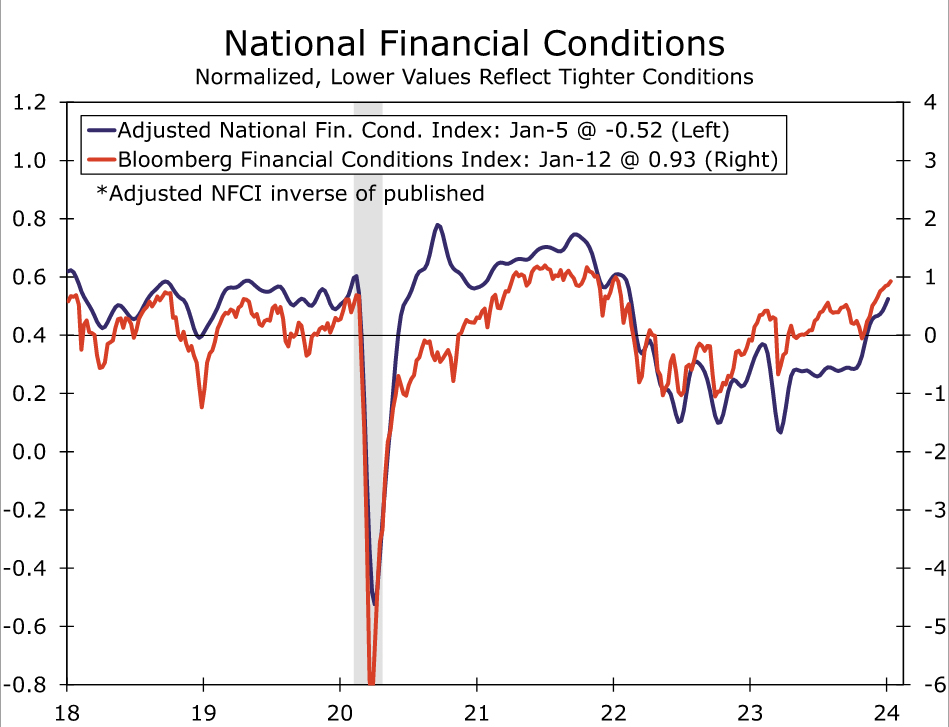
With Powell sharing that the topic of rate cuts had been broached, financial conditions loosened further over the inter-meeting period. At present, indices of financial conditions are sitting near the most accommodative levels since the FOMC began its current tightening cycle (Figure 1). That easing in financial conditions has caused some consternation about premature policy easing given that they are the channel through which the Fed's policy settings impact the real economy. Inflation has fallen sharply in recent months (Figure 2), with the rise in the core PCE deflator slowing to a six-month annualized rate of 2.0% through December by our estimates. However, Chair Powell and other FOMC members have indicated they need to see progress continue in the coming months to be convinced inflation can return to 2% for the long-haul. Meanwhile, economic growth continues to hold up well. Employment increased more than expected in December, the unemployment rate remained unchanged at 3.7% and layoffs remain near record lows. GDP in the final quarter of the year looks to have risen close to a trend-like 2% annualized rate.
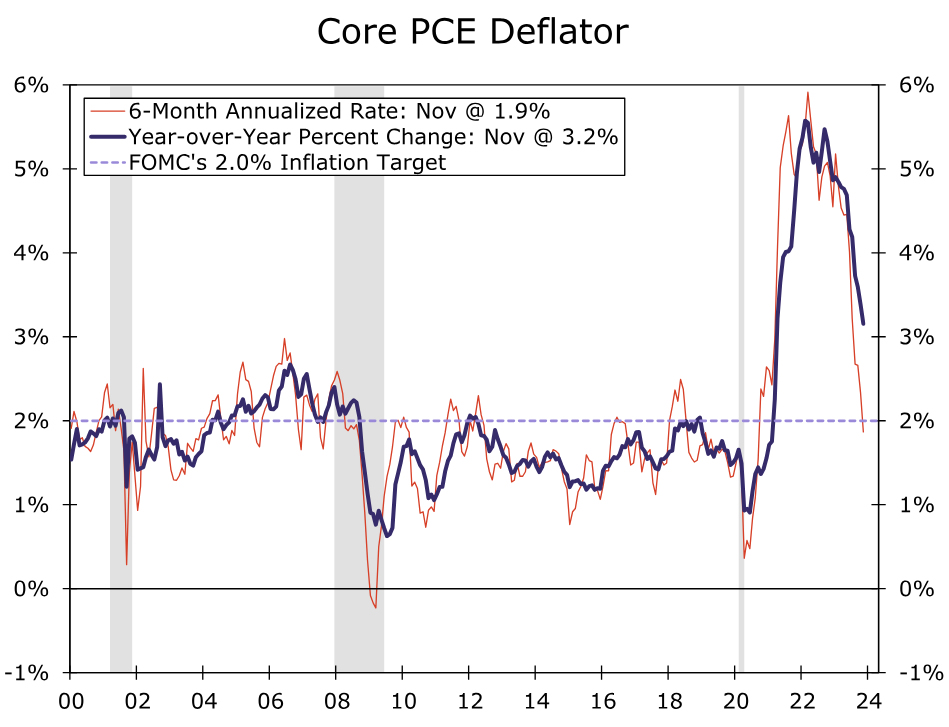
Therefore, we look for the FOMC to remain in a holding pattern, not only with the fed funds rate at its January meeting, but also with its policy guidance. While progress in lowering inflation over the past six months has built the case that rate cuts are coming, the economy's recent performance suggests no imminent need to ease. Given a still-elevated degree of uncertainty over the outlook and a desire to limit further near-term easing in financial conditions, we suspect that Fed policymakers will want to be careful about sounding too dovish in the post-meeting statement and Chair Powell's press conference.
As a result, we expect the post-meeting statement to include only a few changes from December. Guidance around the future path of policy likely will remain unchanged after the last meeting's adjustment. Rather, changes are more likely to be in the characterization of recent economic activity.
On the less consequential side, the statement likely will remove the reference to Q3 GDP and acknowledge that growth in Q4 was solid, albeit slower than in the third quarter. (Preliminary data for Q4-23 GDP are scheduled for release on January 25.) We expect the statement will continue to note that "job gains have moderated" but "remain strong." More consequential would be a change to the statement's description of inflation. If the FOMC wants to clearly signal it is inching closer to eventual rate cuts, it could remove the reference to inflation remaining "elevated," and instead say something along the lines of "Inflation has eased over the past year, but a sustained moderation in inflation pressures has yet to be convincingly demonstrated" (our emphasis on the possible new language).
One other change to the statement we would not be surprised to see is the removal of the paragraph on the U.S. banking system and financial conditions. The FOMC's emphasis on the soundness and resiliency of the overall banking system came in the immediate wake of a handful of high-profile bank failures last March. But with the immediate crisis since passed and some policy easing on the horizon, its purpose has been served. At the same time, the easing in financial conditions since the autumn leaves the reference to "Tighter financial and credit conditions..." feeling stale. We believe the removal of this paragraph should be viewed as a tidying up of the statement, rather than a meaningful change in the FOMC's thinking.
Overall, we view this meeting as one where the Committee will buy time to discern if inflation is indeed on a sustainable path back to 2% and serve as an opportunity to build consensus around the conditions for eventual policy easing. Our current view is that the first "normalization cut" will occur at the May 1 meeting.
Time To Talk About QT
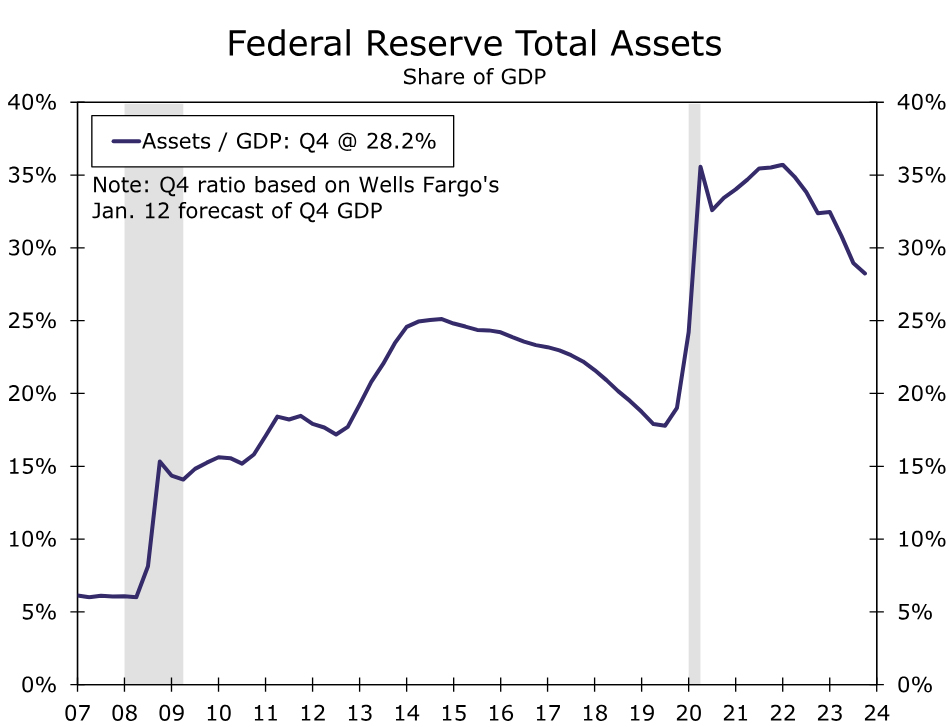
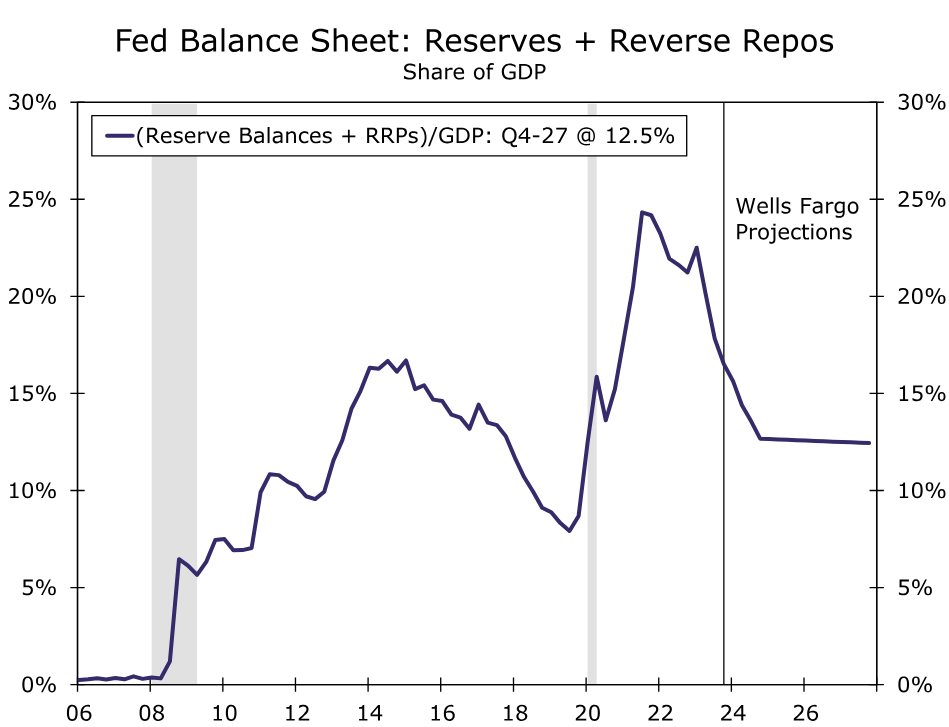
We suspect the January FOMC meeting will include a discussion about the path forward for the Federal Reserve's balance sheet. The Federal Reserve has been shrinking its balance sheet since June 2022 in a process frequently referred to as "quantitative tightening" (QT). Starting in June 2022, the FOMC began allowing a maximum of $30 billion of Treasury securities and $17.5 billion of mortgage-backed securities (MBS) per month to roll off its balance sheet. These caps were increased to $60 billion and $35 billion, respectively, in September 2022, and they have subsequently remained unchanged. At present, the Fed's balance sheet totals roughly $7.7 trillion, down from nearly $9 trillion at its peak in Q2-2022. That said, the Fed's balance sheet remains significantly larger than its pre-pandemic size, both in dollar terms and as a share of GDP (Figure 3).
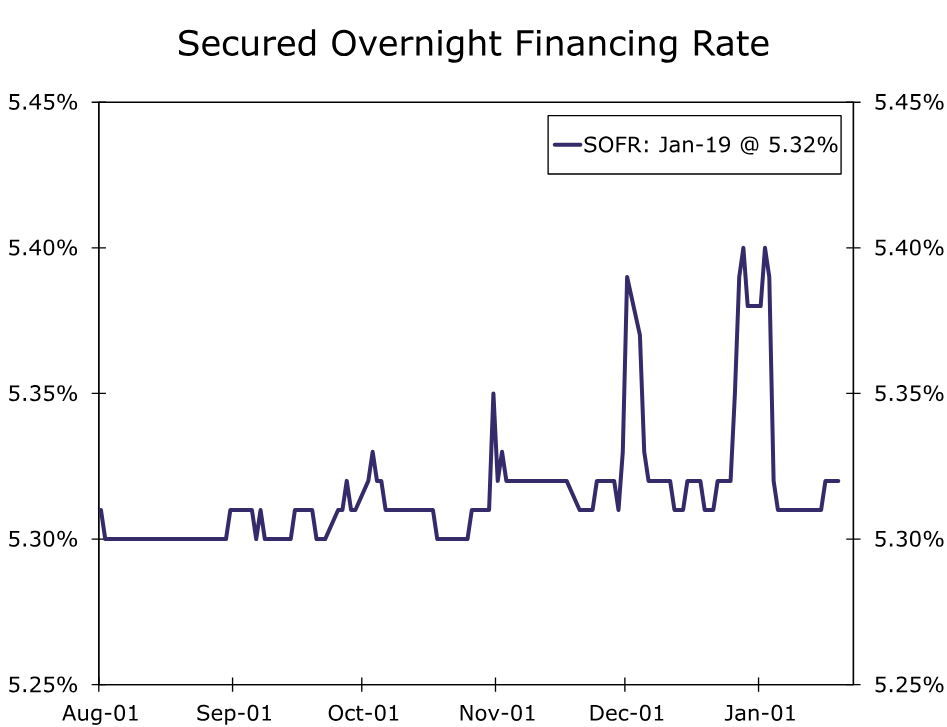
Market chatter about changes to the existing pace of QT has picked recently up for a few reasons. Money market rates have drifted higher around month-end over the past couple of months. For example, the Secured Overnight Financing Rate (SOFR) increased by 8-9 bps for a few days around the end of November and again at the end of December (Figure 4). These moves proved temporary and receded shortly after month-end, and they were smaller than the similar month-end moves that occurred in 2018-2019 when the Federal Reserve was last undertaking QT. However, these small stresses are an early sign that liquidity may not be as abundant as it has been over the past few years.
Some Fed officials appear to have taken notice. In the minutes from the December FOMC meeting, “[several] participants suggested that it would be appropriate for the Committee to begin to discuss the technical factors that would guide a decision to slow the pace of runoff." A speech from Dallas Fed President Lorie Logan on January 6 added more fuel to the speculation. In a previous role, Logan was manager of the System Open Market Account for the FOMC, and her expertise earned while managing the Federal Reserve's securities portfolio means that many market participants put additional weight on her views in this area. Logan acknowledged that the "emergence of typical month-end pressures suggests we’re no longer in a regime where liquidity is super abundant and always in excess supply for everyone." Logan suggested that it is "appropriate to consider the parameters that will guide a decision to slow the runoff of our assets."
Our expectation is that the FOMC will spend the next few policy meetings discussing the path forward for the balance sheet. Our base case is that the FOMC will announce a plan to slow the pace of QT at its June meeting, although we would not be shocked if the Committee decided to do so one meeting earlier in May. Specifically, we expect the runoff caps for Treasury securities to be reduced to $30 billion while MBS caps are dropped to $20 billion starting on July 1. We anticipate this slower pace of QT running until year-end 2024. Starting in 2025, we look for balance sheet growth to resume to accommodate organic growth in liabilities (e.g., paper currency and bank reserves). We expect the FOMC will continue to passively reduce its MBS holdings in 2025 and beyond while replacing these MBS with Treasury securities, a move that would replicate what occurred in 2019.
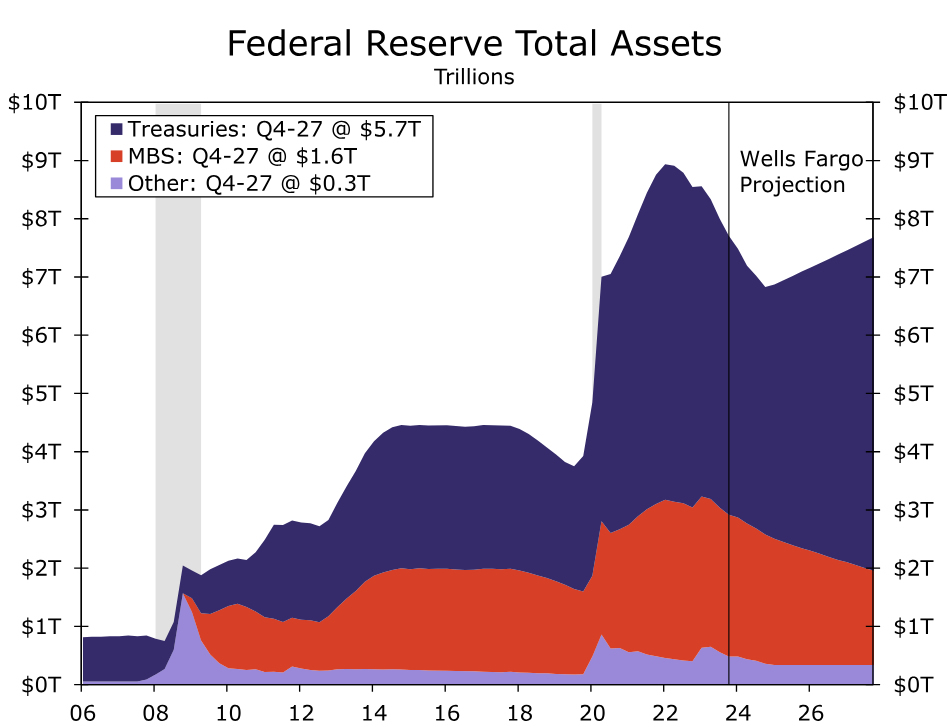
If realized, the Fed's balance sheet would reach a trough of $6.8 trillion or so at year-end 2024 and begin growing gradually again thereafter (Figure 5). The nadir in the Fed's balance sheet would be only a bit higher than the $6.5 trillion projection in our "middle-of-the-road" scenario outlined in our report on QT from last October. QT that slows/stops modestly sooner than expected would not have a major impact on our expectations for the level of rates and the shape of the yield curve. In this scenario, we look for RRP balances to decline to about $200 billion by year-end, with bank reserves that are around $3.1 trillion at the trough. As a share of GDP, this would represent a meaningful liquidity buffer relative to pre-pandemic levels (Figure 6).
US 500 Index Skyrockets to New All-time High
- US 500 index still confirms a strong upside tendency
- MACD and RSI in positive territories
- Next resistance at 161.8% Fibonacci extension
The US 500 cash index has been in a prolonged uptrend since the end of October, posting a fresh all-time high of 4,858 earlier today. After a period of rangebound trading, the pair stormed above the 4,800-4,817 region, which is now acting as support area.
According to technical indicators, the RSI is moving towards the 70 level and the MACD oscillator is creating a bullish crossover with its trigger line above the zero area. Both are confirming the aggressive buying interest in price.
Considering that the short-term oscillators remain tilted to the upside, the price could edge higher and visit uncharted levels such as the 161.8% Fibonacci extension level of the down leg from 4,600 to 4,100 at 4,920. Piercing through that wall, the index may hit the next psychological number such as 5,000.
On the flipside, should the price reverse lower, immediate support could be found at the aforementioned zone of 4,800-4,817. A break below that area could trigger a retreat towards the 4,715 support and the 50-day simple moving average (SMA), which overlaps with the 4,660 barricade. In case of a downside violation, the bears may then attack the 4,600 low.
In brief, the US 500 index is still developing near the record highs and only a decline beneath the 50-day SMA may suggest a bearish correction in the medium-term timeframe.