Sample Category Title
Contrasting Trends in Asia; BoJ, BoC and ECB to Highlight a Busy Week
Asian markets highlights sharp divergence in trends today. Nikkei surged to new 34-year high, buoyed by last week's record closes in US and bolstered by expectations that BoJ will maintain its negative interest rate policy in the this week's meeting. Japanese stock market is also riding on the optimism that BoJ is not in a rush to tighten its monetary policy, with the earliest rate hike not expected until April. However, this April decision on rate hikes will still hinge on new economic projections due tomorrow and the results of upcoming spring wage negotiations.
In stark contrast, stocks in Hong Kong and China extended their downtrend, with significant plunges of more than -2% and -1%, respectively. Investors in these markets are showing dissatisfaction with the Chinese government's lack of substantial stimulus to boost the sluggish economy and counter deflationary pressures. Additionally, there appears to be an emerging sentiment among heavyweight investors favoring investment "anywhere-but-China."
In the currency markets, most major pairs and crosses are currently trading within Friday's range. Australian Dollar is leading the decline among commodity currencies, while Swiss Franc is also under pressure. Sterling stands out as the strongest at this point, followed closely by Yen and Euro, with Dollar showing mixed performance. Trading might remain subdued today due to a near-empty economic calendar, but several important events loom on the horizon. These include BoJ, BoC, and ECB meetings, as well as crucial economic data like US GDP and PCE inflation, in addition to global PMI data.
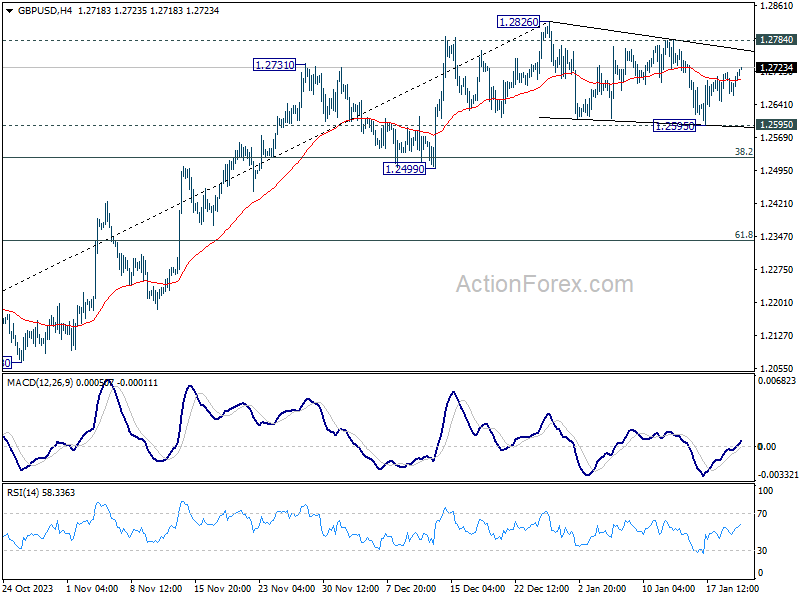
Technically, GBP/USD's rebound from 1.2595 is picking up some momentum today. It's plausible that consolidation pattern from 1.2826 has completed with three waves down to 1.2595. Firm break of 1.2784 will argue that larger up trend is ready to resume through 1.2826 high. This is a development to watch in the next two to three days, with UK PMIs on Wednesday a possible trigger.
In Asia, at the time of writing, Nikkei is up 1.59%. Hong Kong HSI is down -2.30%. China Shanghai SSE is down -1.34%. Singapore Strait Times is up 0.20%. Japan 10-year JGB yield is down -0.0107 at 0.658.
PBoC holds 1-yr and 5-yr LPR steady
People's Bank of China announced today that it would maintain one-year loan prime rate at 3.45%, a level unchanged since August last year. Similarly, five-year rate, critical for mortgage financing, remains steady at 4.2%, consistent since its last reduction in June. This decision follows PBoC's unexpected move last week to keep its medium-term lending facility rate stable.
PBoC's decision to hold rates steady comes amid a sluggish economic environment in China, coupled with increasing deflationary pressures. Despite these challenges, the central bank appears reluctant to employ interest rate reductions as a tool to stimulate the economy, primarily due to concerns over the depreciating Yuan. PBoC might continue to avoid further rate cuts until Yuan regains some stability, to prevent exacerbating the currency's depreciation.
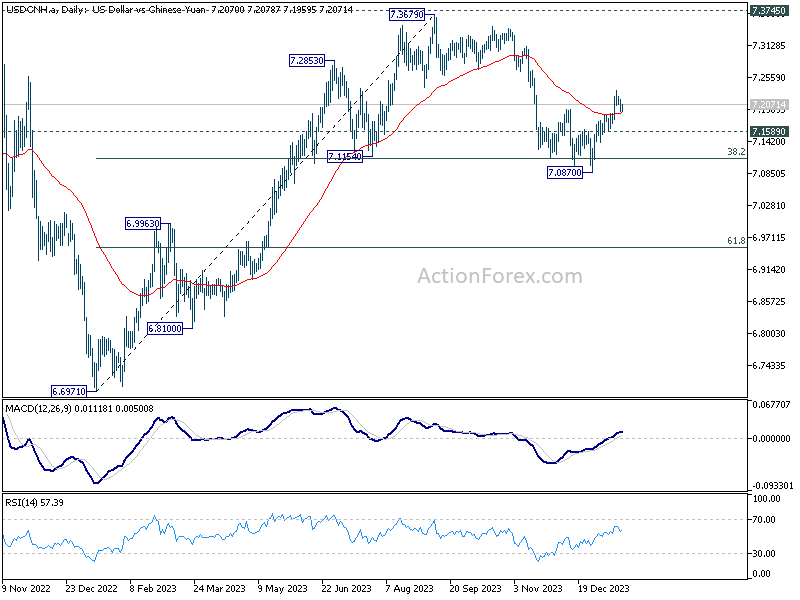
USD/CNH's break of 55 D EMA last week suggests that the corrective pull back from 7.3679 has completed at 7.0870 already. That came after drawing support from 38.2% retracement of 6.6971 to 7.3679 at 7.1117. Further rise is now mildly in favor as long as 7.1589 minor support holds, back to retest 7.3679 high.
BoJ, BoC and ECB to stand pat; Lots of top tier data too
BoJ, BoC and ECB are all expected to keep monetary policy unchanged this week. It's unlikely for BoJ Governor Kazuo Ueda to drop any hints on negative interest rate exit for now. Ueda would reserve that card for March meeting, if BoJ is to raise interest rate eventually in April. Yet, some subtle hints could be seen in the new quarterly economic projections. There were reports about BoJ lowering core inflation forecast of fiscal 2024 due to falling oil prices. But instead, the key is on the inflation forecast through fiscal 2026. The chance of a hike could increase notably if BoJ sees core inflation staying around 2% target through this horizon.
As for BoC, attention will be on how much longer will it keep interest rate at current level of 5.00%. The central bank will likely push back against the idea that rate cuts are coming soon, emphasizing that inflation remains sticky. A recent Reuters poll indicated mixed expectations: while 22 of 34 respondents anticipated rate cuts to commence in June or later, 12 predicted an initial cut in April. The survey's median suggests a cumulative 100 basis points reduction in rates to 4.00% this year..
ECB's communications are not expected to deviate from the chorus of comments out of Davos last week. President Christine Lagarde would continue to push back on speculation of an early rate cut. The question is whether should would explicitly noted summer is the likely timing for the start of policy loosening. March is the more likely meeting for any substantial shift in tone, given that new economic projections will then be available. A Reuters poll showed a divide in expectations: 55% of respondents predicted no easing until at least the second half of the year, while a significant minority of 45% anticipated a reduction in borrowing costs as early as June.
In terms of economic data, US Q4 GDP and December PCE inflation will be major focal points for the Dollar. Other data with the potential to impact respective currencies include Germany's Ifo business climate, New Zealand's CPI, and Japan's Tokyo CPI. Additionally, PMI data from US, Eurozone, UK, Japan, and Australia will be closely scrutinized for insights into global economic health and potential market movements.
Here are some highlights for the week:
- Monday: US leading index.
- Tuesday; New Zealand BNZ services; Australia NAB business confidence; BoJ rate decision; UK public sector net borrowing; Canada new housing price index; Eurozone consumer confidence.
- Wednesday: New Zealand CPI; Australia PMIs; Japan trade balance, PMI manufacturing; Eurozone PMIs; UK PMIs; BoC rate decision; US PMIs.
- Thursday: Germany Ifo business climate; ECB rate decision; US GDP, jobless claims, durable goods orders, trade balance, new homes sales.
- Friday: Japan Tokyo CPI, SPPI, BoJ minutes; UK Gfk consumer sentiment; Germany Gfk consumer sentiment; Eurozone M3 money supply; US personal income and spending, PCE inflation, pending home sales.
AUD/USD Daily Report
Daily Pivots: (S1) 0.6575; (P) 0.6588; (R1) 0.6611; More...
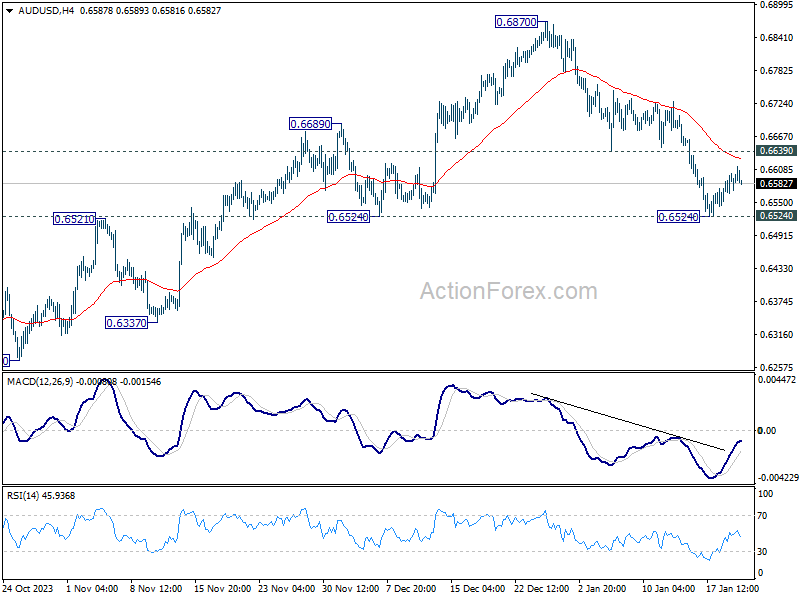
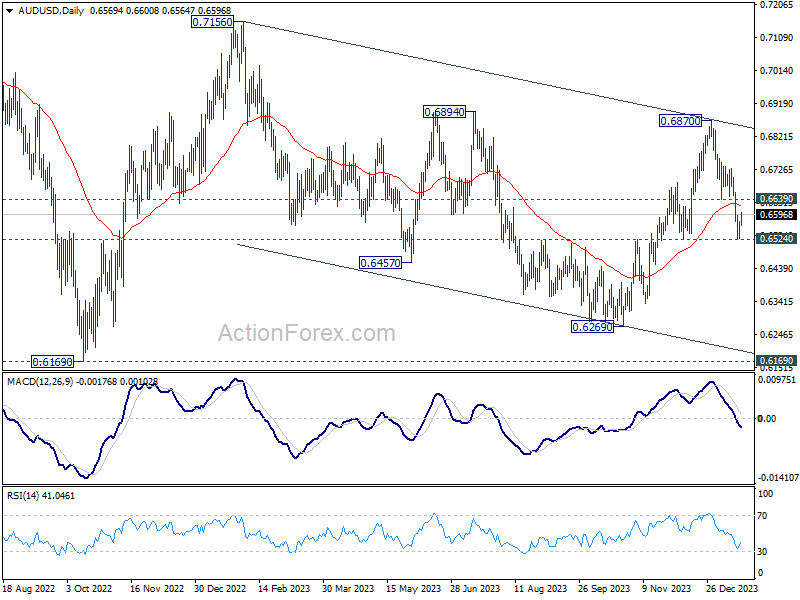
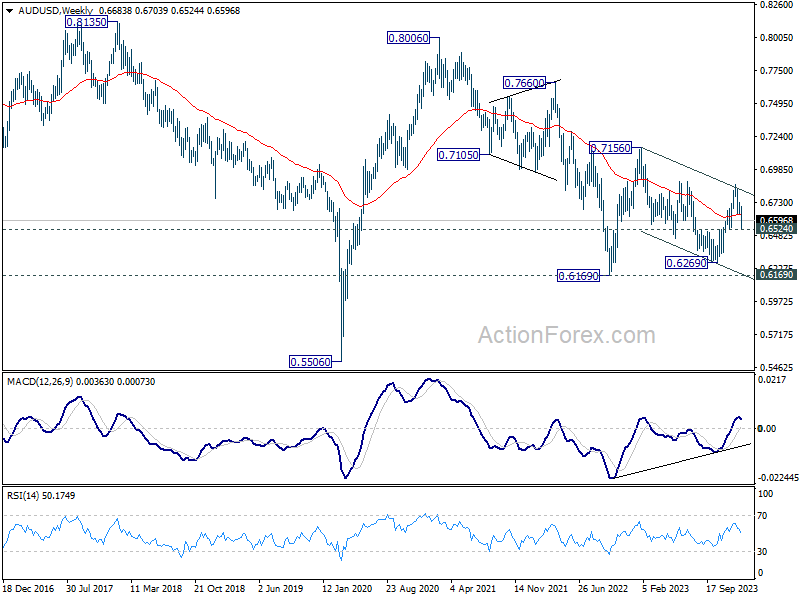
Intraday bias in AUD/USD remains neutral at this point. Some more consolidations could be seen above 0.6524 temporary low. But further decline is expected as long as 0.6639 support turned resistance holds. Firm break of 0.6524 support will argue that whole rebound from 0.6269 has completed, and bring deeper fall to this support.
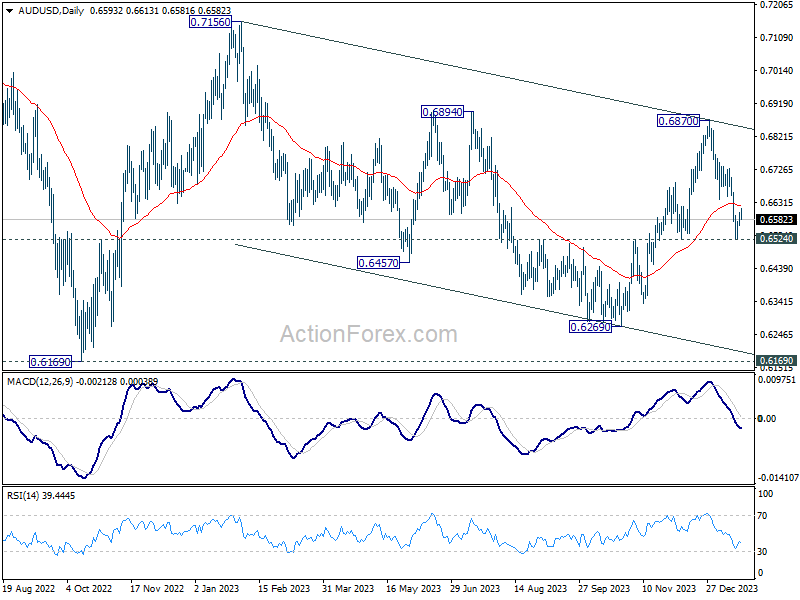
In the bigger picture, price actions from 0.6169 (2022 low) are seen as a medium term corrective pattern to the down trend from 0.8006 (2021 high). Sideway trading could continue in range of 0.6169/7156 for some more time. But as long as 0.7156 holds, an eventual downside breakout would be mildly in favor.
Economic Indicators Update
| GMT | Ccy | Events | Actual | Forecast | Previous | Revised |
|---|---|---|---|---|---|---|
| 15:00 | USD | Leading Index M/M Dec | -0.30% | -0.50% |
Technical Outlook and Review
DXY:
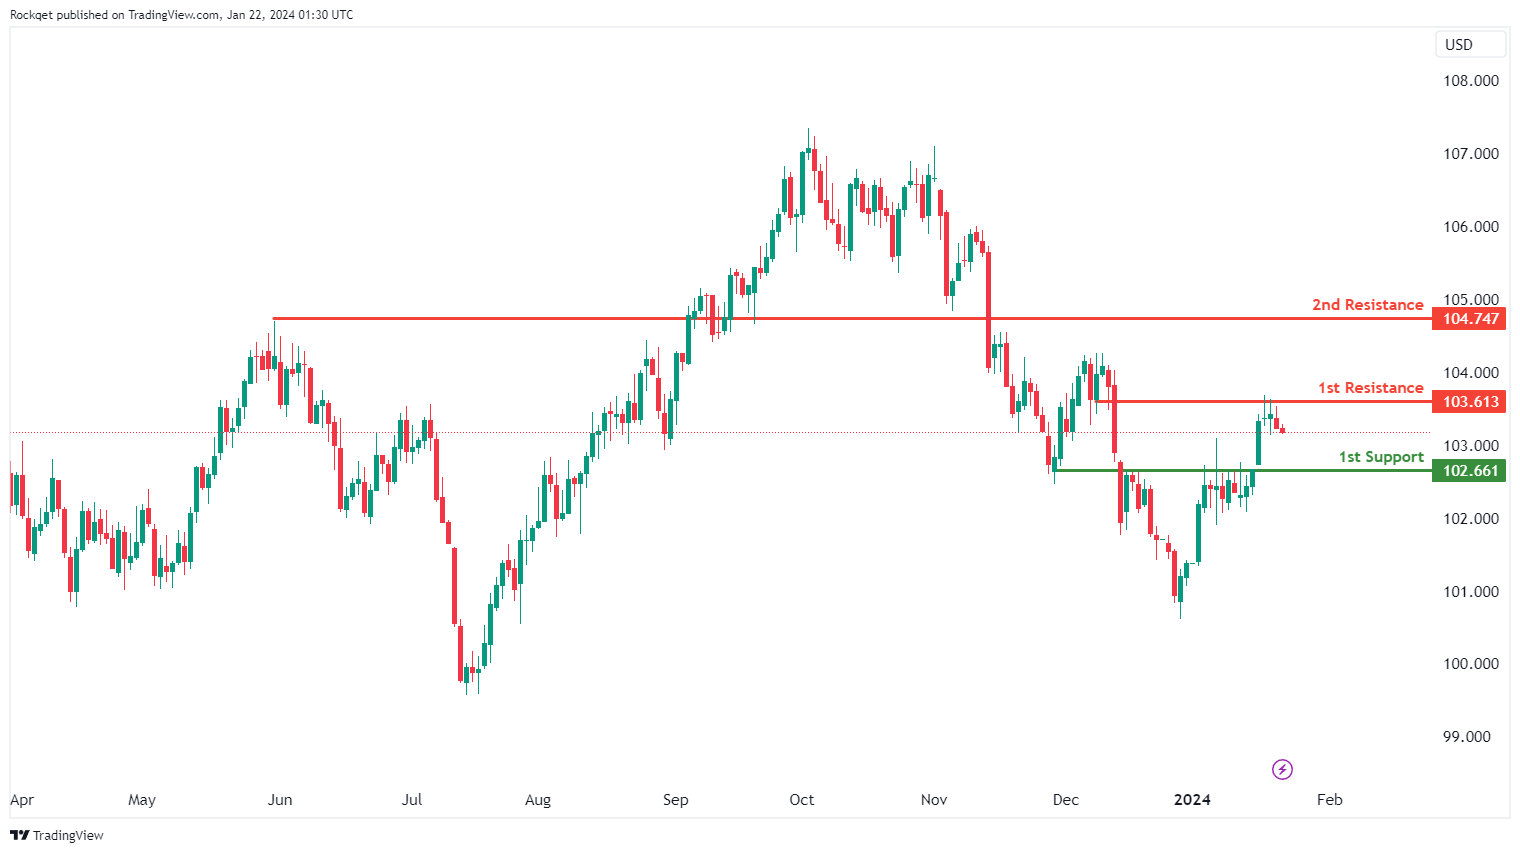
The DXY (US Dollar Currency Index) chart is currently experiencing a bearish overall momentum, indicating weakness in the US Dollar. According to your analysis, there is potential for a bearish continuation towards the 1st support level.
The 1st support at 102.66 is considered a significant level of support due to its categorization as a pullback support. This implies that it may serve as an important area where the price could potentially find support during a bearish move.
On the resistance side, the 1st resistance at 103.61 is recognized as an overlap resistance, indicating that this price level has previously acted as both support and resistance. This historical significance makes it a potential barrier where selling pressure could emerge.
The 2nd resistance at 104.74 is identified as a pullback resistance, suggesting that it may serve as a significant resistance point during price pullbacks.
EUR/USD:
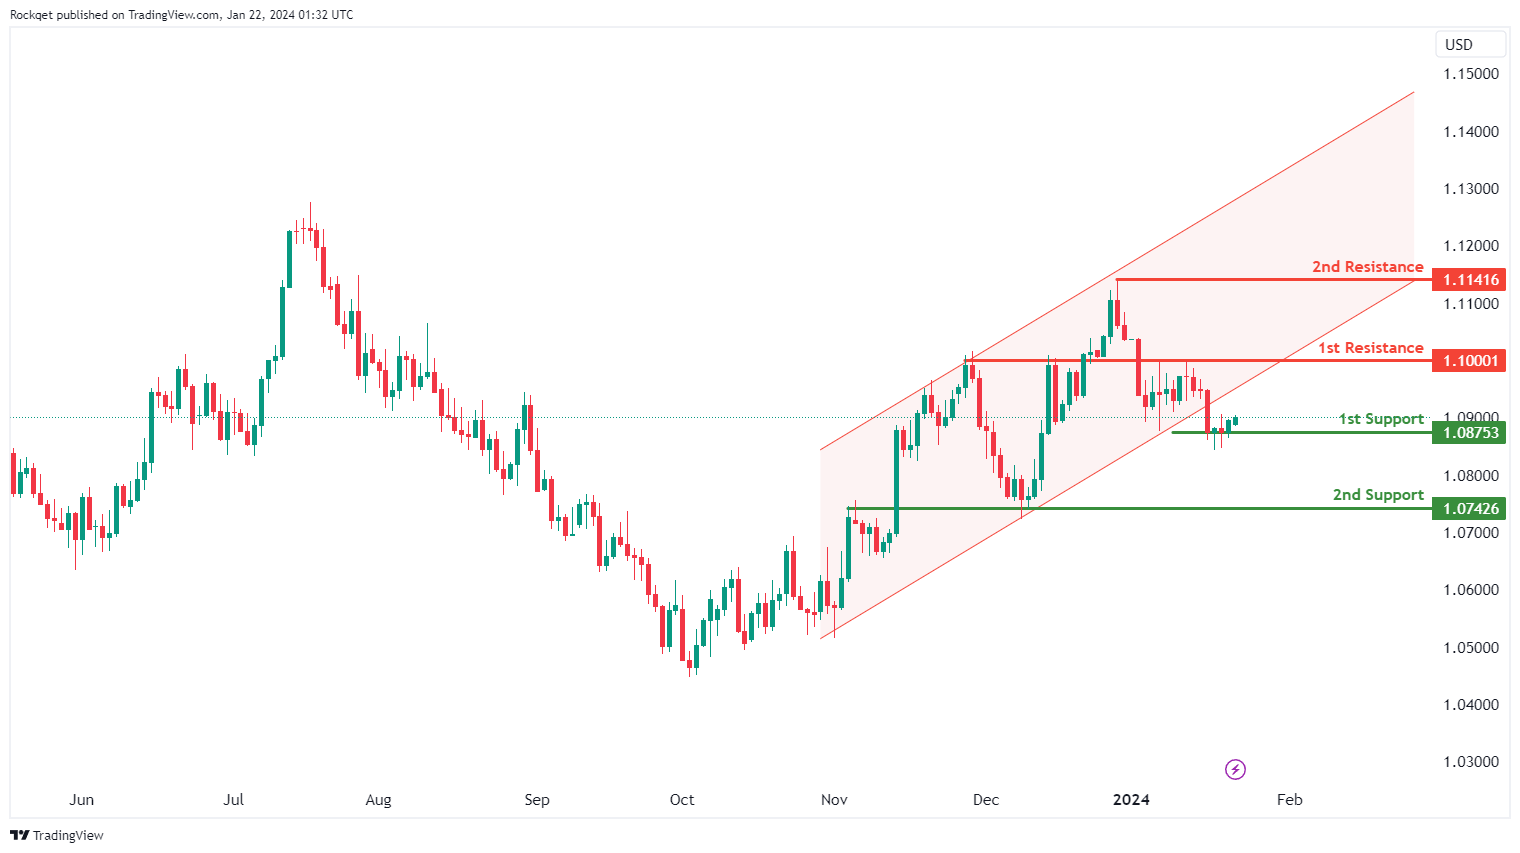
The EUR/USD trading pair is currently exhibiting a bearish overall momentum, with the momentum being driven by the observation that the price has broken below the lower channel line, which typically signifies a continuation of the prior bearish trend.
There is potential for a short-term rise in price towards the 1st resistance level before a reversal and a subsequent drop towards the 1st support level.
The 1st support level at 1.0875 is considered significant as it represents a multi-swing low support. This suggests that it has historically been a level where the price has found support during previous downtrends, making it a potential area of interest for buyers.
The 2nd support level at 1.0742 is identified as an overlap support, indicating that it has previously acted as both support and resistance. This historical significance reinforces its potential as a support level during price declines.
On the resistance side, the 1st resistance level at 1.1000 is recognized as an overlap resistance, implying that it has previously served as both support and resistance. This makes it a potential barrier where selling pressure may emerge.
EUR/JPY:
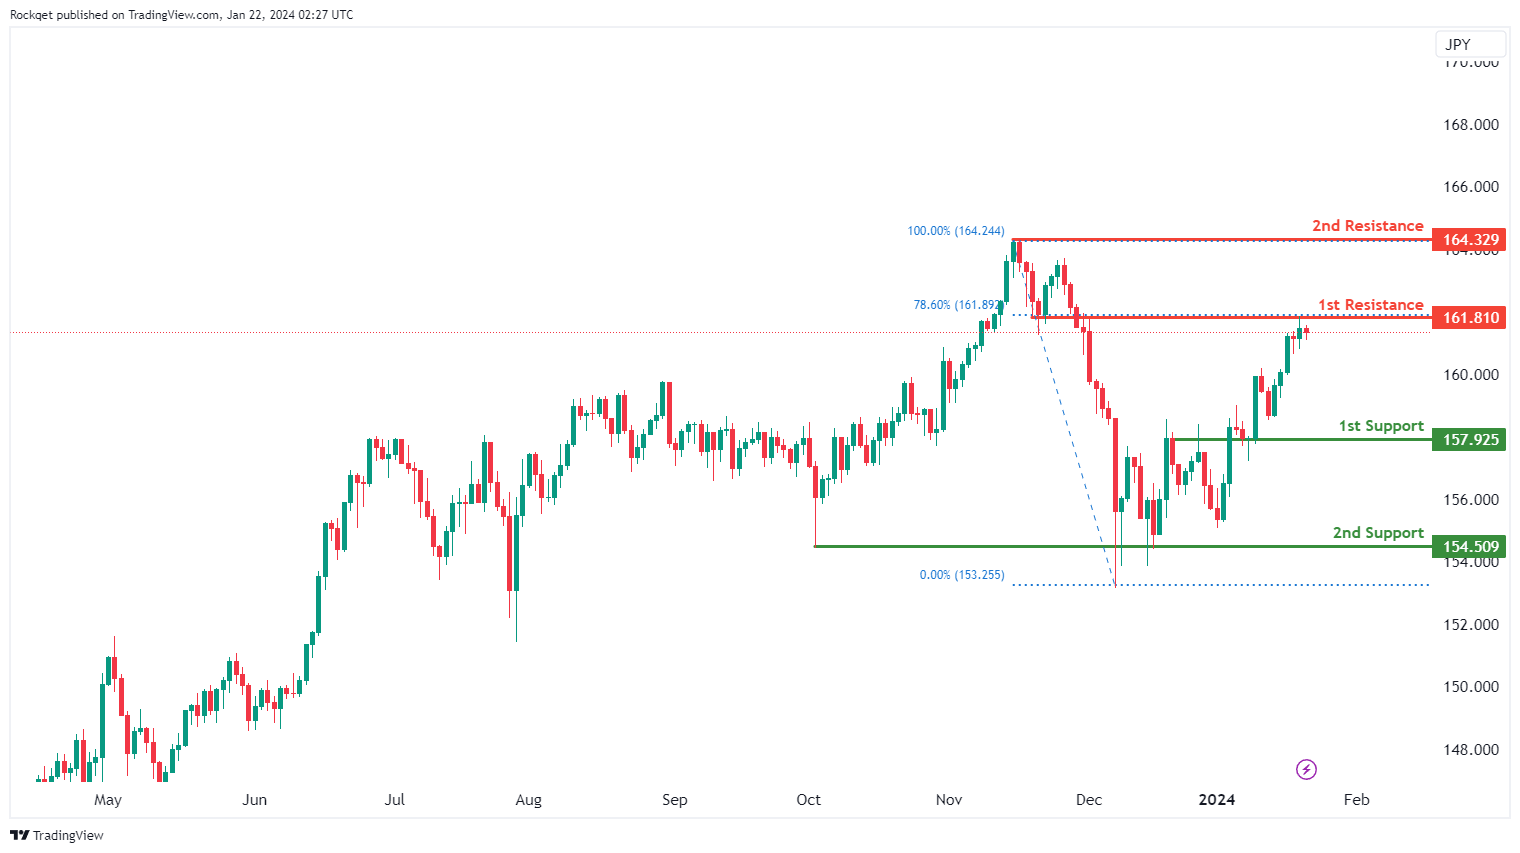
The EUR/JPY trading pair is currently exhibiting a bearish overall momentum, indicating weakness in the Euro relative to the Japanese Yen. Your analysis suggests that there is potential for a bearish reaction off the 1st resistance level, leading to a drop towards the 1st support level.
The 1st support at 157.50 is considered a strong level of support due to its history as an overlap support, indicating that this price level has previously acted as both support and resistance. This suggests that it may be a significant area where price could find support during a bearish move.
The 2nd support at 152.50 is identified as a multi-swing low support, implying that this level corresponds to multiple previous significant low points on the chart. This reinforces its importance as a potential support level during price declines.
On the resistance side, the 1st resistance at 161.81 is recognized as an overlap resistance, and it also aligns with the 78.60% Fibonacci Retracement level. This confluence of factors suggests that it may serve as a strong resistance level, where selling pressure could potentially emerge.
The 2nd resistance at 164.32 is characterized as a swing high resistance, indicating its historical significance as a point where the price has encountered resistance and potential selling interest.
EUR/GBP:
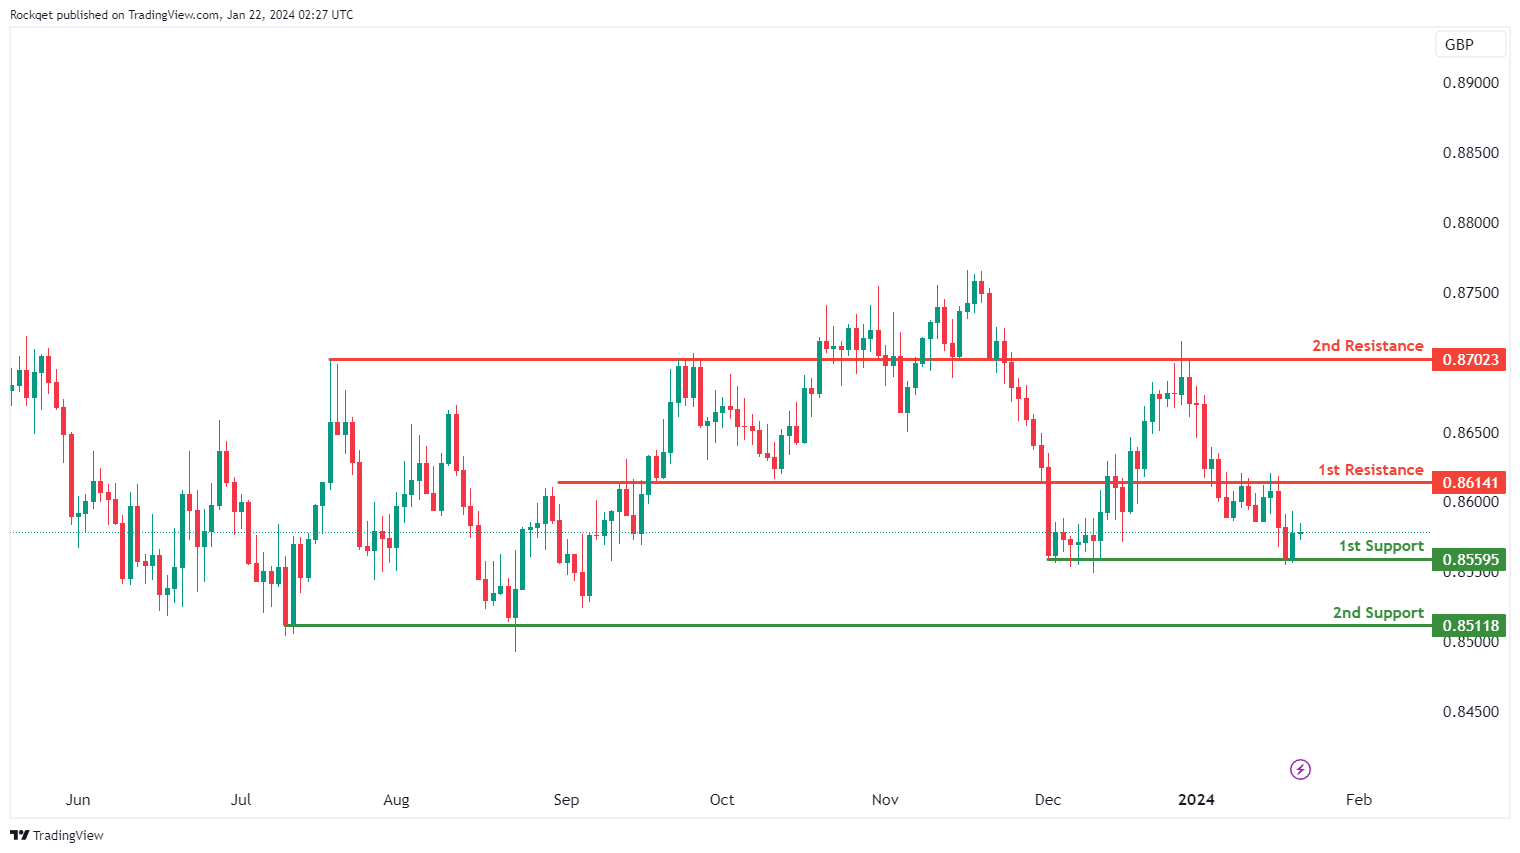
The EUR/GBP trading pair is currently displaying a bullish overall momentum, indicating strength in the Euro relative to the British Pound. Your analysis suggests that there is potential for a bullish continuation towards the 1st resistance level.
The 1st support at 0.8559 is identified as a strong level of support due to its history as a multi-swing low support. This implies that this level corresponds to multiple previous significant low points on the chart, reinforcing its significance as a potential support level during price pullbacks.
Similarly, the 2nd support at 0.8511 is also categorized as a multi-swing low support, indicating its importance as another level where the price has found support in the past.
On the resistance side, the 1st resistance at 0.8614 is recognized as an overlap resistance, suggesting that this price level has previously acted as both support and resistance. This makes it a potentially strong resistance level where selling pressure could emerge.
The 2nd resistance at 0.8702 is also identified as an overlap resistance, further emphasizing its historical significance as a potential barrier for further upward price movement.
GBP/USD:
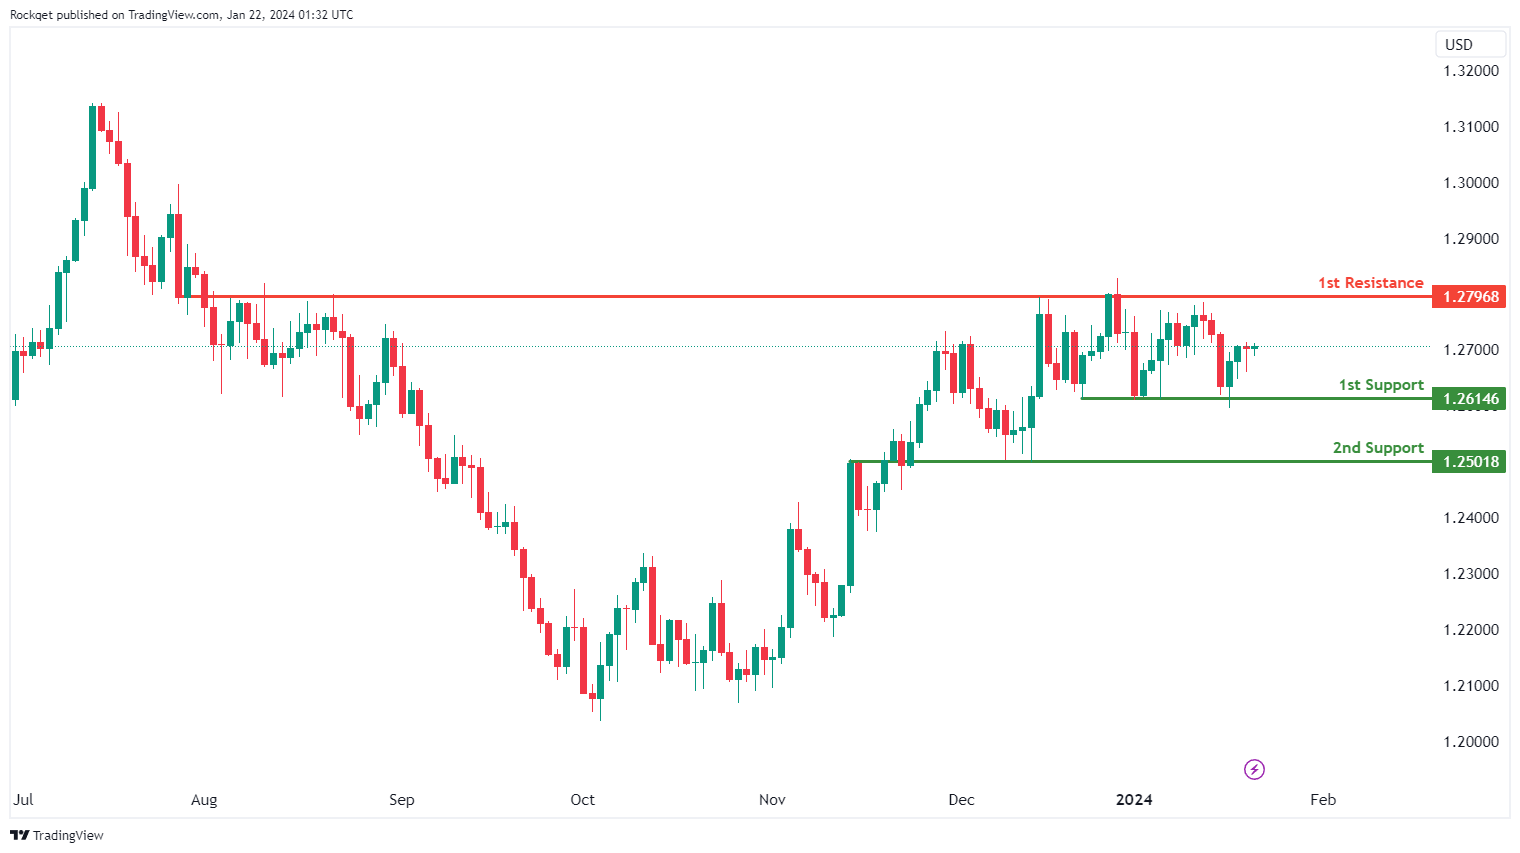
The GBP/USD trading pair currently has a neutral overall momentum, indicating a lack of a strong directional bias in the market. The analysis suggests that price may potentially fluctuate between the 1st resistance and the 1st support level.
The 1st support level at 1.2614 is considered significant as it represents a multi-swing low support. This suggests that it has historically been a level where the price has found support during previous fluctuations, making it a potential area of interest for buyers.
The 2nd support level at 1.2501 is identified as an overlap support, indicating that it has previously acted as both support and resistance. This historical significance reinforces its potential as a support level during price fluctuations.
On the resistance side, the 1st resistance level at 1.2796 is recognized as an overlap resistance, implying that it has previously served as both support and resistance. This makes it a potential barrier where selling pressure may emerge.
GBP/JPY:
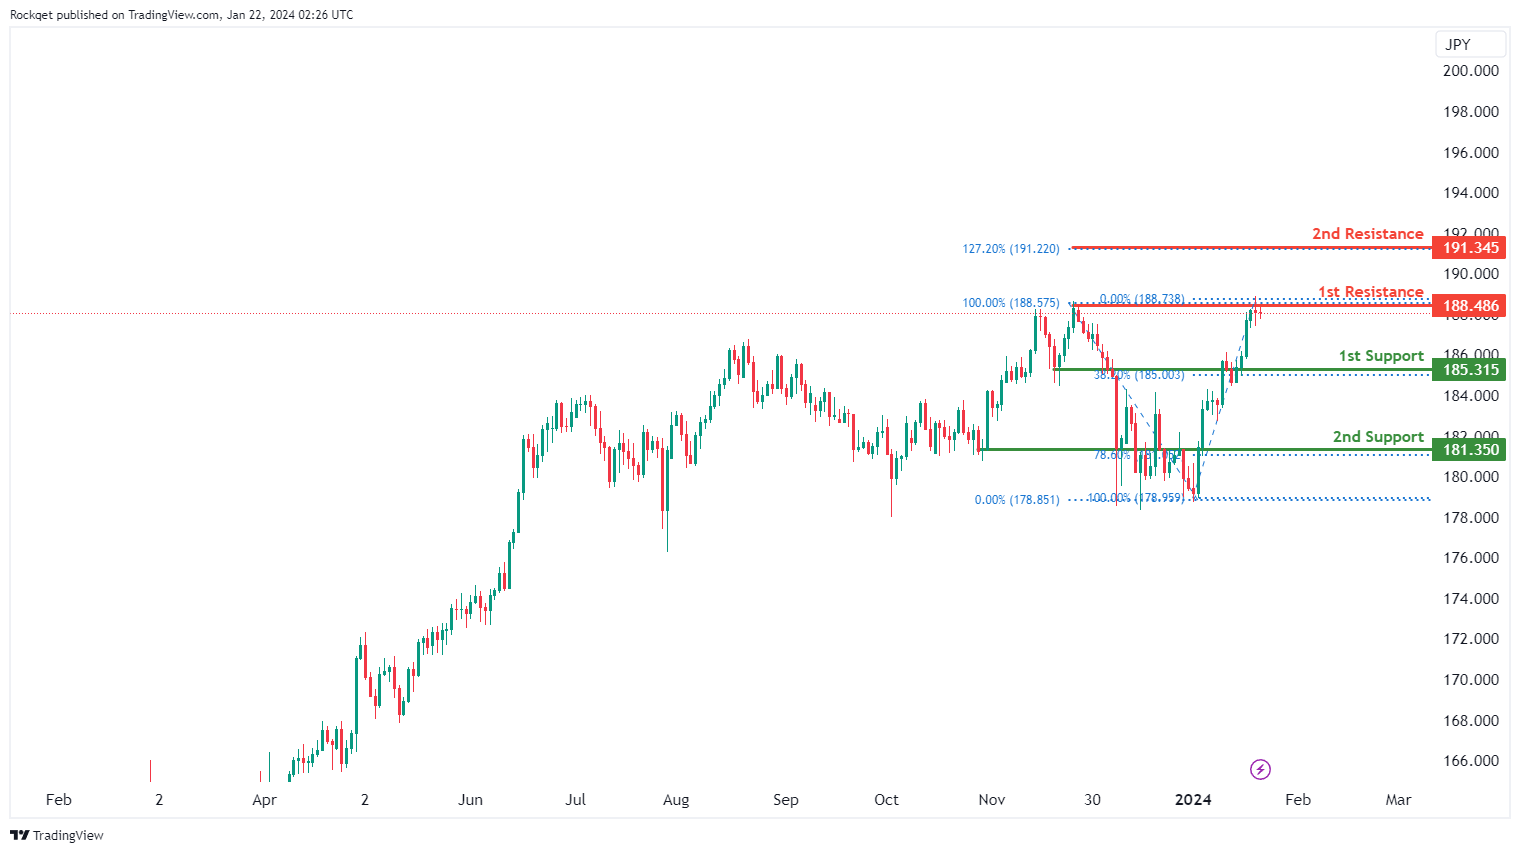
The GBP/JPY trading instrument is currently showing a bearish overall momentum, indicating weakness in the British Pound relative to the Japanese Yen. The analysis suggests that there’s a potential for a bearish continuation towards the 1st support level.
The 1st support at 185.31 is considered a strong level of support for several reasons. It is identified as a pullback support and coincides with the 38.20% Fibonacci Retracement level. This confluence of factors suggests that it may serve as a significant area where interest could emerge, providing temporary support for GBP/JPY during a bearish move.
The 2nd support at 181.35 is also categorized as a pullback support and aligns with the 78.60% Fibonacci Retracement level. This level, too, carries importance and may act as a strong support zone during price pullbacks.
On the resistance side, the 1st resistance at 188.48 is recognized as a swing high resistance, indicating that it has historically served as a point of resistance where selling pressure may emerge.
The 2nd resistance at 191.34 is identified as the 127.20% Fibonacci Extension level. This level may act as a significant barrier for further upward price movement, as Fibonacci Extension levels are often used to id
USD/CHF:
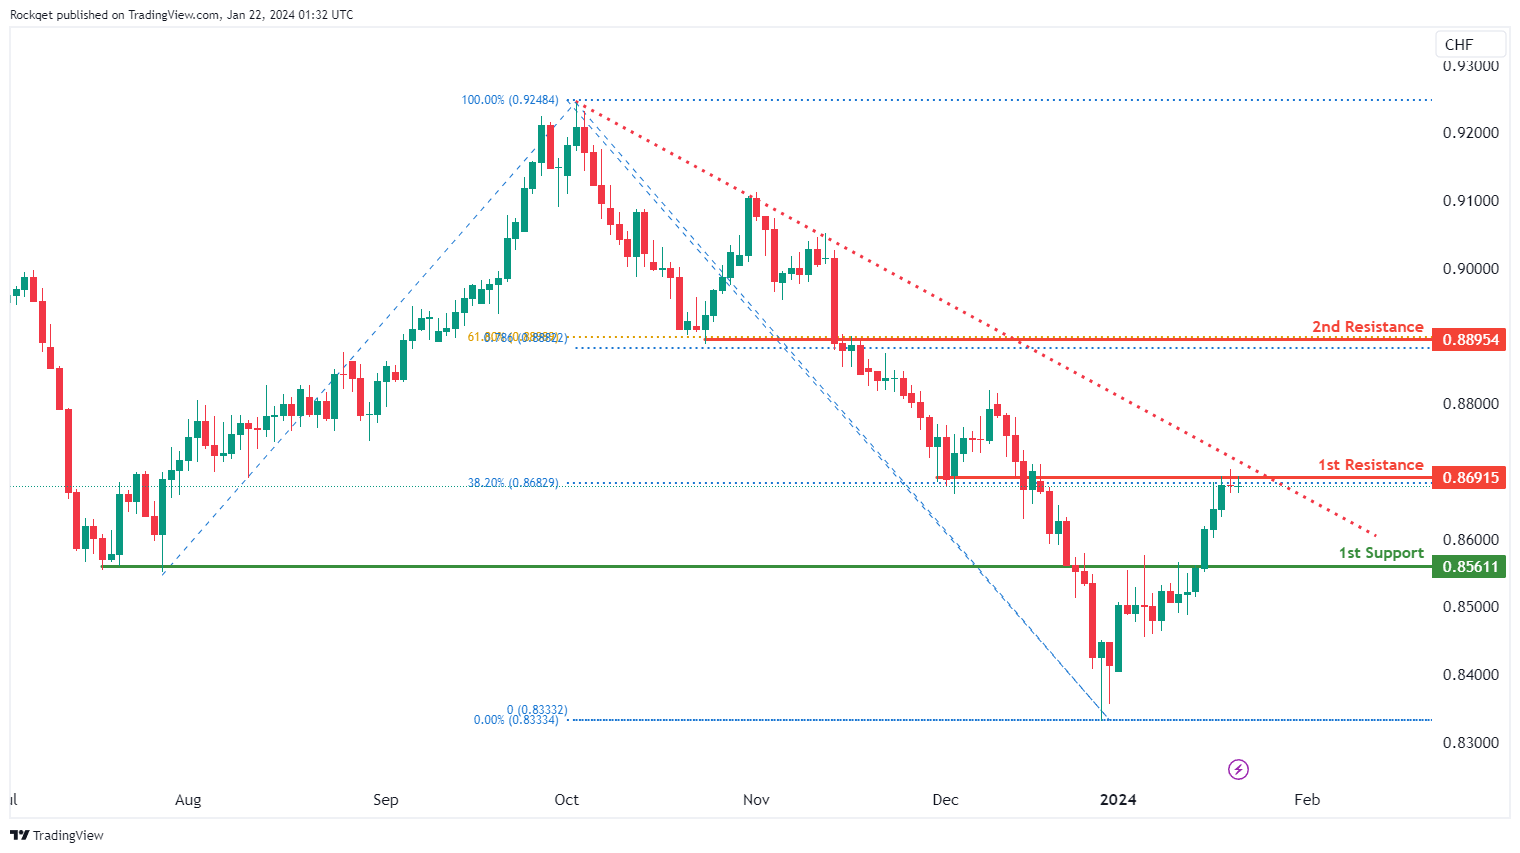
The USD/CHF chart currently exhibits a bearish overall momentum, with factors contributing to this momentum being the price’s position below a major descending trend line. This suggests that bearish momentum is prevalent in the market.
Price could potentially make a bearish reaction off the 1st resistance and drop towards the 1st support.
1st support at 0.8561 is identified as pullback support, indicating a potential area where buying interest may emerge, providing temporary support for USD/CHF.
On the resistance side, 1st resistance at 0.8691 is marked as an overlap resistance, which may act as a barrier for further upward price movement.
2nd resistance at 0.8895 is categorized as an overlap resistance, and it holds significance due to the confluence of the 61.80% Fibonacci Retracement and the 78.60% Fibonacci Projection.
USD/JPY:
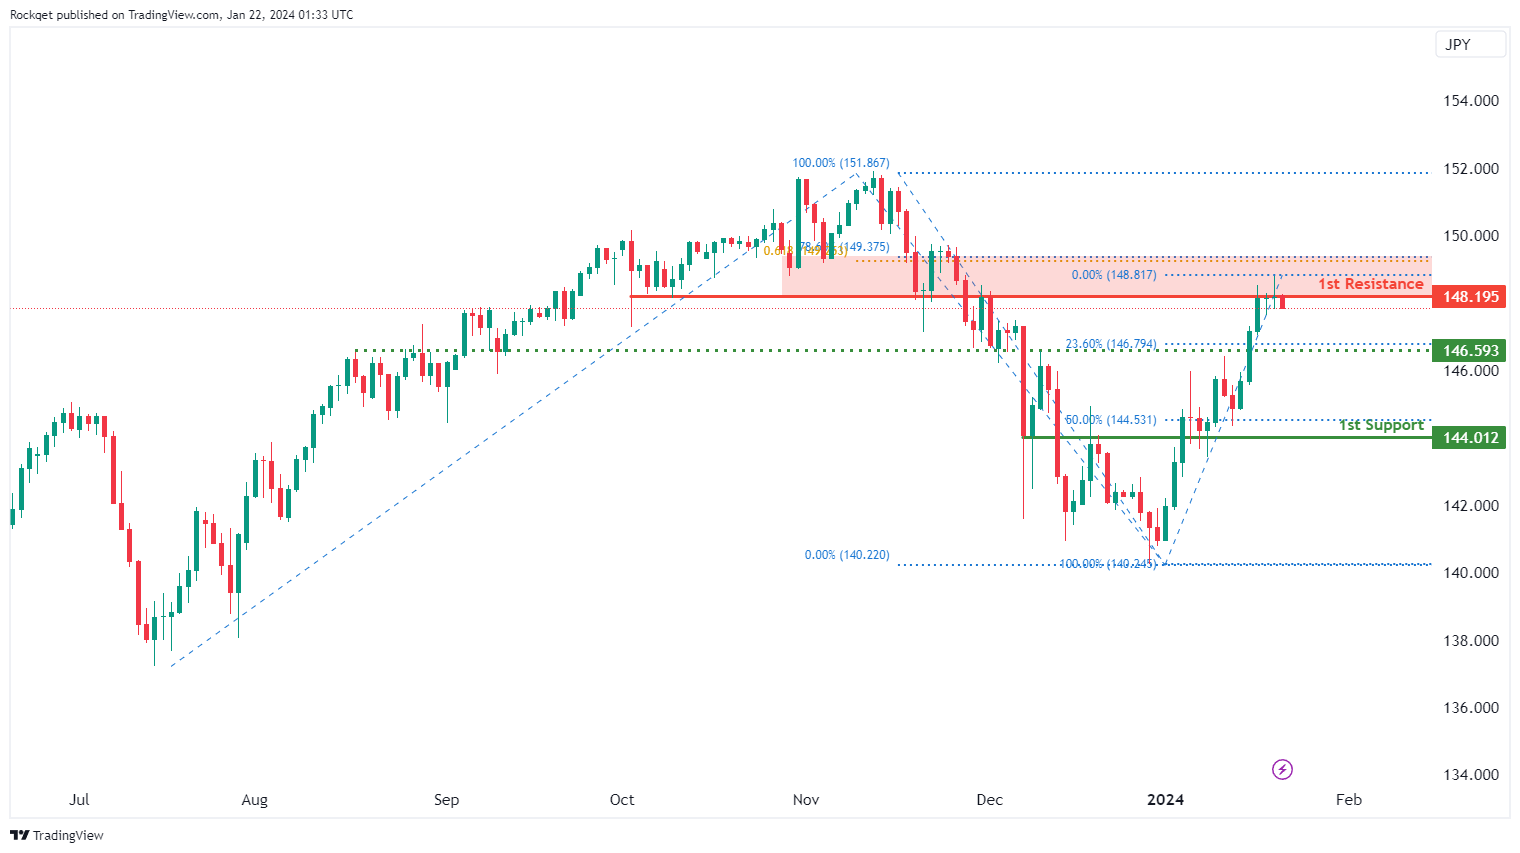
The USD/JPY chart currently exhibits a bearish overall momentum. Price could potentially make a bearish continuation towards the 1st support and the identified support and resistance levels are as follows:
1st support at 144.01 is an overlap support and aligns with the 50% Fibonacci Retracement level. This level is significant as it suggests a potential area where buying interest may emerge, providing temporary support for USD/JPY.
Intermediate support at 146.59 is categorized as a pullback support and is reinforced by the 23.60% Fibonacci Retracement, further adding to its significance as a potential support zone.
On the resistance side, 1st resistance at 148.19 is marked as an overlap resistance, and it may act as a barrier for the price if it attempts to move higher.
USD/CAD:
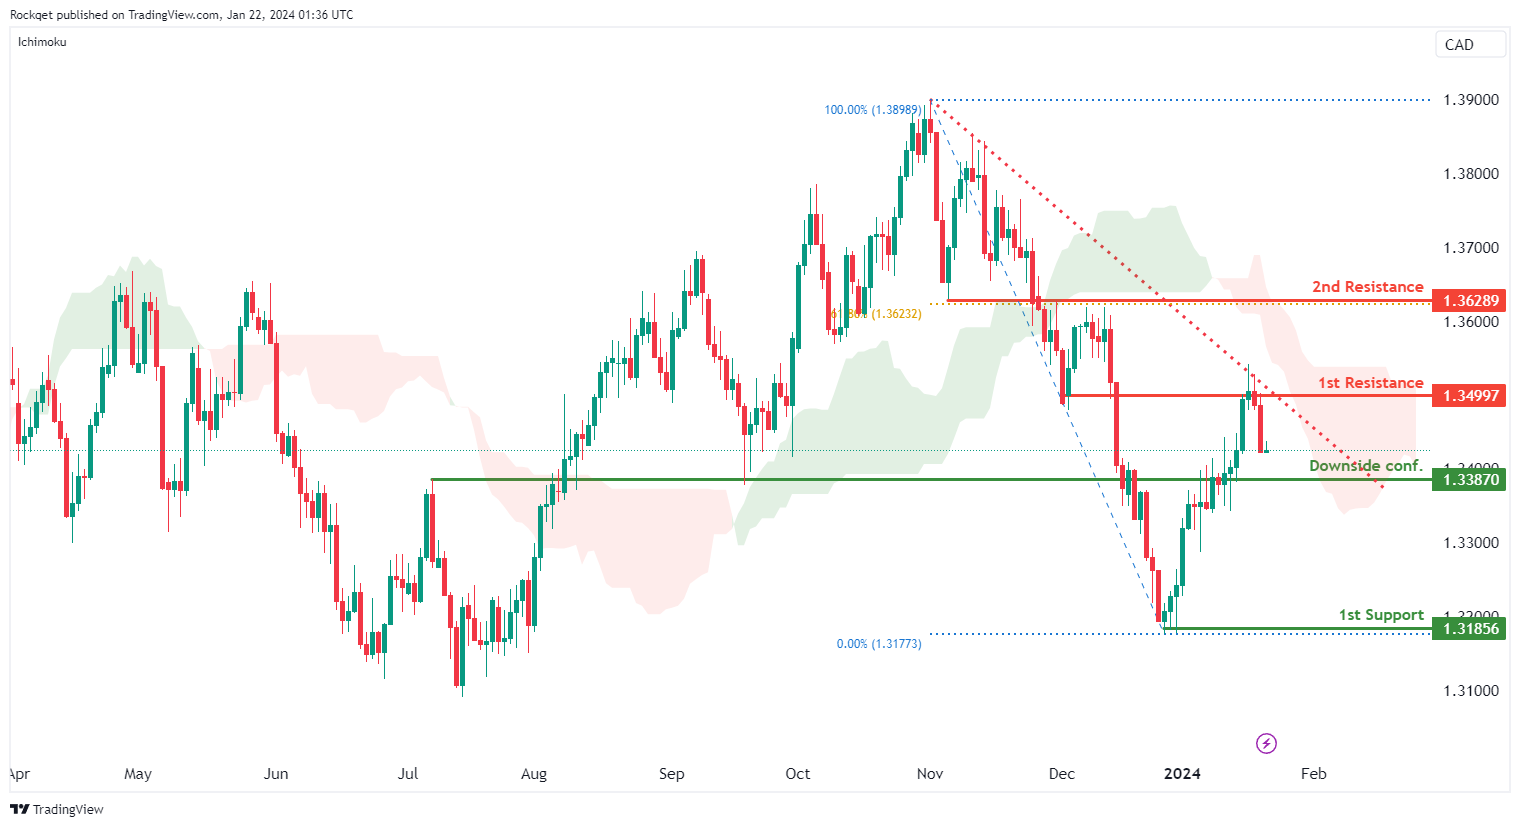
The USD/CAD chart currently exhibits an overall bearish momentum. Factors such as the descending trendline and the bearish Ichimoku Cloud are contributing to this bearish outlook. In this context, there is a potential scenario for price to drop towards the 1st support should it break the Downside Confirmation level.
The Downside Confirmation level at 1.3387 is identified as an overlap support. Further below, the 1st support level at 1.3185 is marked as a swing-low support, further reinforcing its importance as a key support level.
To the upside, the 1st resistance level at 1.3499 is identified as an overlap resistance. Higher up, the 2nd resistance level at 1.3628 is also noted as an overlap resistance that aligns with the 61.80% Fibonacci retracement level, further reinforcing its significance as a potential resistance zone.
AUD/USD:
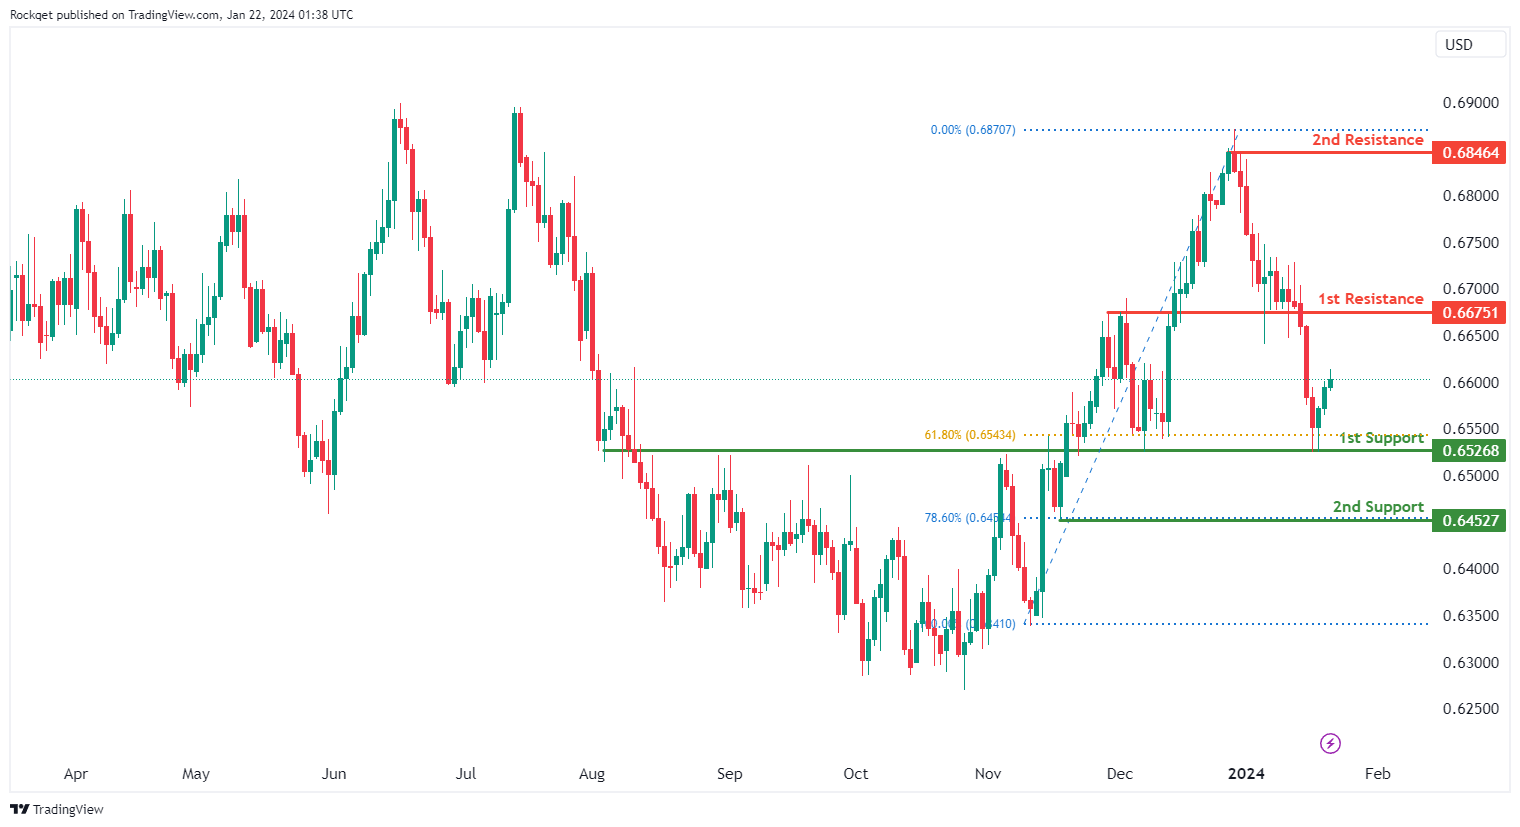
The AUD/USD chart currently exhibits an overall bullish momentum. In this context, there is a potential scenario for price to rise towards the 1st resistance.
The 1st resistance level at 0.6675 is identified as an overlap resistance. Higher up, the 2nd resistance level at 0.6846 is noted as a swing-high resistance, suggesting a potential barrier for further upside movement.
To the downside, the 1st support level at 0.6526 is identified as an overlap support that aligns close to the 61.80% Fibonacci retracement level. Further below, the 2nd support level at 0.6452 is marked as a pullback support that aligns with the 78.60% Fibonacci retracement level, further reinforcing its importance as a key support level.
NZD/USD
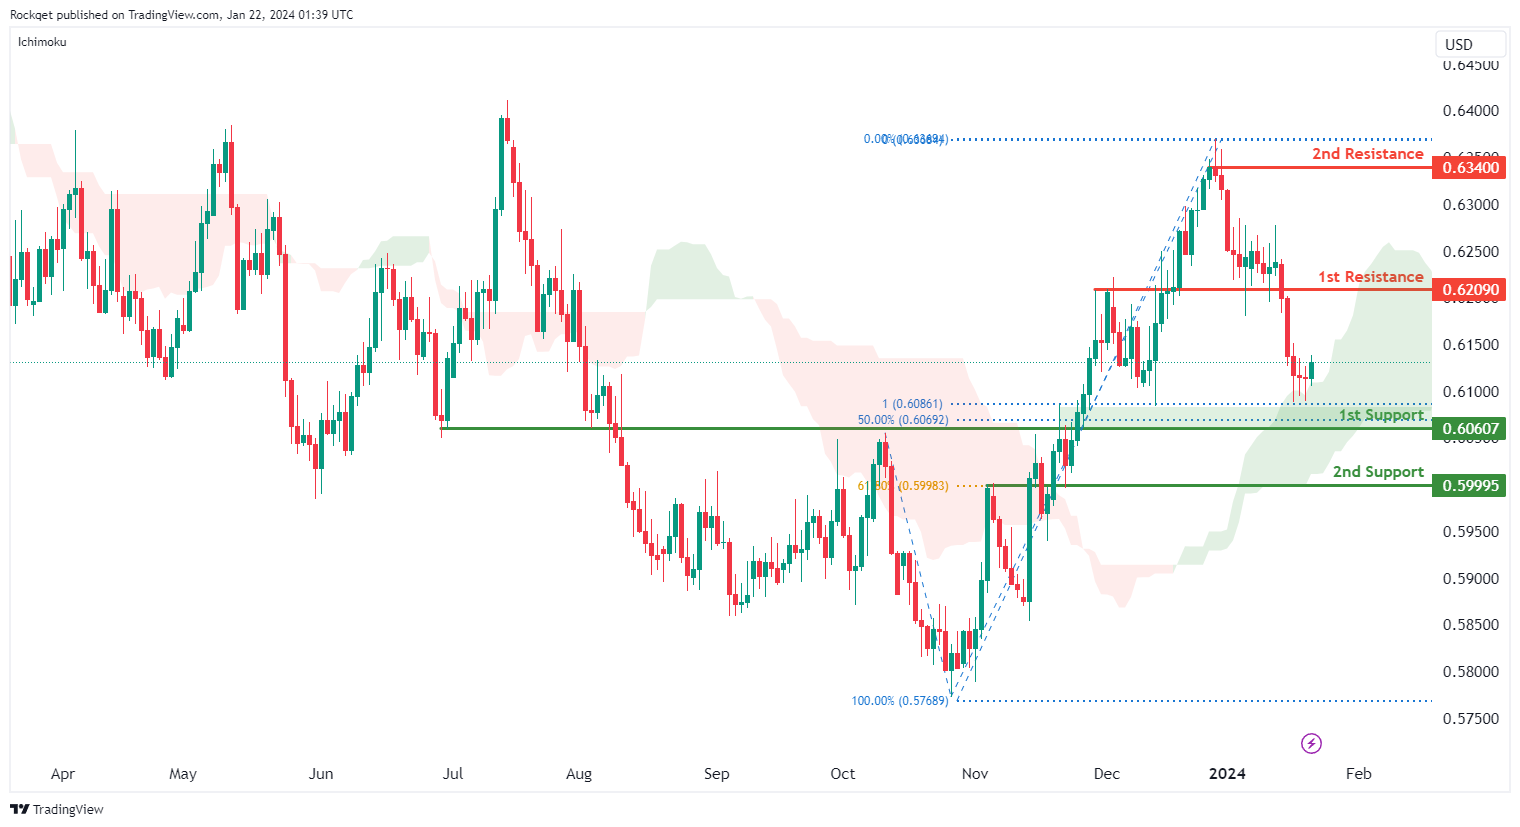
The NZD/USD chart currently exhibits an overall bullish momentum with price finding support just above the bullish Ichimoku Cloud. In this context, there is a potential scenario for price to rise towards the 1st resistance.
The 1st resistance level at 0.6209 is identified as an overlap resistance. Higher up, the 2nd resistance level at 0.6340 is noted as a swing-high resistance, suggesting a potential barrier for further upside movement.
To the downside, the 1st support level at 0.6060 is identified as an overlap support that aligns with a confluence of Fibonacci levels i.e. the 50.00% retracement and the 100.00% projection. Further below, the 2nd support level at 0.5999 is also marked as an overlap support that aligns with the 61.80% Fibonacci retracement level, further reinforcing its importance as a key support level.
DJ30:
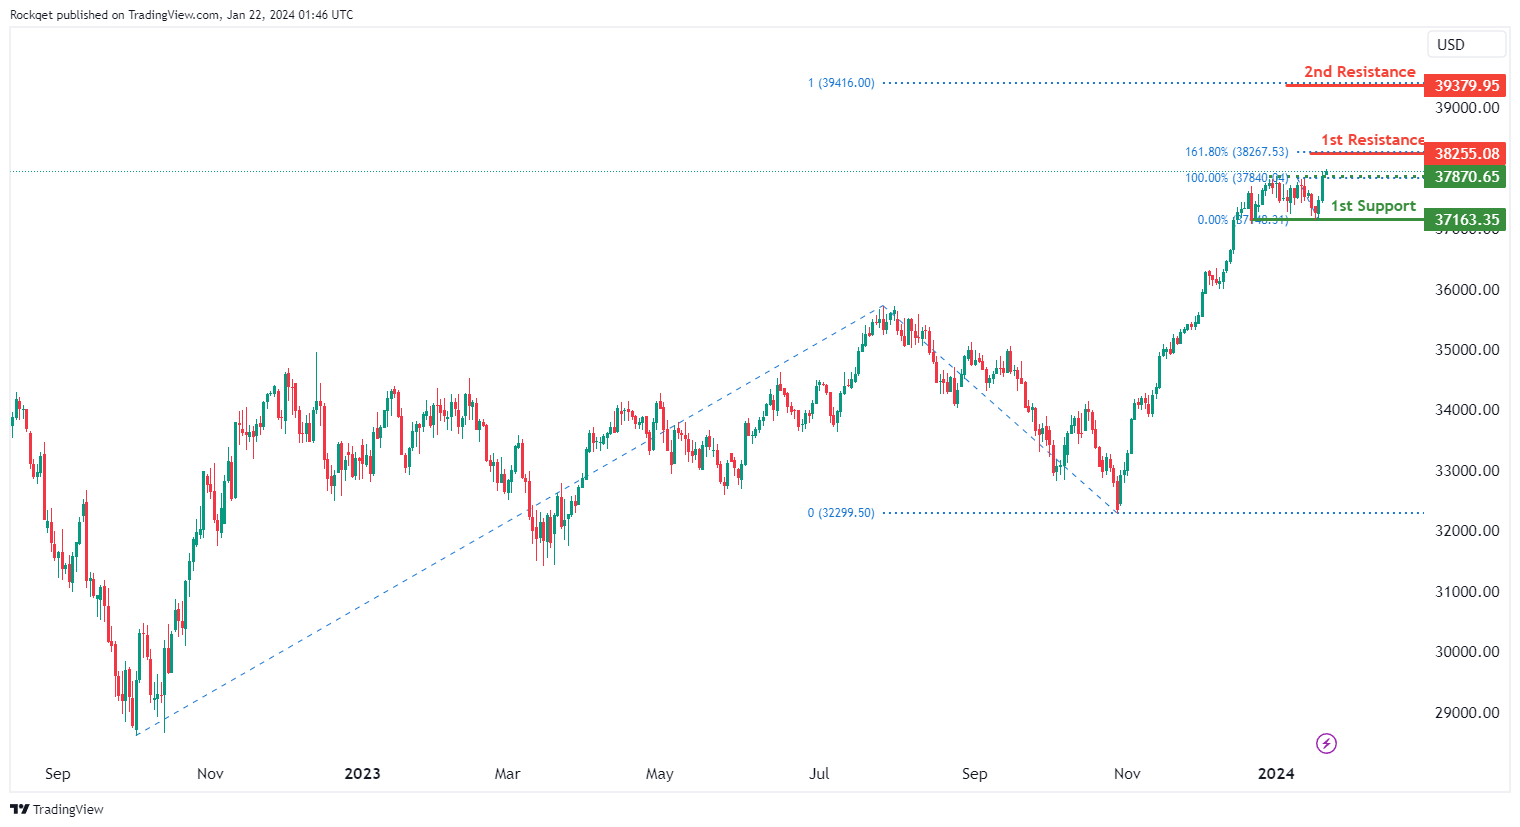
The DJ30 (Dow Jones) chart currently exhibits an overall bullish momentum. In this context, there is a potential scenario for price to rise towards the 1st resistance.
The 1st resistance level at 38,255.08 is identified as a resistance that aligns with the 161.80% Fibonacci extension level. Higher up, the 2nd resistance level at 39,379.95 is noted as a resistance that aligns with the 100.00% Fibonacci projection level, suggesting a potential barrier for further upside movement.
To the downside, the intermediate support level at 37,870.65 is identified as pullback support. Further below, the 1st support level at 37,163.35 is also marked as a pullback support, further reinforcing its importance as a key support level.
GER40:
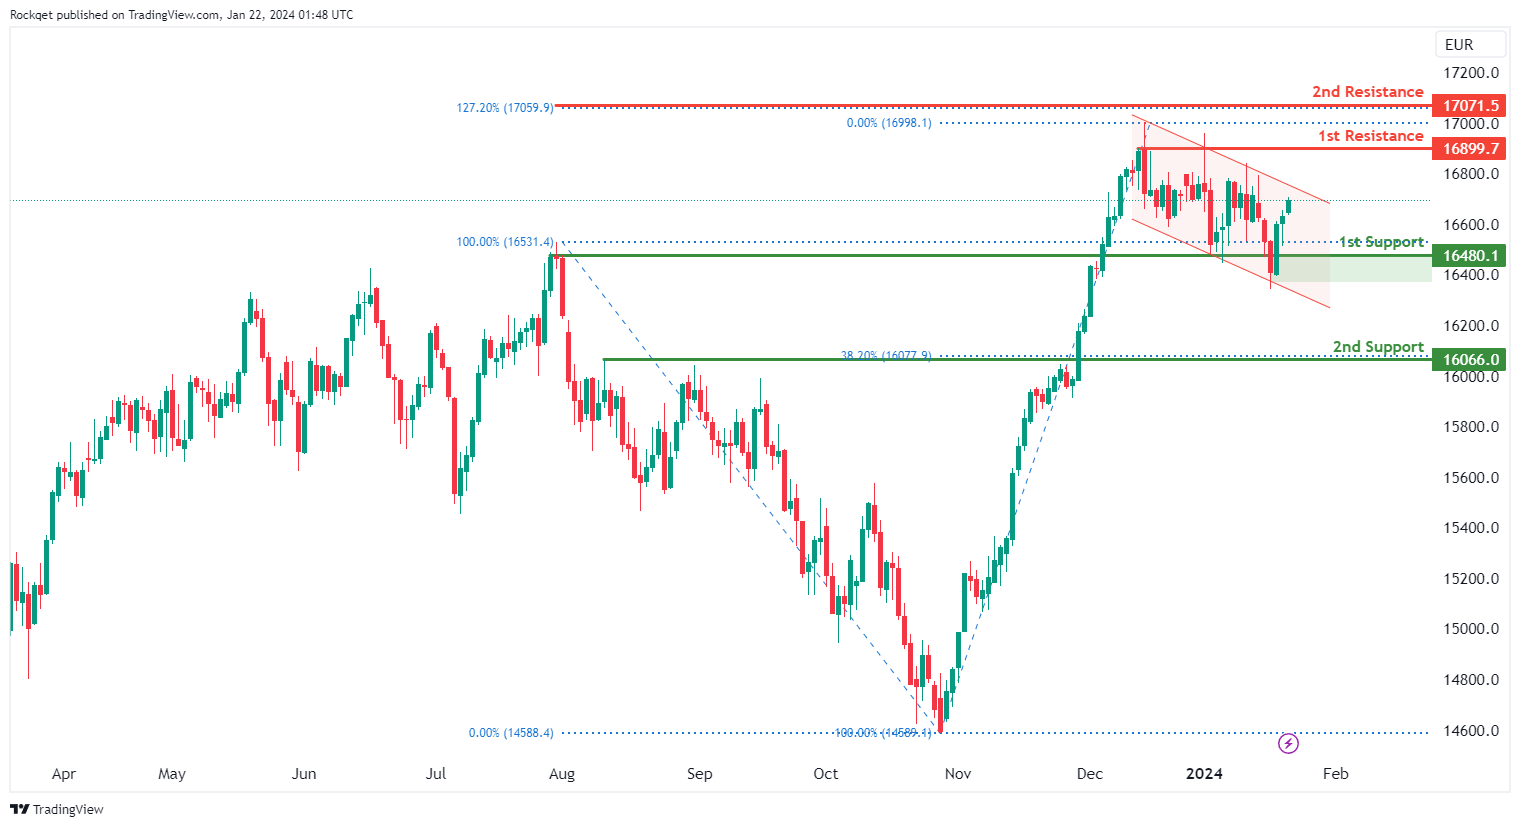
The GER40 (DAX) chart currently exhibits an overall bullish momentum. In this context, there is a potential scenario for price to rise towards the 1st resistance. However, take note that price is also trading within a bearish channel.
The 1st resistance level at 16,899.70 is identified as a pullback resistance. Higher up, the 2nd resistance level at 17,071.50 is noted as a resistance that aligns with the 127.20% Fibonacci extension level, further reinforcing its significance as a potential resistance zone.
To the downside, the 1st support level at 16,480.10 is identified as an overlap support. Further below, the 2nd support level at 16,066.00 is noted as a pullback support that aligns with the 38.20% Fibonacci retracement level, further reinforcing its importance as a key support level.
 US500:
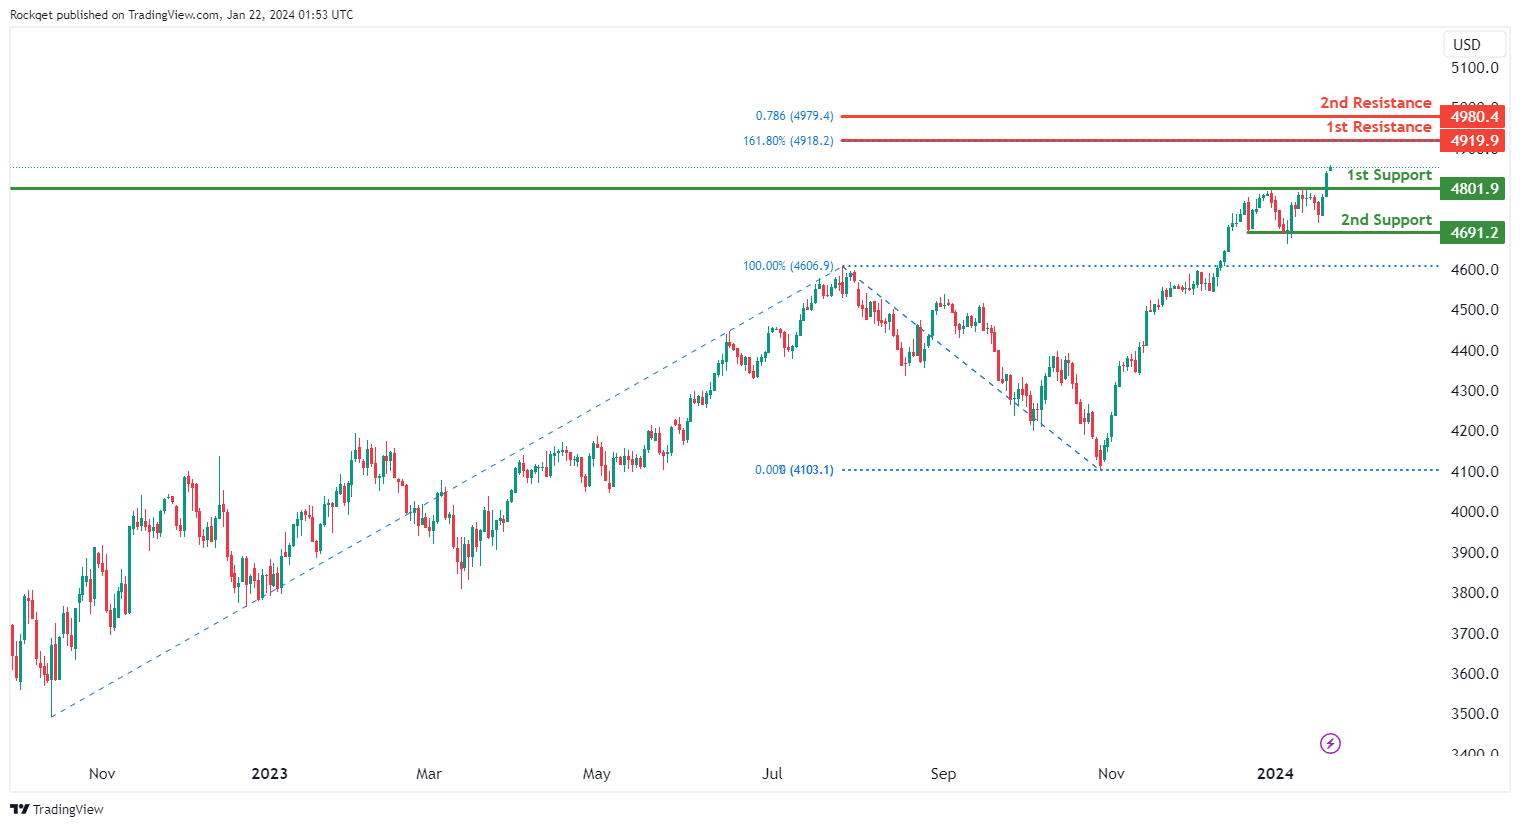
The US500 (S&P 500) chart currently exhibits an overall bullish momentum. In this context, there is a potential scenario for price to rise towards the 1st resistance.
The 1st resistance level at 4,919.90 is identified as a resistance that aligns with the 161.80% Fibonacci extension level. Higher up, the 2nd resistance level at 4,980.40 is noted as a resistance that aligns with the 78.60% Fibonacci projection level, further reinforcing its significance as a potential resistance zone.
To the downside, the 1st support level at 4,801.90 is identified as a pullback support. Further below, the 2nd support level at 4,691.20 is also noted as a pullback support, further reinforcing its importance as a key support level.
BTC/USD:
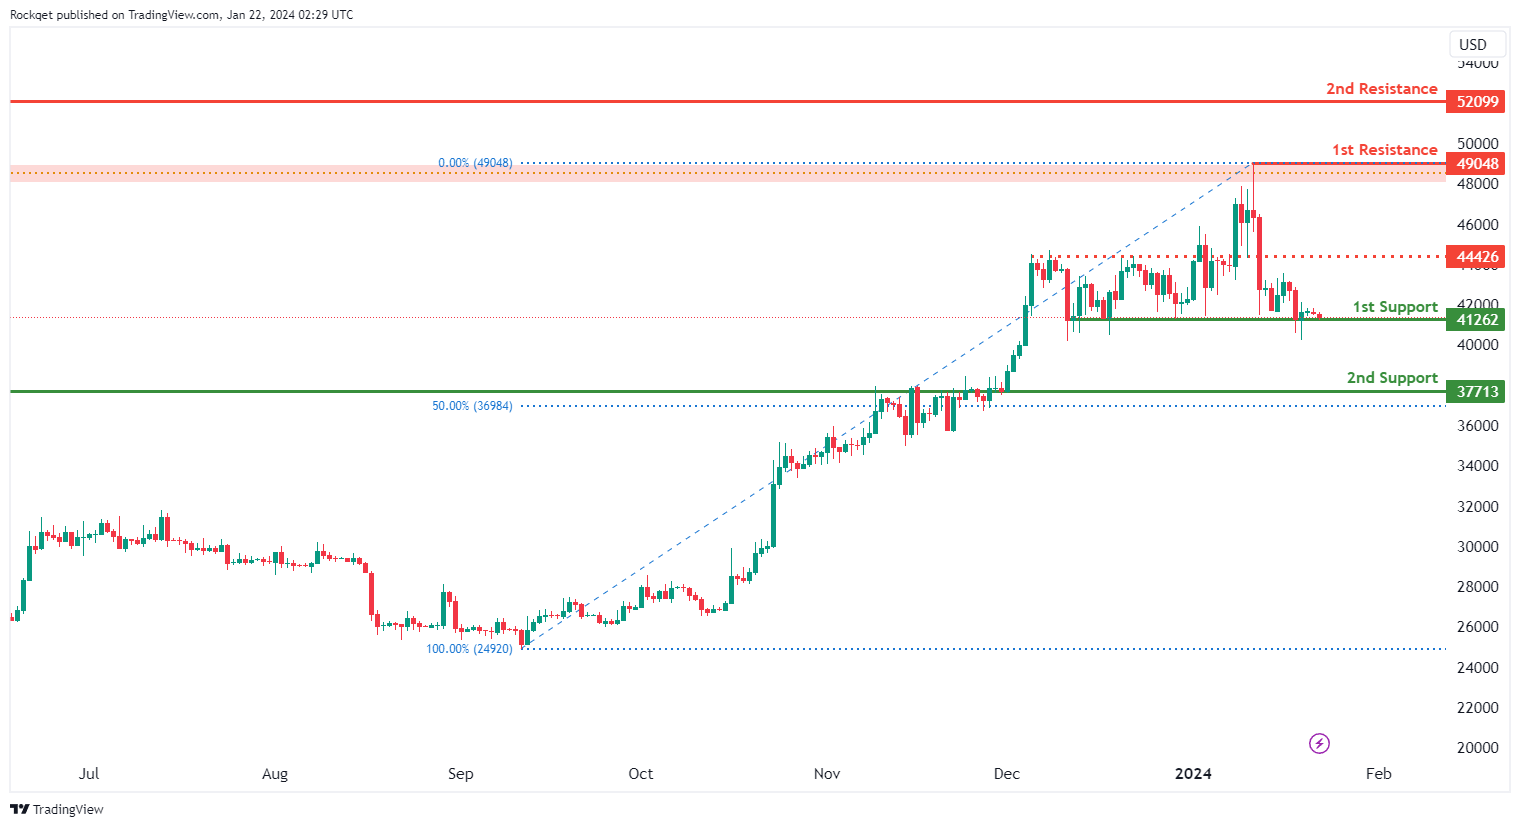
The BTC/USD (Bitcoin) chart currently exhibits an overall bullish momentum. However, there is a potential scenario for price to fall towards the 1st support before making a bullish bounce to resume the uptrend.
The 1st support level at 41,262.00 is identified as a pullback support. Further below, the 2nd support level at 37,713.00 is marked as an overlap support that aligns close to the 50.00% Fibonacci retracement level, further reinforcing its importance as a key support level.
To the upside, the intermediate resistance level at 44,426.00 is identified as an overlap resistance while the 1st resistance level at 49,048.00 is marked as a swing-high resistance that aligns close to the 61.80% Fibonacci retracement level. Higher up, the 2nd resistance level at 52,099.00 is also noted as a swing-high resistance, suggesting a potential barrier for further upside movement.
ETH/USD:
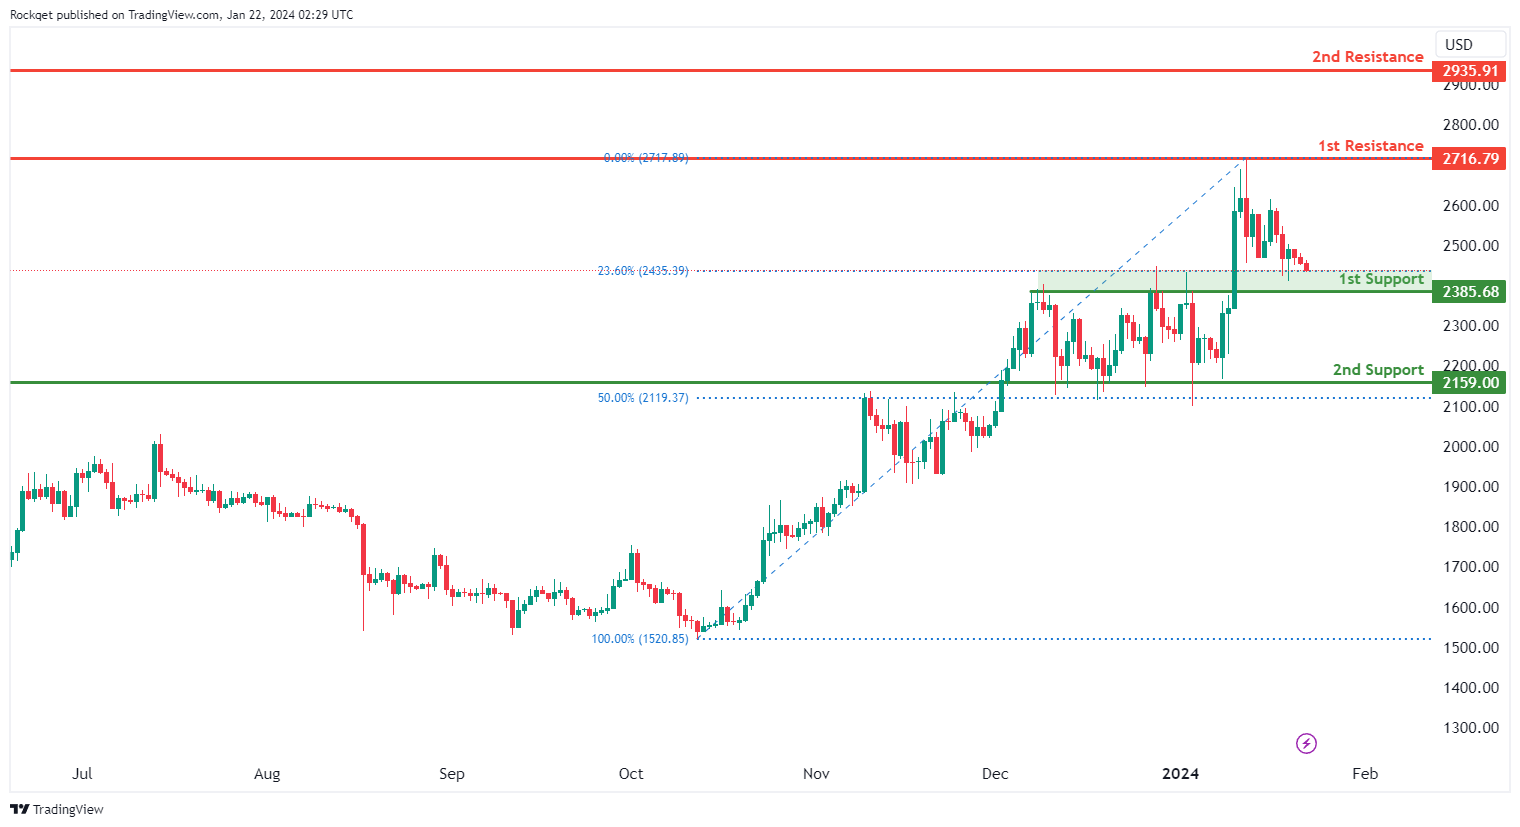
The ETH/USD (Ethereum) chart currently exhibits an overall bearish momentum. However, there is a potential scenario for price to fall towards the 1st support before making a bullish bounce to resume the uptrend.
The 1st support level at 2,385.68 is identified as a pullback support that aligns close to the 23.60% Fibonacci retracement level. Further below, the 2nd support level at 2,159.00 is marked as an overlap support that aligns close to the 50.00% Fibonacci retracement level, further reinforcing its importance as a key support level.
To the upside, the 1st resistance level at 2,716.79 is identified as an overlap resistance. Higher up, the 2nd resistance level at 2,935.91 is noted as a pullback resistance, suggesting a potential barrier for further upside movement.
WTI/USD:
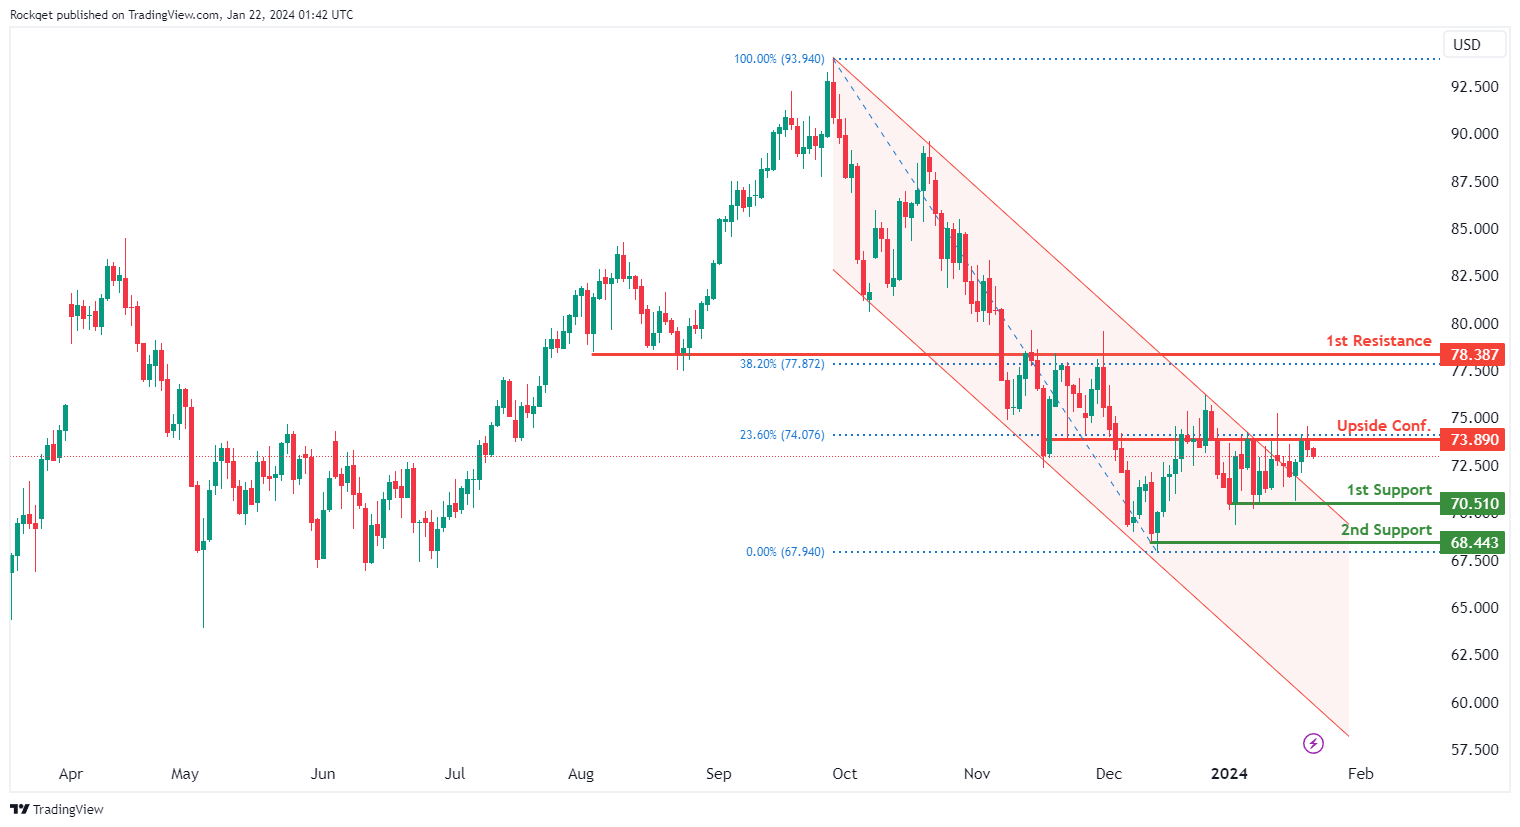
The WTI (West Texas Intermediate) chart currently exhibits an overall bearish momentum. However, price has broken above the upper trendline of the bearish channel. In this context, there is a potential scenario for price to rise towards the 1st resistance should it break above the Upside Confirmation level.
The Upside Confirmation level at 73.89 is identified as an overlap resistance that aligns with the 23.60% Fibonacci retracement level. Higher up, the 1st resistance level at 78.38 is also noted as an overlap resistance that aligns close to the 38.20% Fibonacci retracement level, suggesting a potential barrier for further upside movement.
To the downside, the 1st support level at 70.51 is identified as a pullback support. Further below, the 2nd support level at 68.44 is marked as a swing-low support, further reinforcing its importance as a key support level.
XAU/USD (GOLD):
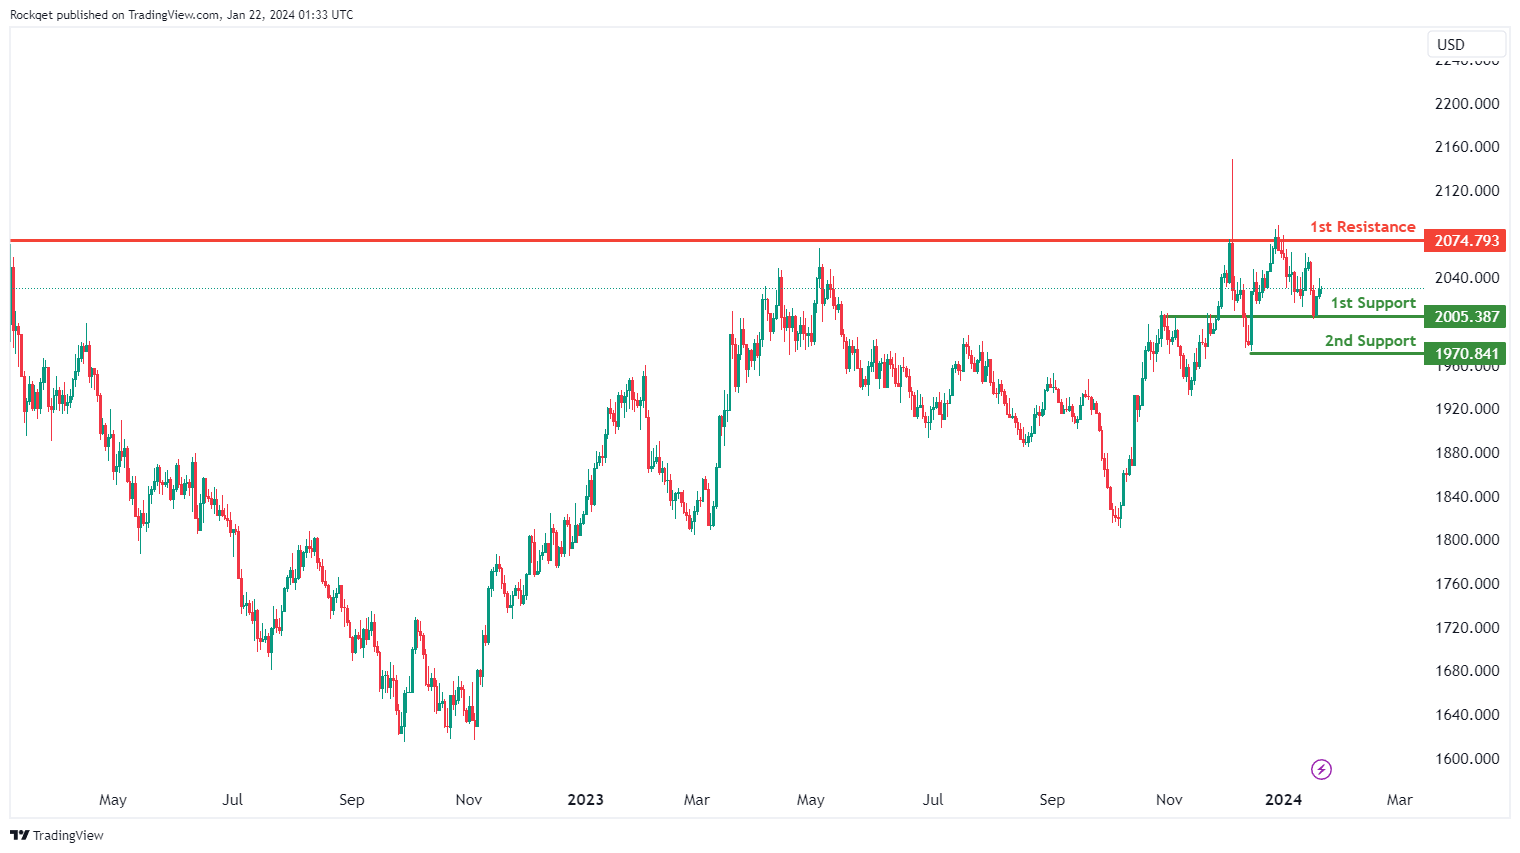
The XAUUSD (Gold/US Dollar) chart presently displays a bullish overall momentum, indicating strength in the price of gold. This bullish momentum implies the possibility of a bullish continuation towards the 1st resistance level.
The 1st resistance level at 2074.79 is identified as an overlap resistance, signifying its historical significance as both a support and resistance level. It may serve as a potential hurdle for further upward price movement.
On the support side, the 1st support at 2005.38 is recognized as an overlap support, underlining its importance as a level where price has previously found both support and resistance. This level could offer potential buying interest, acting as a temporary support for XAUUSD.
The 2nd support at 1970.84 is categorized as a swing low support, pointing to its significance as a previous low point on the chart, which might serve as a support level during price pullbacks.
PBoC holds 1-yr and 5-yr LPR steady
People's Bank of China announced today that it would maintain one-year loan prime rate at 3.45%, a level unchanged since August last year. Similarly, five-year rate, critical for mortgage financing, remains steady at 4.2%, consistent since its last reduction in June. This decision follows PBoC's unexpected move last week to keep its medium-term lending facility rate stable.
PBoC's decision to hold rates steady comes amid a sluggish economic environment in China, coupled with increasing deflationary pressures. Despite these challenges, the central bank appears reluctant to employ interest rate reductions as a tool to stimulate the economy, primarily due to concerns over the depreciating Yuan. PBoC might continue to avoid further rate cuts until Yuan regains some stability, to prevent exacerbating the currency's depreciation.
USD/CNH's break of 55 D EMA last week suggests that the corrective pull back from 7.3679 has completed at 7.0870 already. That came after drawing support from 38.2% retracement of 6.6971 to 7.3679 at 7.1117. Further rise is now mildly in favor as long as 7.1589 minor support holds, back to retest 7.3679 high.
EUR/USD Could Restart Increase If It Clears This Resistance
Key Highlights
- EUR/USD declined below 1.0920 and tested the 1.0845 zone.
- A key bearish trend line is forming with resistance near 1.0900 on the 4-hour chart.
- GBP/USD is eyeing a decent increase above the 1.2750 resistance.
- Gold prices found support near $2,000 and started a fresh increase.
EUR/USD Technical Analysis
The Euro failed to clear the 1.1120 resistance and started a fresh decline against the US Dollar. EUR/USD dropped below the 1.0950 and 1.0920 levels to enter a bearish zone.
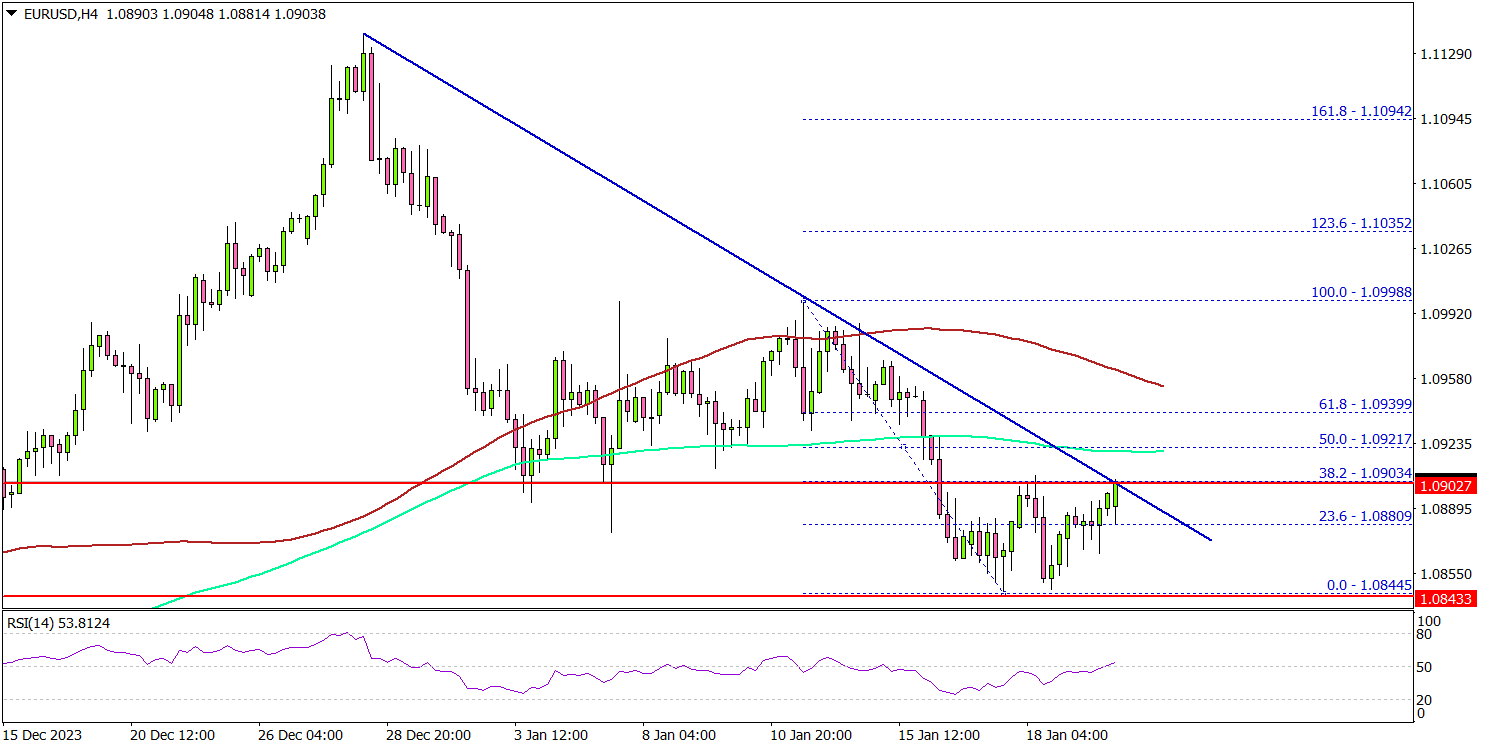
Looking at the 4-hour chart, the pair settled below the 1.0950 level, the 100 simple moving average (red, 4 hours), and the 200 simple moving average (green, 4 hours). Finally, the bulls appeared near the 1.0845 level.
A low was formed near 1.0844 and the pair is now attempting a fresh increase. There was a minor move above the 1.0880 level. The pair is now facing resistance near the 1.0900 level.
There is also a key bearish trend line forming with resistance near 1.0900 on the same chart. The next key resistance is near the 1.0940 zone. A close above the 1.0940 zone could open the doors for more upsides. The next stop for the bulls might be 1.0985.
If there is no move above 1.0900, the pair might continue to move down. Immediate support is seen near the 1.0865 level. The first major support is near the 1.0845 level.
The next major support sits near the 1.0800. A downside break below the 1.0800 zone could spark a sustained decline. The next major support is 1.0760 below which the pair might decline and test 1.0720.
Looking at GBP/USD, the pair is slowly moving higher and might gain bullish momentum if there is a clear move above the 1.2750 resistance.
Economic Releases
- German Buba Monthly Report.
Nasdaq-100 Wave Analysis
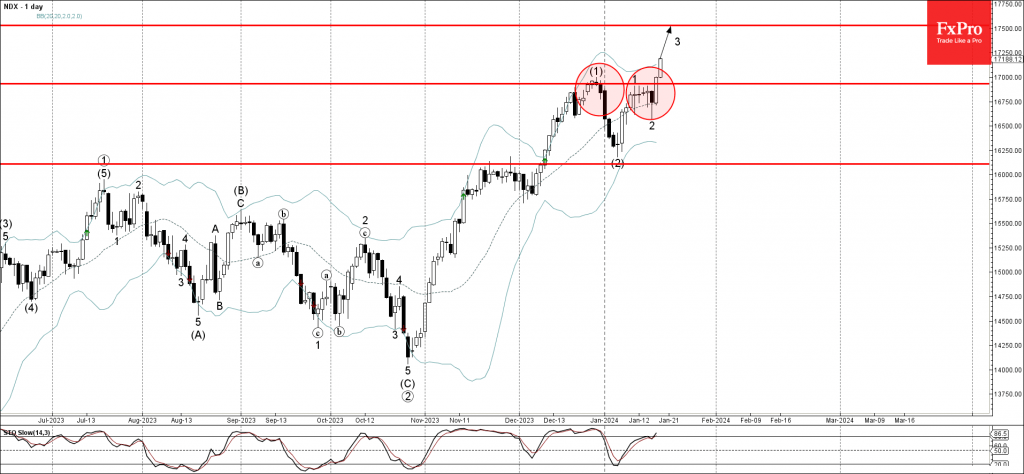
- Nasdaq-100 broke resistance level 16930.00
- Likely to rise to resistance level 17500.00
Nasdaq-100 index recently broke the key resistance level 16930.00, which stopped the previous impulse waves (1) and 1.
The breakout of the resistance level 16930.00 accelerated the active minor impulse wave 3 of the higher order impulse sequence (3) from the start of this year.
Given the strong daily uptrend, Nasdaq-100 index can be expected to rise further to the next resistance level 17500.00 (target for the completion of the active impulse wave 3).
Dollar Soars and Stocks Hit Records as Markets Rethink Rate Cut Timing
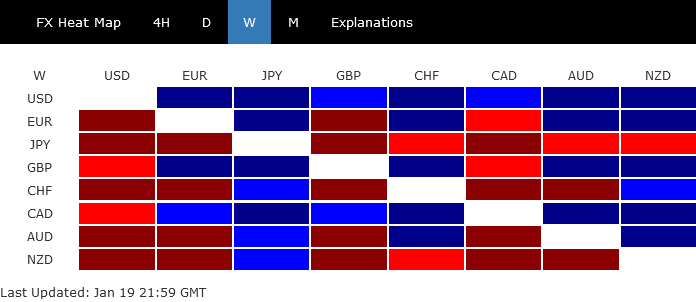
Last week's market development suggest growing skepticism among traders on their own aggressive bets on early rate cut by major central banks. After a batch of economic data from US and UK, as well as the chorus of central banker comments, Q2 is starting to look much less likely for the start of a global monetary easing cycle.
This reassessment has led to an uptick in benchmark treasury yields across US, UK, and Germany. Beyond that, the impact notably varied across regions reflecting the differing economic resilience. Dollar stood out as the strongest performer while US stock markets reached new record highs. Sterling and Euro also saw gains against most other major currencies, though they were outshone the Canadian Dollar, which clinched the second spot in currency strength rankings.
In contrast, Japanese Yen faced significant headwinds as the week's weakest performer. Japan's latest inflation data did not provide the signs of a wage-price spiral, a key factor BoJ has been monitoring for its policy direction. Meanwhile, Swiss Franc also suffered, with its performance impacted by the shifting rate cut expectations in other major economies and concerns raised by SNB about the adverse effects of strong Franc on the economy.
Australian and New Zealand Dollars, on the other hand, were weighed down by the increasing pessimism surrounding China's economic prospects. As countries closely tied to China's economic performance, the deteriorating outlook in China has had a ripple effect on these currencies as usual.
Robust US consumer data eclipses waning bets on Fed cut
US stocks staged a remarkable rally last week, with DOW and S&P 500 reaching new record highs and NASDAQ climbing to its highest level in over two years. Investor sentiment was bolstered by a combination of robust consumer data and declining inflation expectations. Interestingly, this positive market trend has unfolded even as traders have scaled back their bets on a Fed rate cut in March.
A series of robust US economic data collectively suggest that Fed's previous rate hikes have been well absorbed by consumers and the economy is well-positioned for a strong start in 2024. December retail sales outperformed expectations, registering 0.6% mom increase against forecasted 0.4% om. Ex-auto sales also exceeded 0.2% mom predictions by rising 0.4% mom. University of Michigan consumer sentiment index surged substantially from 69.7 to 78.8 in January, hitting its highest mark since July 2021. Additionally, one-year inflation expectation in the same survey fell from 3.1% to 2.9%, hitting the lowest point since December 2020. Furthermore, initial jobless claims dropped to 187k, the lowest since September 2022.
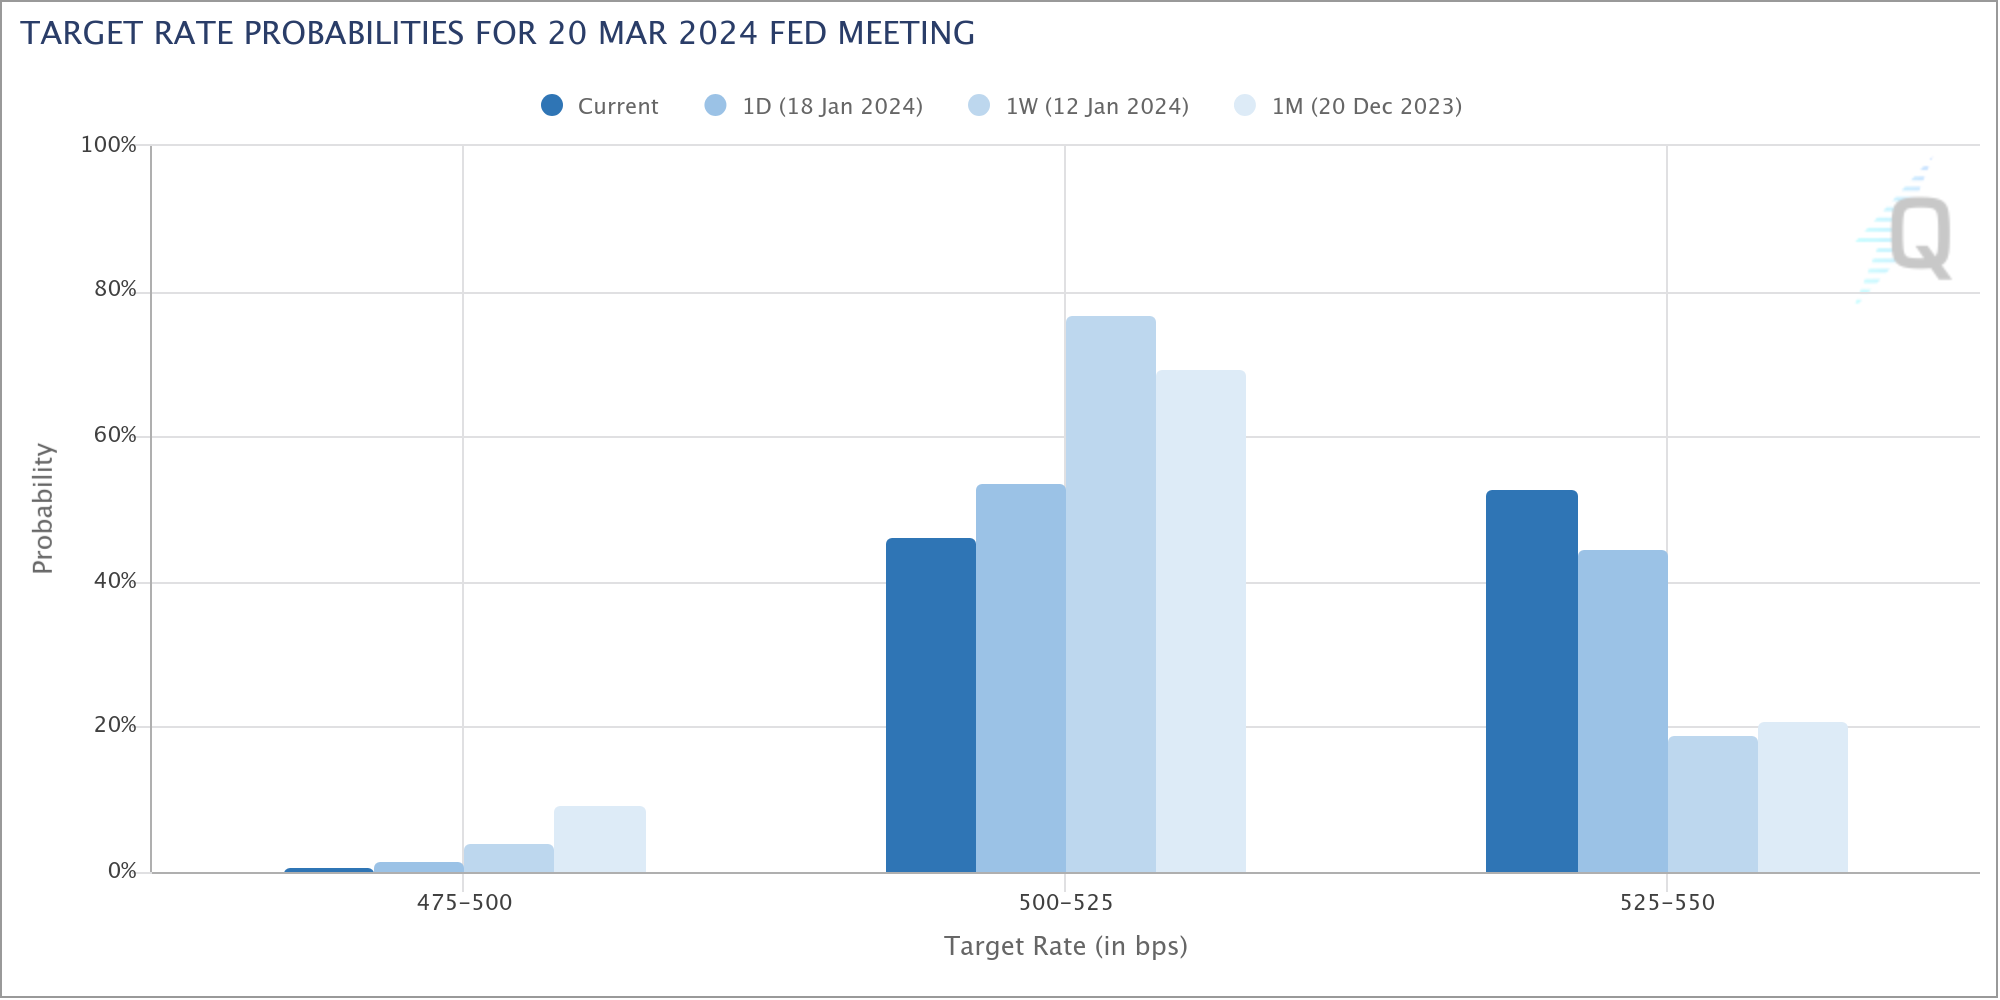
At the same time, Fed fund futures market has scaled back its expectations for a March rate cut, with the likelihood now standing at just 47%. This is a significant decrease from the 81% probability priced in just a week ago. Fed might lean towards maintaining the current restrictive monetary policy for a longer duration to ensure the economy does not overheat again. While three rate cuts are still anticipated this year, the first might not occur until the third quarter. As Atlanta Fed President Raphael Bostic, a centrist, noted, the bar for a rate cut before July is high.
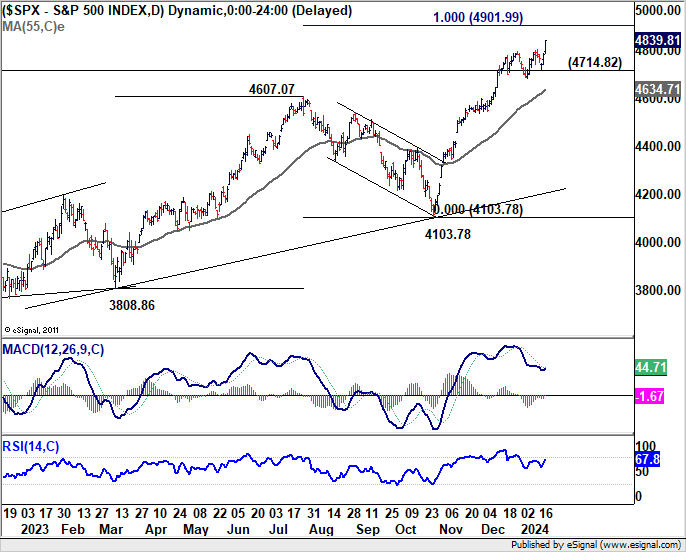
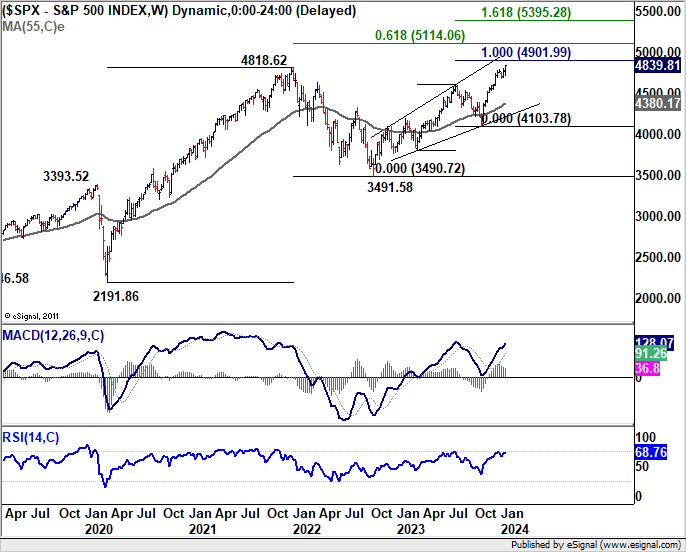
Technically, S&P 500 is now on track to next near term target of 100% projection of 3808.86 to 4607.07 from 4103.78 at 4901.99. But the real test lies in the zone between 5000 psychological level and 61.8% projection of 2191.86 to 4818.62 from 3491.58 at 5395.28. In any case, outlook will remain bullish as long as 4714.82 support holds.
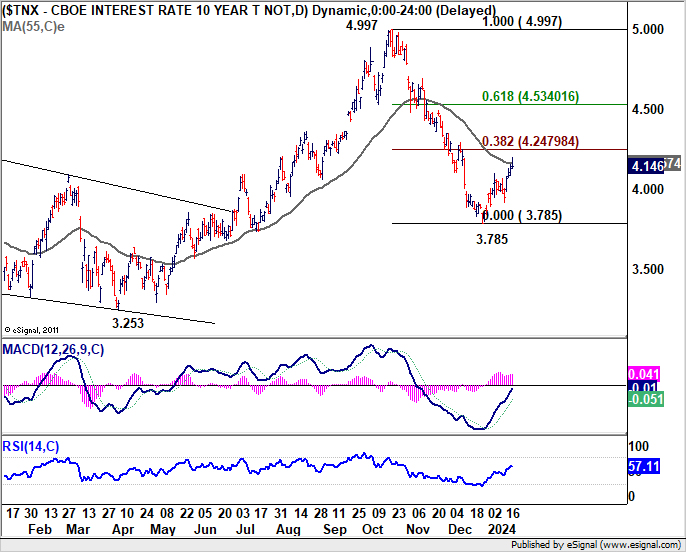
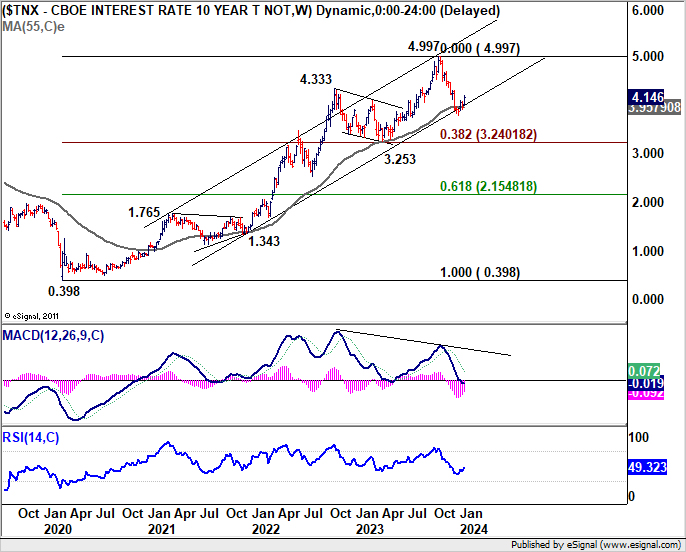
10-year yield's recovery from 3.785 extended higher last week, and met 55 D EMA (now at 4.163). While further rise cannot be ruled out, strong resistance is expected from 38.2% retracement of 4.997 to 3.785 at 4.247 to limit upside. As expectation of Fed rate cut regrows at a later stage, TNX should resume the decline from 4.997 through 3.785. However, decisive break of 4.247 could be a signal of some fundamental shifts in Fed expectation, that opens up further rally to 61.8% retracement at 4.534.
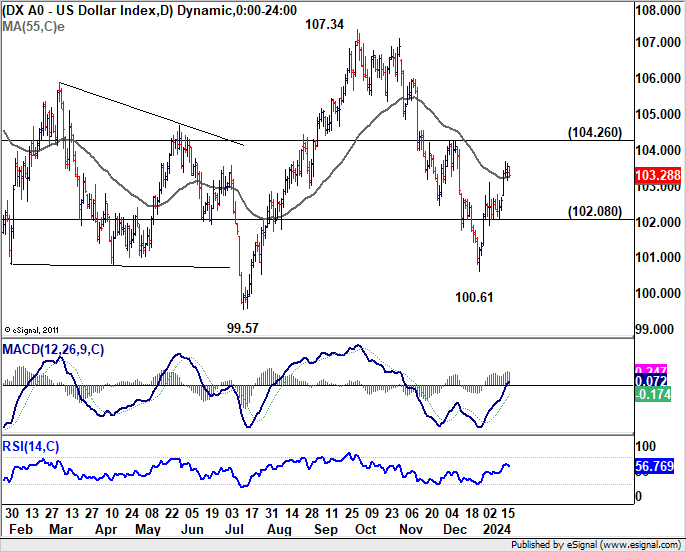
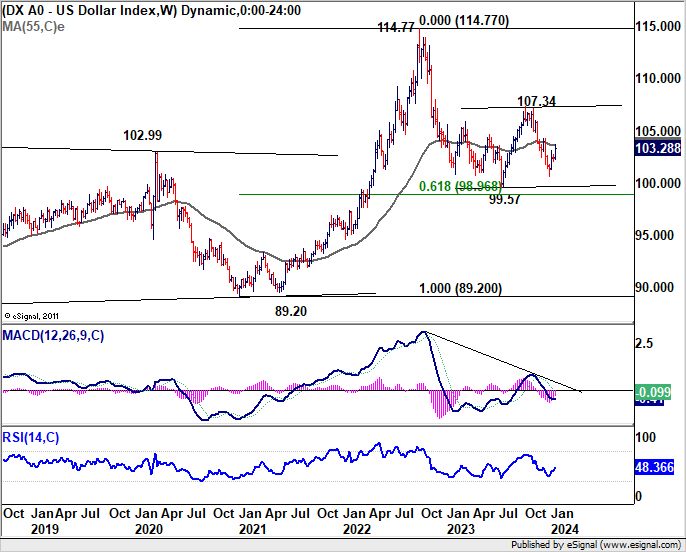
Dollar Index's rebound from 100.61 short term bottom extended higher last week. The break of 55 D EMA (now at 103.24) argues that fall from 107.34 has completed. Rise from 100.61 could be the third leg of the consolidation pattern from 99.57. Further rise is in favor as long as 102.08 support holds. Break of 104.26 resistance will strength this bullish case and target 107.334 next.
Global markets show divergence as China struggles
The positive momentum in US stock markets contrasts starkly with the performance of other global markets. FTSE closed the week with down over -2%, reacting to a combination of stronger-than-expected UK CPI data and weaker-than-anticipated retail sales figures. These developments placed BoE in a difficult position, as its ability to cut interest rate is constrained, while the ongoing restrictive monetary policy continues to impact the UK economy negatively. In Europe, both DAX and CAC ended the week with slight losses, indicating cautious sentiment among investors in these markets. Meanwhile, Japan's Nikkei index achieved another three-decade high, though it only recorded a modest weekly gain of 1.1%.
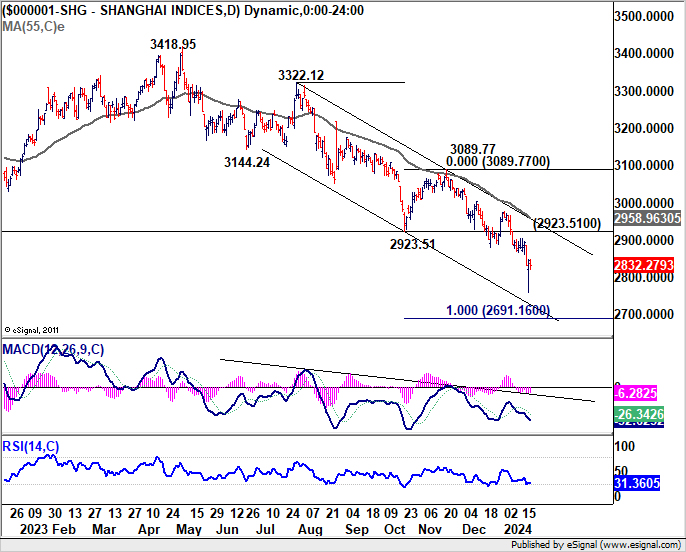
However, the most significant downturns were observed in the markets of China and Hong Kong, with recent rout intensifying The Shanghai SSE Composite plunged to its lowest level since April 2020, and the Hong Kong HSI also tumbled its lowest point in over a year. Despite China achieving its official growth target last year, recent data releases, including Q4 GDP and retail sales, have not been well-received by the markets. Investors perceived the economic performance as mixed at best, raising fresh concerns about the country's future prospects. Additionally, China is currently experiencing a significant deflationary period coupled with continuous decline in home prices, and hope for forceful stimulus by the government is dim.
Technically speaking, while further decline is expected in China Shanghai SSE, there is prospect of some support from 100% projection of 3322.12 to 3923.51 from 3089.77 at 2691.16 to bring a sustainable bounce. However, firm break of 2923.51 support turned resistance is needed to signal short term bottoming first. Otherwise, risk will stay on the downside even in case of strong recovery.
NZD and AUD weaken amidst China's market slump
Because of the close economic ties with China, New Zealand and Australian Dollar weakened notably last week, following the decline in Chinese stocks.
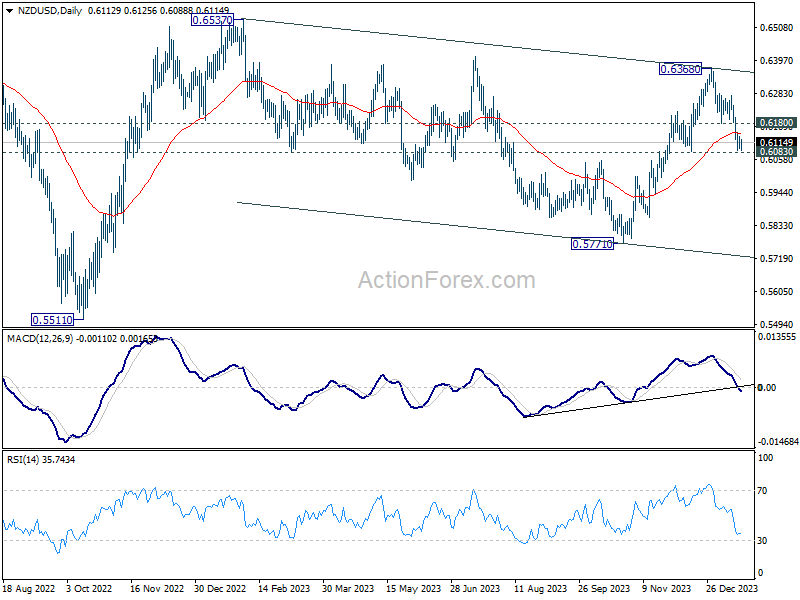
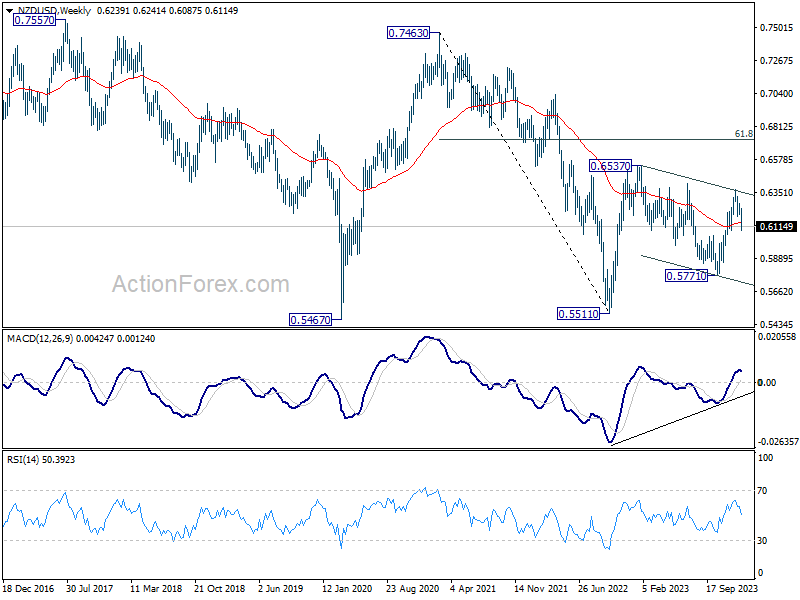
After breaking through 55 D EMA (now at 0.6144), NZD/USD pressing 0.6083 key near term support. Sustained break there will argue that whole rebound from 0.5771 has completed at 0.6368 already. More importantly, that would argue that whole corrective fall from 0.6537 (2023 high) is still in progress, with fall from 0.6368 has the third leg. In the case, near term outlook will be turned bearish for 0.5771 support and possibly below
Nevertheless, strong bounce from current level, followed by decisive break of 0.6180 resistance, will retain near term bullishness. NZD/USD should then head for a test on 0.6368 instead.
Similarly, AUD/USD also broke through 55 D EMA (now at 0.6620). And it's now pressing 0.6524 support. Sustained break there will argue that rebound from 0.6269 has completed at at 0.6870. Deeper fall would then be seen back to 0.6269 support and possibly below. Nevertheless, strong bounce from current level, followed by firm break of 0.6639 resistance, will retain near term bullishness. AUD/USD should then rise further to retest 0.6870.
USD/JPY Weekly Outlook
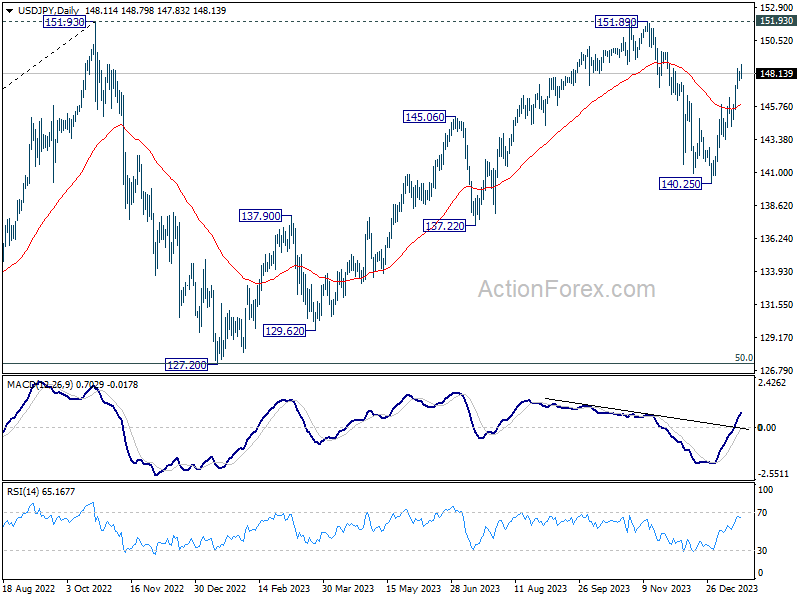
USD/JPY's rise from 140.25 extended to as high as 148.79 last week, then retreated mildly. Initial bias remains neutral this week for some consolidations first. Current development argues that whole pull back from 151.89 has already completed. Further rise is in favor as long as 145.97 resistance turned support holds. Above 148.79 will target 151.89/93 key resistance zone.
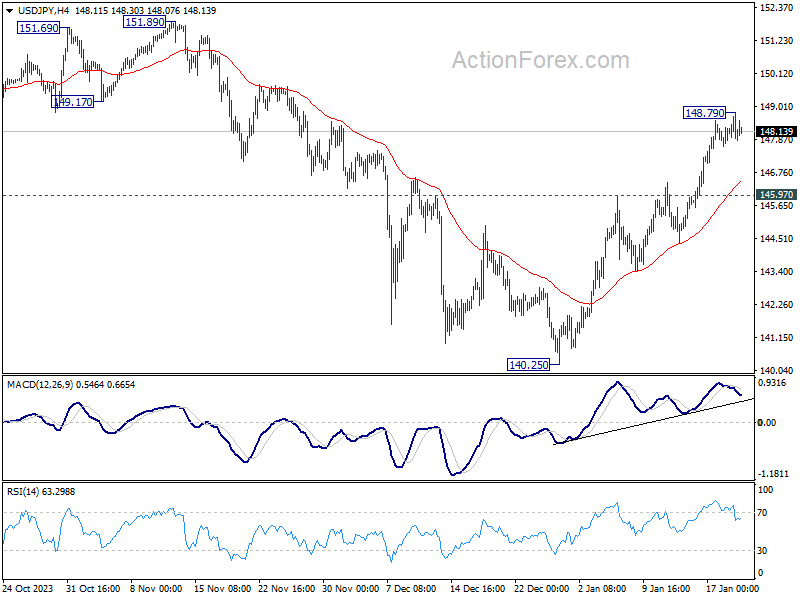
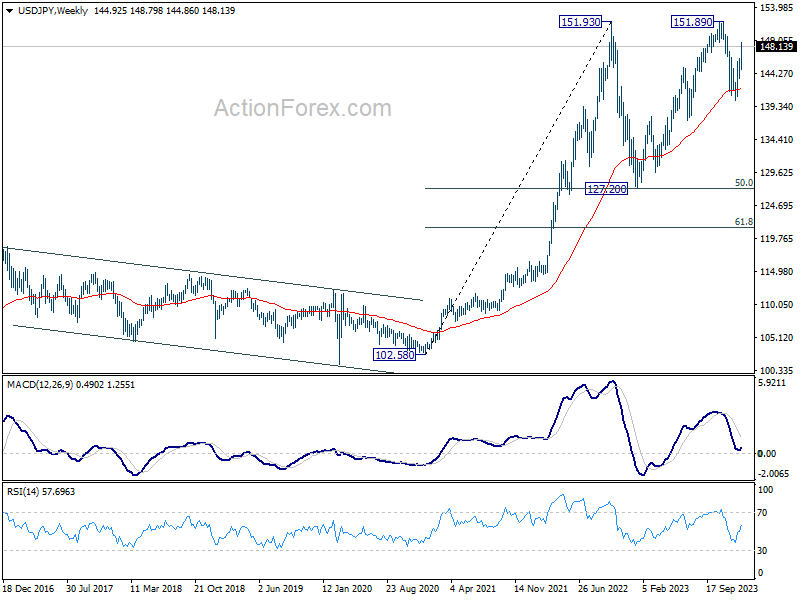
In the bigger picture, stronger than expected rebound from 140.25 dampened the original bearish review. Strong support from 55 W EMA (now at 141.89) is also a medium term bullish sign. Fall from 151.89 could be a correction to rise from 127.20 only. Decisive break of 151.89/93 will confirm resumption of long term up trend. This will now be the favored case as long as 140.25 support holds.
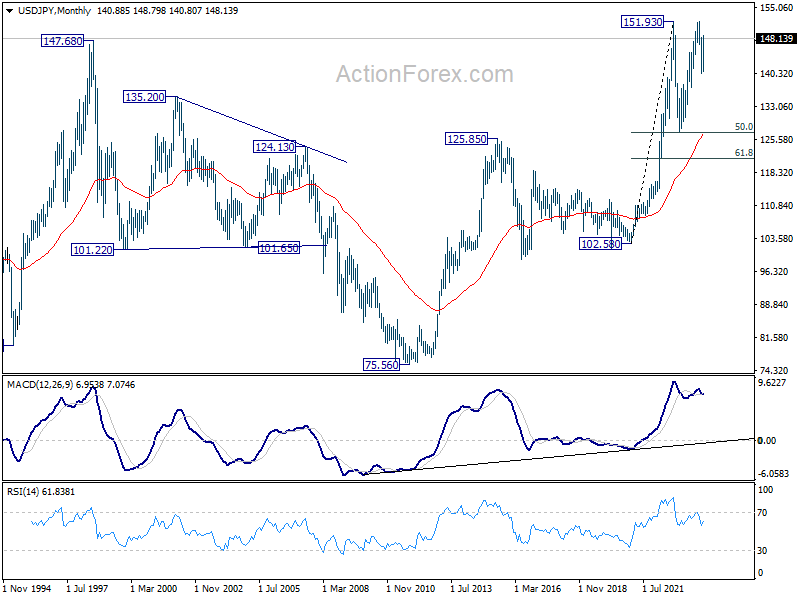
In the long term picture, as long as 125.85 resistance turned support holds (2015 high), up trend from 75.56 (2011 low) is still in favor to continue through 151.93 (2022 high) at a later stage.
EUR/USD Weekly Outlook
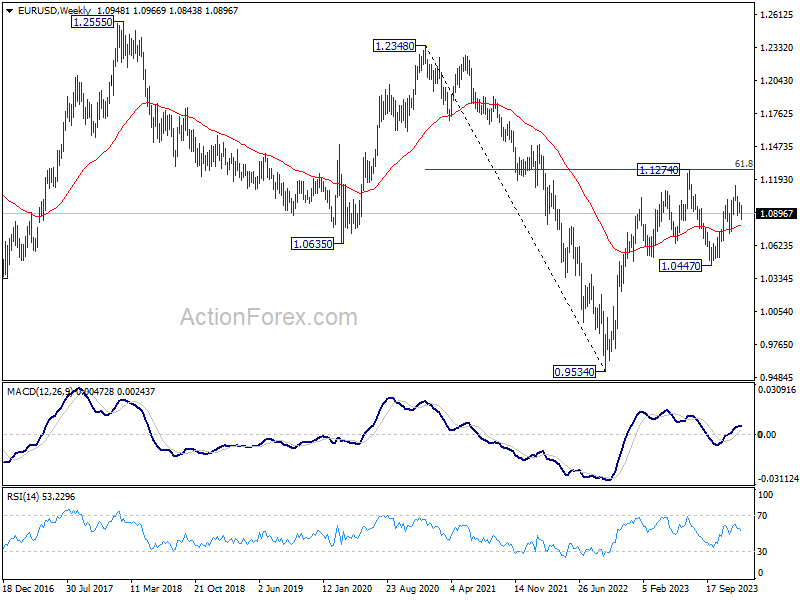
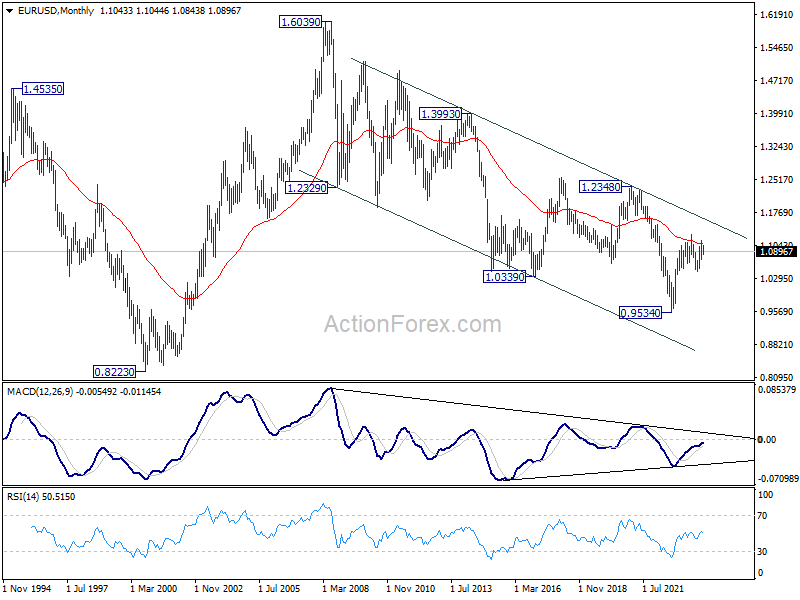
EUR/USD's fall from 1.1138 resumed to 1.0843 last week, then recovered. Initial bias stays neutral this week for some consolidations. But further decline is expected as long as 1.0995 resistance holds. Below 1.0843 will target 1.0722 support next. Decisive break there will argue that whole rise from 1.0447 has completed, and target this low.
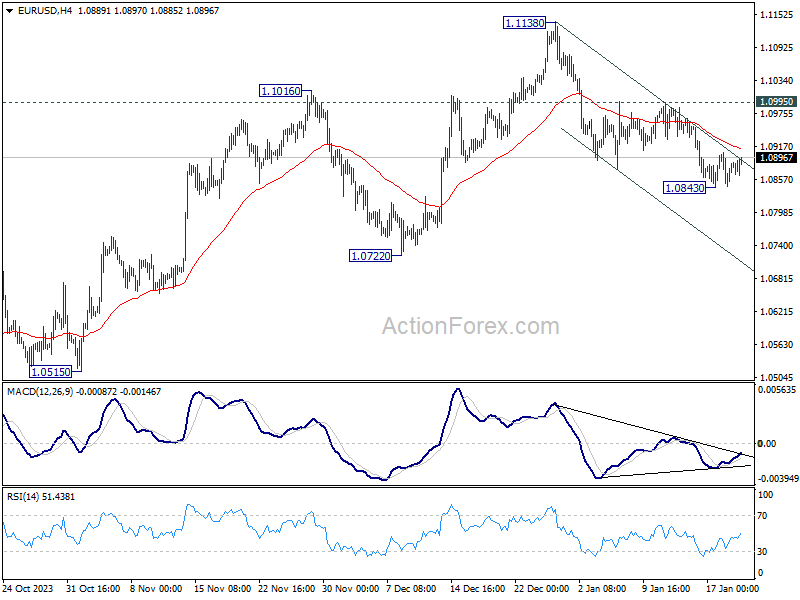
In the bigger picture, price actions from 1.1274 are viewed as a corrective pattern to rise from 0.9534 (2022 low). Rise from 1.0447 is seen as the second leg. While further rally could cannot be ruled out, upside should be limited by 1.1274 to bring the third leg of the pattern. Meanwhile, sustained break of 1.0722 support will argue that the third leg has already started for 1.0447 and below.
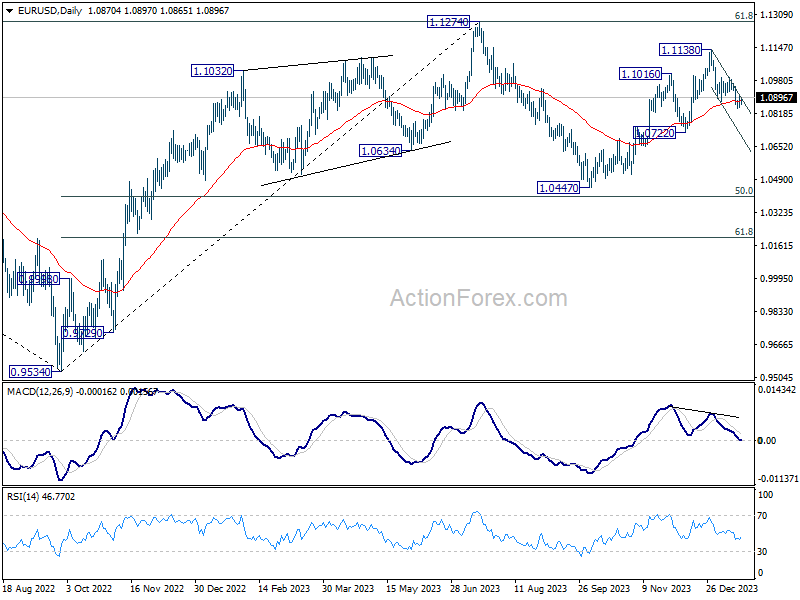
In the long term picture, a long term bottom is in place at 0.9534 on bullish convergence condition in M MACD. It's still early to call for bullish trend reversal with the pair staying inside falling channel in the monthly chart. Nevertheless, sustained trading above 55 M EMA (now at 1.1078) and break of 1.1274 resistance will raise the chance of reversal and target 1.2348 resistance for confirmation.
USD/JPY Weekly Outlook
USD/JPY's rise from 140.25 extended to as high as 148.79 last week, then retreated mildly. Initial bias remains neutral this week for some consolidations first. Current development argues that whole pull back from 151.89 has already completed. Further rise is in favor as long as 145.97 resistance turned support holds. Above 148.79 will target 151.89/93 key resistance zone.
In the bigger picture, stronger than expected rebound from 140.25 dampened the original bearish review. Strong support from 55 W EMA (now at 141.89) is also a medium term bullish sign. Fall from 151.89 could be a correction to rise from 127.20 only. Decisive break of 151.89/93 will confirm resumption of long term up trend. This will now be the favored case as long as 140.25 support holds.
In the long term picture, as long as 125.85 resistance turned support holds (2015 high), up trend from 75.56 (2011 low) is still in favor to continue through 151.93 (2022 high) at a later stage.
GBP/USD Weekly Outlook
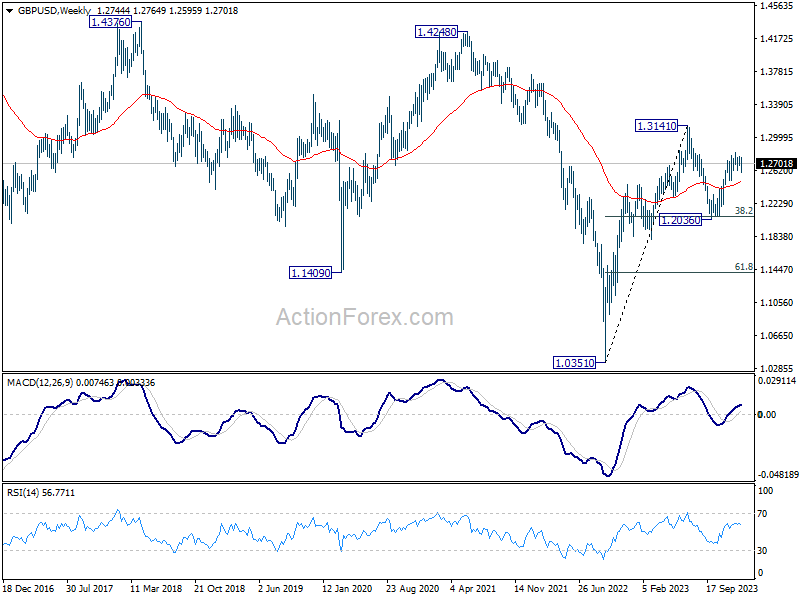
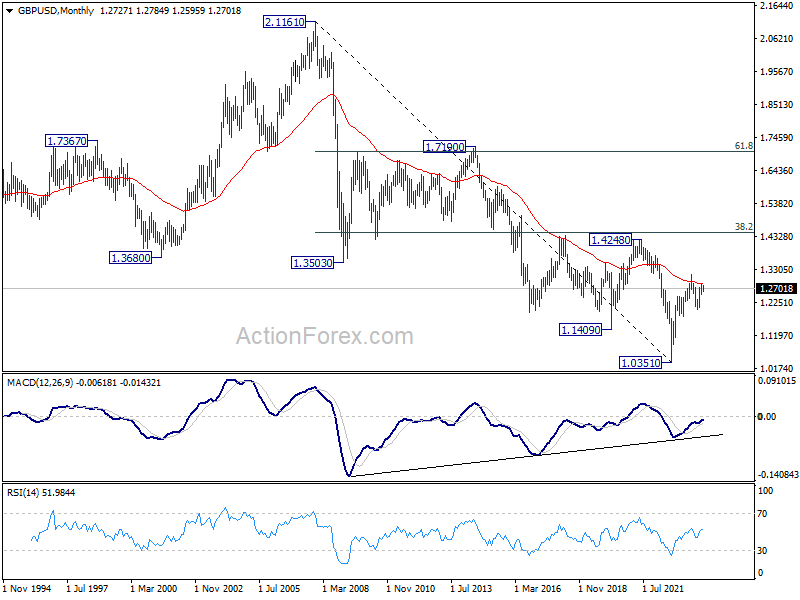
GBP/USD's corrective pattern from 1.2826 continued last week. Initial bias stays neutral this week first. Deeper pull back could be seen, and break of 1.2595 will target 1.2499 support. On the upside, however, firm break of 1.2826 will resume larger rise from 1.2036 towards 1.3141 high.
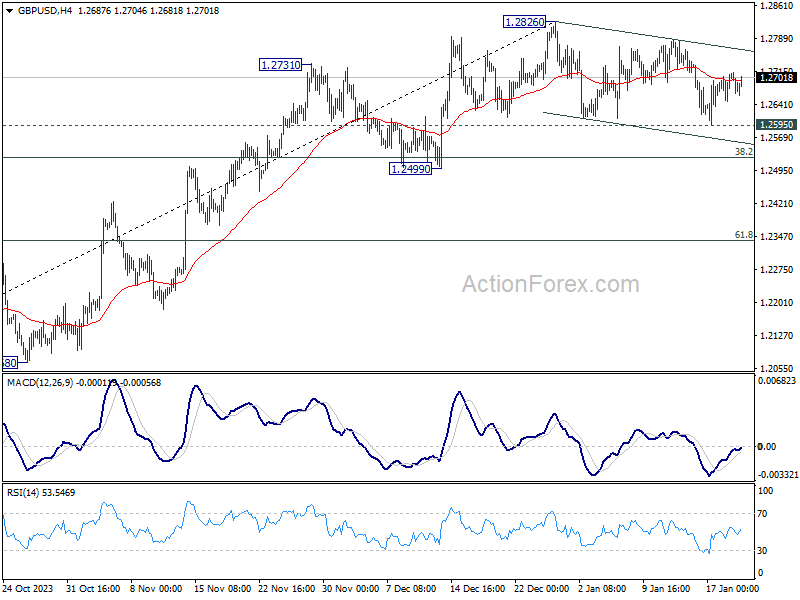
In the bigger picture, price actions from 1.3141 medium term top are seen as a corrective pattern to up trend from 1.0351 (2022 low). Rise from 1.2036 is seen as the second leg that's in progress. Upside should be limited by 1.3141 to bring the third leg of the pattern. Meanwhile, break of 1.2499 support will argue that the third leg has already started for 38.2% retracement of 1.0351 (2022 low) to 1.3141 at 1.2075 again.
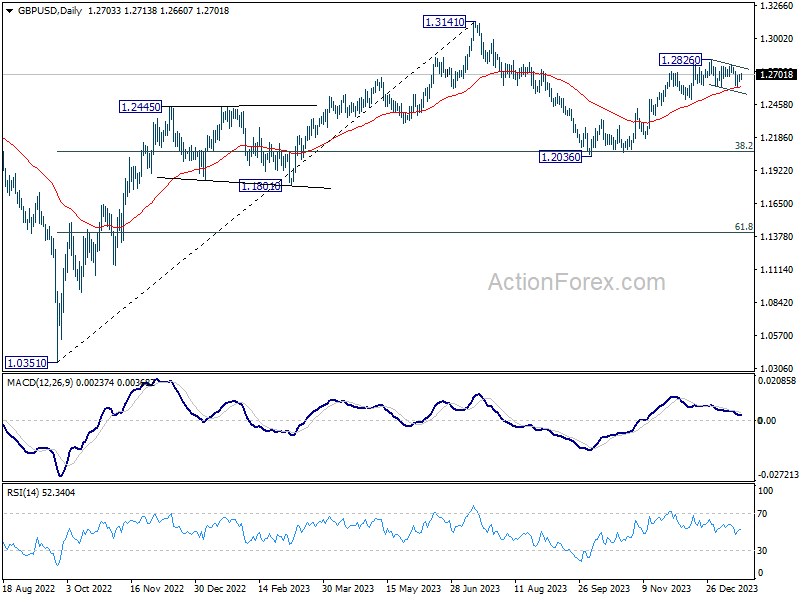
In the long term picture, a long term bottom should be in place at 1.0351 on bullish convergence condition in M MACD. But momentum of the rebound from 1.3051 argues GBP/USD is merely in consolidation, rather than trend reversal. Range trading is likely between 1.0351/4248 for some more time.