

Sample Category Title
UK Inflation Unexpectedly Rebounds
Yesterday was just another day where another policymaker pushed back on the exaggerated rate cut expectations. Federal Reserve’s (Fed) Christopher Waller said that the Fed should go ‘methodically and carefully’ to hit the 2% inflation target, which according to him is ‘within striking distance’, but ‘with economic activity and labour markets in good shape’ he sees ‘no reason to move as quicky or cut as rapidly as in the past’, and as is suggested by the market pricing. So that was it. Another enlightening moment went down the market’s throat in the form of a selloff in both equities and bonds. The US 2-year yield – which captures the rate expectations rebounded 12bp, the 10-year yield jumped past the 4%, the US dollar index recovered to a month high and is testing the 200-DMA resistance to the upside this morning, while the S&P500 retreated 0.37%.
Waller spoke from the US yesterday, but many counterparts are wining, dining and speaking in the World Economic Forum in Davos this week, which doesn’t only offer snowy and a beautiful scenery this January, but it also serves as a platform to many policymakers to bring the market back to reason. Expect more comments of this hawkish kind during this week. It turns out that one of the most popular topics of this year’s WEF is rising inflationary risks due to the heating tensions in the Red Sea which disrupt the global trade roads and explode the shipping costs.
The EUR/USD slips into bearish consolidation zone
The European Central Bank (ECB) officials were the first ones to push back the rate cut expectations. They were the first ones to attract attention to the looming inflation risks and to the idea that the ECB doesn’t consider cutting the rates despite the slowing economic activity and looming recession that would – in theory – justify rate cuts in the euro area way more than rate cuts in the States, where growth and jobs numbers remain surprisingly and non-alarmingly resilient.
So many ask why the EURUSD doesn’t benefit from that hawkishness. Well, it did to some extent. The pair advanced past the 1.10 level at the end of last year. Yet, the reality is, even though the ECB starts cutting the rates after the Fed and cuts less than the Fed, the deterioration in the Eurozone’s economic fundamentals had already started counterweighing the hawkish ECB views. And now that the Fed members have started giving out a more hawkish voice to balance out the overly stretched Fed cut expectations, the downside correction in the EURUSD is all but surprising. From a technical perspective, there is an important development in the EURUSD. The pair slipped below 1.0875, the major 38.2% Fibonacci retracement on the October to now rebound and is now in the medium-term bearish consolidation zone. There is potential for a deeper fall. The next natural targets for the bears are the 200-DMA, near 1.0845, and the 50% retracement, near 1.0793.
Unexpected rise in UK inflation
Cable rebounded following an unexpected rebound in British inflation numbers this morning. Headline inflation unexpectedly rebounded to 4%, while core inflation remained steady at 5.1% versus the expectation of a decline below the 5% mark.
This morning’s inflation disappointment lead sterling bears to trim bets below the 1.26 mark.
To give Rishi Sunak his due, inflation in Britain more than halved last year and is expected to return to the Bank of England’s (BoE) 2% target by spring, but the possibility of a U-turn in the inflation trend due to the geopolitical developments is a mounting risk and call for a balanced approach from the BoE. But regardless of a hawkish position, UK’s anemic growth should limit any positive move in sterling against the US dollar.
EUR/USD Daily Outlook
Daily Pivots: (S1) 1.0841; (P) 1.0897; (R1) 1.0933; More...
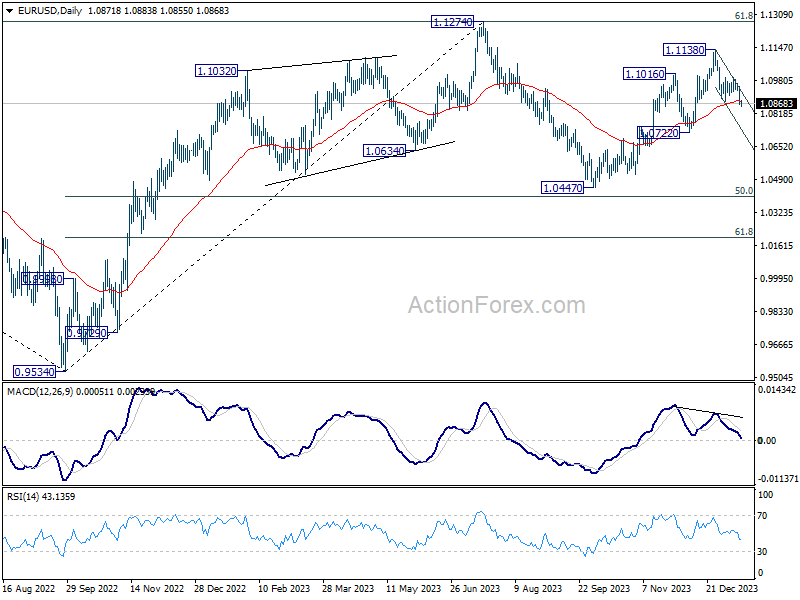
Intraday bias in EUR/USD remains on the downside. Fall from 1.1138 is in progress for 1.0722 support. Sustained break there will argue that whole rise from 1.0447 has completed, and target this low. For now, risk will stay on the downside as long as 1.0995 resistance holds, in case of recovery.
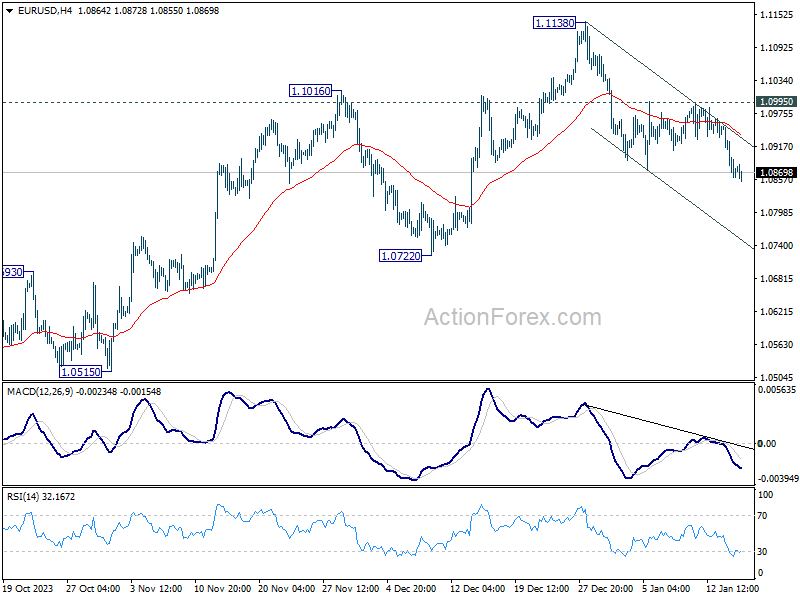
In the bigger picture, price actions from 1.1274 are viewed as a corrective pattern to rise from 0.9534 (2022 low). Rise from 1.0447 is seen as the second leg. While further rally could cannot be ruled out, upside should be limited by 1.1274 to bring the third leg of the pattern. Meanwhile, sustained break of 1.0722 support will argue that the third leg has already started for 1.0447 and below.
GBP/USD Daily Outlook
Daily Pivots: (S1) 1.2592; (P) 1.2664; (R1) 1.2709; More...
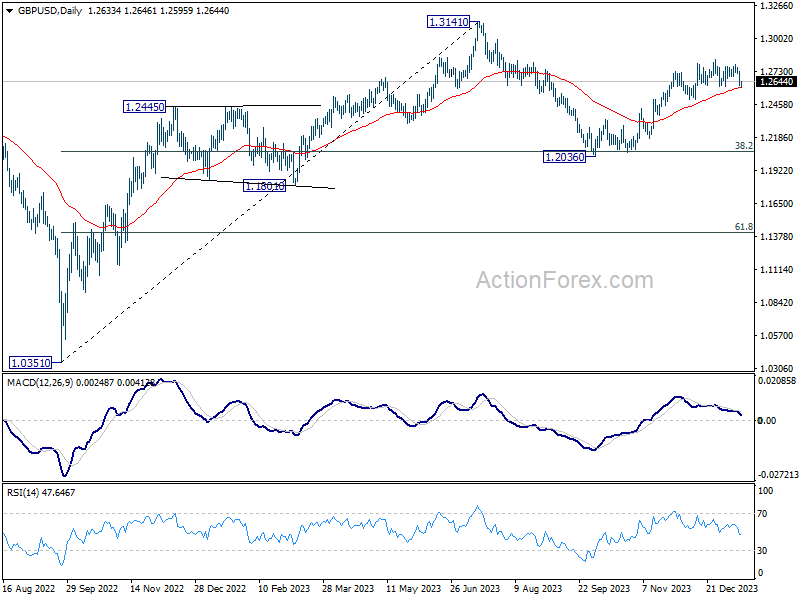
GBP/USD recovered quickly after brief breach of 1.2611 support and intraday bias remains neutral. On the downside, firm break of 1.2611 will resume the decline from 1.2826 to 1.2499 support. Nevertheless, strong rebound from current level will retain near term bullishness. Decisive break of 1.2826 will resume whole rally from 1.2036.
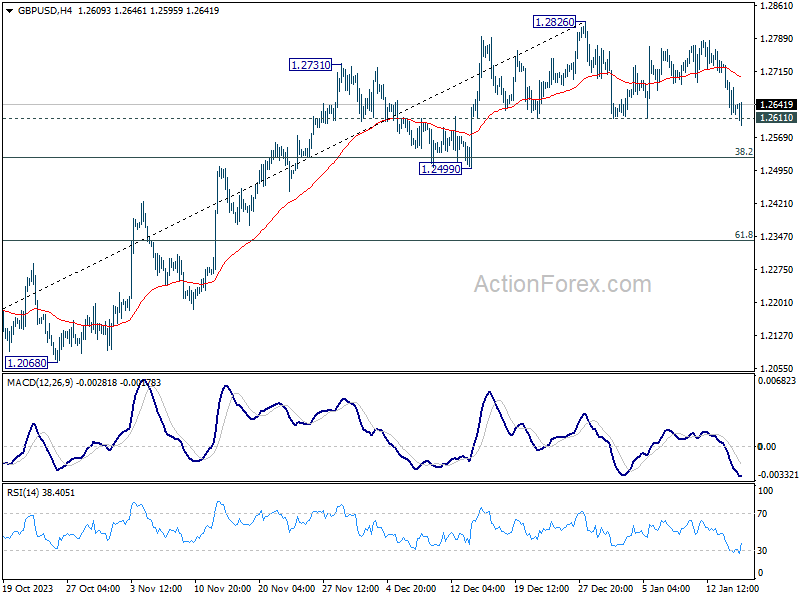
In the bigger picture, price actions from 1.3141 medium term top are seen as a corrective pattern to up trend from 1.0351 (2022 low). Rise from 1.2036 is seen as the second leg that's in progress. Upside should be limited by 1.3141 to bring the third leg of the pattern. Meanwhile, break of 1.2499 support will argue that the third leg has already started for 38.2% retracement of 1.0351 (2022 low) to 1.3141 at 1.2075 again.
USD/CHF Daily Outlook
Daily Pivots: (S1) 0.8574; (P) 0.8597; (R1) 0.8639; More....
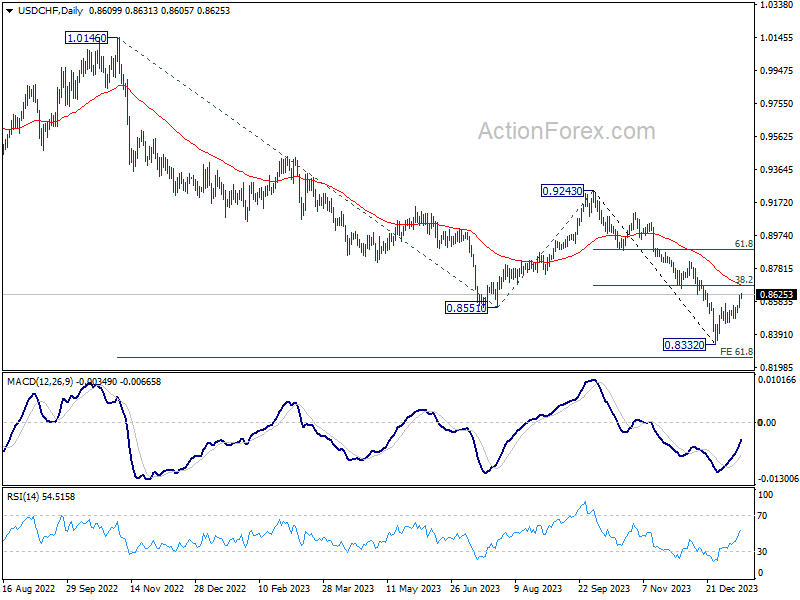
With 0.8665 support turned resistance intact, rebound from 0.8332 is seen as a corrective move only. Break of 0.8487 will indicate that the rebound has completed, and bring retest of 0.8332 low. However, decisive break of 0.8665 will rise the change of larger trend reversal and target 0.8819 resistance next.
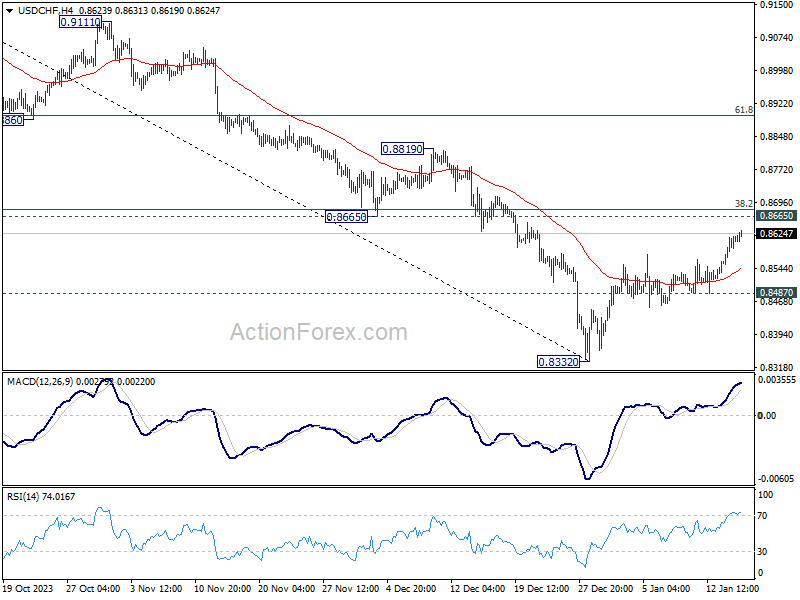
In the bigger picture, outlook in USD/CHF will stay bearish as long as 0.9243 resistance holds. Larger down trend from 1.0146 (2022 high) should extend further to 61.8% retracement of 1.0146 to 0.8551 from 0.9243 at 0.8257.
USD/JPY Daily Outlook
Daily Pivots: (S1) 146.08; (P) 146.70; (R1) 147.80; More...
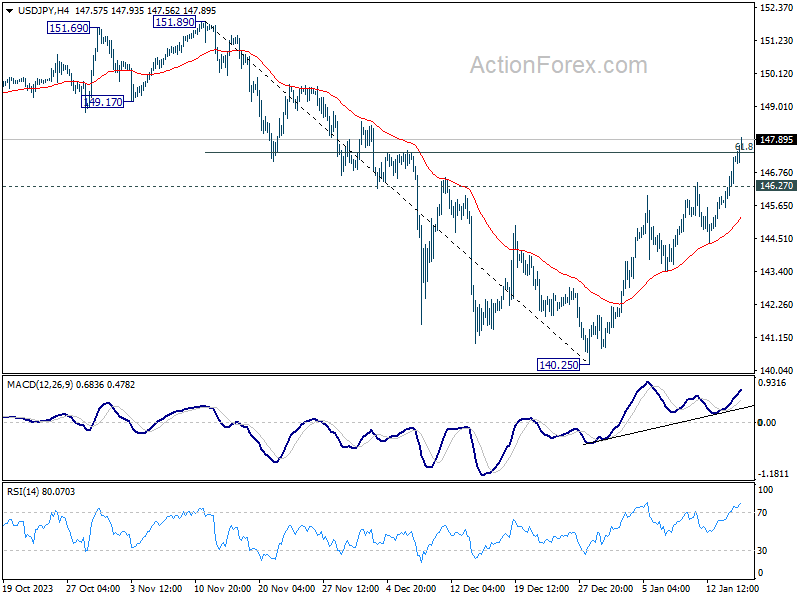
USD/JPY's rally from 140.25 continues today, and breaks through 61.8% retracement of 151.89 to 140.25 at 147.4. There is no sign of topping yet and intraday bias stays on the upside. Next target is 151.89/93 key resistance zone. On the downside, below 146.27 minor support will turn intraday bias neutral first. But further rally will remain in favor as long as 55 D EMA (now at 145.67) holds.
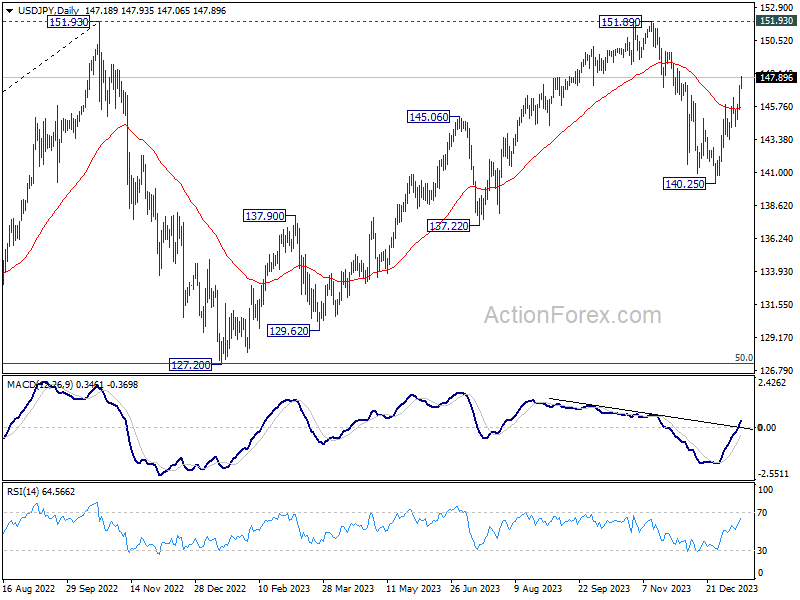
In the bigger picture, stronger than expected rebound from 140.25 dampened the original bearish review. Strong support from 55 W EMA (now at 141.89) is also a medium term bullish sign. Fall from 151.89 could be a correction to rise from 127.20 only. Decisive break of 151.89/93 will confirm resumption of long term up trend. This will now be the favored case as long as 140.25 support holds.
USD/CAD Daily Outlook
Daily Pivots: (S1) 1.3445; (P) 1.3474; (R1) 1.3523; More...
Intraday bias in USD/CAD remains on the upside at this point. Rise from 1.3176 is in progress for 1.3617 cluster resistance (61.8% retracement of 1.3897 to 1.3176 at 1.3622). Decisive break there will pave the way to 1.3897/3976 key resistance zone. On the downside, below 1.3422 minor support will turn intraday bias neutral first.
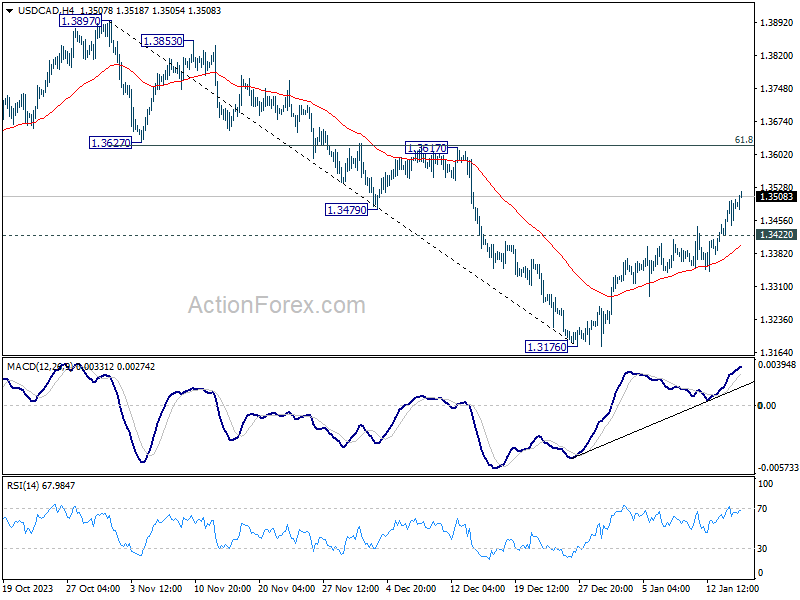
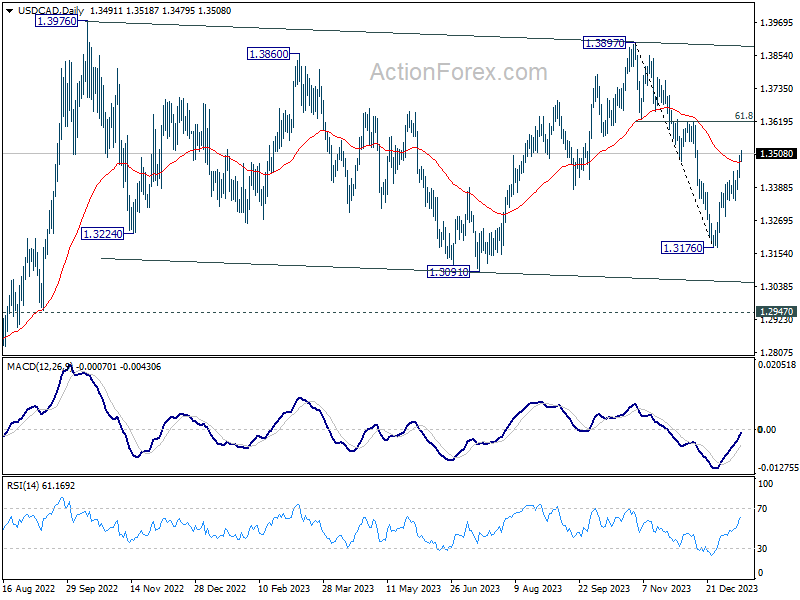
In the bigger picture, price actions from 1.3976 (2022 high) are viewed as a corrective pattern only. In case of another fall, strong support should emerge above 1.2947 resistance turned support to bring rebound. Overall, larger up trend from 1.2005 (2021 low) is still expected to resume through 1.3976 at a later stage.
China Beats its 2023 Growth Target
In focus today
This morning at 8:00 CET we get inflation data for December from the UK, where consensus expects both headline and core inflation to ease further on a yearly basis. Key will be how service inflation develops as this remains an important input for the Bank of England to determine underlying inflation pressures.
We will also look out for the final euro area inflation figures for December. The final HICP figures includes details on inflation components that will provide important information about the underlying inflationary pressure.
In the US we get retail sales data for December this afternoon. Consensus expects 0.4% m/m compared to 0.3% m/m in November.
In Sweden at 09:10 CET, The Riksbank's first deputy governor Anna Breman gives her view on the economic situation and current monetary policy at a conference on the Swedish housing market.
There are several speeches on the schedule for today with Fed's Bowman and Barr and ECB President Lagarde all speaking in the afternoon and Fed's Williams speaking tonight.
Economic and market news
What happened overnight
Chinese data out this morning disappointed badly. The GDP data looked okay with a 1.0% q/q increase (consensus of 1.1%). This compares with a growth rate of 1.5% q/q for Q3 (revised up from 1.3% q/q). With the Q4 release, Chinese GDP growth for the year 2023 stood at 5.2%, thus beating the government's 5% growth target and in line with consensus. However, data for consumption and housing was weak. Chinese retail sales for December stood at 7.4% y/y missing expectations of 8% y/y, and down from 10.1% y/y in November. Home sales dropped to a new low in December 50% below the pre-pandemic level (link to chart), and house prices fell 0.5% m/m marking the biggest drop since 2015. The numbers raise warnings that the housing crisis continues to deepen, and that the consumer engine is slowing down. The data highlights the need for further stimulus. Chinese population fell for the second year in a row, shrinking by 2m in 2023. Chinese offshore stocks have taken a new hit after the data and is down 3% overnight to the lowest level since November 2022.
What happened yesterday
In Norway, mainland GDP figures for November stood at -0.2% m/m in line with expectations and marginally stronger than what Norges Bank expected (-0.3% m/m) in its December Monetary Policy Report. The slight contraction in November after the 0.4% m/m growth in October is in line with the sideways trend seen in mainland GDP figures since March 2023.
In the UK, the labour market report for November/December was fairly in line with expectations. The 3m/3m annualised wage growth for the private sector stood at 2.6% down from 3.8%, which is sustainable with a 2% inflation target (assuming 1% productivity growth).
In China, Bloomberg reported that Chinese leadership were considering issuing CNY1tn (USD139bn) of bonds in a 'special sovereign bond plan', corresponding to around 0.8% of Chinese GDP. The funds raised would be used to finance projects related to food, energy, supply chains and urbanization. At the end of 2023 China also lifted the budget deficit for the year, providing support to growth in H1 this year. The potential new stimulus would likely add support to growth in H2.
In the ECB, moderate Governing Council member Villeroy commented the next move from the ECB should be a rate cut this year, but he would not comment on any specific time this may happen. This is in contrast to the recent comments from other GC members (Nagel, Holzmann, Lane, etc.) that in the past days have generally pushed back on market expectations of a rate cut this spring and guided for summer at the earliest. The ECB survey for November on consumer expectations for eurozone inflation showed expectations for inflation three years ahead had dropped to 2.2% y/y from 2.5% y/y.
In Germany, ZEW economic sentiment for January rose to 15.2 from 12.8 marking the sixth consecutive monthly rise. The current conditions index is however still weak and has been only slightly improving over the last couple of months, as also reflected in the more comprehensive Ifo survey.
In the Red Sea, another dry bulk carrier ship was hit by a missile. The ship, a Greek-owned vessel sailing under Maltese flag, is the second commercial vessel hit by a missile off the coast of Yemen in two days. Energy company Shell and Japanese shipping operator NYK Line were the latest major companies to halt transport through the Red Sea. US military carried out another strike against Houthi missile capabilities.
Equities: Global equities were lower yesterday after weak macro data and yields ticking higher. Just like Monday, this was not a full-blown risk-off session with strong defensive rotation, but rather a profit-taking session after the strong year-end rally. That being said, one could easily have feared a much more negative reaction to the macro data but weak manufacturing data was more or less ignored since the service-driven economic pick-up post Covid. In US yesterday, Dow -0.6%, S&P 500 -0.4%, Nasdaq -0.2% and Russell 2000 -1.2%. Asian markets are lower this morning led by China after a broad set of weak data was released. Especially the housing market continues to struggle and calling for more public support. European and US futures all lower this morning as well.
FI: US bond yields rose significantly on the back of hawkish comments from Fed Governor Waller regarding the timing of the rate cut from the Federal Reserve as well as the number of rate cuts in 2024. Hence, 10Y US Treasury yields rose some 11bp yesterday and are back above 4%.
FX: EUR/USD declined below 1.09 due to rising yields and poor risk appetite. The increasing yields propelled USD/JPY above 147. Meanwhile, EUR/GBP initially jumped higher on the release of the November/December UK Job report but reversed the move during the afternoon, settling around the 0.86 mark. The Scandies remain weak this week, with both EUR/NOK and EUR/SEK consolidating above 11.30.
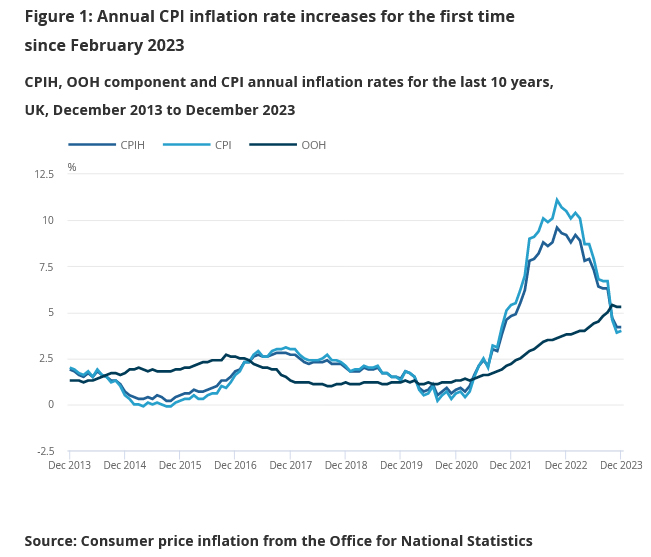
UK CPI rises to 4.0% yoy in Dec, core unchanged at 5.1% yoy
UK CPI rose 0.4% mom in December, well above expectation of 0.2% mom. For the 12- month period, CPI accelerated from 3.9% yoy to 4.0% yoy, above expectation of 3.8% yoy. That's the first time the rate has increased since February 2023.
CPI core (excluding energy, food, alcohol and tobacco) was unchanged at 5.1% yoy, above expectation of 4.9% yoy. CPI goods slowed from 2.0% yoy to 1.9% yoy. CPI services rose from 6.3% yoy to 6.4% yoy.
EUR/AUD Technical: AUD’s Underperformance Remains Sticky
- Current bout of risk-off behaviour has triggered an underperformance of higher beta risk-sensitive currencies such as the AUD.
- China Premier Li Qiang’s speech in Davos has signalled “a lesser need” for China to enact massive stimulus measures which in turn may see lesser industrial commodities exports from Australia in the near term.
- AUD’s weakness has led to a short-term uptrend unfolding in the EUR/AUD cross pair.
The risk-off behaviour has continued to spill over to today’s 17 January Asian session where the US dollar has continued to strengthen after it hit a 1-month high and benchmark Asian stock indices have recorded intraday losses across the board led by the underperformers (China & Hong Kong); CSI 300 (-0.84%), Hang Seng Index (-3%), Hang Seng TECH Index (-4.10%), and Hang Seng China Enterprise Index (-3.14%). Even the recent outperformer, Japan’s Nikkei 225 is not spared from today’s bearish onslaught with an intraday loss of -0.40%.
The current bout of risk-off negative feedback loop has been triggered by a rising geopolitical risk premium arising from the hostilities in the Middle East region and the Red Sea shipping route.
In addition, Fed Speak from Federal Reserve Governor Christopher Waller (voting FOMC member) poured cold water on the expected Fed’s dovish pivot narrative by stating that the Fed may not need to cut as quickly as in the past which suggests potential guidance that tries to push back the current dovish expectations of six cuts in 2024 on the Fed funds rate as priced by in the interest rates futures market.
AUD & NZD worst performers
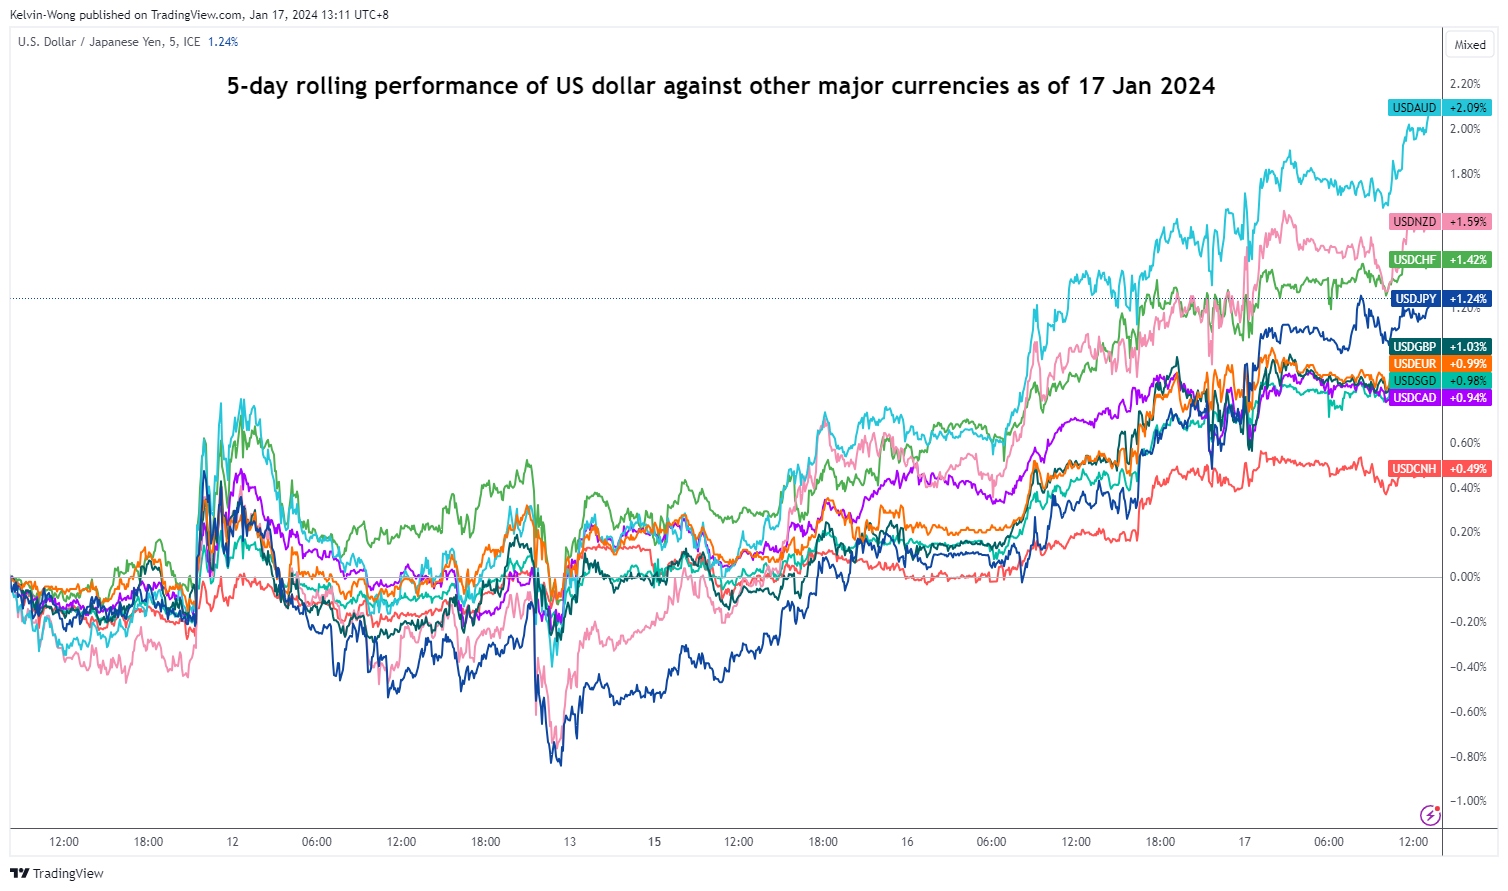
Fig 1: 5-day rolling performances of US dollar against other currencies as of 17 Jan 2024 (Source: TradingView, click to enlarge chart)
The net effect so far in the foreign exchange market is the significant underperformance of the higher beta risk-sensitive currencies; AUD and NZD where it shed -2.10% and -1.60% respectively against the US dollar based on a 5-day rolling basis at this time of the writing.
The AUD also took a double whammy from a China-related news flow via a commodities export perspective. China’s Premier Li Qiang said in Davos, during one of the sessions of the ongoing World Economic Forum that China has managed to achieve an annualized GDP growth of 5.2% in 2023 without resorting to massive stimulus measures.
This remark has implied that China’s top policymakers are comfortable with the current pace of growth trajectory in China which in turn has dampened hopes of more forceful fiscal and monetary stimulus measures in 2024. Hence, China may not need to import massive amounts of industrial commodities such as copper which Australia is a major exporter to China.
EUR/AUD short-term bullish trend is taking shape
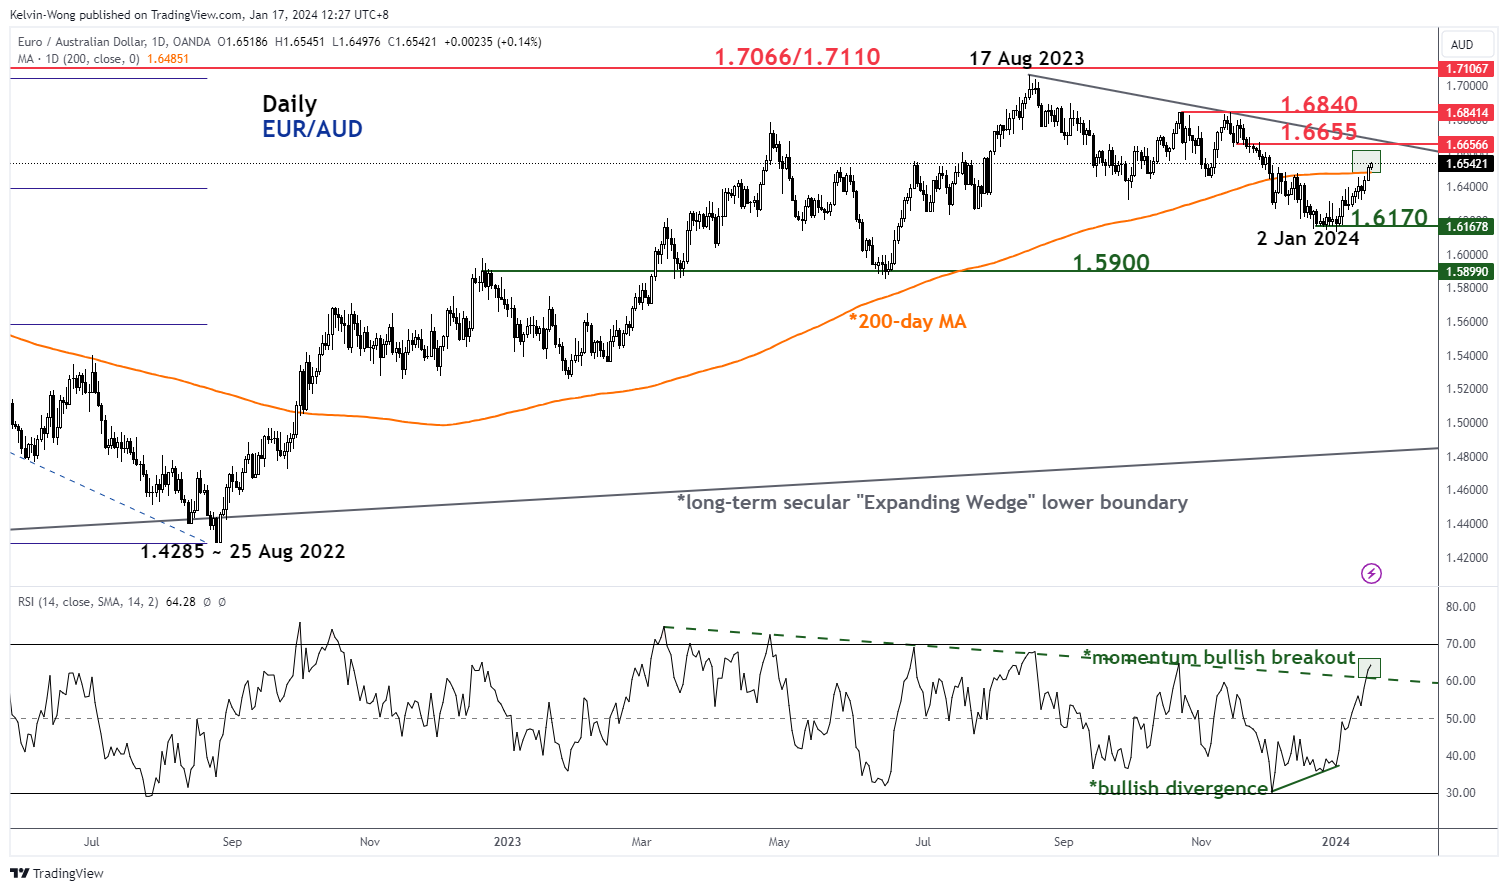
Fig 2: EUR/AUD medium-term trend as of 17 Jan 2024 (Source: TradingView, click to enlarge chart)
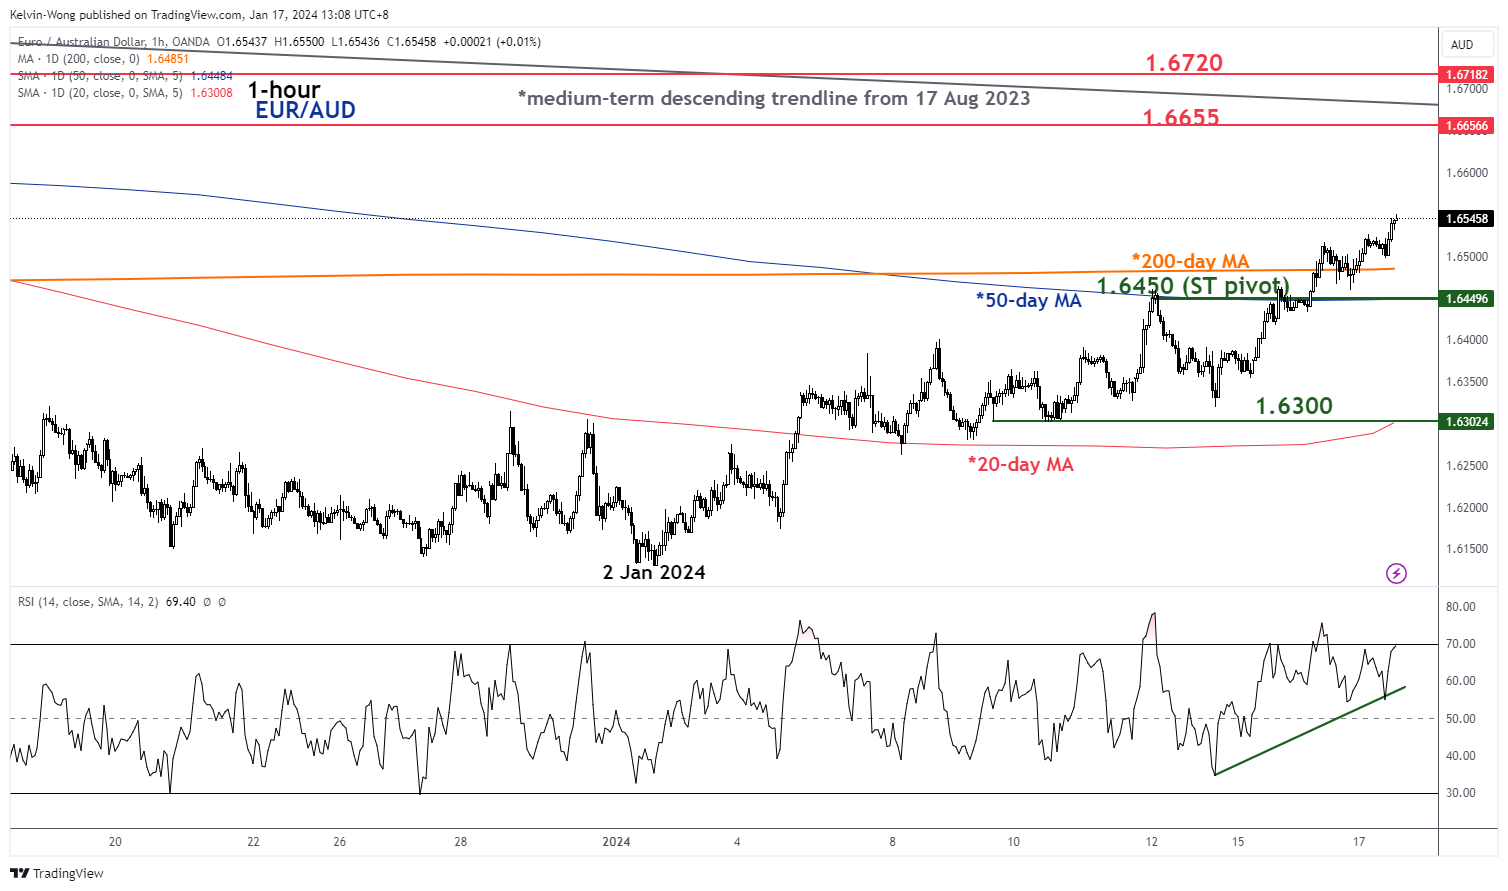
Fig 3: EUR/AUD minor short-term trend as of 17 Jan 2024 (Source: TradingView, click to enlarge chart)
The EUR’s intraday weakness seen in the past two days is not as pronounced as the AUD which in turn gives an opportunity for the EUR/AUD cross pair to evolve into a short-term bullish trend in place since the start of this year; it has rallied by +440 pips/+2.7% from its 2 January low of 1.6129 to current intraday high of 1.6570 at this time of the writing.
Medium and short-term momentum readings as indicated by the daily and hourly RSI are still showing bullish momentum conditions which may support a further potential upmove in price actions that have also just surpassed the 200-day moving average.
Watch the 1.6450 short-term pivotal support (also the 50-day moving average) with the next intermediate resistances coming in at 1.6655 and 1.6720.
On the other hand, failure to hold at 1.6450 negates the bullish tone to expose the next intermediate support at 1.6300 (also the 20-day moving average & 61.8% Fibonacci retracement of the ongoing minor rally from the 2 January 2023 low to today’s current intraday high).
EURUSD Short Term Looking for Further Downside
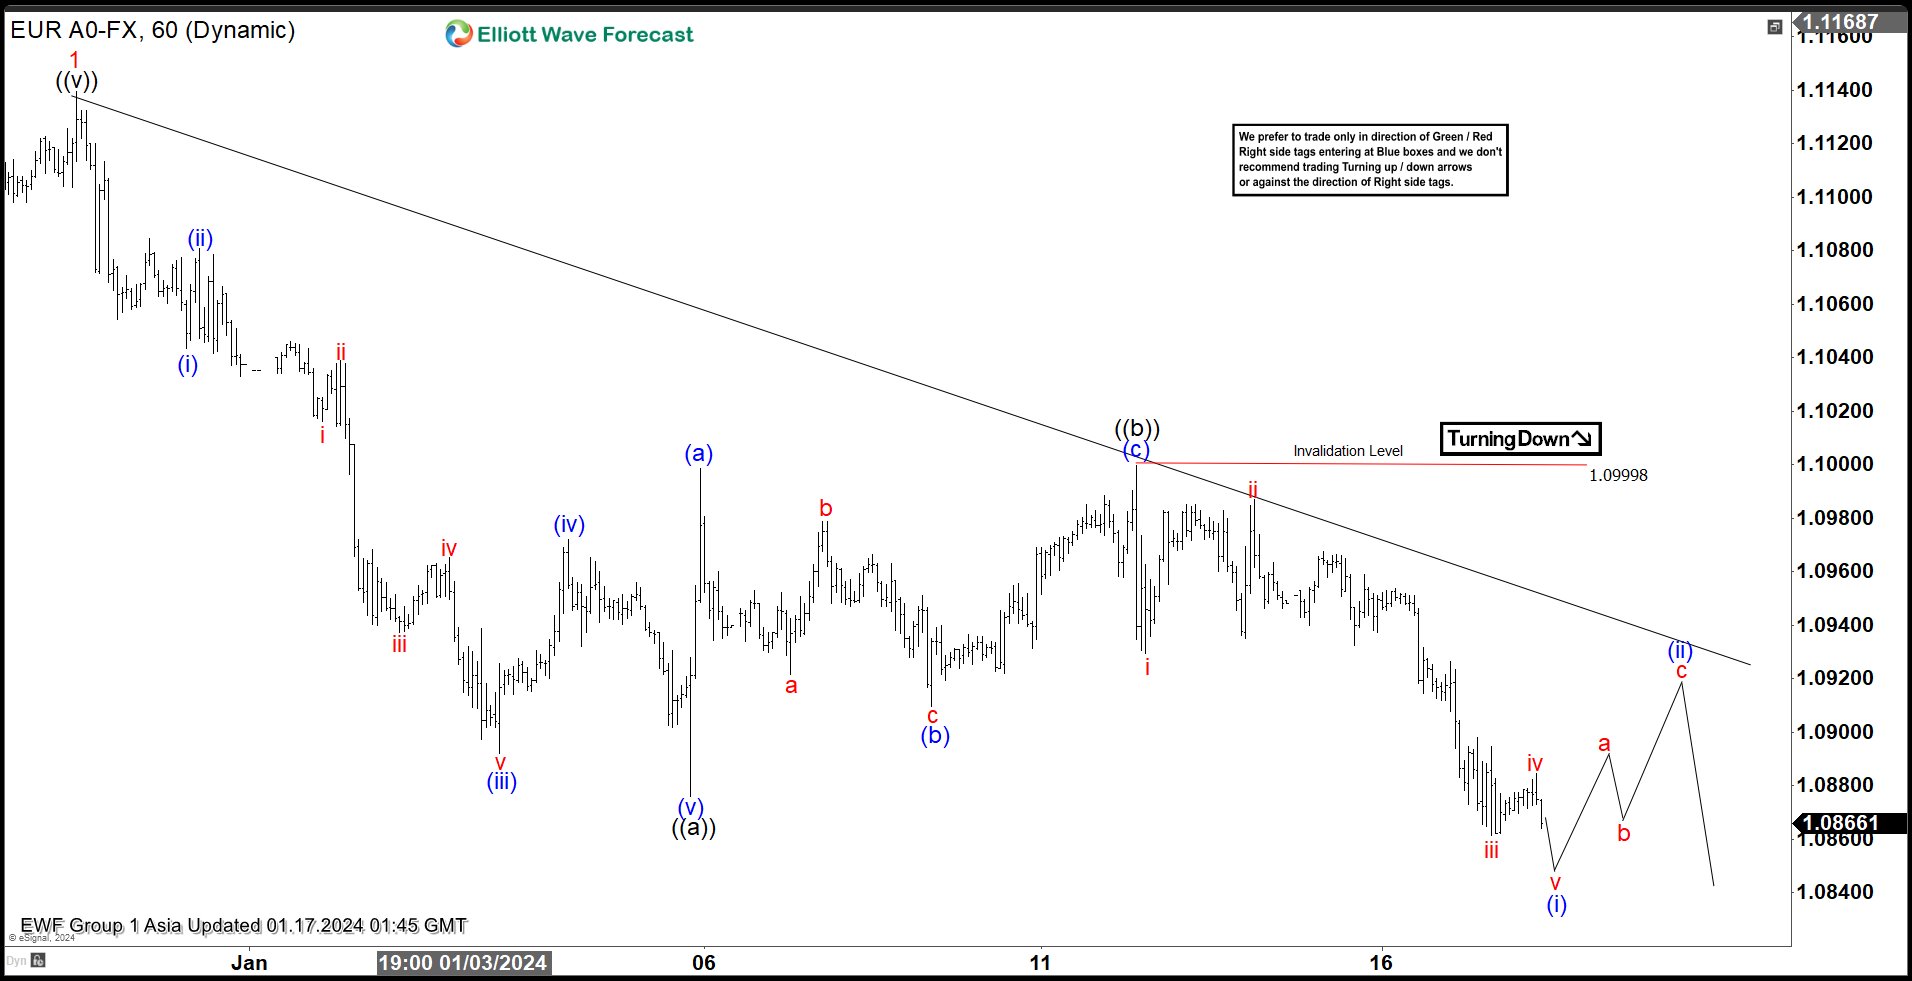
Short term Elliott Wave View suggests $EURUSD ended wave 1 rally at 1.11395. Pair is now doing wave 2 pullback to correct cycle from 10.03.2023 low. Wave 2 subdivides into a zigzag Elliott Wave structure. Zigzag is a 5-3-5 structure with ABC as the label. Wave A and C in zigzag subdivide into 5 waves as the chart of EURUSD shows. Down from wave 1, wave (i) ended at 1.10434 and rally in wave (ii) ended at 1.10808. Pair then resumes lower in wave (iii) towards 1.0892 and wave (iv) rally ended at 1.0972. Final leg down wave (v) ended at 1.0876 which completed the first leg of the zigzag wave ((a)).
Wave ((b)) rally ended at 1.1 with internal subdivision as a zigzag in lesser degree. Up from wave ((a)), wave (a) ended at 1.0999, wave (b) ended at 1.0909, and wave (c) higher ended at 1.099. This completed wave ((b)) in higher degree. Pair has resumed lower in wave ((c)). Down from wave ((b)), wave i ended at 1.0929 and wave ii ended at 1.0987. Wave iii lower ended at 1.08729 and wave iv ended at 1.0898. Expect wave v lower to end soon which should complete wave (i). Pair should then rally in wave (ii) to correct cycle from 1.11.2024 high in 3, 7, or 11 swing before pair resumes lower. Near term, as far as pivot at 1.099 high stays intact, expect rally to fail in 3, 7, 11 swing for further downside.
EURUSD 60 Minutes Elliott Wave Chart
EURUSD Elliott Wave Video
https://www.youtube.com/watch?v=-oVUVewktls