

Sample Category Title
EUR/CHF Mid-Day Outlook
Daily Pivots: (S1) 0.9351; (P) 0.9370; (R1) 0.9389; More...
EUR/CHF's break of 0.9402 support turned resistance suggests that down trend from 1.0095 has completed at 0.9252 already. Rebound from there is tentatively seen as a corrective move first. Intraday bias is now on the upside for 55 D EMA (now at 0.9451). Sustained break there will target 38.2% retracement of 1.0095 to 0.9252 at 0.9574. On the downside, though, break of 0.9349 minor support will turn bias back to the downside for retesting 0.9252 low instead.
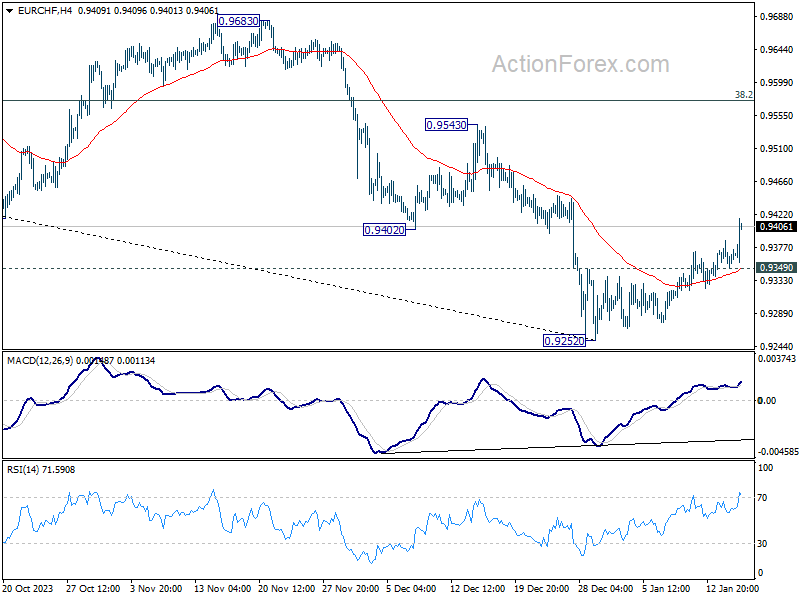
In the bigger picture, medium term outlook remains bearish as long as 0.9683 resistance holds. Current fall from 1.2004 (2018 high) is part of the multi-decade down trend. Another decline is in favor after rebound from 0.9252 completes.
Unexpected UK CPI Boosts Sterling, Risk Aversion Continues
Sterling emerged as the star performer in today's market, largely driven by surprising inflation data from the UK. CPI inflation in December showed an unexpected acceleration, with core CPI remaining at elevated level. This development led to a swift change in the market's perspective concerning BoE's policy, reducing the anticipated number rate cuts this year from around six to four. Moreover, the probability of the first rate cut in May has drastically reduced from over 80% to approximately 50%.
Meanwhile, Dollar is the second strongest currency, benefitting from prevailing risk-averse sentiment that led to decline in global equities. This cautious market mood has been partly influenced by central bankers who have pushed back against aggressive speculations regarding rate cuts. Euro, reacting to comments from ECB officials at the World Economic Forum in Davos, ranked as the third strongest currency.
On the other end of the spectrum, Swiss Franc found itself as the day's weakest performer, mainly due to from sell-off against Euro and Sterling. Australian Dollar also lingered at the lower end of the performance scale, facing additional pressure due to concerns over China's economic outlook. Japanese Yen trailed not far behind in weakness.
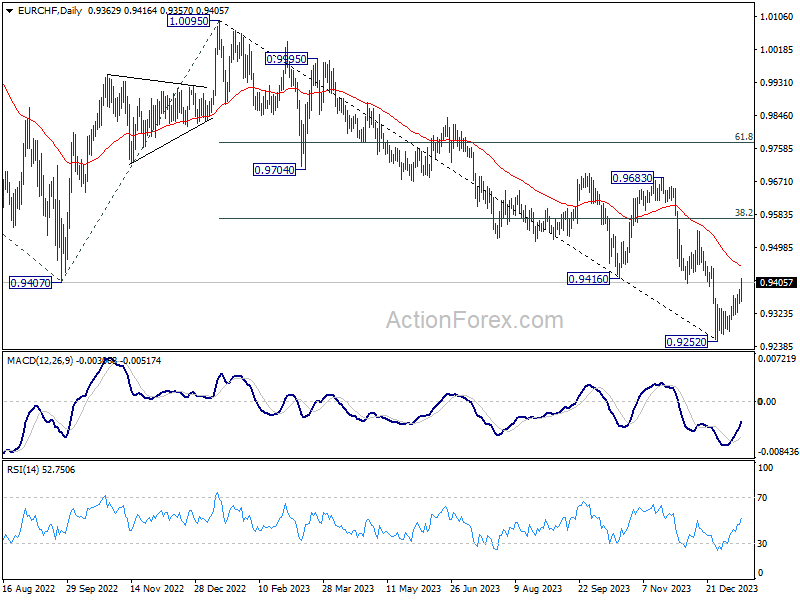
Technically, GBP/AUD's break of 1.9263 resistance should confirm that correction from 1.9967 has completed with three waves down to 1.8685. Outlook will now stay cautiously bullish as long as 55 D EMA (now at 1.9018) holds. Up trend from 1.5925 (2022 low) should be ready to resume through 1.9967 to 61.8% projection of 1.7218 to 1.9967 from 1.8584 at 2.0283.
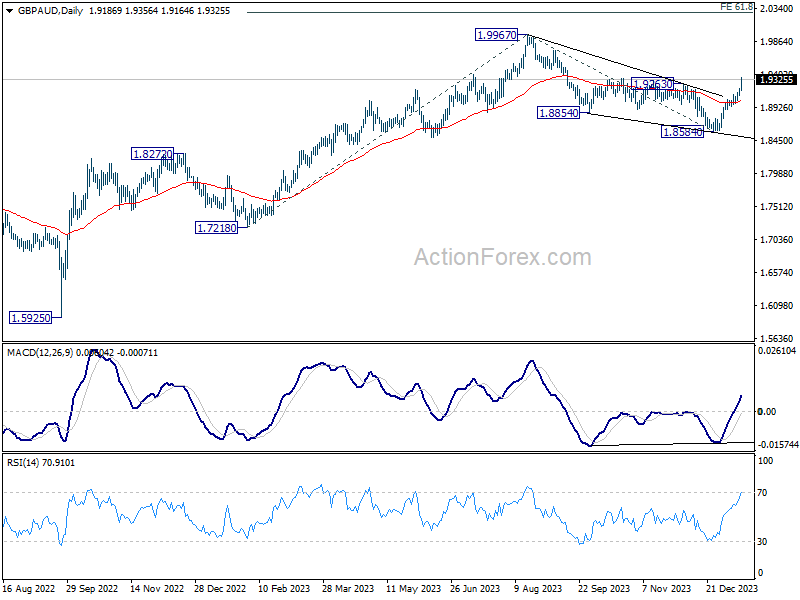
In Europe, at the time of writing, FTSE is down -1.76%. DAX is down -1.22%. CAC is down -1.36%. UK 10-ear yield is up sharply by 0.1297 at 3.931. Germany 10-year yield is up 0.037 at 2.297. Earlier in Asia, Nikkei fell -0.40%. Hong Kong HSI fell sharply by -3.71%. China Shanghai SSE fell -2.09%. Singapore Strait Times fell -1.34%. Japan 10-year JGB yield rose 0.0113 to 0.609.
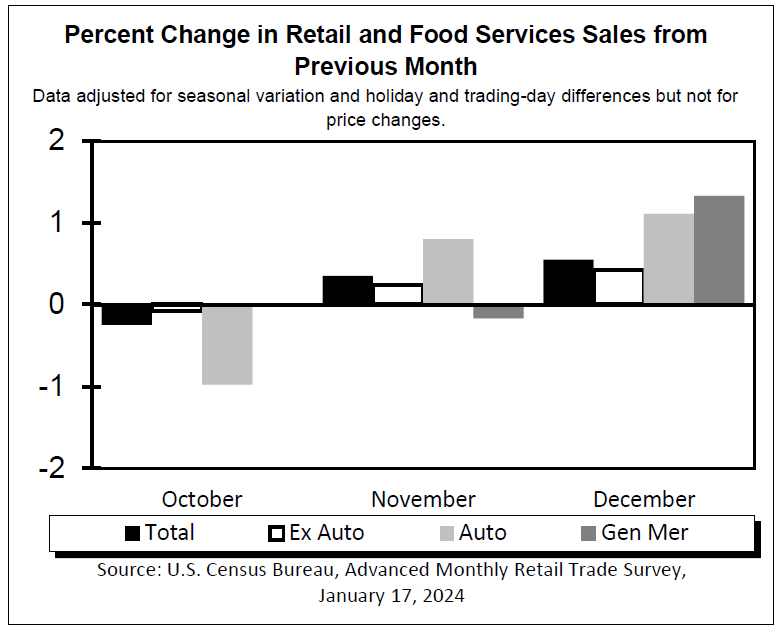
US retail sales grows 0.6% mom in Dec, ex-auto sales up 0.4% mom
US retail sales rose 0.6% mom to USD 709.9B in December, above expectation of 0.4% mom. Ex-auto sales rose 0.4% mom to USD 573.4B, above expectation of 0.2% mom. Ex-gasoline sales rose 0.7% mom to USD 656.7B. Ex-auto, gasoline sales rose 0.6% mom to USD 520.2B.
ECB's Lagarde suggests potential summer rate cut, but maintains reserved stance
In an interview at Bloomberg House in Davos, ECB President Christine Lagarde said "it's likely" for a rate cut in the summer, but added that she has to be "reserved". She emphasized ECB's data-dependent approach and acknowledged the prevailing uncertainty and certain indicators that are yet to reach desired levels.
Lagarde expressed concern regarding market expectations for aggressive rate cuts, labeling them as a "distraction" from the ECB's primary goal of combating inflation. She expressed concern that if market anticipations are misaligned with reality, they could hinder ECB's inflation control efforts.
Reiterating the ECB's commitment to achieving sustainable inflation of 2% over the medium term, Lagarde asserted, "We are on the right path, we are directionally towards the 2%, but unless and until we are confident that it is sustainably at 2% — medium term — and we have the data to support it, I'm not going to shout victory."
Eurozone CPI finalized at 2.9% yoy in Dec, core CPI at 3.4% yoy
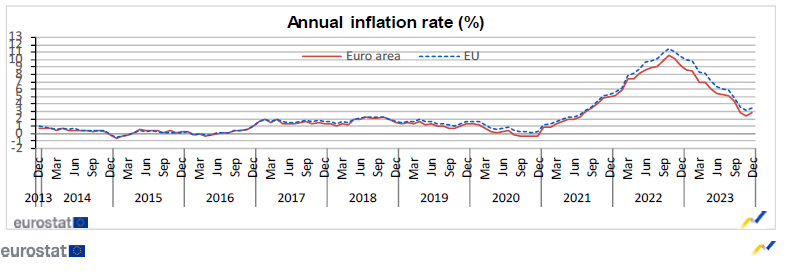
Eurozone CPI was finalized at 2.9% yoy in December, up from November's 2.4% yoy. CPI core (ex-energy, food, alcohol & tobacco) was finalized at 3.4% yoy, down from prior month's 3.6% yoy. The highest contribution to the annual euro area inflation rate came from services (+1.74 percentage points, pp), followed by food, alcohol & tobacco (+1.21 pp), non-energy industrial goods (+0.66 pp) and energy (-0.68 pp).
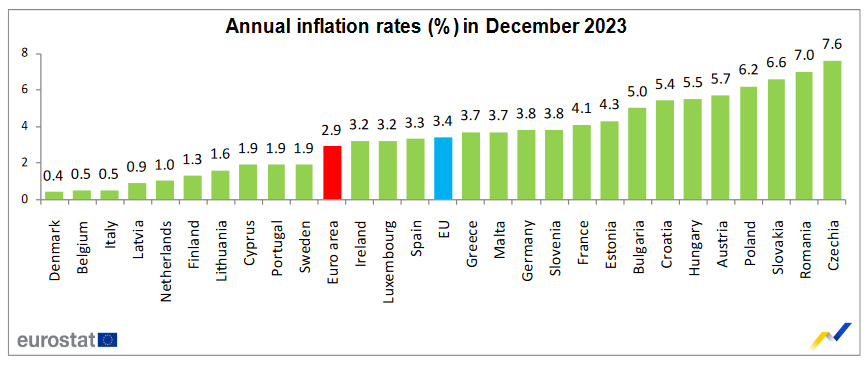
EU CPI was finalized at 3.4% yoy, up from November's 3.1%. The lowest annual rates were registered in Denmark (0.4%), Italy and Belgium (both 0.5%). The highest annual rates were recorded in Czechia (7.6%), Romania (7.0%) and Slovakia (6.6%). Compared with November, annual inflation fell in fifteen Member States, remained stable in one and rose in eleven.
UK CPI rises to 4.0% yoy in Dec, core unchanged at 5.1% yoy.
UK CPI rose 0.4% mom in December, well above expectation of 0.2% mom. For the 12- month period, CPI accelerated from 3.9% yoy to 4.0% yoy, above expectation of 3.8% yoy. That's the first time the rate has increased since February 2023.
CPI core (excluding energy, food, alcohol and tobacco) was unchanged at 5.1% yoy, above expectation of 4.9% yoy. CPI goods slowed from 2.0% yoy to 1.9% yoy. CPI services rose from 6.3% yoy to 6.4% yoy.
China's 2023 economic growth at 5.2%, population shrinks for second year
China's GDP grew 5.2% yoy in Q4, an uptick from Q3's 4.9% yoy. For the full year of 2023, the economy also recorded a growth rate of 5.2%. On a quarter-by-quarter basis, GDP growth rate was 1.0% qoq, matched expectation, though this marked a slowdown from the previous quarter's revised 1.5% qoq gain.
In the industrial sector, production rose by 6.8% yoy in December, slightly higher than the previous month's 6.6%, meeting market forecasts. However, retail sales growth decelerated to 7.4% yoy, a drop from November's 10.1% yoy and below the expected 8.1% yoy.
Investment patterns showed a mixed trend. Overall fixed asset investment in 2023 grew by 3.0%, slightly exceeding the 2.9% expectation. Within this category, real estate investment saw a significant drop of -9.6%. Conversely, investment in infrastructure and manufacturing rose by 5.9% and 6.5%, respectively, signaling growth in these areas.
Amidst these economic developments, China faces a demographic challenge as its population fell for the second consecutive year in 2023. Total population decreased by -2.75m to 1.409B, a more rapid decline than in 2022.
EUR/CHF Mid-Day Outlook
Daily Pivots: (S1) 0.9351; (P) 0.9370; (R1) 0.9389; More...
EUR/CHF's break of 0.9402 support turned resistance suggests that down trend from 1.0095 has completed at 0.9252 already. Rebound from there is tentatively seen as a corrective move first. Intraday bias is now on the upside for 55 D EMA (now at 0.9451). Sustained break there will target 38.2% retracement of 1.0095 to 0.9252 at 0.9574. On the downside, though, break of 0.9349 minor support will turn bias back to the downside for retesting 0.9252 low instead.
In the bigger picture, medium term outlook remains bearish as long as 0.9683 resistance holds. Current fall from 1.2004 (2018 high) is part of the multi-decade down trend. Another decline is in favor after rebound from 0.9252 completes.
Economic Indicators Update
| GMT | Ccy | Events | Actual | Forecast | Previous | Revised |
|---|---|---|---|---|---|---|
| 02:00 | CNY | GDP Y/Y Q4 | 5.20% | 5.20% | 4.90% | |
| 02:00 | CNY | Industrial Production Y/Y Dec | 6.80% | 6.80% | 6.60% | |
| 02:00 | CNY | Retail Sales Y/Y Dec | 7.40% | 8.10% | 10.10% | |
| 02:00 | CNY | Fixed Asset Investment YTD Y/Y Dec | 3.00% | 2.90% | 2.90% | |
| 07:00 | GBP | CPI M/M Dec | 0.40% | 0.20% | -0.20% | |
| 07:00 | GBP | CPI Y/Y Dec | 4.00% | 3.80% | 3.90% | |
| 07:00 | GBP | Core CPI Y/Y Dec | 5.10% | 4.90% | 5.10% | |
| 07:00 | GBP | RPI M/M Dec | 0.50% | 0.40% | -0.10% | |
| 07:00 | GBP | RPI Y/Y Dec | 5.20% | 5.10% | 5.30% | |
| 07:00 | GBP | PPI Input M/M Dec | -1.20% | -0.70% | -0.30% | -0.40% |
| 07:00 | GBP | PPI Input Y/Y Dec | -2.80% | -1.90% | -2.60% | -2.70% |
| 07:00 | GBP | PPI Output M/M Dec | -0.60% | -0.20% | -0.10% | 0.00% |
| 07:00 | GBP | PPI Output Y/Y Dec | 0.10% | 0.40% | -0.20% | -0.10% |
| 07:00 | GBP | PPI Core Output M/M Dec | 0.00% | 0.00% | ||
| 07:00 | GBP | PPI Core Output Y/Y Dec | 0.10% | 0.20% | ||
| 10:00 | EUR | Eurozone CPI Y/Y Dec F | 2.90% | 2.90% | 2.90% | |
| 10:00 | EUR | Eurozone CPI Core Y/Y Dec F | 3.40% | 3.40% | 3.40% | |
| 13:30 | CAD | Industrial Product Price M/M Dec | -1.50% | -0.70% | -0.40% | |
| 13:30 | CAD | Raw Material Price Index Dec | -4.90% | -2.10% | -4.20% | |
| 13:30 | USD | Retail Sales M/M Dec | 0.60% | 0.40% | 0.30% | |
| 13:30 | USD | Retail Sales ex Autos M/M Dec | 0.40% | 0.20% | 0.20% | |
| 13:30 | USD | Import Price Index M/M Dec | 0.00% | -0.50% | -0.40% | |
| 14:15 | USD | Industrial Production M/M Dec | 0.10% | -0.10% | 0.20% | 0.00% |
| 14:15 | USD | Capacity Utilization Dec | 78.60% | 78.70% | 78.80% | 78.60% |
| 15:00 | USD | Business Inventories Nov | -0.10% | -0.10% | ||
| 15:00 | USD | NAHB Housing Index Jan | 39 | 37 | ||
| 19:00 | USD | Fed's Beige Book |
US retail sales grows 0.6% mom in Dec, ex-auto sales up 0.4% mom
US retail sales rose 0.6% mom to USD 709.9B in December, above expectation of 0.4% mom. Ex-auto sales rose 0.4% mom to USD 573.4B, above expectation of 0.2% mom. Ex-gasoline sales rose 0.7% mom to USD 656.7B. Ex-auto, gasoline sales rose 0.6% mom to USD 520.2B.
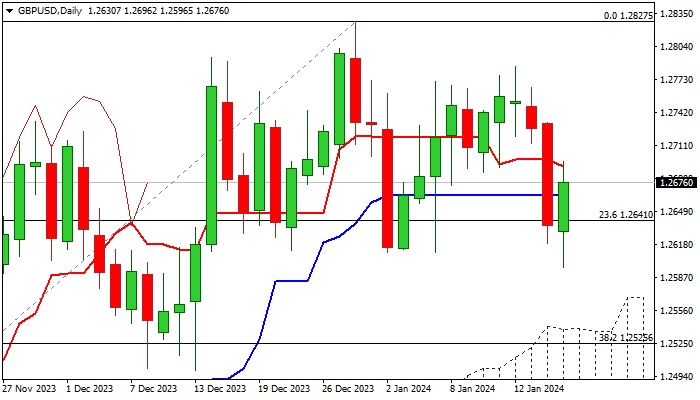
GBP/USD Putlook: Cable Jumped Around 0.4% in European Trading on Wednesday
Cable jumped around 0.4% in European trading on Wednesday, lifted by above forecast UK December inflation data, which soured the sentiment about rate cut, pushing percentage of bets for rate cut by May significantly lower.
Fresh gains move the price from dangerous zone after the price retested the floor of larger range at 1.2600 zone, which extends into fifth consecutive week.
Although the price action moved into range’s mid-point, there is still notable lack of clearer direction signals, as negative momentum on daily chart is strengthening, but moving averages are mixed and rising and thickening daily cloud continues to underpin.
Look for initial bullish signal on close above 10DMA (1.2715) which will be verified on extension above 1.2785 (Jan 12 top), with signal of bullish continuation of larger uptrend from 1.2037 (Oct 4 low), expected on clear break above pivotal 1.2830/40 zone (range top / 200WMA).
Conversely, sustained break of range floor would signal that larger bulls are losing traction, but violation of more significant supports at 1.2545/39 (200DMA / daily cloud top) will be required to signal reversal.
Res: 1.2696; 1.2715; 1.2785; 1.2843.
Sup: 1.2596; 1.2545; 1.2526; 1.2500.
British Pound Gains Ground as UK Inflation Rises
- UK inflation rises unexpectedly
- GBP/USD climbs higher
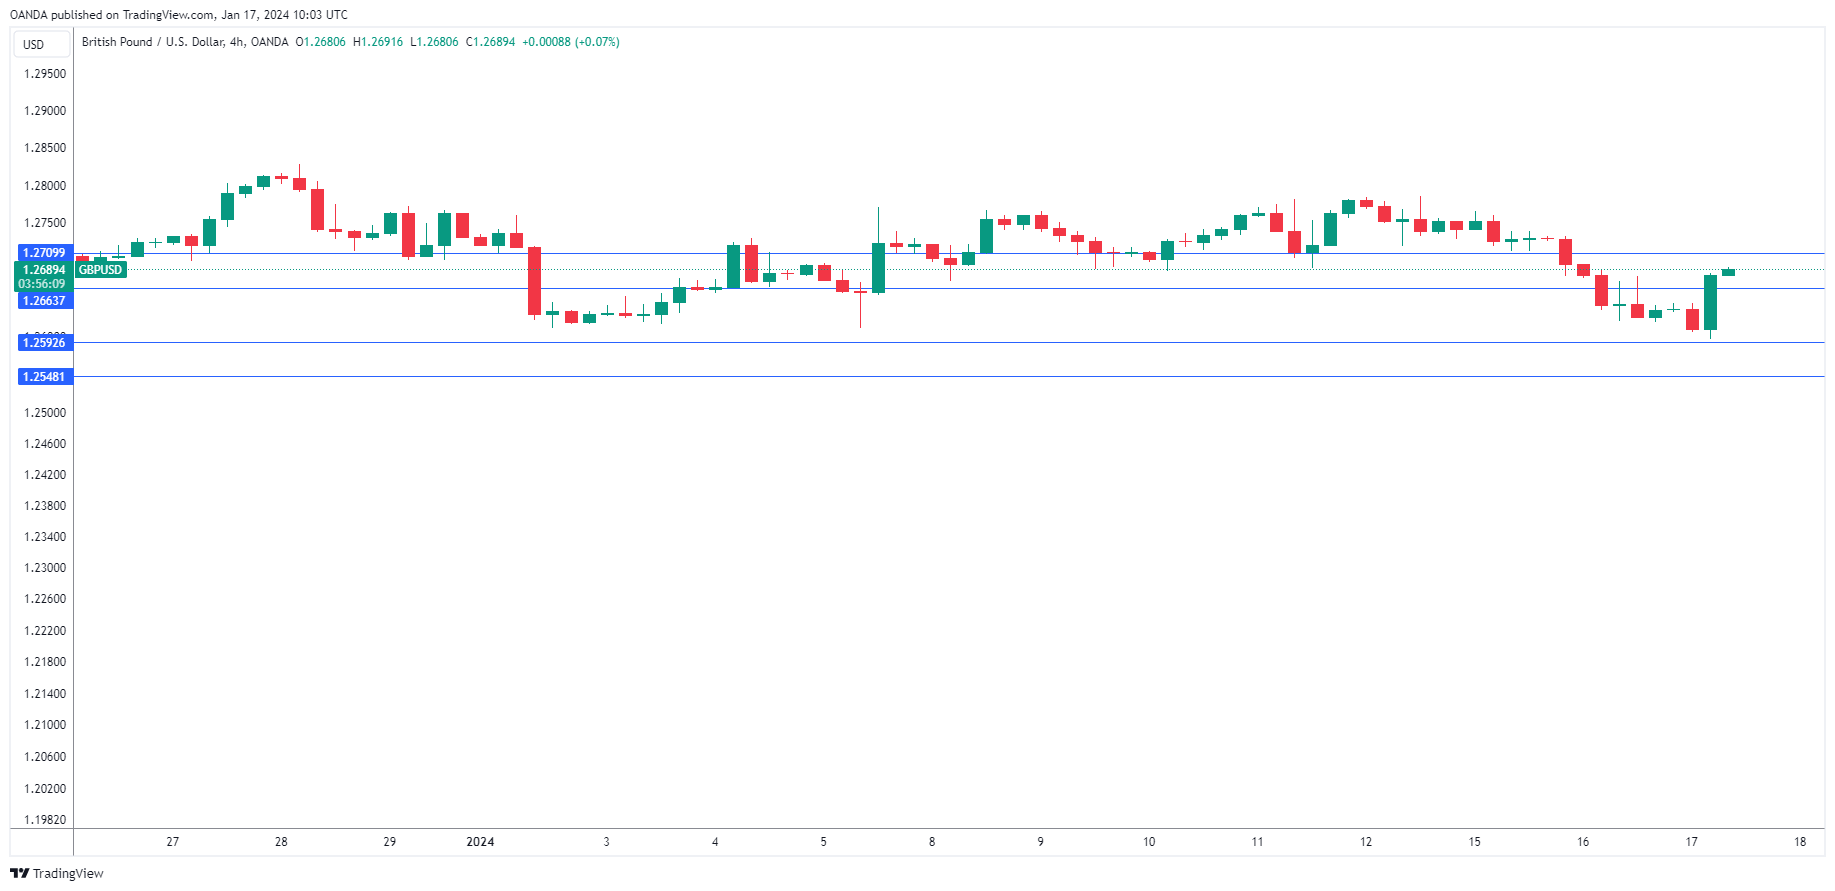
The British pound has edged higher after UK inflation rose unexpectedly in December. In the European session, GBP/USD is trading at 1.2694, up 0.47%.
UK inflation rises to 3.9%
UK inflation has a tendency to surprise the markets and that happened again on Wednesday as December CPI ticked upwards to 4.0% y/y, up from 3.9% in November and above the consensus estimate of 3.8%. The main driver of the upswing was higher alcohol and tobacco prices. Monthly, CPI rose 0.4%, up from -0.2% in November and higher than the consensus estimate of 0.2%.
Core CPI remained unchanged at 5.1% y/y, above the consensus estimate of 4.9%. Monthly, the core rate surged 0.6%, compared to -0.3% in November and above the consensus estimate of 0.4%.
For the Bank of England, the rise in inflation is a nasty surprise, in particular the sharp rise in monthly core CPI. Still, one disappointing inflation report will not lead to the Bank of England changing its monetary policy. Today’s release marked the first time in 10 months that inflation has increased, and the 3.9% gain in November was the lowest in almost two years.
The BoE’s steep rate-tightening cycle has slashed inflation and the BoE will be hoping that the unexpected upswing turns out to be a one-time blip. The BoE has stuck to its policy of ‘higher for longer’, maintaining rates at 5.25% for three straight months. Policy makers are hesitant to lower rates, despite the specter of a recession, as inflation remains twice as high as the BoE’s 2% target.
Interestingly, inflation rose in December in the US, France, Germany and Canada. This is a reminder that inflation doesn’t necessarily fall in a straight line, and there will be some ups-and downs over a protracted period. It could also be a sign that high interest rates have largely run their course and are having a lesser impact on reducing inflation as we get closer to the 2% target.
GBP/USD Technical
- GBP/USD is testing resistance at 1.2664, followed by resistance at 1.2709
- There is support at 1.2592 and 1.2547
A Bearish Lull in Crypto?
Market picture
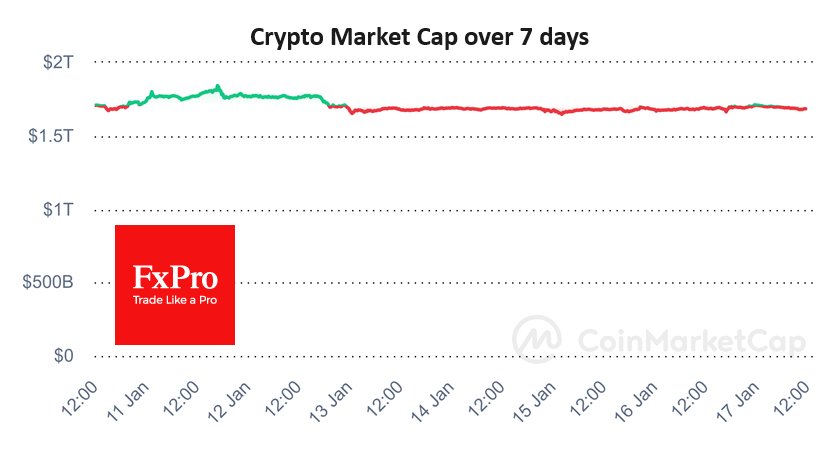
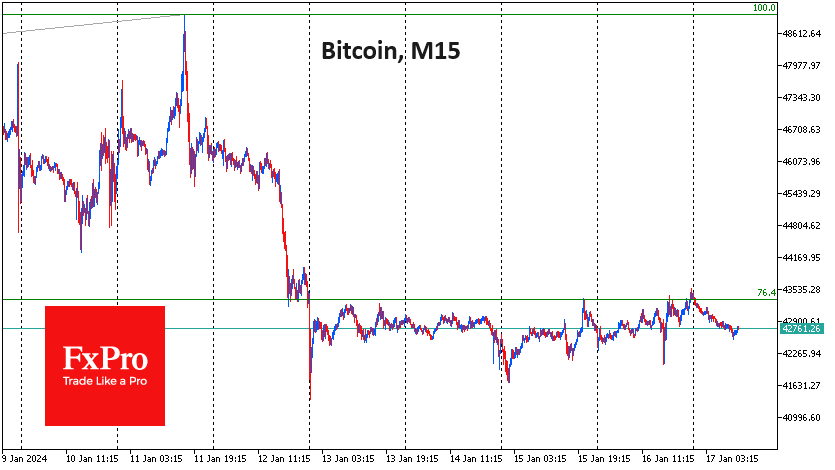
The crypto market has been going around in circles since 13 January, staying near levels 24 hours ago, although Bitcoin’s intraday range exceeded 3.5%. Reaching the highs of the recent trading range triggered a methodical sell-off early on Wednesday and quickly spread to the major altcoins.
Bitcoin made local highs late on Tuesday, reaching $43.5K, but at the time of writing, it has already lost 1K. On daily timeframes, this still looks like a wander around the 50-day, leaving the bulls hoping that the level can be held. However, intraday dynamics instead point to methodical selling near local highs, while bounces are occurring sharply and with less volume. This is a cautionary observation but not at all a verdict on the cryptocurrency bull market.
Transaction volume on the Ethereum network has surged over the past week to levels seen in November 2021, when the asset was trading near all-time highs above $4600. At the same time, the supply volume is “on the upside” at 91.5%. Significant unrealised gains in the short term could serve as a bearish factor, putting pressure on ETH with a potential wave of selling.
News background
Spot bitcoin ETFs have opened a channel for significant capital to flow into the industry, but they have also created new risks, The Block writes. One of the apparent problems has been the concentration of storage of bitcoins owned by the funds. In addition, traditional financial practices have the potential to threaten the ecosystem of the first cryptocurrency.
Bitcoin, stablecoins and digital currencies of central banks, although still in the budding stage, offer opportunities to undermine the dollar’s domination, according to Morgan Stanley. The launch of spot bitcoin ETFs could greatly accelerate the process of de-dollarisation of the global economy.
International Monetary Fund’s Kristalina Georgieva said that cryptocurrencies are an asset class, not money, so Bitcoin is unlikely to displace the US dollar.
Stablecoin TrueUSD (TUSD) lost parity with the US dollar, falling 1.3% to $0.984. The de-peg came against a background of significant sales of TUSD on Binance.
Tether expressed disappointment with the UN’s assessment of the use of the USDT stablecoin in illegal activities and ignoring the asset’s role in emerging economies.
Gold Price Dips Again and Crude Oil Price Turns Red
Gold price is correcting gains below the $2,040 support. Crude oil prices declined steadily below the $72.90 support and moved into a bearish zone.
Important Takeaways for Gold and Oil Prices Analysis Today
- Gold price climbed higher toward the $2,060 zone before it corrected lower against the US Dollar.
- A key bearish trend line is forming with resistance near $2,040 on the hourly chart of gold at FXOpen.
- Crude oil prices extended downsides below the $72.90 support zone.
- A major bearish trend line is forming with resistance near $72.20 on the hourly chart of XTI/USD at FXOpen.
Gold Price Technical Analysis
On the hourly chart of Gold at FXOpen, the price rallied heavily above the $2,040 resistance. The price even spiked above $2,060 before there was a downside correction.
There was a move below the $2,040 support level. The bears even pushed the price below the $2,030 support and the 50-hour simple moving average. It tested the $2,020 zone. A low is formed near $2,019.32 and the price is now showing bearish signs.
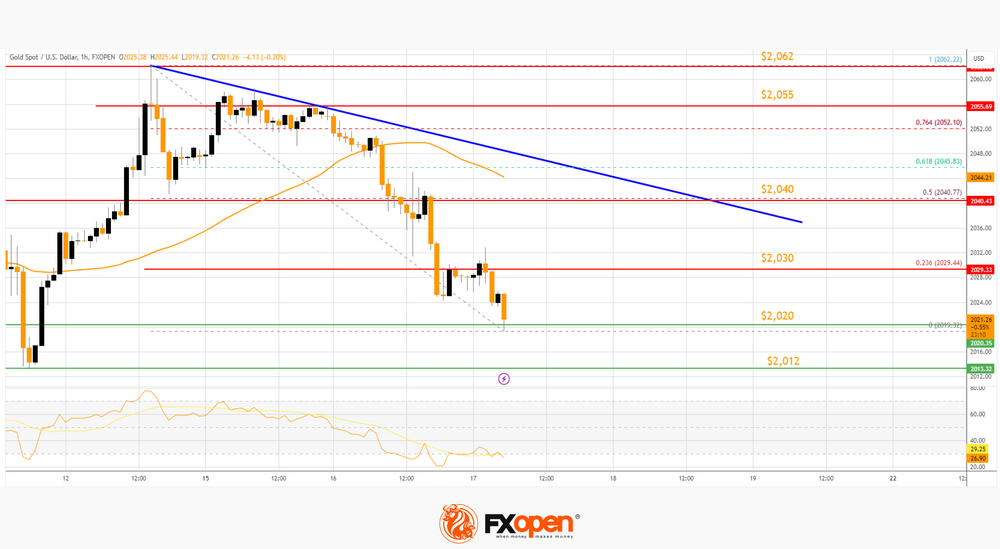
Immediate resistance is near the 23.6% Fib retracement level of the downward move from the $2,062 swing high to the $2,019 low at $2,030.
The next major resistance is near a bearish trend line at $2,040. The trend line is close to the 50-hour simple moving average and coincides with the 50% Fib retracement level of the downward move from the $2,062 swing high to the $2,019 low.
The main resistance could be $2,055, above which the price could test the $2,070 resistance. The next major resistance is $2,080. An upside break above the $2,080 resistance could send Gold price toward $2,120. Any more gains may perhaps set the pace for an increase toward the $2,135 level.
Initial support on the downside is near the $2,020 level. The first major support is near the $2,012 level. If there is a downside break below the $2,012 support, the price might decline further. In the stated case, the price might drop toward the $1,980 support.
Oil Price Technical Analysis
On the hourly chart of WTI Crude Oil at FXOpen, the price struggled to continue higher above $75.20 against the US Dollar. The price formed a short-term top and started a fresh decline below $74.50.
There was a steady decline below the $72.90 pivot level. The bears even pushed the price below $72.20 and the 50-hour simple moving average. Finally, the price tested the $71.40 zone. The recent swing low was formed near $71.69, and the price is now consolidating losses.
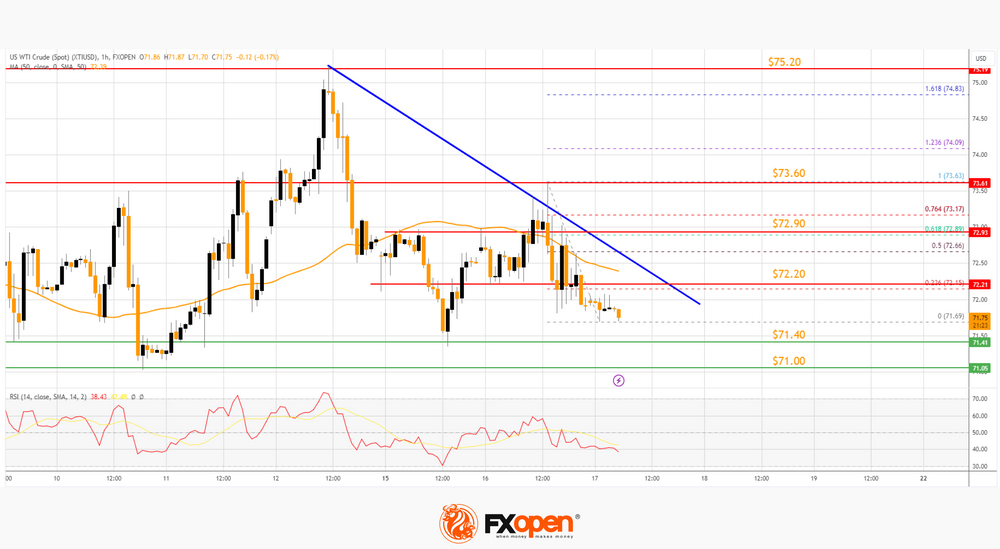
Immediate support is near the $71.40 level. The next major support on the WTI crude oil chart is near $71.00. If there is a downside break, the price might decline toward $70.00. Any more losses may perhaps open the doors for a move toward the $68.00 support zone.
On the upside, immediate resistance is near a major bearish trend line at $72.20. It is close to the 23.6% Fib retracement level of the downward move from the $73.63 swing high to the $71.69 low.
The next resistance is near the 61.8% Fib retracement level of the downward move from the $73.63 swing high to the $71.69 low at $72.90. A clear move above the trend line resistance and $72.90 could send the price toward $73.60.
The next key resistance is near $75.20. If the price climbs further higher, it could face resistance near $78.00. Any more gains might send the price toward the $80.00 level.
Start trading commodities with tight spreads. Open your trading account now or learn more about trading commodity CFDs with FXOpen.
This article represents the opinion of the Companies operating under the FXOpen brand only. It is not to be construed as an offer, solicitation, or recommendation with respect to products and services provided by the Companies operating under the FXOpen brand, nor is it to be considered financial advice.
Eurozone CPI finalized at 2.9% yoy in Dec, core CPI at 3.4% yoy
Eurozone CPI was finalized at 2.9% yoy in December, up from November's 2.4% yoy. CPI core (ex-energy, food, alcohol & tobacco) was finalized at 3.4% yoy, down from prior month's 3.6% yoy. The highest contribution to the annual euro area inflation rate came from services (+1.74 percentage points, pp), followed by food, alcohol & tobacco (+1.21 pp), non-energy industrial goods (+0.66 pp) and energy (-0.68 pp).
EU CPI was finalized at 3.4% yoy, up from November's 3.1%. The lowest annual rates were registered in Denmark (0.4%), Italy and Belgium (both 0.5%). The highest annual rates were recorded in Czechia (7.6%), Romania (7.0%) and Slovakia (6.6%). Compared with November, annual inflation fell in fifteen Member States, remained stable in one and rose in eleven.
NZDUSD Plummets Below 50-day SMA
- NZDUSD extends its recent bearish leg
- Violates 50-day SMA and eyes 200-day SMA
- Oscillators endorse the recent dive
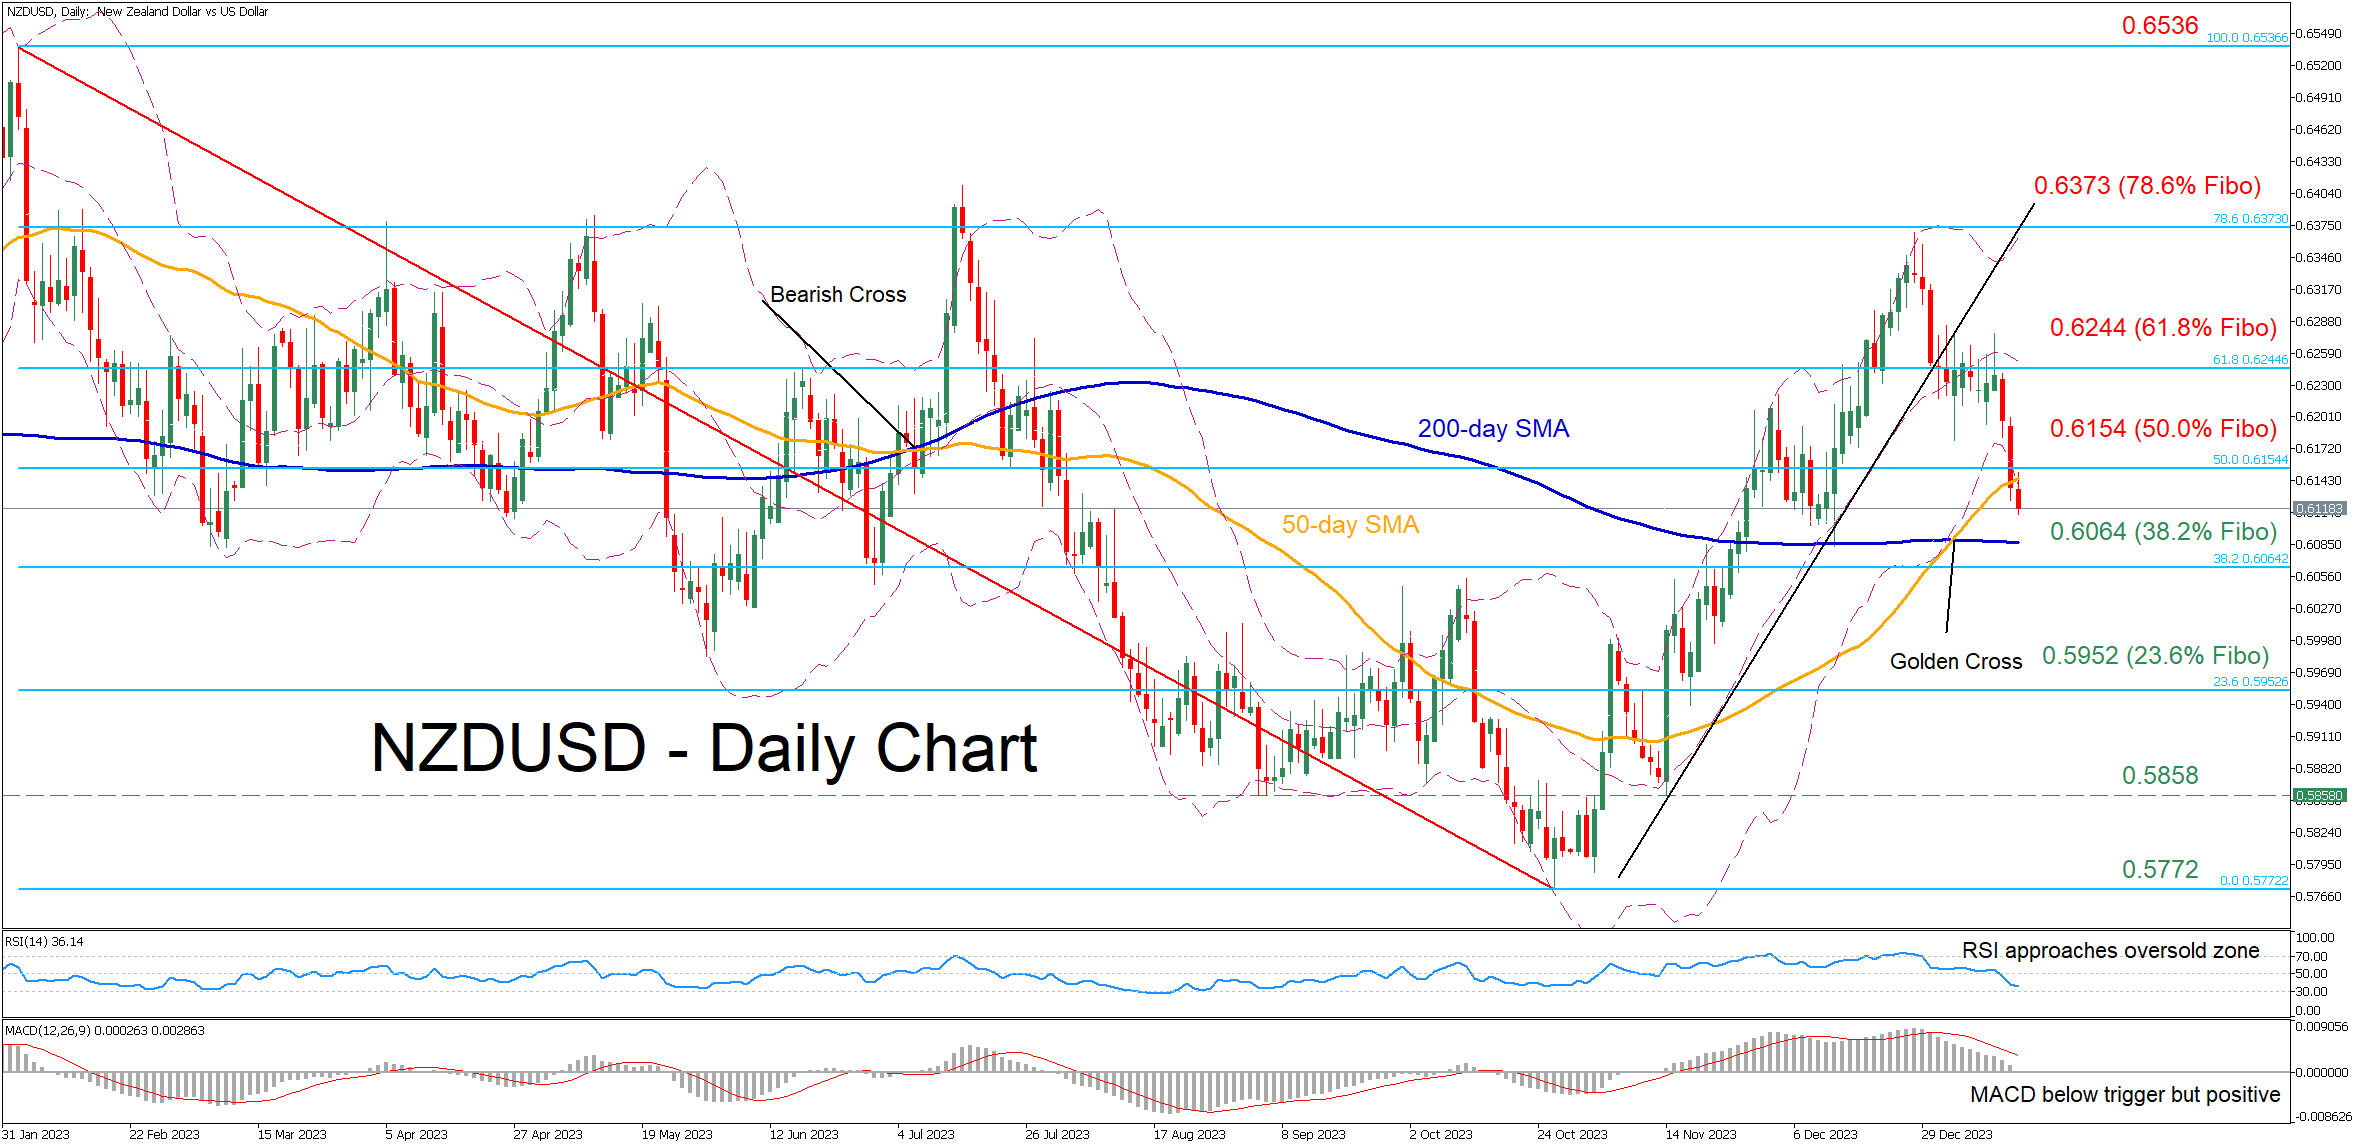
NZDUSD had been in a steep uptrend since its 2023 low of 0.5772, generating consecutive higher highs. However, the advance stalled around the 78.6% Fibonacci retracement of the 0.6536-0.5772 downleg, with the pair experiencing a strong pullback.
If bearish pressures persist and the price crosses below the 200-day simple moving average (SMA), immediate support could be met at the 38.2% Fibo of 0.6064. Dipping beneath that zone, the pair may test the 23.6% Fibo of 0.5952. A violation of that region could pave the way for the September low of 0.5858, which also held its ground in November.
On the flipside, should the pair attempt to erase the recent correction, the 50.0% Fibo of 0.6154 could prove to be the first barricade for the bulls to clear. Further advances could then cease around the 61.8% Fibo of 0.6244. Breaking above that hurdle, the price might challenge the 78.6% Fibo of 0.6373, a region that capped the pair's uptrend in late December.
Overall, NZDUSD bears seem to be holding the upper hand in recent sessions, pushing the price to a fresh one-month low. The impending test of the 200-day SMA could decide whether the retreat could accelerate.
ECB’s Lagarde suggests potential summer rate cut, but maintains reserved stance
In an interview at Bloomberg House in Davos, ECB President Christine Lagarde said "it's likely" for a rate cut in the summer, but added that she has to be "reserved". She emphasized ECB's data-dependent approach and acknowledged the prevailing uncertainty and certain indicators that are yet to reach desired levels.
Lagarde expressed concern regarding market expectations for aggressive rate cuts, labeling them as a "distraction" from the ECB's primary goal of combating inflation. She expressed concern that if market anticipations are misaligned with reality, they could hinder ECB's inflation control efforts.
Reiterating the ECB's commitment to achieving sustainable inflation of 2% over the medium term, Lagarde asserted, "We are on the right path, we are directionally towards the 2%, but unless and until we are confident that it is sustainably at 2% — medium term — and we have the data to support it, I'm not going to shout victory."