Sample Category Title
Technical Outlook and Review
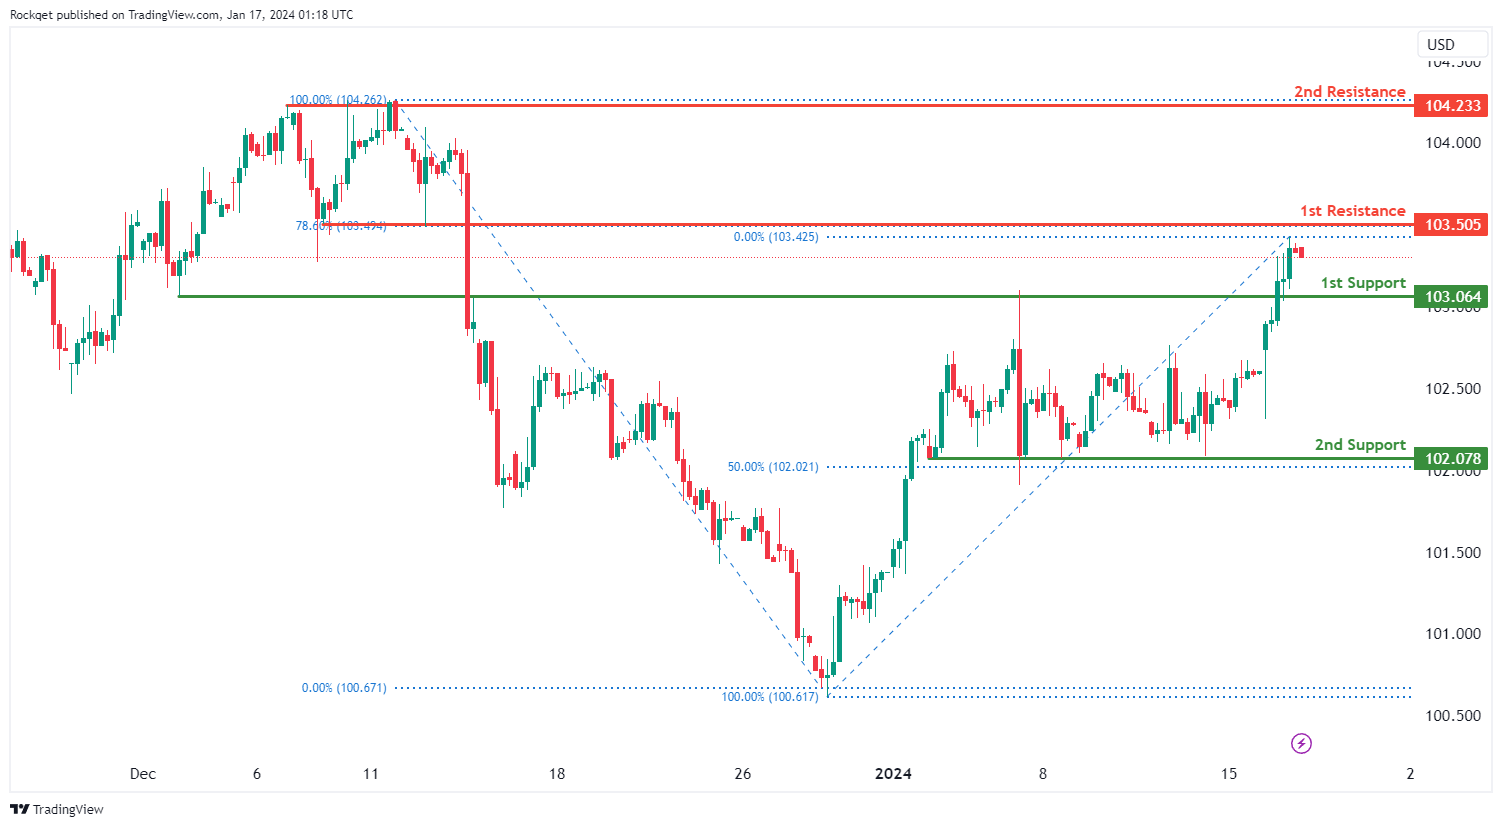
DXY:
The DXY (US Dollar Index) chart currently exhibits an overall bullish momentum. In this context, there is a potential scenario for price to make a bullish continuation towards the 1st resistance.
The 1st resistance level at 103.50 is identified as a pullback resistance that aligns with the 78.60% Fibonacci retracement level. Higher up, the 2nd resistance level at 104.23 is also noted as a pullback resistance, further reinforcing its significance as a potential resistance zone.
To the downside, the 1st support level at 103.06 is identified as an overlap support. Further below, the 2nd support level at 102.07 is marked as a pullback support that aligns with the 50.00% Fibonacci retracement level, further reinforcing its importance as a key support level.
EUR/USD:
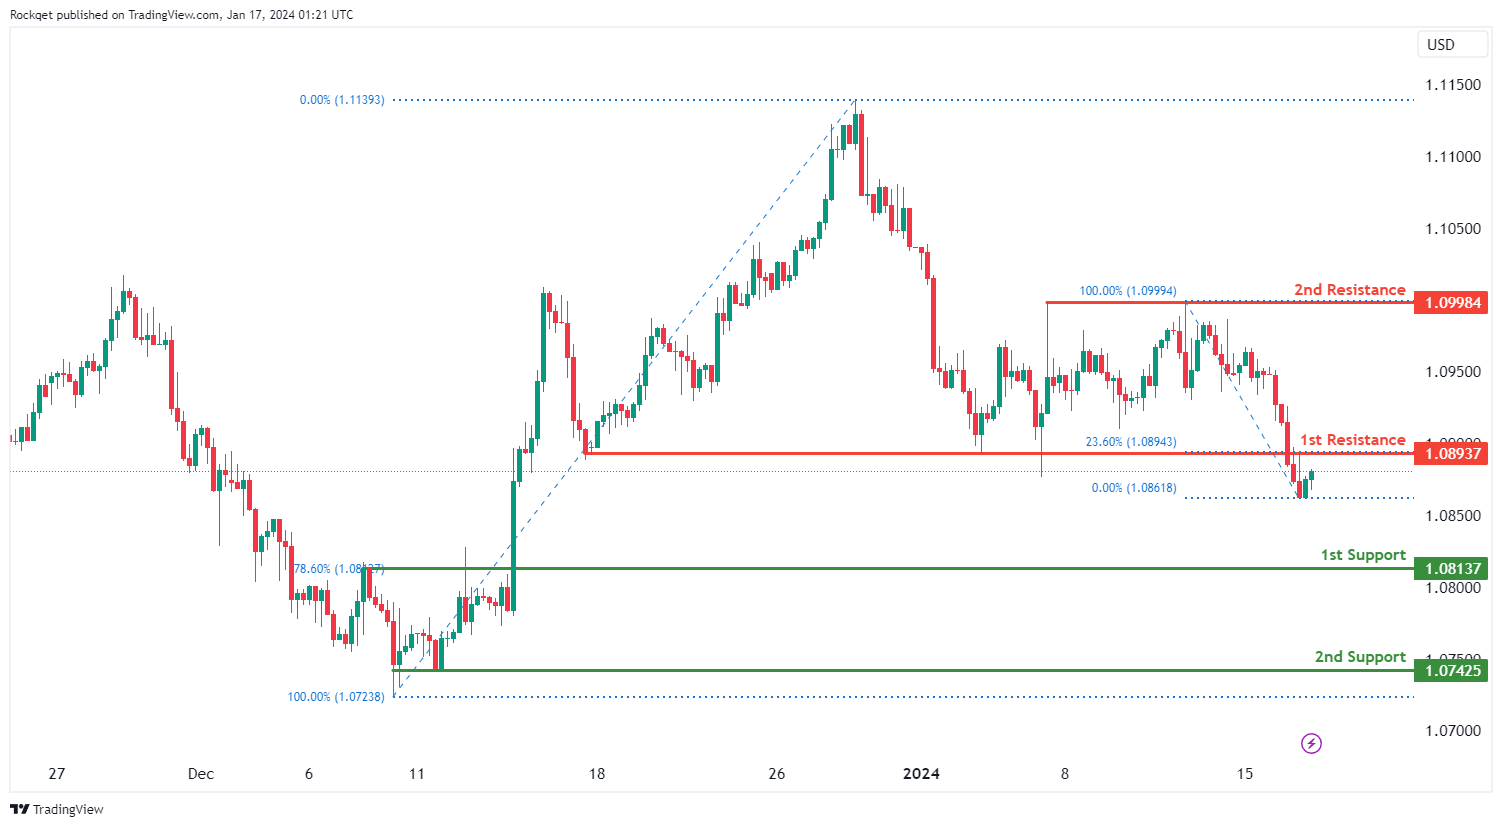
The EUR/USD chart currently exhibits an overall bearish momentum. In this context, there is a potential scenario for price to drop towards the 1st support.
The 1st support level at 1.0813 is identified as a pullback support that aligns with the 78.60% Fibonacci retracement level. Further below, the 2nd support level at 1.0742 is marked as a swing-low support, further reinforcing its importance as a key support level.
To the upside, the 1st resistance level at 1.0893 is identified as a pullback resistance that aligns with the 23.60% Fibonacci retracement level. Higher up, the 2nd resistance level at 1.0998 is also noted as a pullback resistance, suggesting a potential barrier for further upside movement.
EUR/JPY:
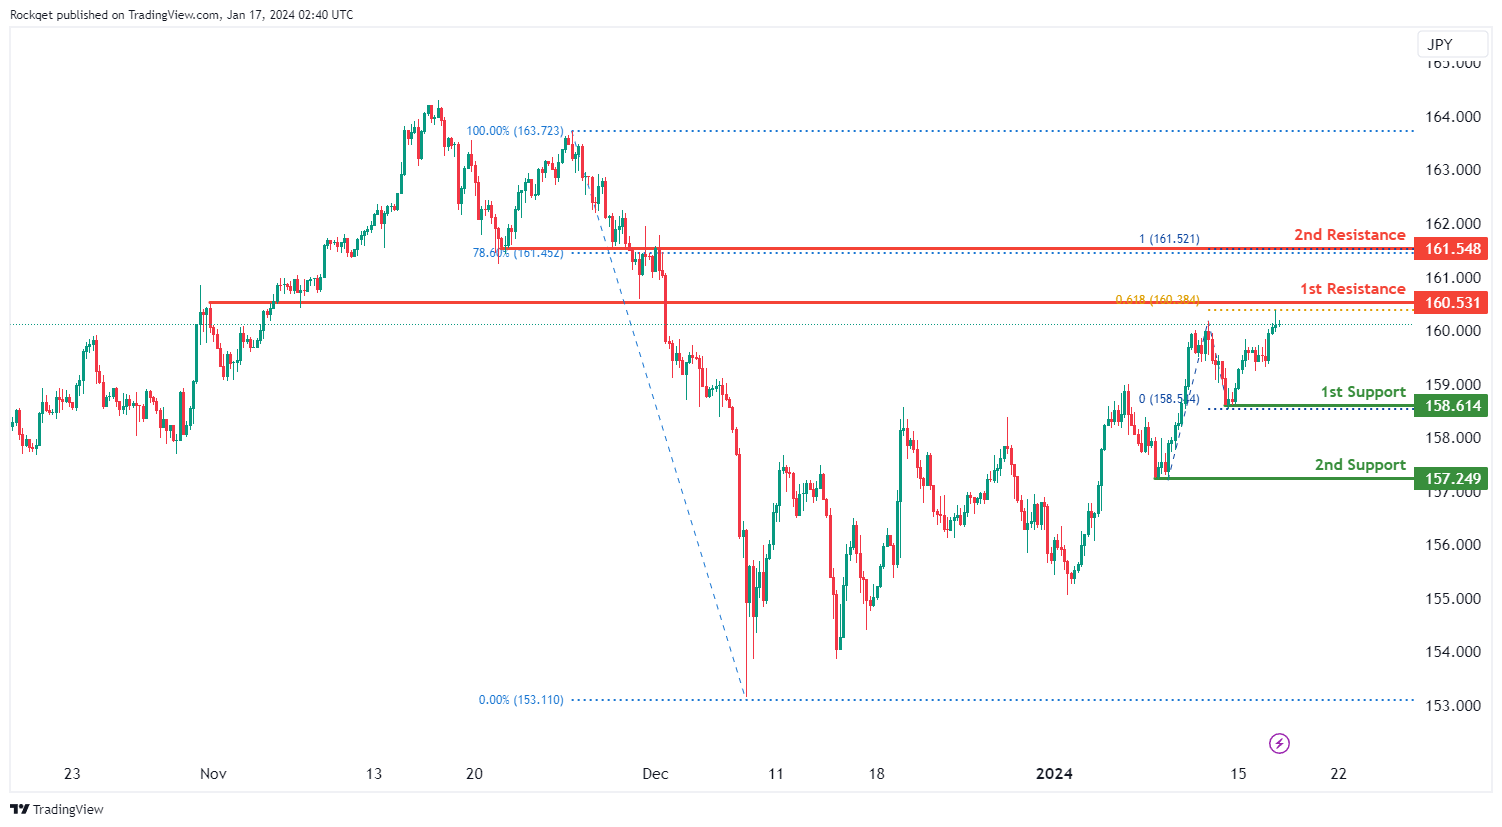
The EUR/JPY chart currently displays a bullish overall momentum, indicating a positive trend direction. Traders may anticipate a potential bullish continuation towards the 1st resistance level.
The 1st support at 158.61 is considered favorable, being identified as a swing low support. This level suggests historical significance as a point where buying interest has emerged in the past. Additionally, the 2nd support at 157.25 is another swing low support, adding to the confluence of support levels.
On the resistance side, the 1st resistance at 160.53 is identified as an overlap resistance and aligns with the 61.80% Fibonacci Projection. This confluence of technical factors adds strength to the potential resistance level. Furthermore, the 2nd resistance at 161.55 is recognized as an overlap resistance, with the additional support of the 78.60% Fibonacci Retracement.
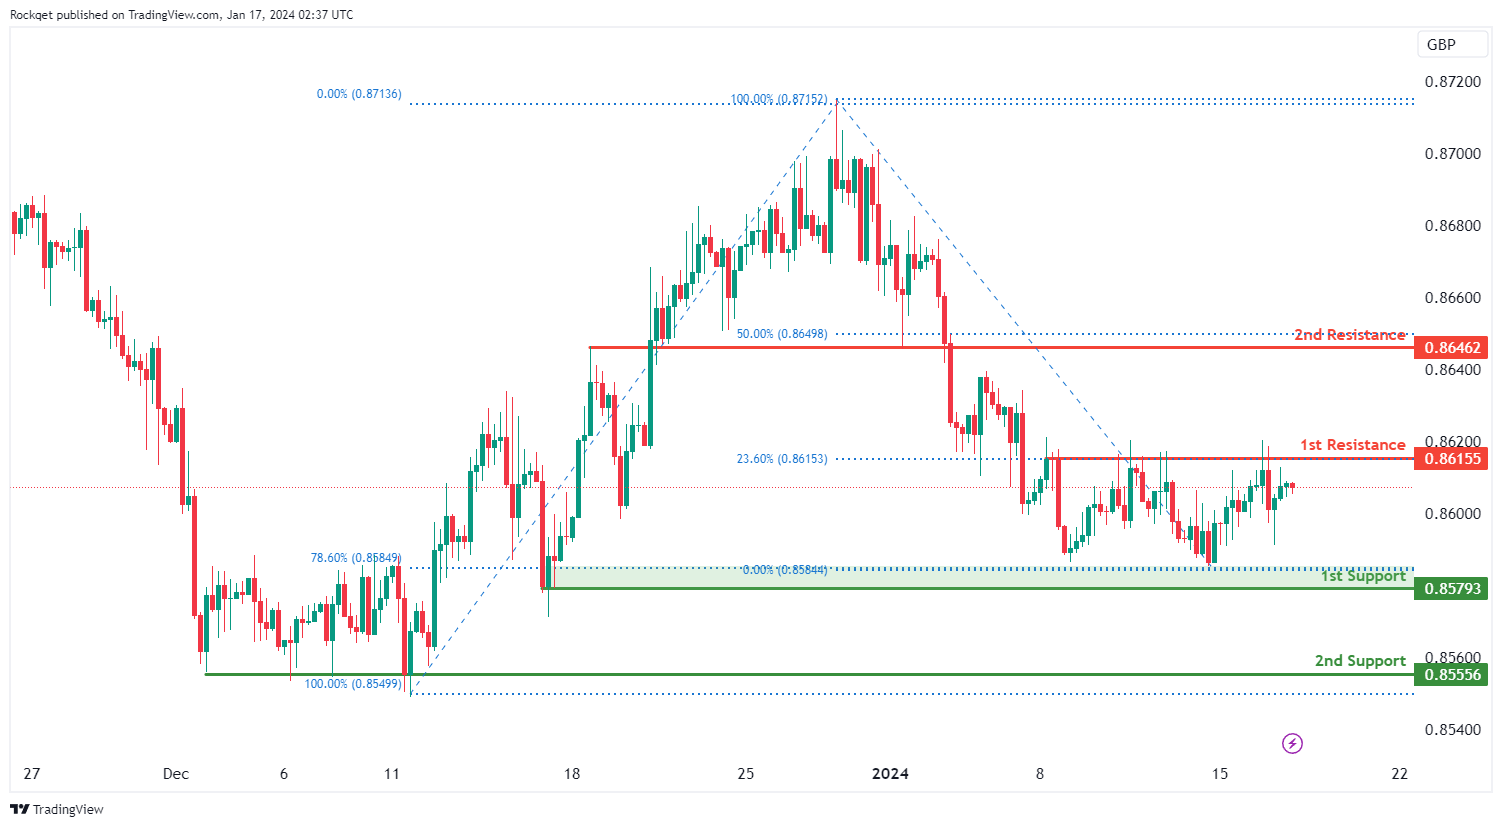
EUR/GBP:
The EUR/GBP chart currently exhibits a bullish overall momentum, indicating a positive trend direction. Several factors contribute to this bullish momentum, suggesting potential upward movement in the price.
The 1st support at 0.8579 is considered favorable due to its identification as an overlap support and coincides with the 78.60% Fibonacci Retracement. This level indicates historical significance, suggesting a strong level of support. Additionally, the 2nd support at 0.8556 is recognized as a multi-swing low support, providing additional strength to the support zone.
On the resistance side, the 1st resistance at 0.8616 is identified as a swing high resistance and aligns with the 23.60% Fibonacci Retracement. This confluence of technical factors adds strength to the potential resistance level. Furthermore, the 2nd resistance at 0.8646 is acknowledged as an overlap resistance and corresponds to the 50% Fibonacci Retracement.
GBP/USD:
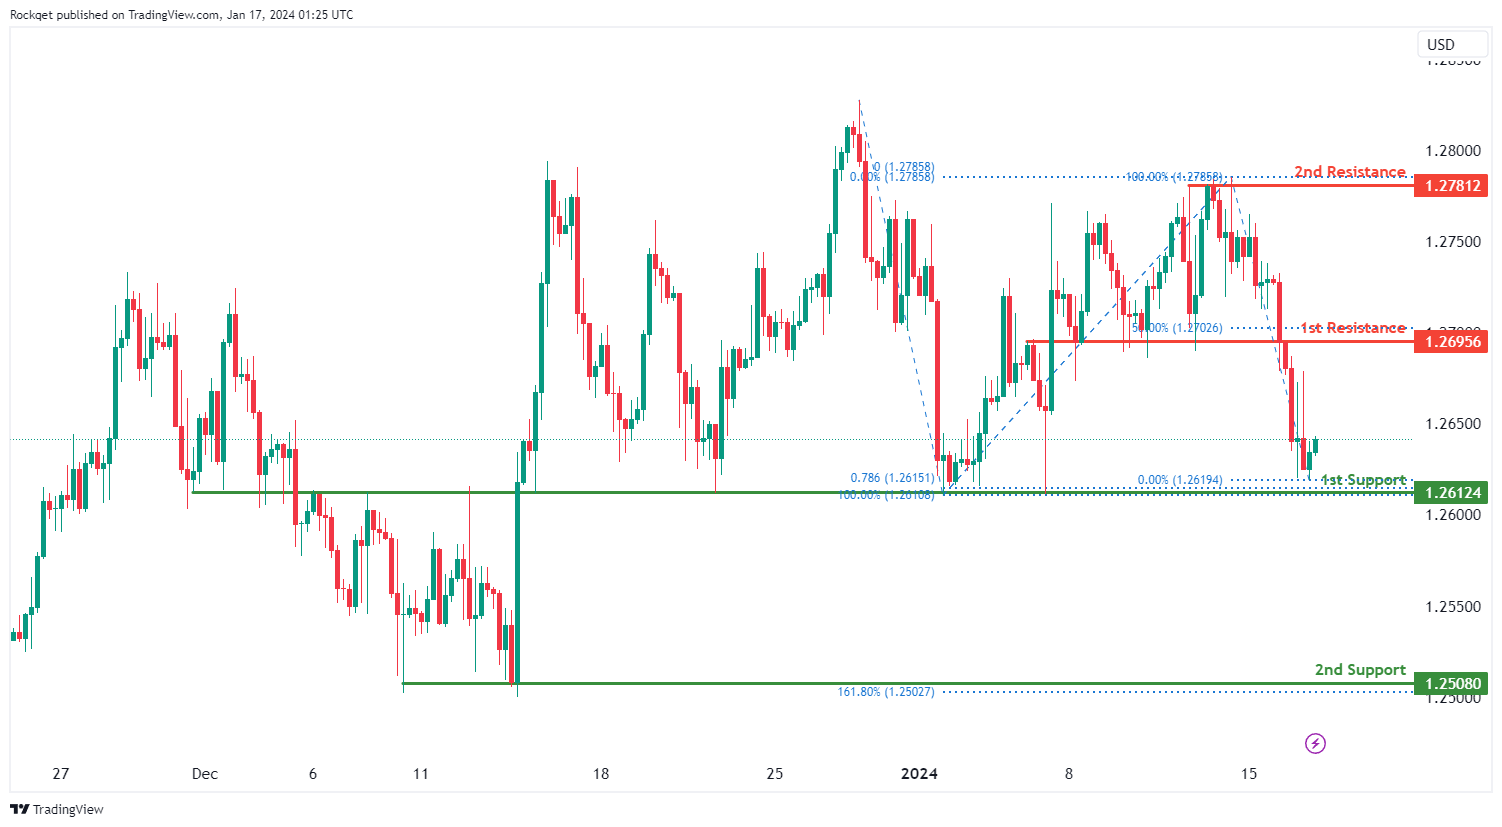
The GBP/USD chart currently exhibits an overall bearish momentum. In this context, there is a potential scenario for price to drop towards the 1st support.
The 1st support level at 1.2612 is identified as an overlap support that aligns with the 78.60% Fibonacci projection level. Further below, the 2nd support level at 1.2508 is marked as a swing-low support that aligns with the 161.80% Fibonacci extension level, further reinforcing its importance as a key support level.
To the upside, the 1st resistance level at 1.2695 is identified as an overlap resistance that aligns close to the 50.00% Fibonacci retracement level. Higher up, the 2nd resistance level at 1.2781 is noted as a swing-high resistance, suggesting a potential barrier for further upside movement.
GBP/JPY:
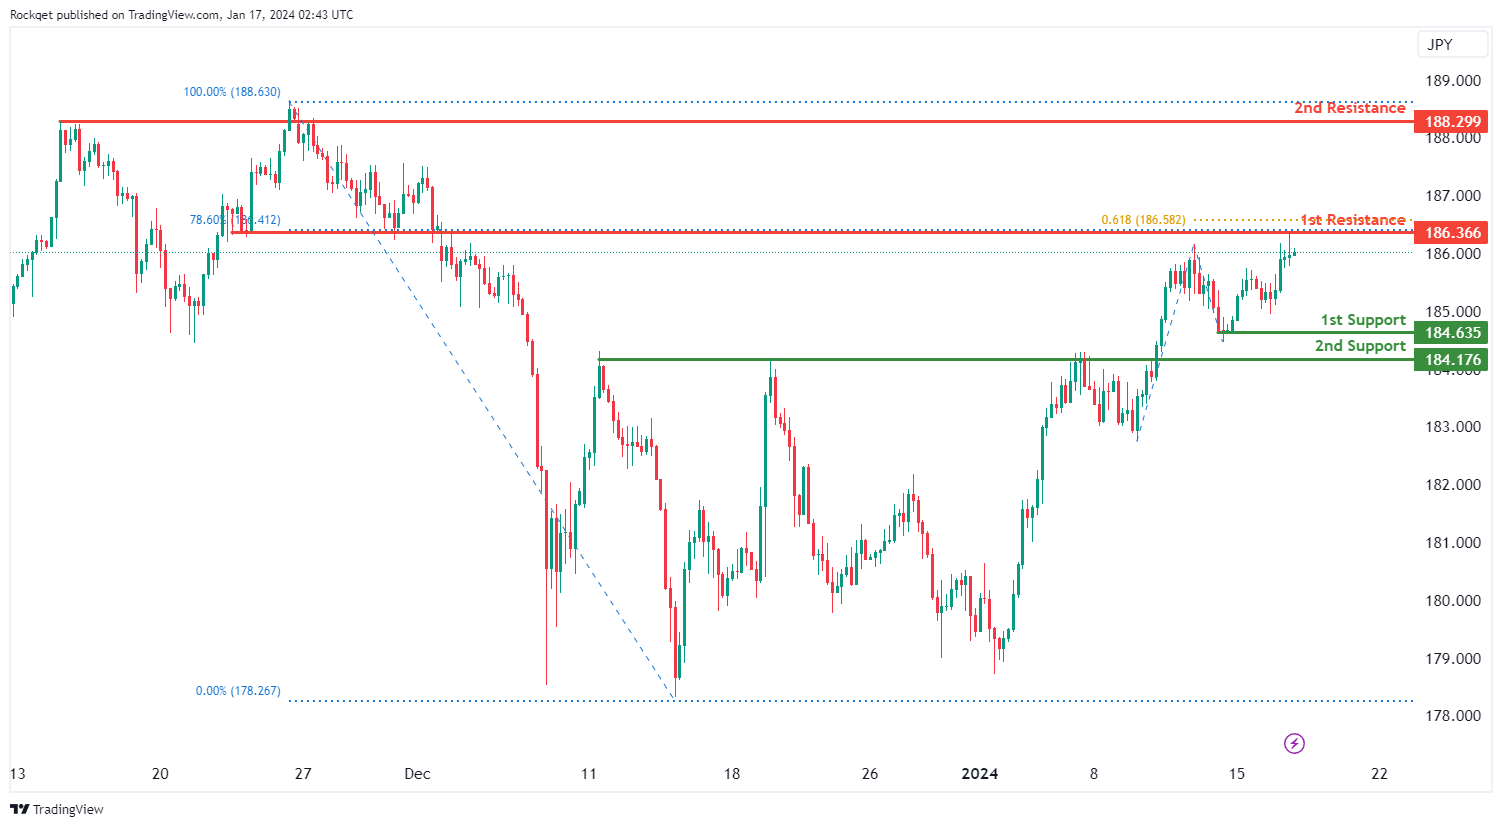
The GBP/JPY chart currently shows a bullish overall momentum, indicating an upward trend. There’s a potential for a bullish continuation towards the 1st resistance.
The 1st support at 184.64 is a swing low support, suggesting a historical area with significant buying interest. The 2nd support at 184.18 is labeled as a pullback support, indicating a potential zone for buying interest following a retracement.
On the resistance side, the 1st resistance at 183.37 is an overlap resistance, aligned with the 78.60% Fibonacci Retracement and the 61.80% Fibonacci Projection, suggesting a strong resistance zone. The 2nd resistance at 188.30 is a swing high resistance, representing a historical point of selling interest. Traders should closely monitor these levels for potential bullish movements in the GBP/JPY chart.
USD/CHF:
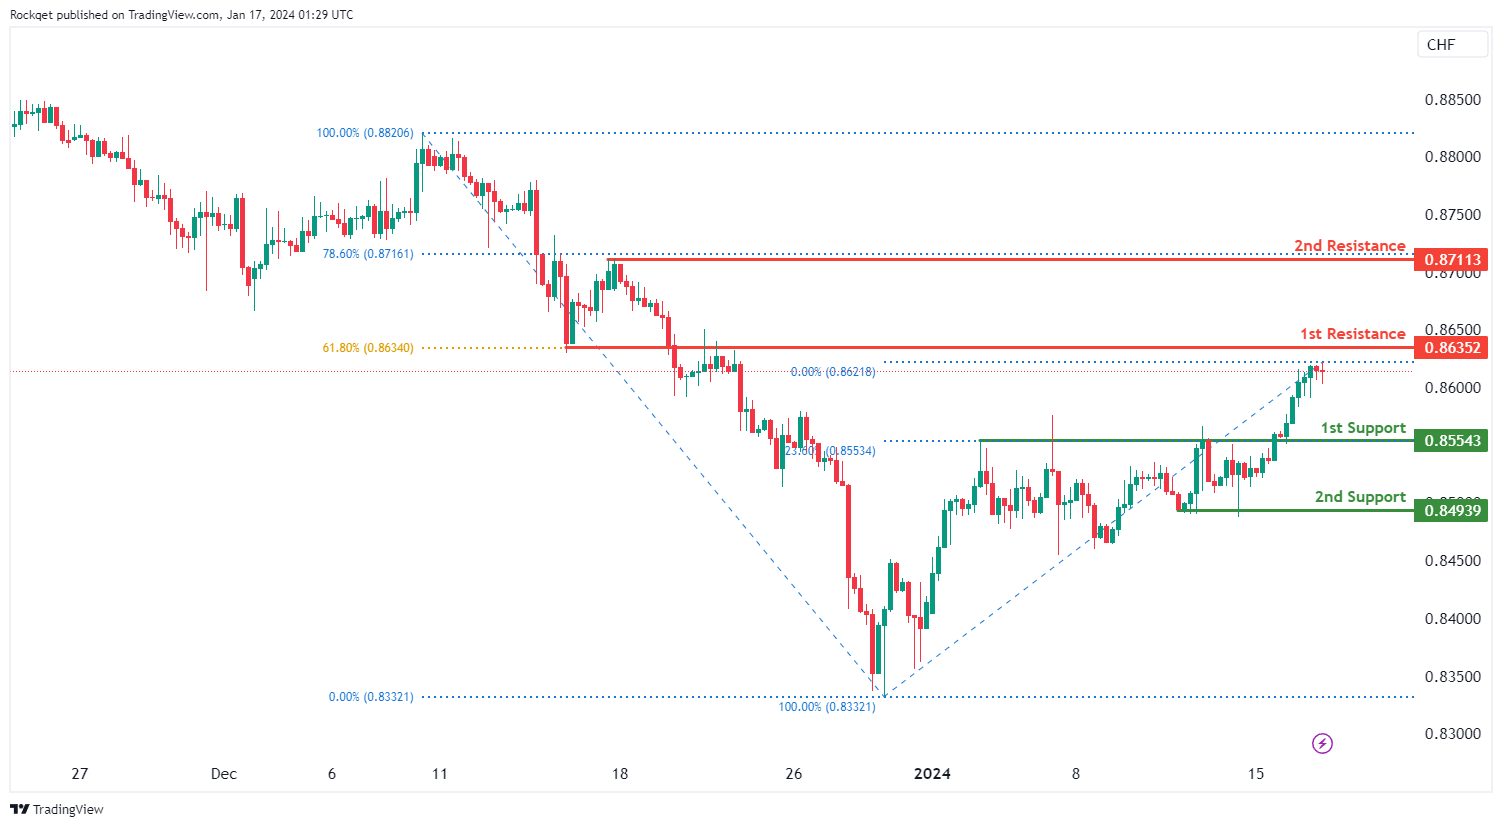
The USD/CHF chart currently exhibits an overall bullish momentum. In this context, there is a potential scenario for price to make a bullish continuation towards the 1st resistance.
The 1st resistance level at 0.8635 is identified as an overlap resistance that aligns with the 61.80% Fibonacci retracement level. Higher up, the 2nd resistance level at 0.8711 is noted as a pullback resistance that aligns with the 78.60% Fibonacci retracement level, further reinforcing its significance as a potential resistance zone.
To the downside, the 1st support level at 0.8554 is identified as a pullback support that aligns with the 23.60% Fibonacci retracement level. Further below, the 2nd support level at 0.8493 is also marked as a pullback support, further reinforcing its importance as a key support level.
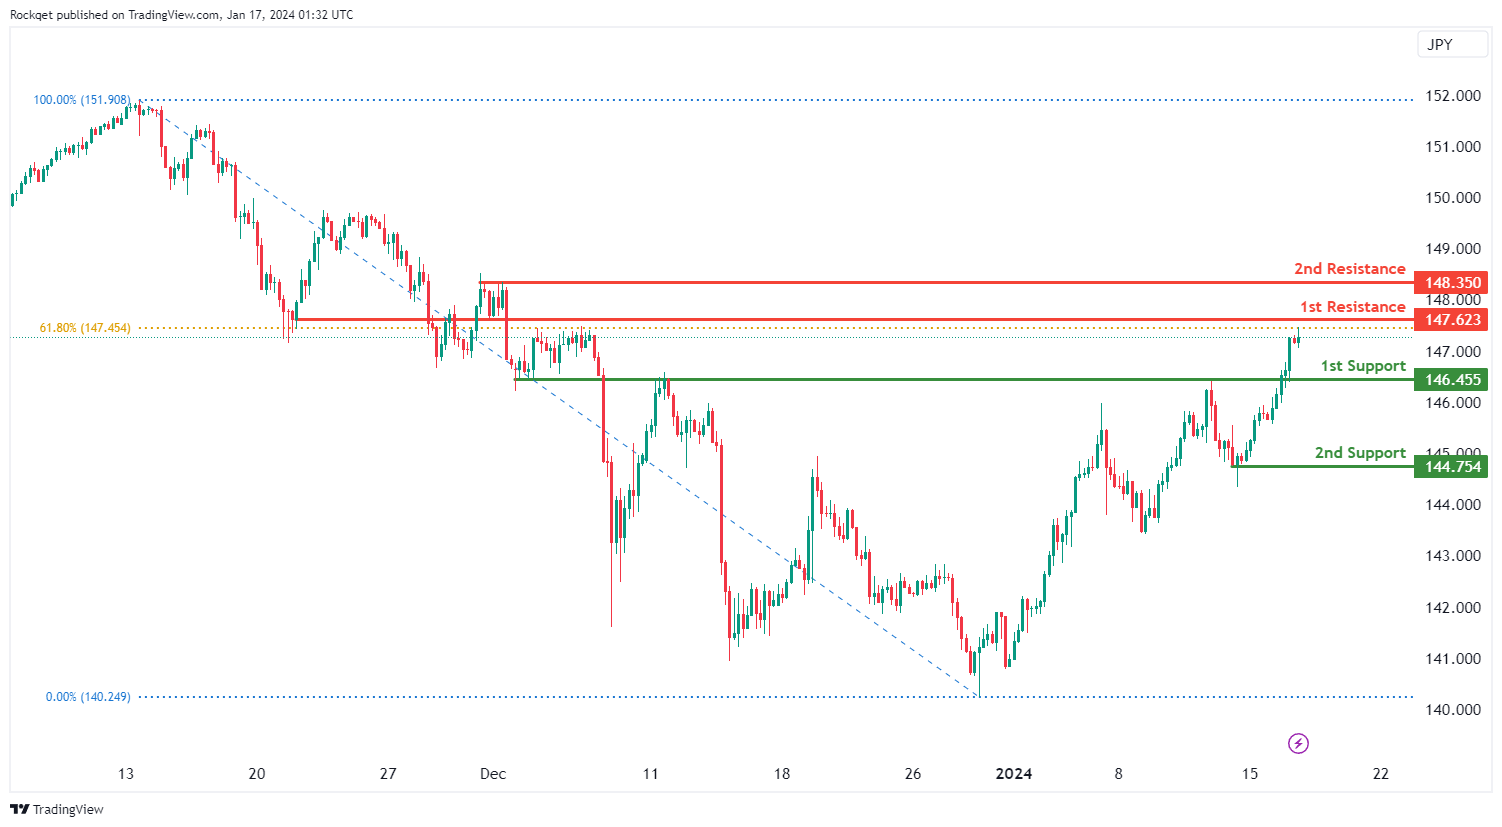
USD/JPY:
The USD/JPY chart currently exhibits an overall bullish momentum. In this context, there is a potential scenario for price to make a bullish continuation towards the 1st resistance.
The 1st resistance level at 147.62 is identified as an overlap resistance that aligns close to the 61.80% Fibonacci retracement level. Higher up, the 2nd resistance level at 148.35 is noted as a pullback resistance, further reinforcing its significance as a potential resistance zone.
To the downside, the 1st support level at 146.45 is identified as an overlap support. Further below, the 2nd support level at 144.75 is marked as a pullback support, further reinforcing its importance as a key support level.
USD/CAD:
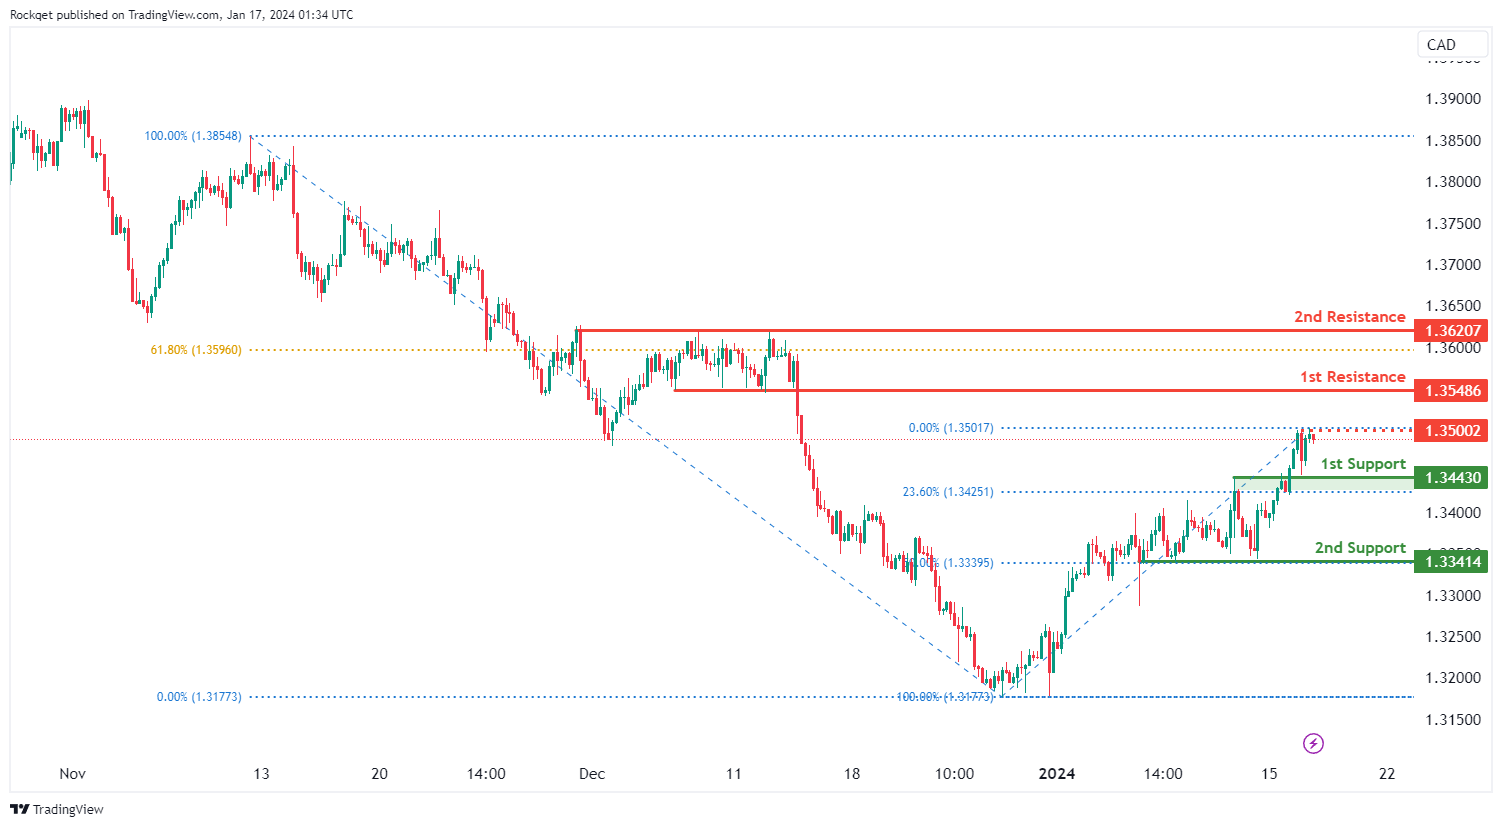
The USD/CAD chart currently exhibits an overall bullish momentum. In this context, there is a potential scenario for price to rise towards the 1st resistance.
The intermediate resistance level at 1.3500 is identified as an overlap resistance while the 1st resistance level at 1.3548 is marked as a pullback resistance. Higher up, the 2nd resistance level at 1.3620 is also noted as a pullback resistance that aligns close to the 61.80% Fibonacci retracement level, further reinforcing its significance as a potential resistance zone.
To the downside, the 1st support level at 1.3443 is identified as an overlap support that aligns close to the 23.60% Fibonacci retracement level. Further below, the 2nd support level at 1.3341 is marked as a pullback support that aligns with the 50.00% Fibonacci retracement level, further reinforcing its importance as a key support level.
AUD/USD:
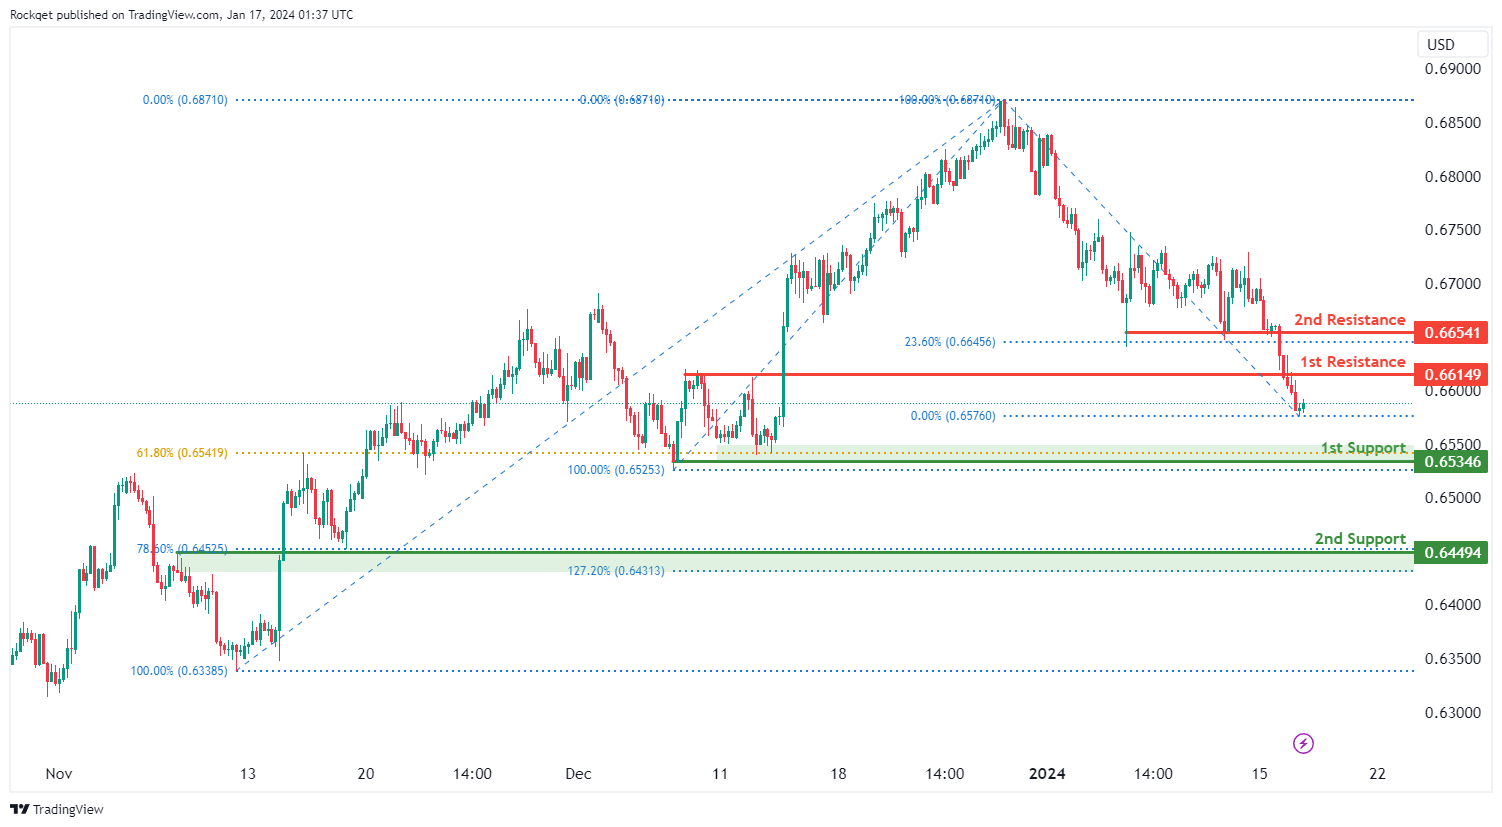
The AUD/USD chart currently exhibits an overall bearish momentum. In this context, there is a potential scenario for price to drop towards the 1st support.
The 1st support level at 0.6534 is identified as a pullback support that aligns with the 61.80% Fibonacci retracement level. Further below, the 2nd support level at 0.6449 is marked as an overlap support that aligns with a confluence of Fibonacci levels i.e. the 78.60% retracement and the 127.20% extension, further reinforcing its importance as a key support level.
To the upside, the 1st resistance level at 0.6614 is identified as a pullback resistance. Higher up, the 2nd resistance level at 0.6654 is also noted as a pullback resistance that aligns close to the 23.60% Fibonacci retracement level, suggesting a potential barrier for further upside movement.
NZD/USD
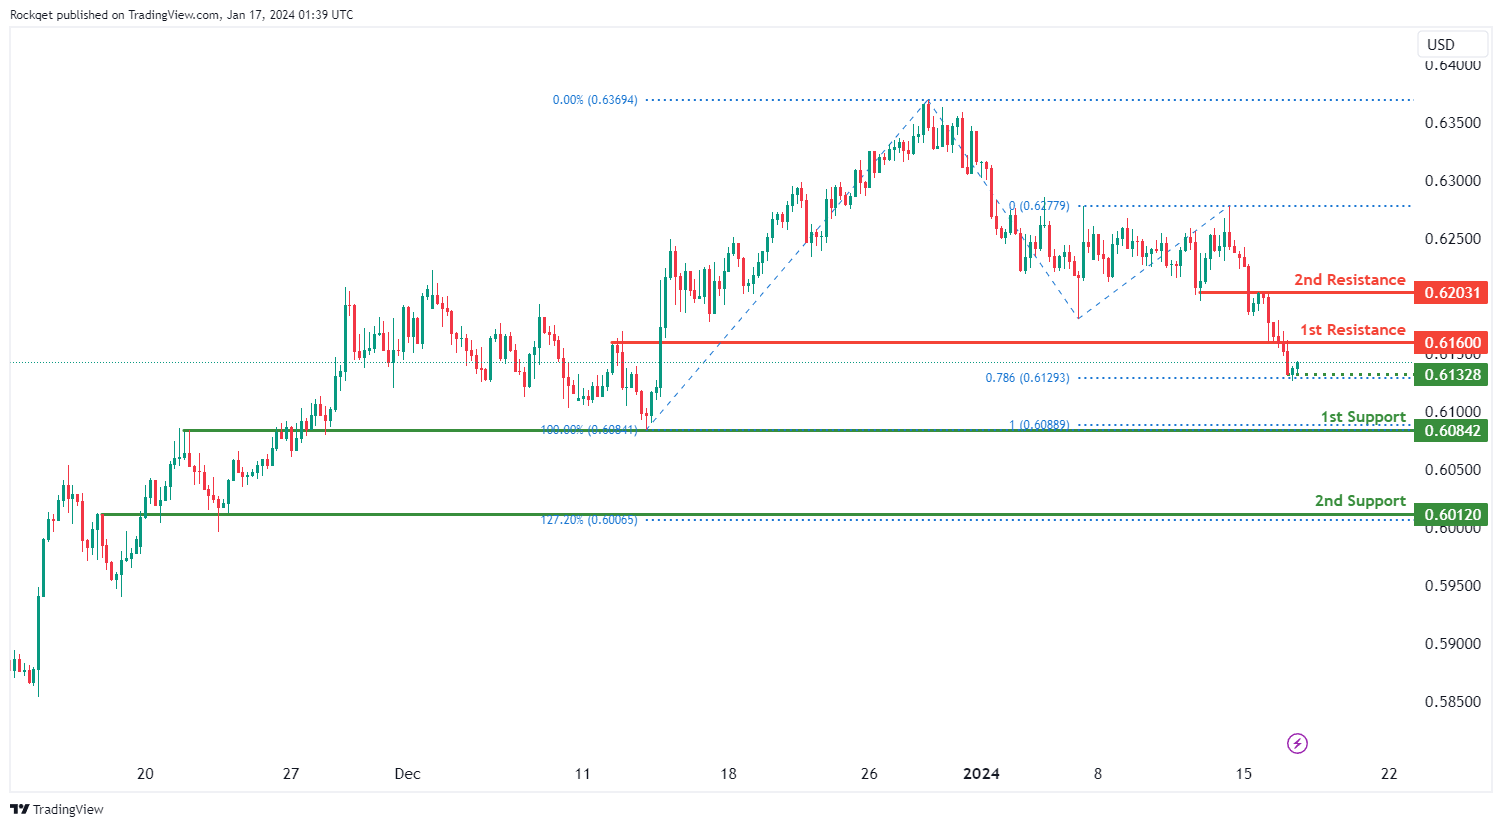
The NZD/USD chart currently exhibits an overall bearish momentum. In this context, there is a potential scenario for price to drop towards the 1st support.
The intermediate support level at 0.6132 is identified as a pullback support that aligns with the 78.60% Fibonacci projection level while the 1st support level at 0.6084 is noted as an overlap support that aligns with the 100.00% Fibonacci projection level. Further below, the 2nd support level at 0.6012 is also marked as an overlap support that aligns with the 127.20% Fibonacci extension level, further reinforcing its importance as a key support level.
To the upside, the 1st resistance level at 0.6160 is identified as a pullback resistance. Higher up, the 2nd resistance level at 0.6203 is noted as an overlap resistance, suggesting a potential barrier for further upside movement.
DJ30:
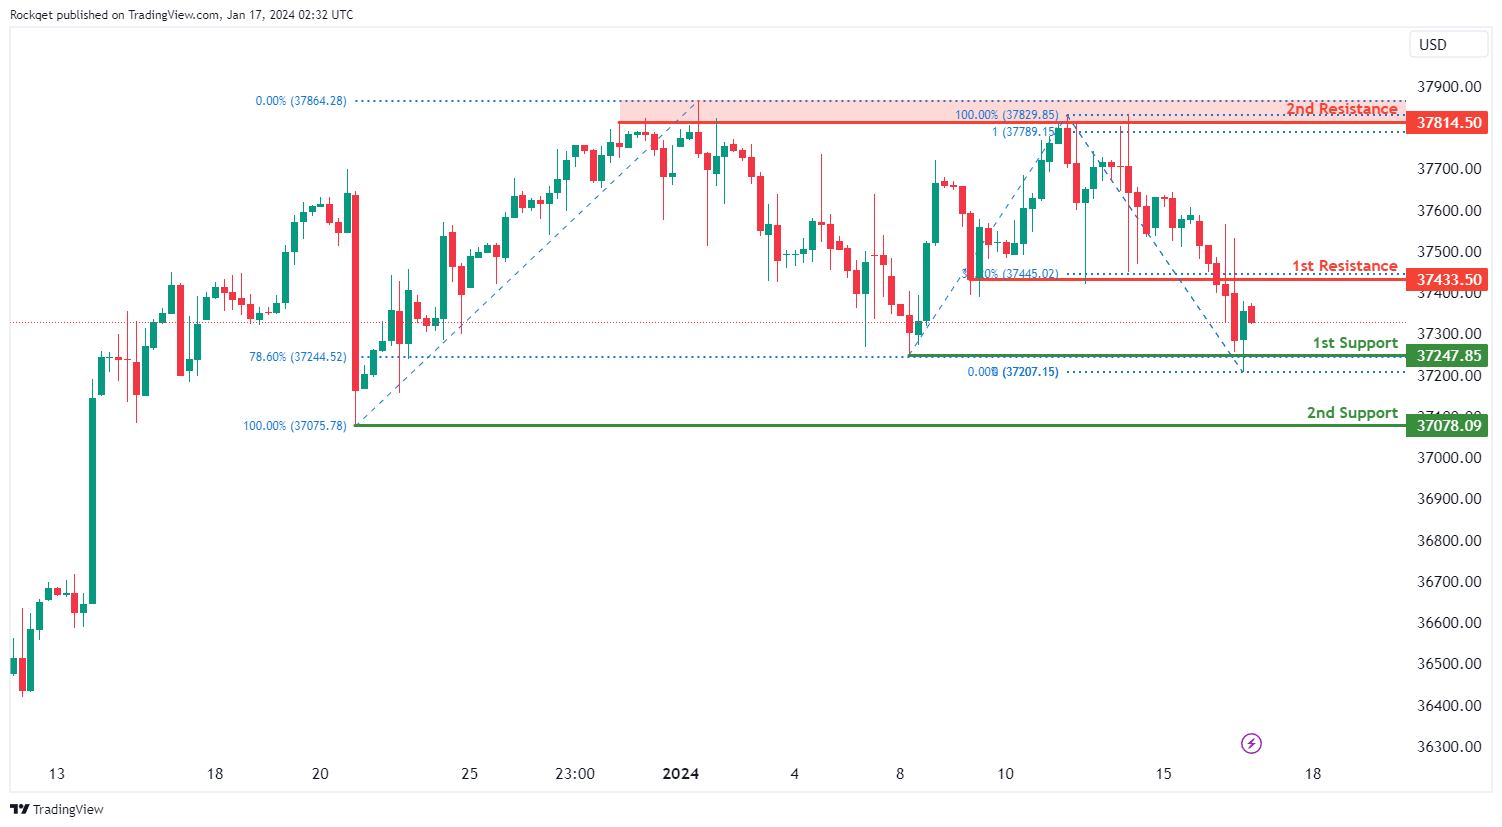
The DJ30 chart currently exhibits a neutral overall momentum, indicating a lack of a clear trend direction. The price could potentially experience fluctuations between the 1st resistance and 1st support levels.
The 1st support at 37247.85 is considered favorable due to its identification as a swing low support, indicating a historical level where buying interest has emerged. Additionally, this level aligns with the 78.60% Fibonacci Retracement, adding confluence to its potential as a support zone. The 2nd support at 37078.09 is recognized as a swing low support, further reinforcing its significance as a potential level of buying interest.
On the resistance side, the 1st resistance at 37433.50 is identified as an overlap resistance, suggesting a historical point where selling interest has been present. The 2nd resistance at 37814.50 is associated with multi-swing high resistance, indicating a zone where selling pressure may intensify.
GER40:
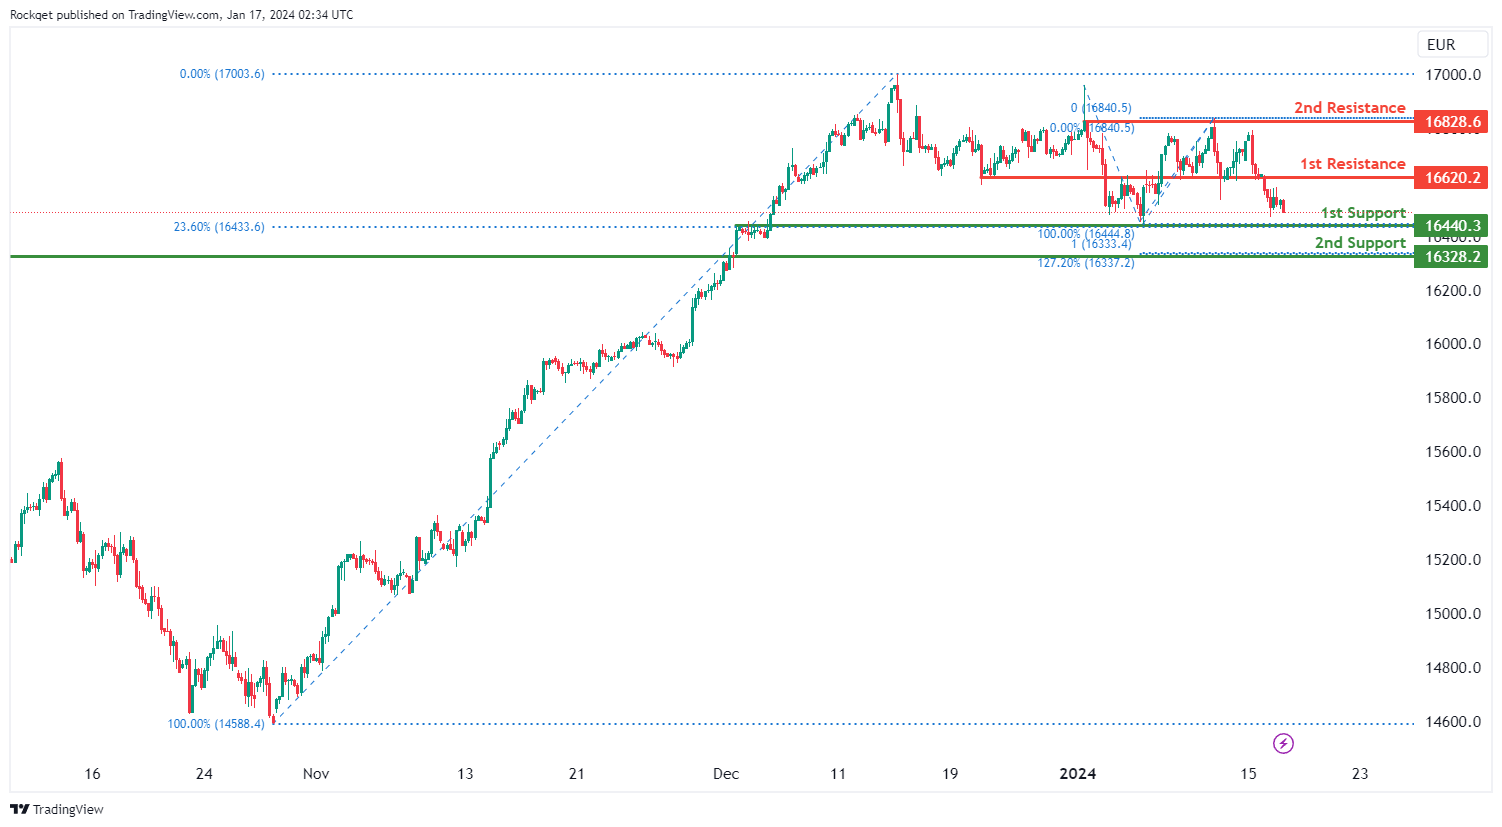
The GER40 chart currently displays a bearish overall momentum, indicating a prevailing downward trend. Several factors contribute to this bearish momentum, suggesting a potential continuation of the downtrend.
The 1st support at 16440.30 is considered favorable due to its identification as an overlap support. This level also coincides with the 23.60% Fibonacci Retracement, indicating historical significance and suggesting a potential level where buying interest has previously emerged. Additionally, the 2nd support at 16328.20 is recognized as a pullback support and aligns with the 127.20% Fibonacci Extension, providing additional strength to this potential support level.
On the resistance side, the 1st resistance at 16620.20 is identified as an overlap resistance, indicating a historical point where selling interest has been present. The 2nd resistance at 16828.60 is associated with swing high resistance, suggesting a zone where selling pressure may intensify.
US500:
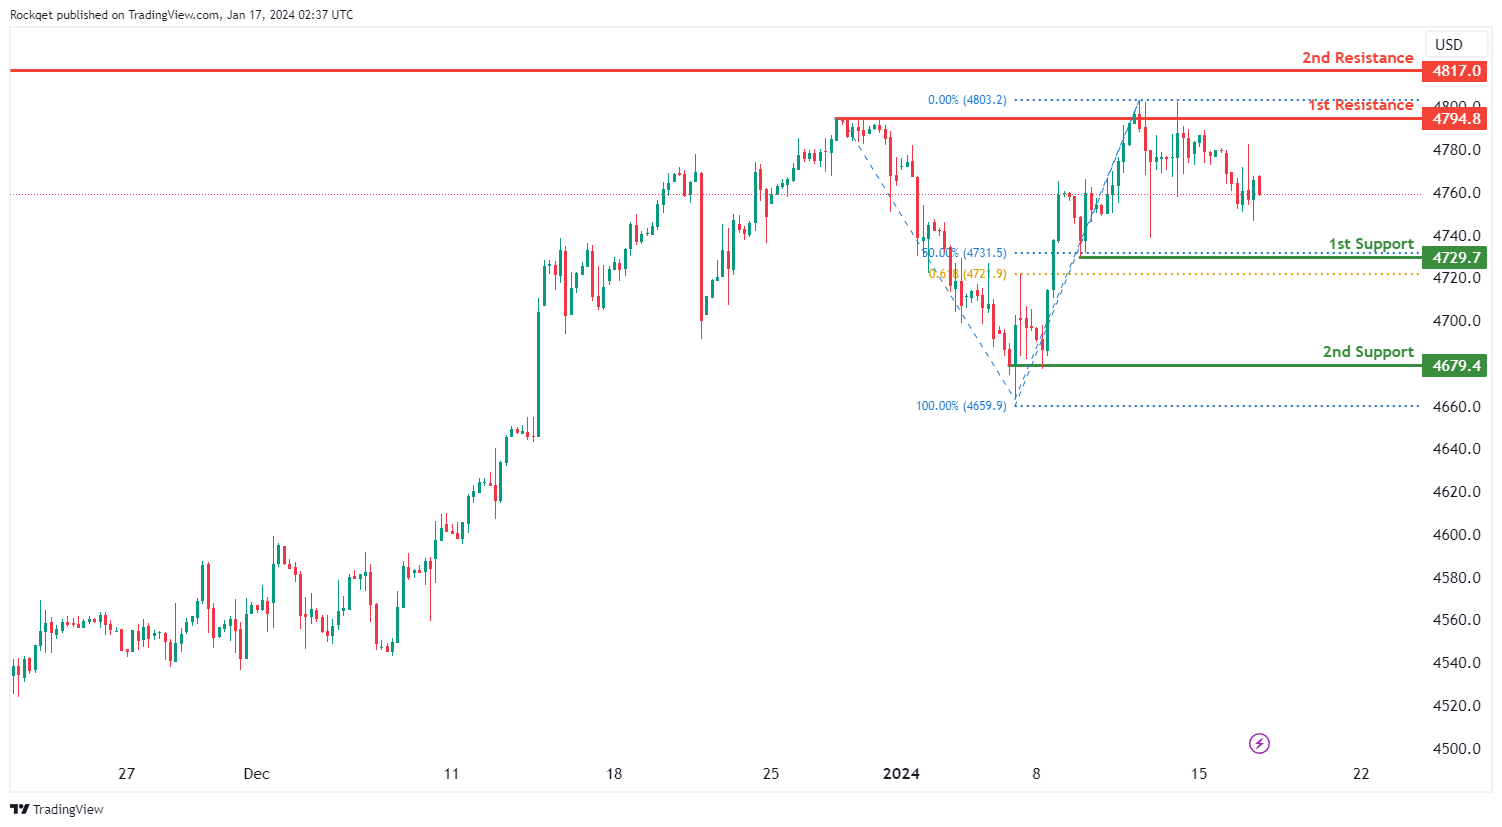
The US500 chart currently reflects a neutral overall momentum, indicating a lack of a clear trend direction. Several factors contribute to this neutral momentum, suggesting potential fluctuations between the 1st resistance and 1st support levels.
The 1st support at 4729.7 is considered favorable due to its identification as a pullback support. This level also coincides with the 61.80% Fibonacci Projection, adding confluence to its potential as a support level. Additionally, the 2nd support at 4679.4 is recognized as a swing low support, providing additional strength to the support zone.
On the resistance side, the 1st resistance at 4794.8 is identified as a multi-swing high resistance, indicating a historical point where selling interest has been present. Furthermore, the intermediate resistance at 4817.0 is associated with swing high resistance, suggesting a zone where selling pressure may intensify.
BTC/USD:
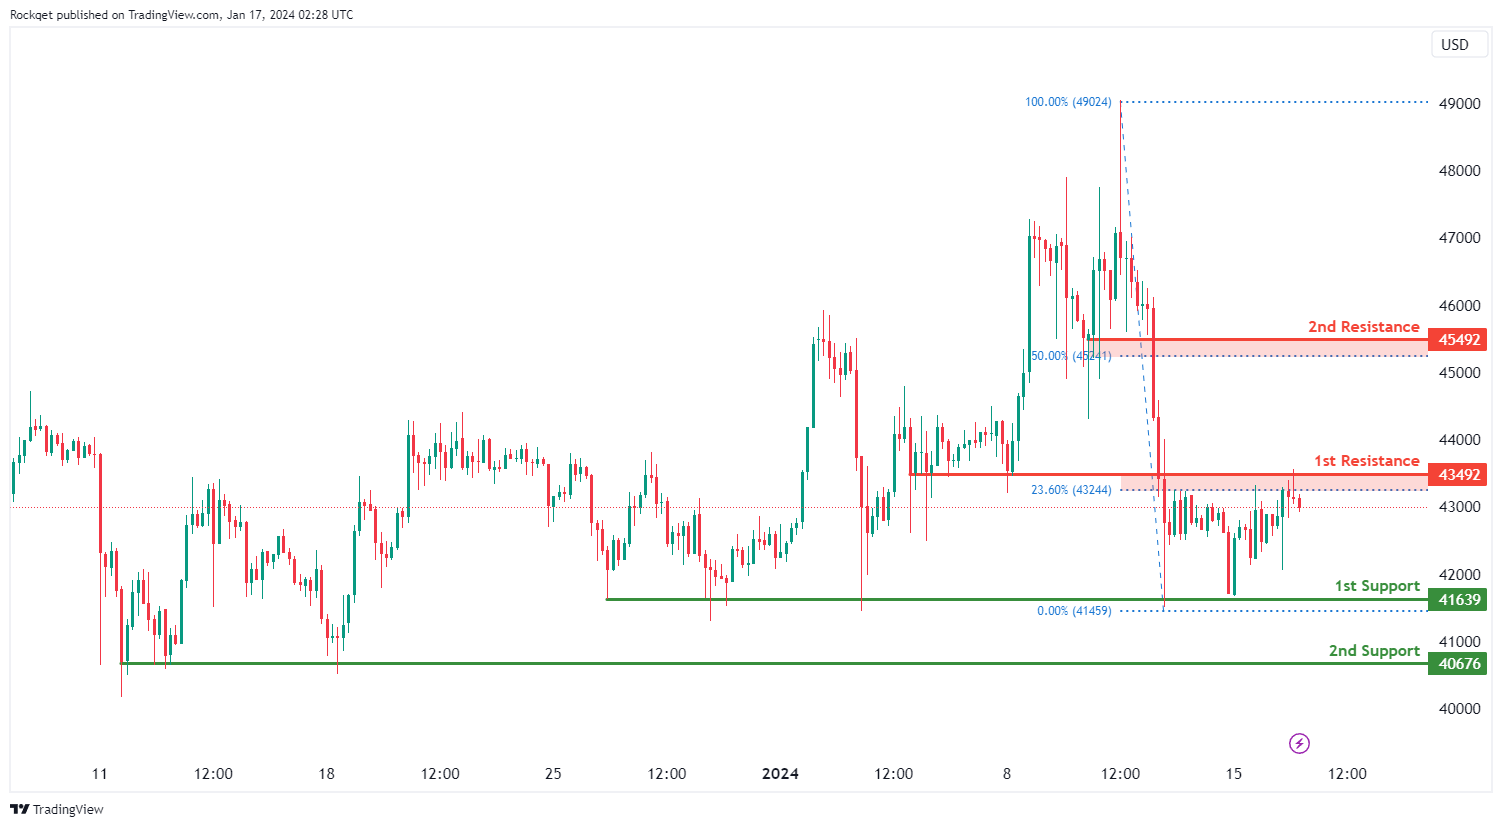
The BTC/USD chart currently displays a bearish overall momentum, indicating a downward trend. There is a potential scenario where the price could experience a bearish reaction off the 1st resistance and drop to the 1st support.
The 1st support at 41639 is considered favorable due to its identification as a multi-swing low support. This level suggests historical significance, serving as a point where buying interest has previously emerged. Additionally, the 2nd support at 40679 is recognized as another multi-swing low support, adding confluence to the potential support zone.
On the resistance side, the 1st resistance at 43492 is identified as an overlap resistance and aligns with the 23.60% Fibonacci Retracement. This confluence of technical factors adds strength to the potential resistance level. Furthermore, the 2nd resistance at 45492 is acknowledged as a pullback resistance and corresponds to the 50% Fibonacci Retracement.'
ETH/USD:
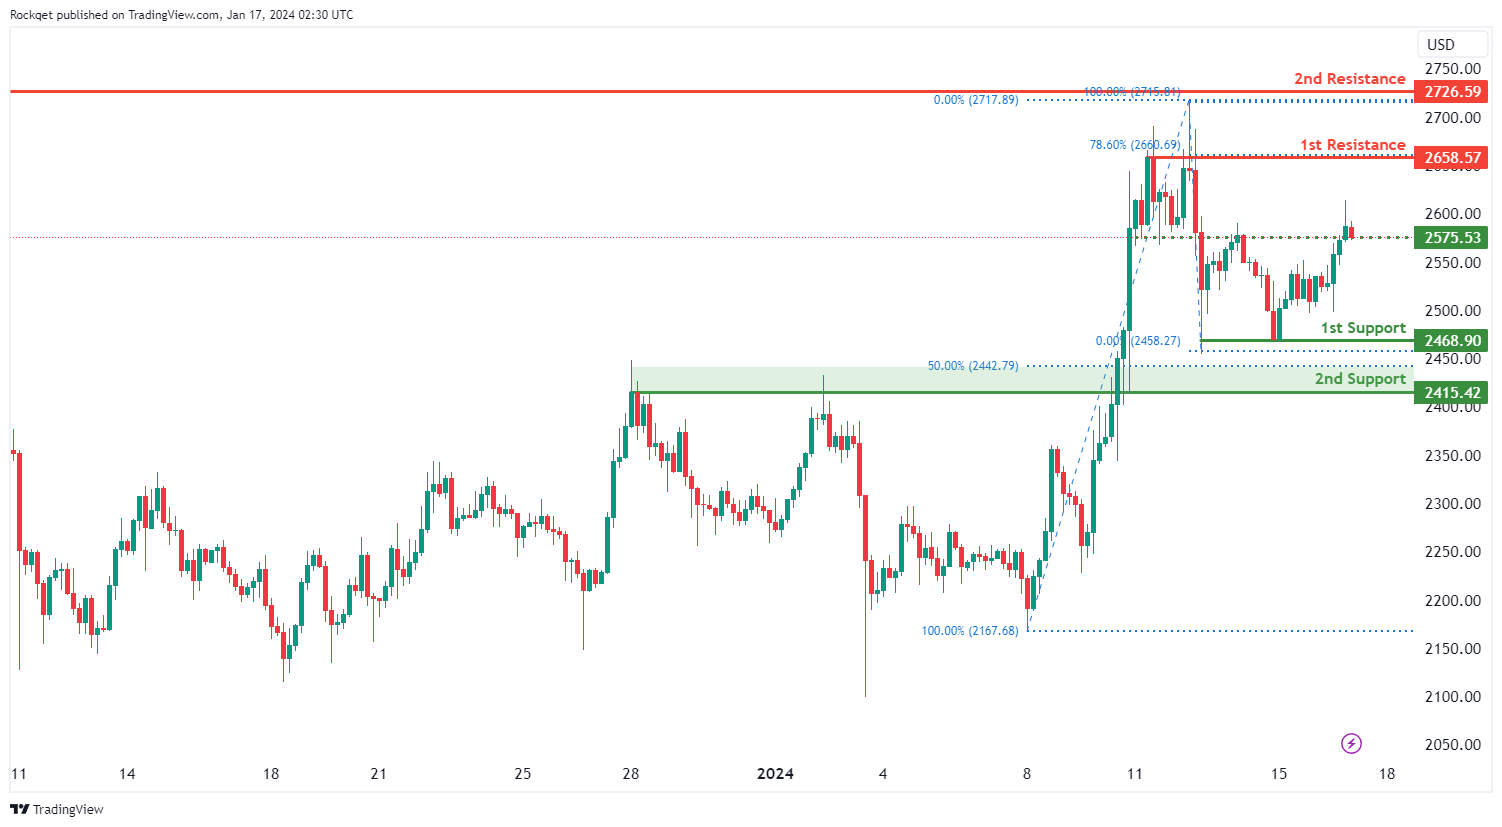
The ETH/USD chart currently exhibits a neutral overall momentum, suggesting a lack of a clear trend direction. There is a potential scenario where the price could make fluctuations between the 1st resistance and 1st support levels.
The 1st support at 2568.90 is considered favorable due to its identification as a pullback support. This level suggests historical significance, acting as a point where buying interest has previously emerged. Additionally, the 2nd support at 2415.42 is recognized as another pullback support, adding confluence to the potential support zone.
On the resistance side, the 1st resistance at 2658.57 is identified as a swing high resistance and aligns with the 78.60% Fibonacci Retracement. This confluence of technical factors adds strength to the potential resistance level. Furthermore, the 2nd resistance at 2726.59 is acknowledged as a swing high resistance.
WTI/USD:
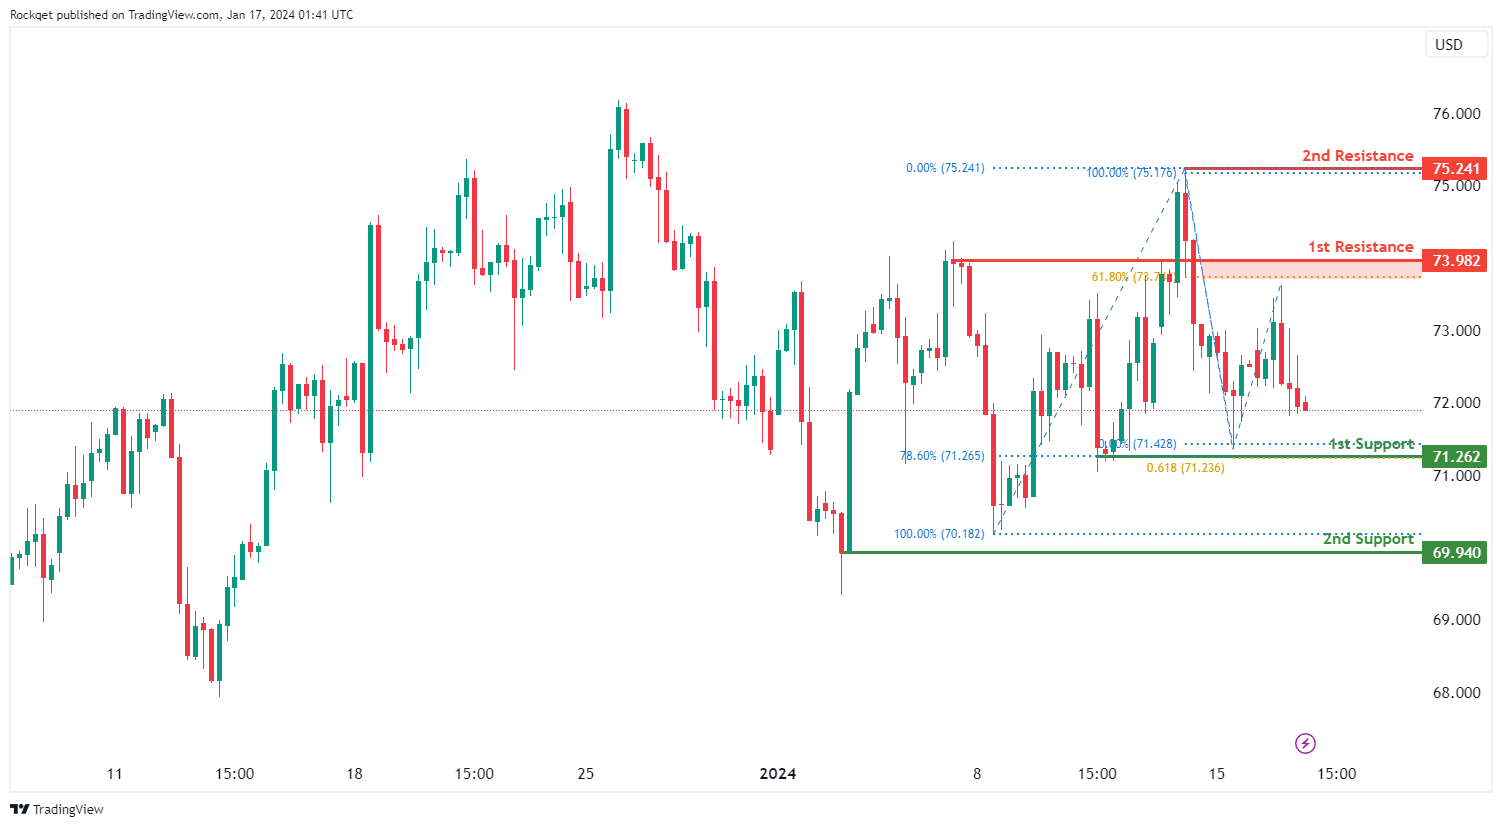
The WTI (West Texas Intermediate) chart currently exhibits a neutral bias, indicating a potential for price to fluctuate between the 1st resistance and the 1st support.
The 1st resistance level at 73.98 is identified as a pullback resistance that aligns close to the 61.80% Fibonacci retracement level. Higher up, the 2nd resistance level at 75.24 is noted as a swing-high resistance, suggesting a potential barrier for further upside movement.
To the downside, the 1st support level at 71.26 is identified as a pullback support that aligns with a confluence of Fibonacci levels i.e. the 78.60% retracement and the 61.80% projection. Further below, the 2nd support level at 69.94 is marked as a swing-low support, further reinforcing its importance as a key support level.
XAU/USD (GOLD):
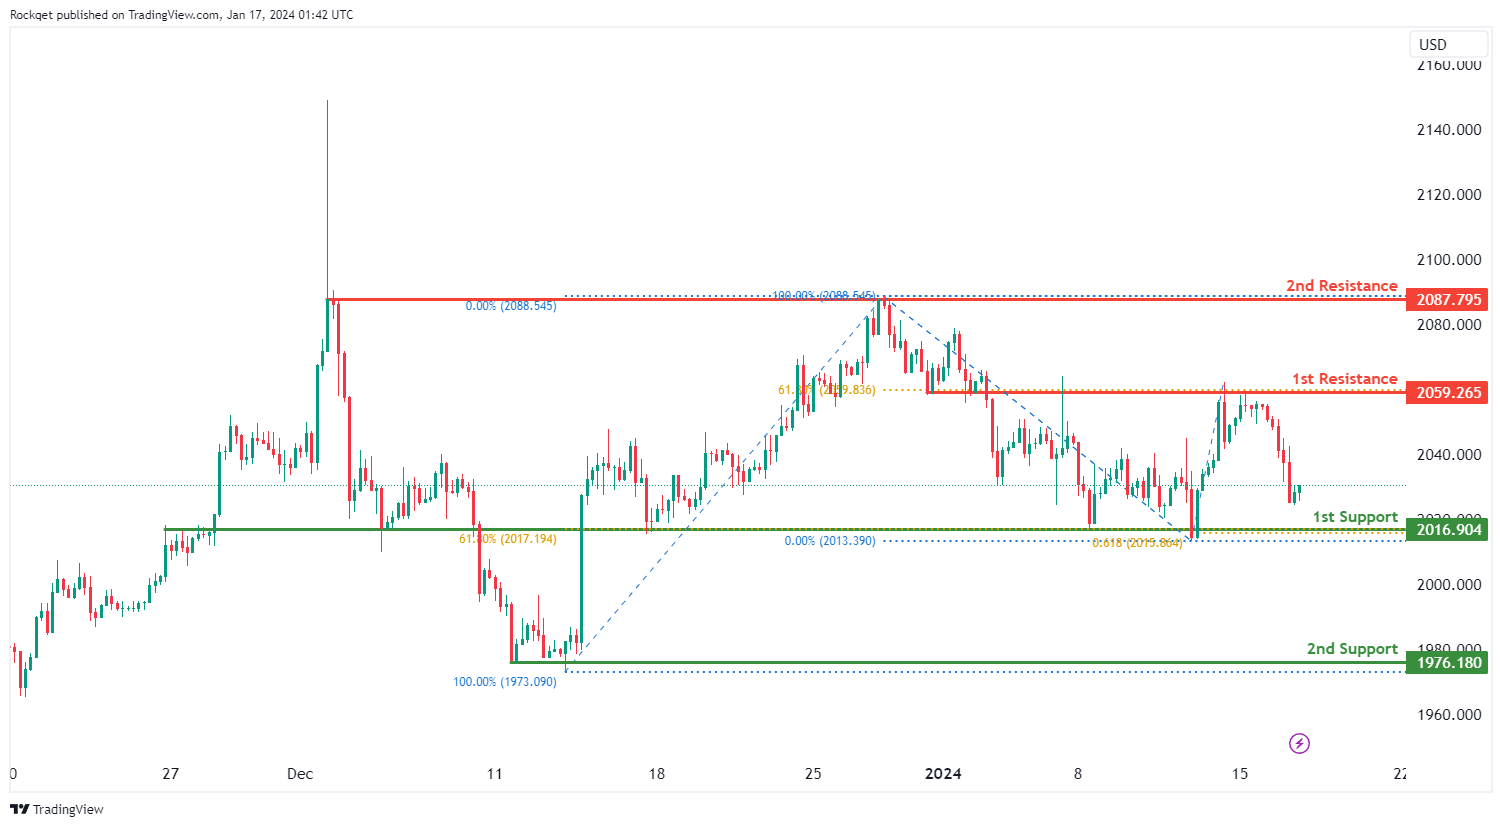
The XAU/USD (Gold/US Dollar) chart currently shows an overall bearish momentum. In this context, there is a potential scenario for price to make a bearish continuation towards the 1st support.
The 1st support level at 2,016.90 is marked as an overlap support that aligns with a confluence of Fibonacci levels i.e. the 61.80% retracement and the 61.80% projection. Further below, the 2nd support level at 1,976.18 is categorized as a swing-low support, further reinforcing its significance as a potential support zone.
On the resistance side, the 1st resistance level at 2,059.26 is identified as an overlap resistance that aligns with the 61.80% Fibonacci retracement level. Higher up, the 2nd resistance level at 2,087.79 is marked as a multi-swing-high resistance, indicating a significant potential resistance point.
AUD/USD Daily Report
Daily Pivots: (S1) 0.6552; (P) 0.6608; (R1) 0.6641; More...
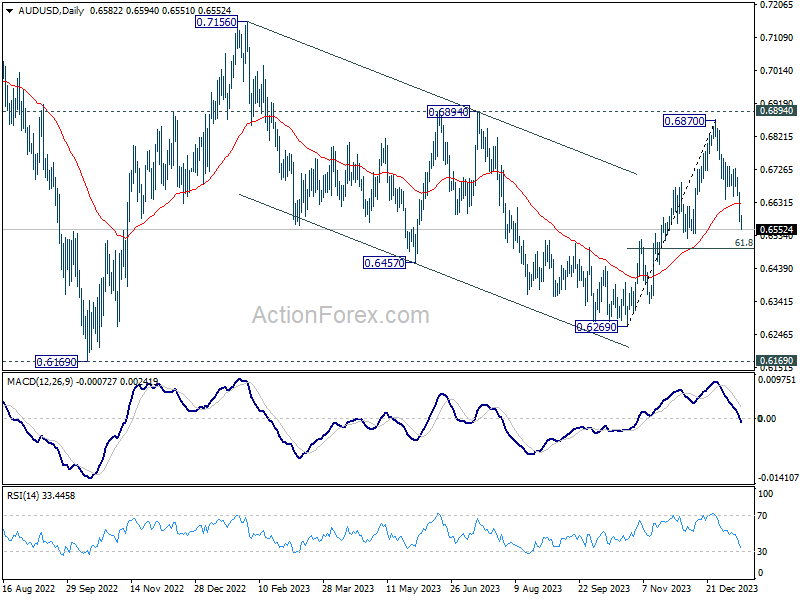
AUD/USD's fall from 0.6870 continues today and intraday bias stays on the downside. Deeper fall would be seen to 61.8% retracement of 0.6269 to 0.6870 at 0.6497. Sustained break there will argue that whole rebound from 0.6269 has completed, and bring deeper fall to this support. On the upside, above 0.6632 minor resistance will turn intraday bias neutral first.
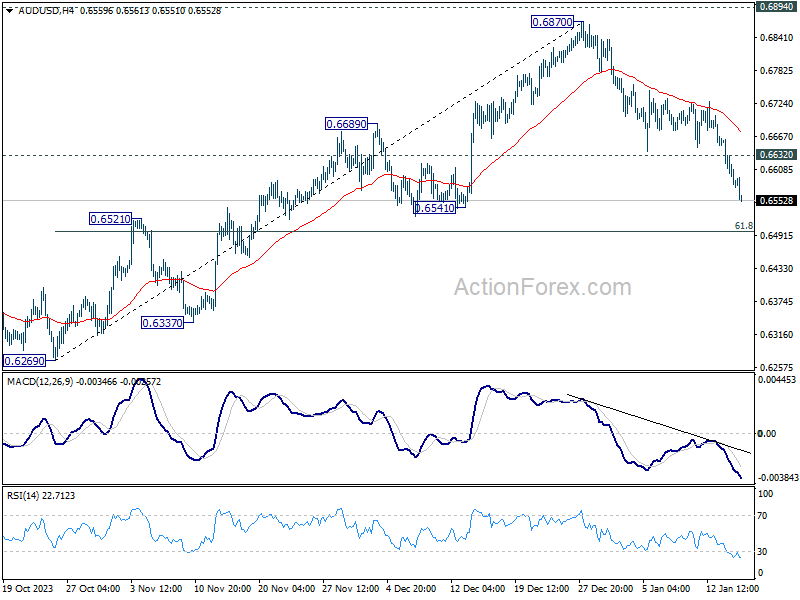
In the bigger picture, price actions from 0.6169 (2022 low) are seen as a medium term corrective pattern to the down trend from 0.8006 (2021 high). Sideway trading could continue in range of 0.6169/7156 for some more time. But as long as 0.7156 holds, an eventual downside breakout would be mildly in favor.
Market Trepidation Over Chinese Data, Dollar Marches On
Prevailing mood of risk aversion was evident in Asian session today. Hong Kong stocks led the region lower, reflecting investors' dissatisfaction with the latest batch of Chinese economic data. While China's Q4 GDP growth wasn't far off from analysts' expectations, it still fell short for some, contributing to the market's cautious stance. Additionally, concerns were heightened by the weak retail sales growth and China's continuing population shrinkage, underscoring deeper economic challenges. Japan's Nikkei index stood out as the only exception, remaining relatively stable.
In the currency markets, Dollar is standing out as the best performer for the week so far. The prevailing risk-off sentiment is providing sustained boost to the greenback. Concurrently, reports have surfaced, mentioning an "extreme scenario" where no major central bank might cut interest rates this year. This perspective, highlighted by a Bank of America FX strategist, brings into question the potential scenario where central banks remain on hold due to persistent inflation and ongoing robust economic growth. That's a stark contrast to current market pricing that suggests six Fed cuts this year, which is also "unrealistic" at the other end.
Australian and New Zealand Dollars are facing considerable pressure, primarily due to their economic linkages with China. Japanese Yen, too, is among the weaker currencies at the moment. On the flip side, Canadian Dollar and Euro are showing some resilience, with Canadian Dollar being the second strongest. Sterling and Swiss Franc are showing mixed performances, with the Pound particularly focused on the upcoming UK CPI data, which could provide further direction.
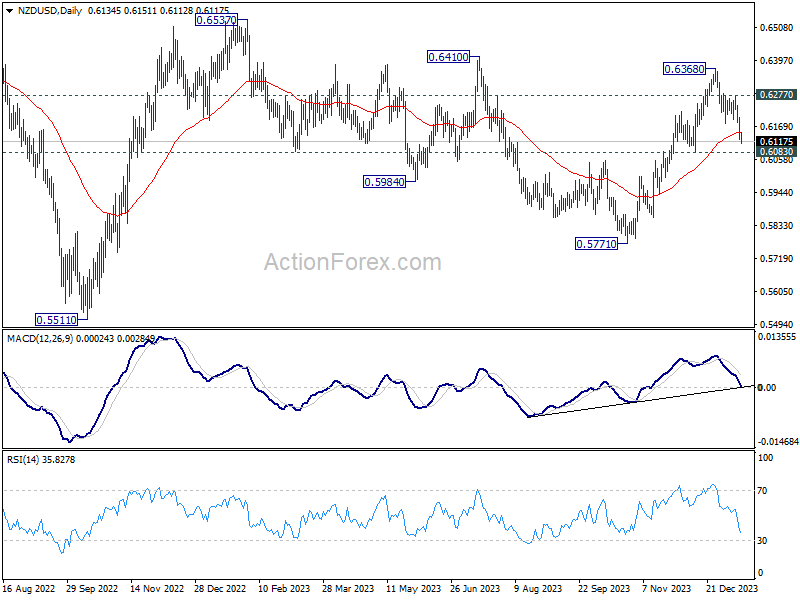
Technically, focus is now on 0.6083 support after this week's decline in NZD/USD. Firm break there will argue that rebound from 0.5771 has completed at 0.6368 already. More importantly that would argue that whole corrective pattern from 0.6537 is still in progress. Deeper fall would be seen towards 0.5771 support. On other hand, stronger rebound from 0.6083, followed by break of 0.6277 resistance, will retain near term bullishness for a test on 0.6537 high next.
In Asia, Nikkei closed down -0.22%. Hong Kong HSI is down -3.31%. China Shanghai SSE is down -0.98%. Singapore Strait Times is down -1.06%. Japan 10-year JGB yield is up 0.0123 at 0.610. Overnight, DOW fell -0.62%. S&P 500 fell -0.37%. NASDAQ fell -0.19%. 10-year yield rose 0.0116 to 4.066.
Fed's Waller anticipates rate cuts this year, stresses upcoming CPI revisions
Fed Governor Christopher Waller expressed growing confidence bring inflation down to target. He noted in a speech overnight that Fed is "within striking distance of achieving a sustainable level of 2 percent PCE inflation". However, he also emphasized the need for more data in the coming months to confirm or challenge the notion that inflation is moving sustainably toward Fed's goal.
Waller also mentioned that he perceives the risks to employment and inflation mandates as "more closely balanced" now. His focus is on watching for sustained progress on inflation and a modest cooling in the labor market.
Regarding interest rate cuts, Waller expressed that "as long as inflation doesn't rebound and stay elevated", he believes Fed will be able to lower the target range for the federal funds rate "this year". But he also clarified, "Clearly, the timing of cuts and the actual number of cuts in 2024 will depend on the incoming data."
Waller also highlighted the importance of the upcoming revisions to CPI inflation scheduled for next month. He recalled that last year's annual update to the seasonal factors reversed what initially appeared to be a decline in inflation. The January CPI report and revisions for 2023, due in mid-February, are anticipated to potentially alter the current understanding of inflation. Waller expressed hope that these revisions would confirm the progress observed so far but emphasized that good policy must be based on data rather than hope.
ECB's Simkus and Müller urge caution over aggressive rate cut expectations
ECB Governing Council Gediminas Simkus expressed a conditional optimism about rate reductions within the year, stating, "If we don't see any surprises that would change the data and the thinking, I'm positive about rate cuts this year."
However, Simkus tempered his outlook with a dose of realism regarding the timing of these cuts. He clarified, "I'm far less optimistic than markets about rate cuts in March or April."
Separately, another Governing Council member Madis Müller commented on the aggressiveness of market expectations for ECB rate cuts in 2024. He observed that these expectations do not align with the current data available to the central bank.
Müller further emphasized that wage growth in Eurozone remains out of sync with the ECB's current inflation targets. He noted that ECB cannot proceed with cutting rates until data reflects the desired price growth conditions.
China's 2023 economic growth at 5.2%, population shrinks for second year
China's GDP grew 5.2% yoy in Q4, an uptick from Q3's 4.9% yoy. For the full year of 2023, the economy also recorded a growth rate of 5.2%. On a quarter-by-quarter basis, GDP growth rate was 1.0% qoq, matched expectation, though this marked a slowdown from the previous quarter's revised 1.5% qoq gain.
In the industrial sector, production rose by 6.8% yoy in December, slightly higher than the previous month's 6.6%, meeting market forecasts. However, retail sales growth decelerated to 7.4% yoy, a drop from November's 10.1% yoy and below the expected 8.1% yoy.
Investment patterns showed a mixed trend. Overall fixed asset investment in 2023 grew by 3.0%, slightly exceeding the 2.9% expectation. Within this category, real estate investment saw a significant drop of -9.6%. Conversely, investment in infrastructure and manufacturing rose by 5.9% and 6.5%, respectively, signaling growth in these areas.
Amidst these economic developments, China faces a demographic challenge as its population fell for the second consecutive year in 2023. Total population decreased by -2.75m to 1.409B, a more rapid decline than in 2022.
Looking ahead
UK CPI data is the main focus in European session while Eurozone will publish CPI final too. Later in the day, US retail sales will catch most attention. US import price, industrial production, business inventories and NAHB housing index will also be released. Fed will release Beige Book economic report too.
AUD/USD Daily Report
Daily Pivots: (S1) 0.6552; (P) 0.6608; (R1) 0.6641; More...
AUD/USD's fall from 0.6870 continues today and intraday bias stays on the downside. Deeper fall would be seen to 61.8% retracement of 0.6269 to 0.6870 at 0.6497. Sustained break there will argue that whole rebound from 0.6269 has completed, and bring deeper fall to this support. On the upside, above 0.6632 minor resistance will turn intraday bias neutral first.
In the bigger picture, price actions from 0.6169 (2022 low) are seen as a medium term corrective pattern to the down trend from 0.8006 (2021 high). Sideway trading could continue in range of 0.6169/7156 for some more time. But as long as 0.7156 holds, an eventual downside breakout would be mildly in favor.
Economic Indicators Update
| GMT | Ccy | Events | Actual | Forecast | Previous | Revised |
|---|---|---|---|---|---|---|
| 02:00 | CNY | GDP Y/Y Q4 | 5.20% | 5.20% | 4.90% | |
| 02:00 | CNY | Industrial Production Y/Y Dec | 6.80% | 6.80% | 6.60% | |
| 02:00 | CNY | Retail Sales Y/Y Dec | 7.40% | 8.10% | 10.10% | |
| 02:00 | CNY | Fixed Asset Investment YTD Y/Y Dec | 3.00% | 2.90% | 2.90% | |
| 07:00 | GBP | CPI M/M Dec | 0.20% | -0.20% | ||
| 07:00 | GBP | CPI Y/Y Dec | 3.80% | 3.90% | ||
| 07:00 | GBP | Core CPI Y/Y Dec | 4.90% | 5.10% | ||
| 07:00 | GBP | RPI M/M Dec | 0.40% | -0.10% | ||
| 07:00 | GBP | RPI Y/Y Dec | 0.40% | 5.30% | ||
| 07:00 | GBP | PPI Input M/M Dec | -0.70% | -0.30% | ||
| 07:00 | GBP | PPI Input Y/Y Dec | -1.90% | -2.60% | ||
| 07:00 | GBP | PPI Output M/M Dec | -0.20% | -0.10% | ||
| 07:00 | GBP | PPI Output Y/Y Dec | 0.40% | -0.20% | ||
| 07:00 | GBP | PPI Core Output M/M Dec | 0.00% | |||
| 07:00 | GBP | PPI Core Output Y/Y Dec | 0.20% | |||
| 10:00 | EUR | Eurozone CPI Y/Y Dec F | 2.90% | 2.90% | ||
| 10:00 | EUR | Eurozone CPI Core Y/Y Dec F | 3.40% | 3.40% | ||
| 13:30 | CAD | Industrial Product Price M/M Dec | -0.70% | -0.40% | ||
| 13:30 | CAD | Raw Material Price Index Dec | -2.10% | -4.20% | ||
| 13:30 | USD | Retail Sales M/M Dec | 0.40% | 0.30% | ||
| 13:30 | USD | Retail Sales ex Autos M/M Dec | 0.20% | 0.20% | ||
| 13:30 | USD | Import Price Index M/M Dec | -0.50% | -0.40% | ||
| 14:15 | USD | Industrial Production M/M Dec | -0.10% | 0.20% | ||
| 14:15 | USD | Capacity Utilization Dec | 78.70% | 78.80% | ||
| 15:00 | USD | Business Inventories Nov | -0.10% | -0.10% | ||
| 15:00 | USD | NAHB Housing Index Jan | 39 | 37 | ||
| 19:00 | USD | Fed's Beige Book |
China’s 2023 economic growth at 5.2%, population shrinks for second year
China's GDP grew 5.2% yoy in Q4, an uptick from Q3's 4.9% yoy. For the full year of 2023, the economy also recorded a growth rate of 5.2%. On a quarter-by-quarter basis, GDP growth rate was 1.0% qoq, matched expectation, though this marked a slowdown from the previous quarter's revised 1.5% qoq gain.
In the industrial sector, production rose by 6.8% yoy in December, slightly higher than the previous month's 6.6%, meeting market forecasts. However, retail sales growth decelerated to 7.4% yoy, a drop from November's 10.1% yoy and below the expected 8.1% yoy.
Investment patterns showed a mixed trend. Overall fixed asset investment in 2023 grew by 3.0%, slightly exceeding the 2.9% expectation. Within this category, real estate investment saw a significant drop of -9.6%. Conversely, investment in infrastructure and manufacturing rose by 5.9% and 6.5%, respectively, signaling growth in these areas.
Amidst these economic developments, China faces a demographic challenge as its population fell for the second consecutive year in 2023. Total population decreased by -2.75m to 1.409B, a more rapid decline than in 2022.
ECB’s Simkus and Müller urge caution over aggressive rate cut expectations
ECB Governing Council Gediminas Simkus expressed a conditional optimism about rate reductions within the year, stating, "If we don't see any surprises that would change the data and the thinking, I'm positive about rate cuts this year."
However, Simkus tempered his outlook with a dose of realism regarding the timing of these cuts. He clarified, "I'm far less optimistic than markets about rate cuts in March or April."
Separately, another Governing Council member Madis Müller commented on the aggressiveness of market expectations for ECB rate cuts in 2024. He observed that these expectations do not align with the current data available to the central bank.
Müller further emphasized that wage growth in Eurozone remains out of sync with the ECB's current inflation targets. He noted that ECB cannot proceed with cutting rates until data reflects the desired price growth conditions.
Fed’s Waller anticipates rate cuts this year, stresses upcoming CPI revisions
Fed Governor Christopher Waller expressed growing confidence bring inflation down to target. He noted in a speech overnight that Fed is "within striking distance of achieving a sustainable level of 2 percent PCE inflation". However, he also emphasized the need for more data in the coming months to confirm or challenge the notion that inflation is moving sustainably toward Fed's goal.
Waller also mentioned that he perceives the risks to employment and inflation mandates as "more closely balanced" now. His focus is on watching for sustained progress on inflation and a modest cooling in the labor market.
Regarding interest rate cuts, Waller expressed that "as long as inflation doesn't rebound and stay elevated", he believes Fed will be able to lower the target range for the federal funds rate "this year". But he also clarified, "Clearly, the timing of cuts and the actual number of cuts in 2024 will depend on the incoming data."
Waller also highlighted the importance of the upcoming revisions to CPI inflation scheduled for next month. He recalled that last year's annual update to the seasonal factors reversed what initially appeared to be a decline in inflation. The January CPI report and revisions for 2023, due in mid-February, are anticipated to potentially alter the current understanding of inflation. Waller expressed hope that these revisions would confirm the progress observed so far but emphasized that good policy must be based on data rather than hope.
GBP: My Expectations From CPI
In November, average pay growth in the UK slowed to 6.5%, down from 7.2% in the previous month, according to the Office for National Statistics. This decline suggests that inflationary pressures have weakened more than anticipated. The decrease in pay growth came as the UK jobs market weakened due to high interest rates and stagnation across much of the economy. Job vacancies also fell at the fastest rate on record in December, indicating a further cooling of the UK labour market. The drop in wages growth, however, was accompanied by falls in inflation, meaning real wages grew for the fifth consecutive month, easing pressure on household incomes. Despite the decline in pay growth, the overall jobs market remained stable, with employment only marginally down and the unemployment rate unchanged at 4.2%.
GBPCAD - D1 Timeframe
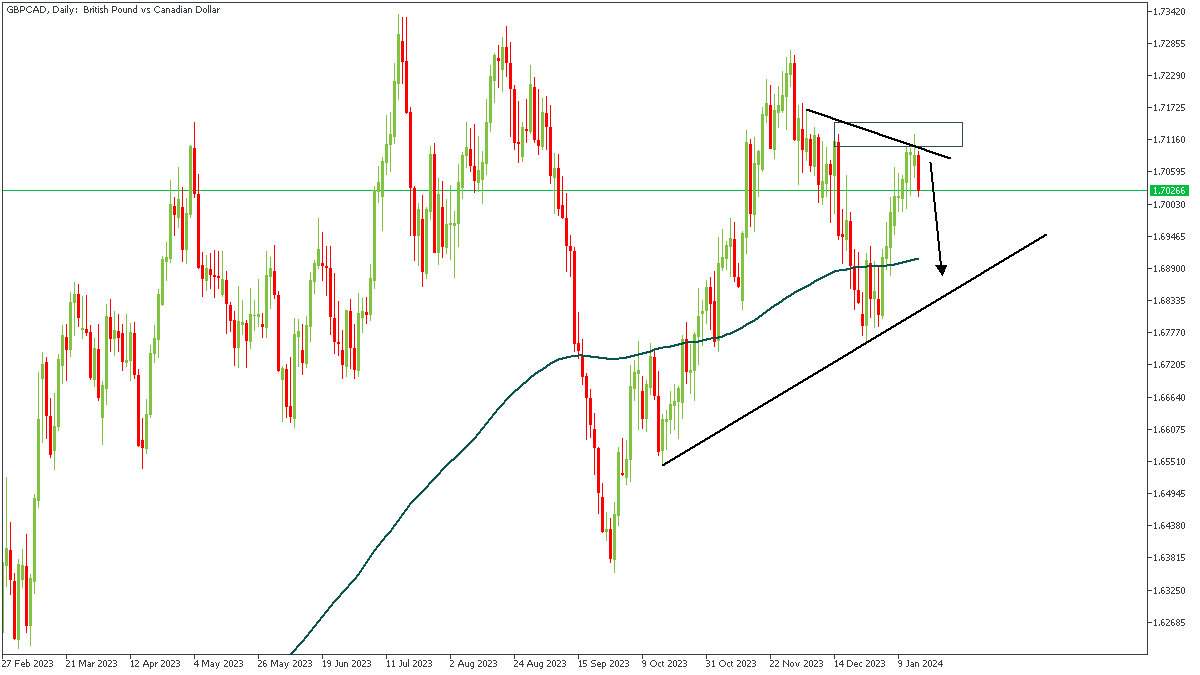
The Daily timeframe of GBPCAD shows price currently being rejected from the trendline resistance, and the supply zone. As a result, I expect to see the price action slide towards the moving average for support. In the meantime, I will be waiting for an entry from the lower timeframes before taking a shot at it.
Analyst’s Expectations:
- Direction: Bearish
- Target: 1.69092
- Invalidation: 1.70940
GBPNZD - H4 Timeframe
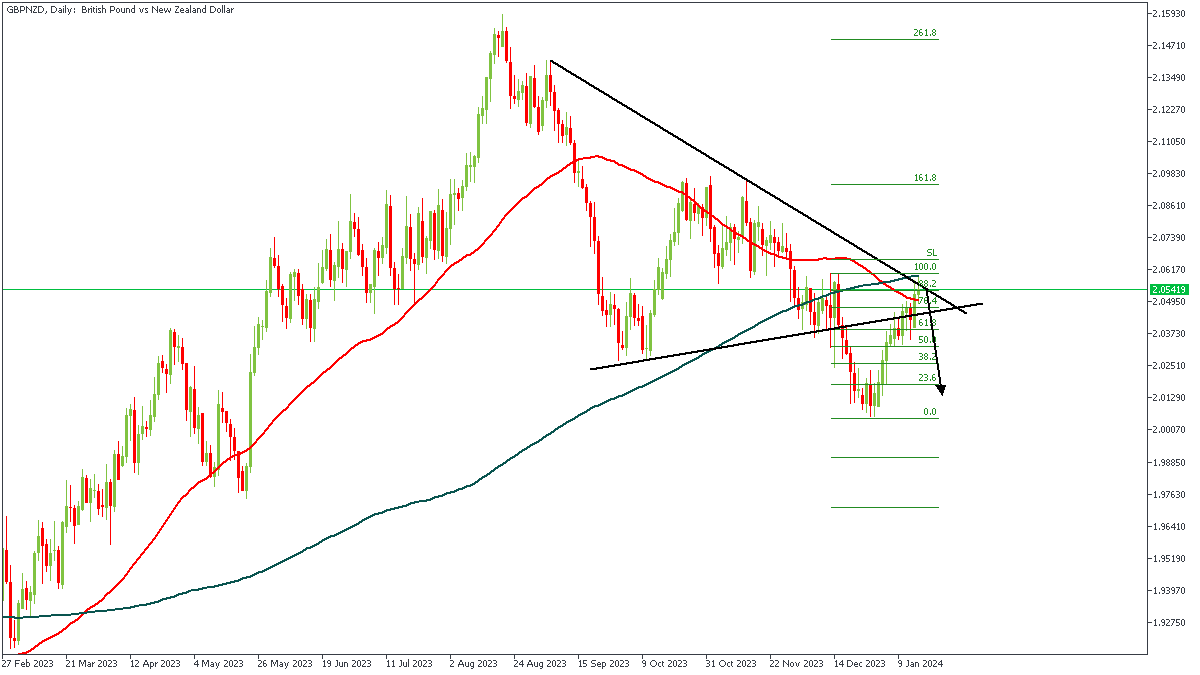
GBPNZD is currently trading between the 50 and 200 moving averages. The 200 moving average overlaps with the resistance trendline, and the moving averages are also arrayed in a descending order. Considering the confluence from the Fibonacci retracement levels, I will be positioning for a short entry with a target at the 23% of the Fibonacci retracement level.
Analyst’s Expectations:
- Direction: Bearish
- Target: 2.04375
- Invalidation: 2.05870
GBPJPY - D1 Timeframe
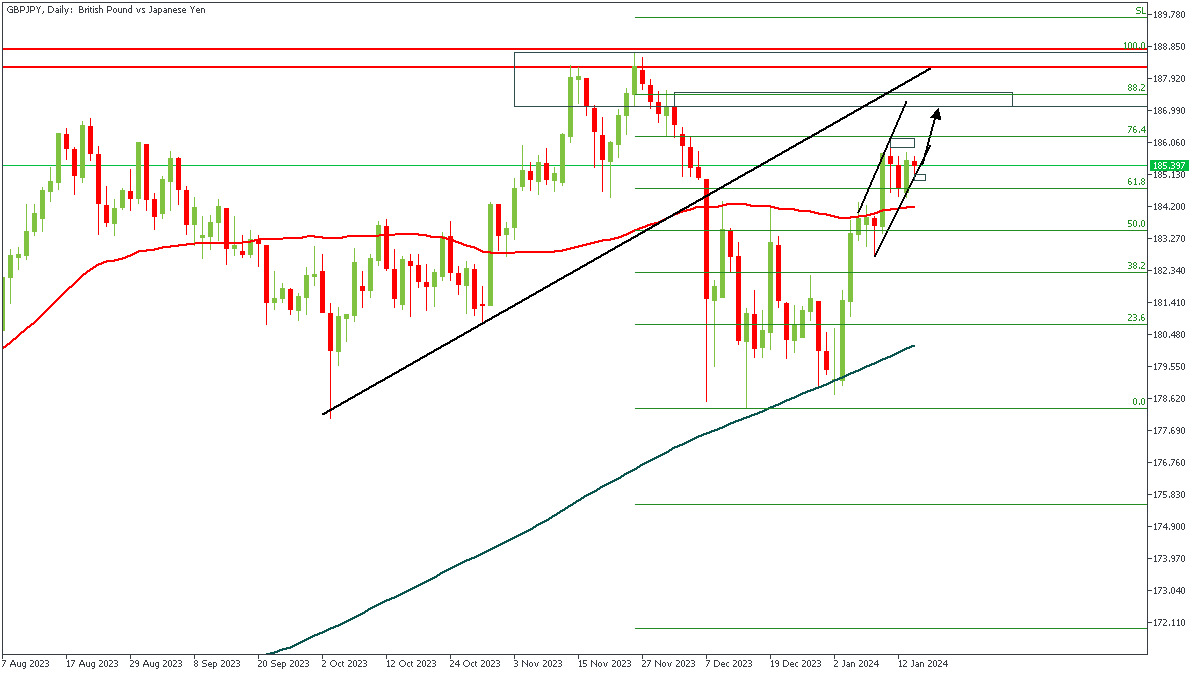
After breaking below the trendline support, the price action on GBPJPY seems to be retracing its steps in order to complete a retest of the supply zone and the QMR pattern. The supply zone on the Daily timeframe overlaps the 88% of the Fibonacci retracement zone, while the current consolidation within the channel is also a sign that the price action is seeking out a key zone from which it can react properly.
Analyst’s Expectations:
- Direction: Bullish
- Target: 187.054
- Invalidation: 184.763
CONCLUSION
The trading of CFDs comes at a risk. Thus, to succeed, you have to manage risks properly. To avoid costly mistakes while you look to trade these opportunities, be sure to do your due diligence and manage your risk appropriately.
GBP/USD At Risk of More Losses Below 1.2600
Key Highlights
- GBP/USD is struggling to stay above the key 1.2620 support zone.
- It broke a major bullish trend line with support at 1.2685 on the 4-hour chart.
- EUR/USD is showing a few bearish signs below 1.0900.
- Gold prices started a downside correction from the $2,060 resistance level.
GBP/USD Technical Analysis
The British Pound started a fresh decline from the 1.2785 level against the US Dollar. GBP/USD declined below the 1.2700 level to move into a bearish zone.
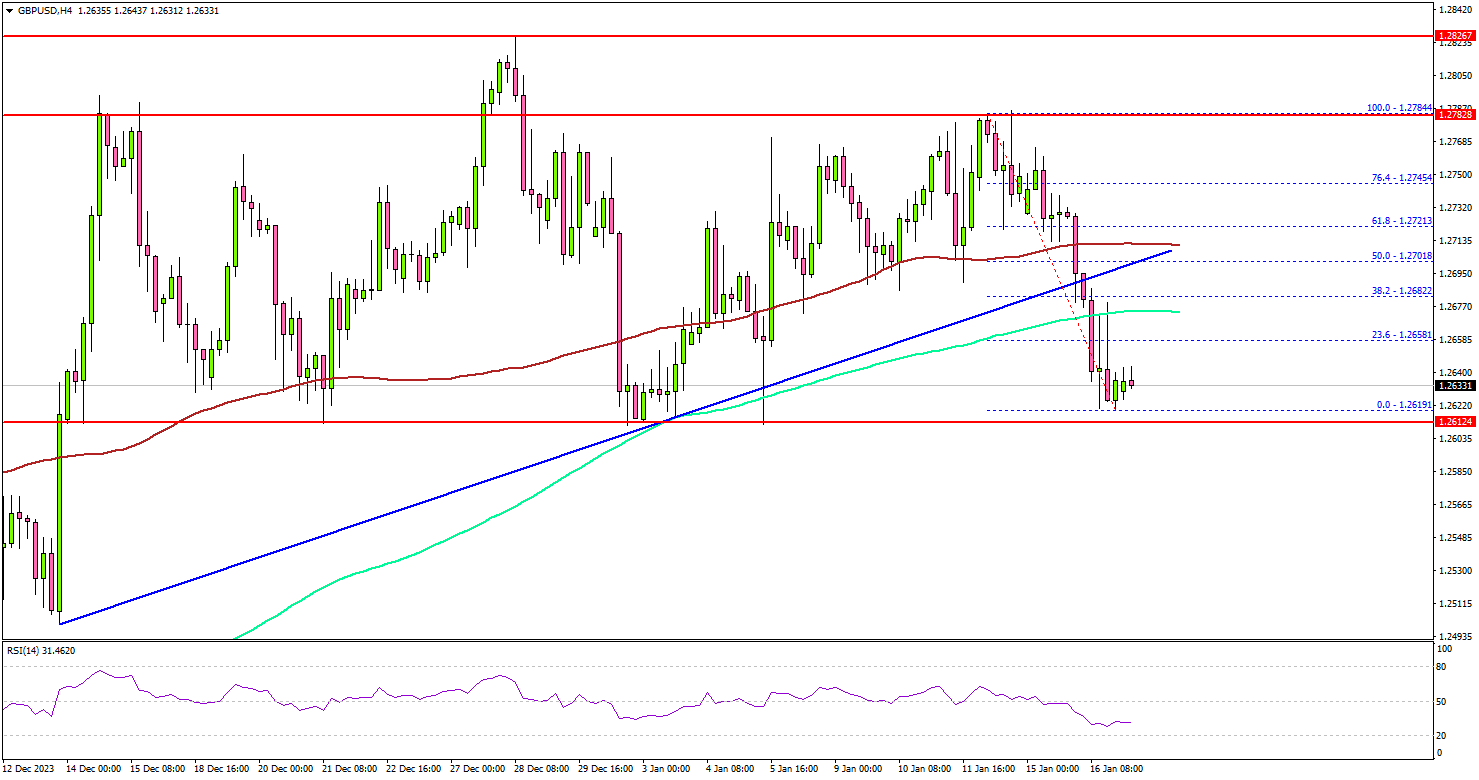
Looking at the 4-hour chart, the pair settled below the 1.2680 level, the 100 simple moving average (red, 4 hours), and the 200 simple moving average (green, 4 hours). There was a spike below the 1.2640 level.
The pair traded as low as 1.2619 and is currently consolidating losses. On the upside, immediate resistance is near the 1.2680 level and the 200 simple moving average (green, 4 hours). The next key resistance is near the 1.2700 zone.
The 100 simple moving average (red, 4 hours) is also near the 1.2700 zone to act as a barrier. A close above the 1.2700 zone could open the doors for more upsides. The next stop for the bulls might be 1.2785.
If there is a fresh decline, the pair could clear the 1.2600 support. The next major support sits at 1.2540. A downside break below the 1.2540 zone could spark a sustained decline. The next major support is 1.2420, below which the pair might decline and test 1.2350.
Looking at EUR/USD, the pair is struggling and it might slide below the 1.0850 support zone in the coming sessions.
Economic Releases
- UK Consumer Price Index for Dec 2023 (YoY) – Forecast +3.8%, versus +3.9% previous.
- UK Core Consumer Price Index for Dec 2023 (YoY) – Forecast +4.9%, versus +5.1% previous.
- US Retail Sales for Dec 2023 (MoM) – Forecast +0.4%, versus +0.3% previous.
GBPAUD Wave Analysis
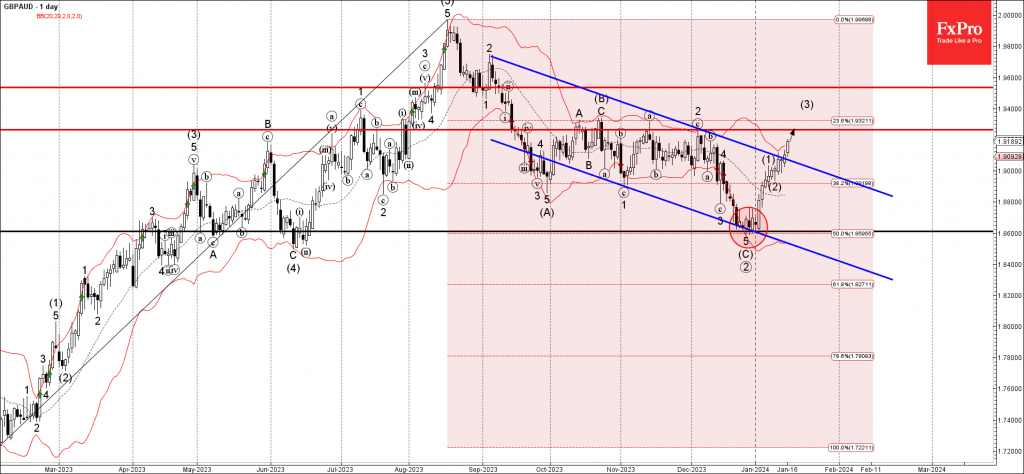
- GBPAUD broke weekly down channel
- Likely to rise to resistance level 1.9265
GBPAUD currency pair recently broke the resistance trendline of the weekly down channel from last September.
The breakout of this this down channel accelerated the active intermediate impulse wave (3).
Given the strong Swiss franc sales seen across the FX markets today, USDCHF can be expected to rise further to the next resistance level 1.9265 (which has been reversing the price from October).
USDCHF Wave Analysis
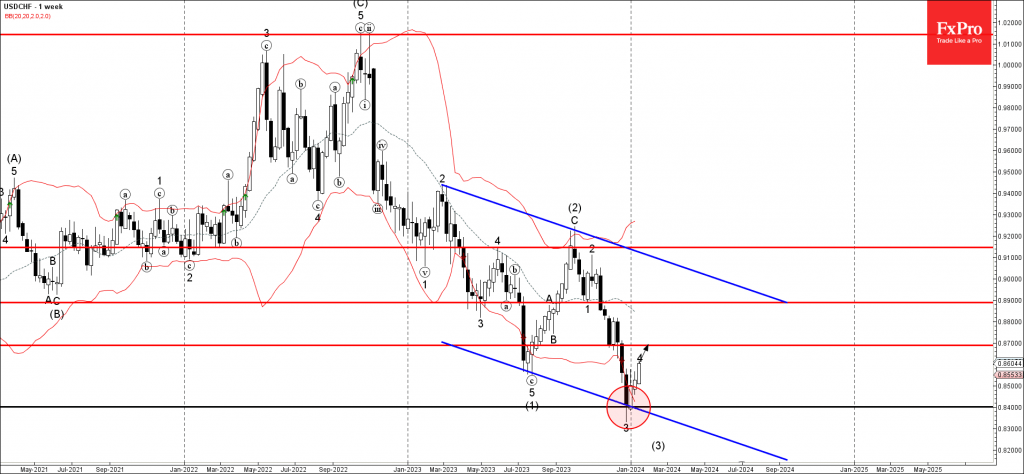
- USDCHF reversed from support level 0.8400
- Likely to rise to resistance level 0.8700
USDCHF currency pair recently reversed up with the weekly Piercing Line from the key support level 0.8400.
The support level 0.8400 was strengthened by the lower daily Bollinger Band and by the support trendline of the weekly down channel from the start of last year.
Given the strong Swiss franc sales, USDCHF can be expected to rise further to the next resistance level 0.8700 (former support from the end of last year).