Sample Category Title
Forex Markets Show Hesitation, Gold on the Rise
Today's trading in the forex markets reflects a sense of indecision among investors. Dollar, which initially showed signs of recovery, faced an abrupt halt following unexpected decline in US PPI for December. British Pound, despite the release of stronger-than-expected UK GDP data, failed to garner significant support. Japanese Yen is attempting a modest recovery, capitalizing on retreat in global benchmark yields. However, momentum behind Yen's recovery remains relatively weak. Euro, meanwhile, continues to trade within a narrow range against major counterparts like Dollar Sterling, and Swiss Franc.
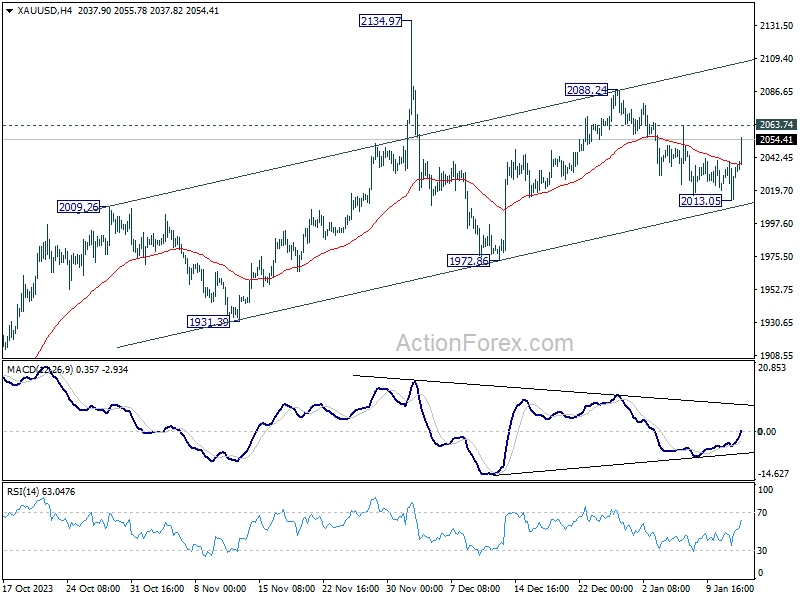
In contrast to the lackluster movements in currency pairs, Gold rebounds strongly after being supported by near term rising channel. Current development suggests that near term up trend in gold remains intact. Next focus is 2063.74 minor resistance. Break there should pave the way through 2088.24 resistance towards 2134.97.
In Europe, at the time of writing, FTSE is up 0.70%. DAX is up 0.78%. CAC is up 0.78%. Germany 10-year yield is down -0.0090 at 2.206. UK 10-year yield is down -0.029 at 3.813. Earlier in Asia, Nikkei rose 1.50%. Hong Kong HSI fell -0.35%. China Shanghai SSE fell -0.16%. Singapore Strait Times fell -0.30%. Japan 10-year yield fell -0.0149 to 0.591.
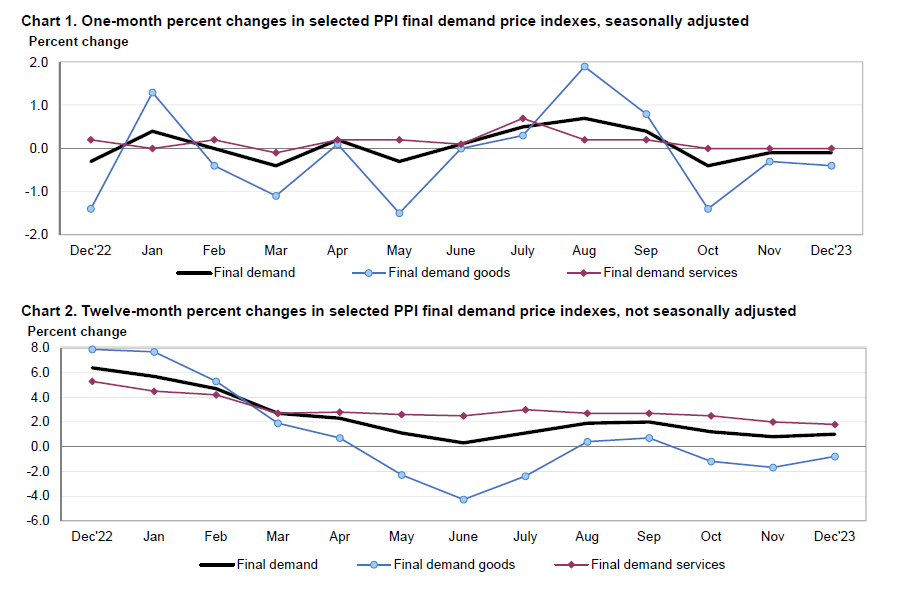
US PPI down -0.1% mom in Dec
US PPI for final demand fell -0.1% mom in December, below expectation of 0.1% mom. PPI goods was down -0.4% mom while PPI services was unchanged. PPI less foods, energy and trade services rose 0.2% mom.
For the 12-month period, PPI rose from 0.8% yoy to 1.0% yoy, below expectation of 1.3% yoy. PPI less foods, energy and trade services rose from 2.4% yoy to 2.5% yoy.
UK GDP grew 0.3% mom in Nov, but down -0.2% in the three month period
UK GDP grew 0.3% mom in November, above expectation of 0.2% mom. Services output rose 0.4% mom. Production output grew 0.3% mom. Construction sector fell-0.2% mom.
However, in the three months to November, GDP fell -0.2% compared with the prior three months period to August. Services showed no growth, production output fell by -1.5% and construction fell by -0.6% over the same period.
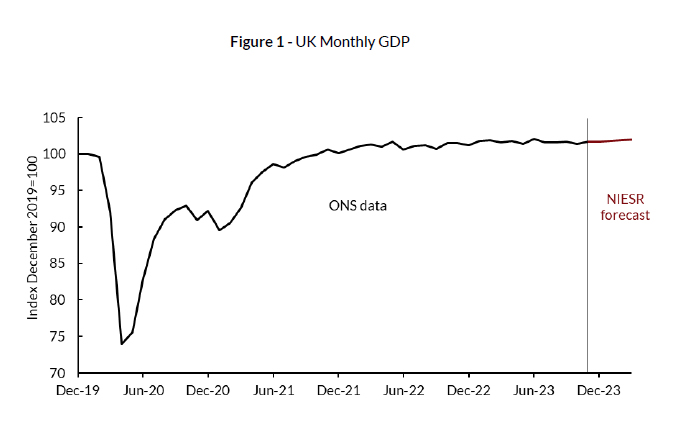
NIESR forecasts 0.2% UK GDP growth in Q1
NIESR estimated UK's GDP remained "flatlined" in the final quarter of 2023. Looking ahead, NIESR forecasts modest uptick in GDP growth for the first quarter of 2024 by 0.2%. This forecast aligns with broader trend observed in UK economy, characterized by "low, but stable economic growth".
While UK's GDP showed 0.3% growth in November, a broader look at the three-month period leading up to November paints a different picture. In this timeframe, GDP experienced a -0.2% decline compared to the preceding three months up to August.
"These three-monthly data, which are less volatile than the monthly figures, suggest that the bigger picture remains one of sluggish growth," NIESR said.
China's CPI improved to -0.3%, deflation persists for the 3rd month
China's CPI rose from -0.5% yoy to -0.3% yoy in December, better than expectation of -0.4% yoy. That's nonetheless the third consecutive month of negative reading. On a month-on-month basis, the CPI increased by 0.1% , versus -0.5% decline in November. Core CPI, which excludes volatile food and energy prices was at 0.6% yoy, unchanged from November.
NBS said pork prices, the main factor impacting year-on-year CPI, fell -26.1% yoy, narrowed from -31.8% yoy in November. Services inflation, however, rose steadily with tourism and hotel accommodation prices increasing by 6.8% yoy and 5.5% yoy, respectively.
PPI rose from -3.0% yoy to -2.7% yoy, worse than expectation of -2.5% yoy. That's the 15th straight month of decline. NBS said the PPI decline was affected by factors including declining international prices of oil and insufficient demand for some industrial products.
China's exports rise 2.3% yoy in Dec, down to US, EU and ASEAN
In December, China's exports increased by 2.3% yoy to USD 303.6B, surpassing expectation of 1.7%. However, this growth was not uniform across all regions. Notably, shipments to US saw a significant decline of -6.89% yoy. Similarly, exports to EU and ASEAN countries also dropped, by -1.93% yoy and -6.14% yoy respectively.
On the import front, China experienced a marginal increase of 0.2% yoy to USD 228.2B, which was slightly below the expected 0.3% yoy growth. Consequently, trade surplus widened from USD 68.3B to USD 75.3B, which was above the anticipated USD 74.8B.
For the entire year of 2023, China's trade figures painted a scenario of contraction. Exports decreased by -4.6% to USD 3.38T, while imports saw -5.5% contraction to USD 2.56T.
GBP/USD Mid-Day Outlook
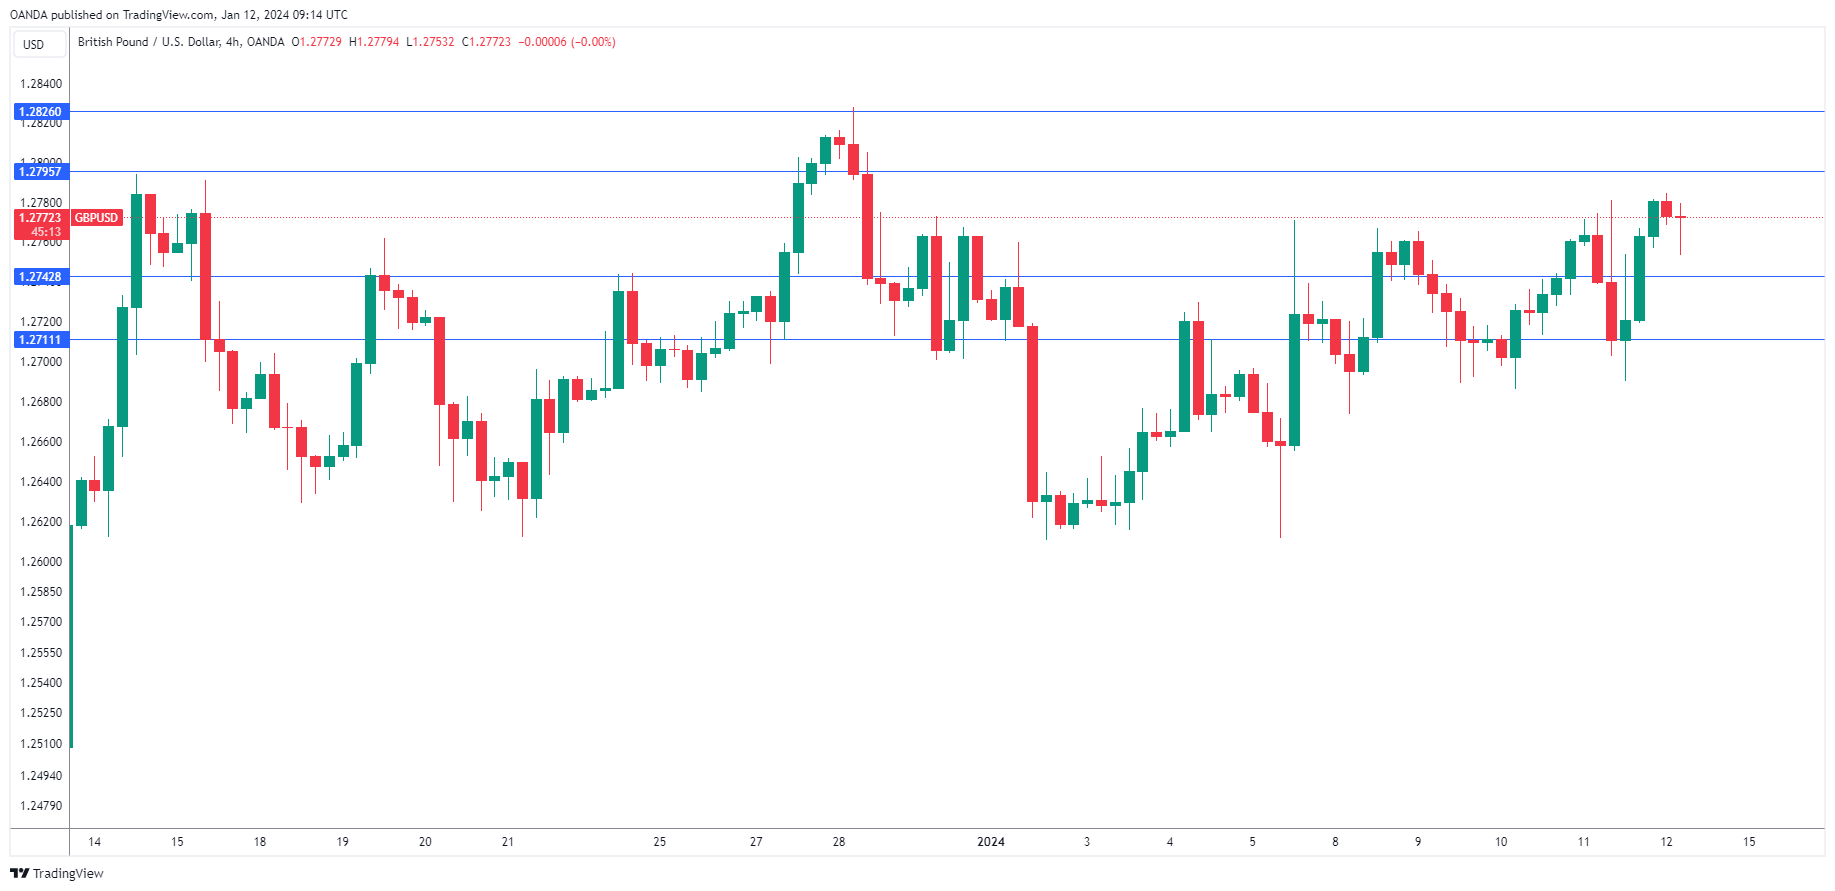
Daily Pivots: (S1) 1.2711; (P) 1.2742; (R1) 1.2795; More...
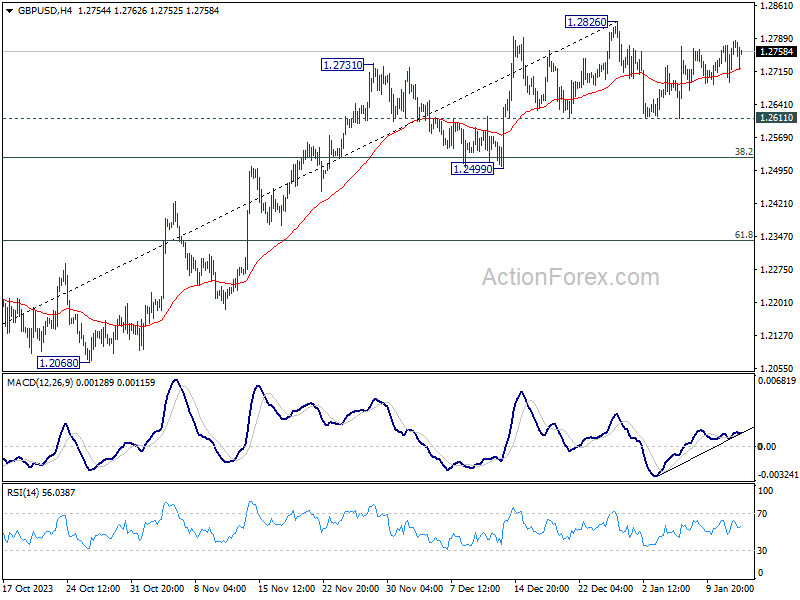
No change in GBP/USD's outlook as range trading continues below 1.2826. On the upside, decisive break of 1.2826 high will resume whole rally from 1.2036. Nevertheless, break of 1.2611 will bring deeper correction to 1.2499 support instead.
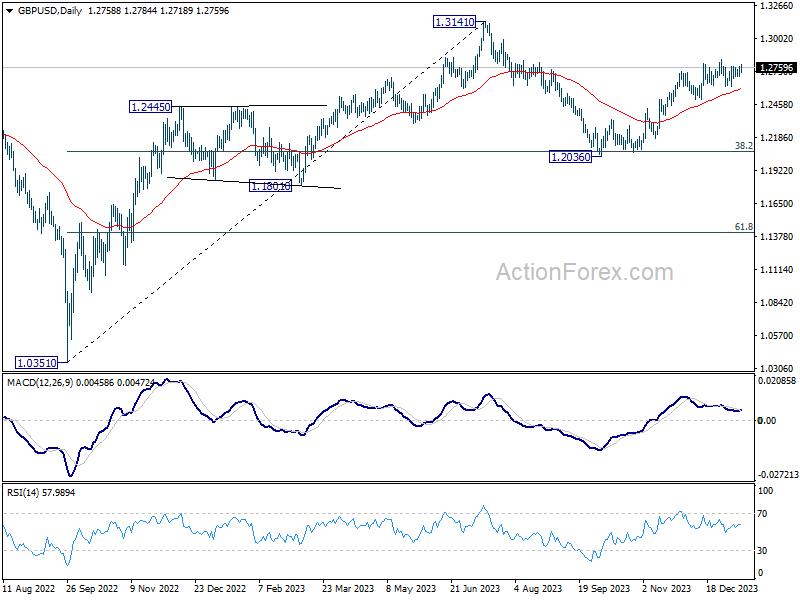
In the bigger picture, price actions from 1.3141 medium term top are seen as a corrective pattern to up trend from 1.0351 (2022 low). Rise from 1.2036 is seen as the second leg that's in progress. Upside should be limited by 1.3141 to bring the third leg of the pattern. Meanwhile, break of 1.2499 support will argue that the third leg has already started for 38.2% retracement of 1.0351 (2022 low) to 1.3141 at 1.2075 again.
Economic Indicators Update
| GMT | Ccy | Events | Actual | Forecast | Previous | Revised |
|---|---|---|---|---|---|---|
| 23:50 | JPY | Bank Lending Y/Y Dec | 3.10% | 2.70% | 2.80% | |
| 23:50 | JPY | Current Account (JPY) Nov | 1.89T | 2.18T | 2.62T | |
| 01:30 | CNY | CPI Y/Y Dec | -0.30% | -0.40% | -0.50% | |
| 01:30 | CNY | PPI Y/Y Dec | -2.70% | -2.50% | -3.00% | |
| 02:30 | CNY | Trade balance (USD) Dec | 75.34B | 74.75B | 68.39B | |
| 02:30 | CNY | Exports Y/Y Dec | 2.30% | 1.70% | 0.50% | |
| 02:30 | CNY | Imports Y/Y Dec | 0.20% | 0.30% | -0.60% | |
| 05:00 | JPY | Eco Watchers Survey: Current Dec | 50.7 | 49.9 | 49.5 | |
| 07:00 | GBP | GDP M/M Nov | 0.30% | 0.20% | -0.30% | |
| 07:00 | GBP | Industrial Production M/M Nov | 0.30% | 0.10% | -0.80% | -1.30% |
| 07:00 | GBP | Industrial Production Y/Y Nov | -0.10% | 0.70% | 0.40% | -0.50% |
| 07:00 | GBP | Manufacturing Production M/M Nov | 0.40% | 0.30% | -1.10% | -1.20% |
| 07:00 | GBP | Manufacturing Production Y/Y Nov | 1.30% | 1.70% | 0.80% | 0.20% |
| 07:00 | GBP | Goods Trade Balance (GBP) Nov | -14.2B | -15.7B | -17.0B | -15.9B |
| 07:45 | EUR | France Consumer Spending M/M Nov | 0.70% | 0.00% | -0.90% | |
| 13:00 | GBP | NIESR GDP Estimate (3M) Dec | 0.00% | -0.10% | -0.20% | |
| 13:30 | USD | PPI M/M Dec | -0.10% | 0.10% | 0.00% | -0.10% |
| 13:30 | USD | PPI Y/Y Dec | 1.00% | 1.30% | 0.90% | 0.80% |
| 13:30 | USD | PPI Core M/M Dec | 0.00% | 0.20% | 0.00% | |
| 13:30 | USD | PPI Core Y/Y Dec | 1.80% | 2.00% | 2.00% |
US PPI down -0.1% mom in Dec
US PPI for final demand fell -0.1% mom in December, below expectation of 0.1% mom. PPI goods was down -0.4% mom while PPI services was unchanged. PPI less foods, energy and trade services rose 0.2% mom.
For the 12-month period, PPI rose from 0.8% yoy to 1.0% yoy, below expectation of 1.3% yoy. PPI less foods, energy and trade services rose from 2.4% yoy to 2.5% yoy.
NIESR forecasts 0.2% UK GDP growth in Q1
NIESR estimated UK's GDP remained "flatlined" in the final quarter of 2023. Looking ahead, NIESR forecasts modest uptick in GDP growth for the first quarter of 2024 by 0.2%. This forecast aligns with broader trend observed in UK economy, characterized by "low, but stable economic growth".
While UK's GDP showed 0.3% growth in November, a broader look at the three-month period leading up to November paints a different picture. In this timeframe, GDP experienced a -0.2% decline compared to the preceding three months up to August.
"These three-monthly data, which are less volatile than the monthly figures, suggest that the bigger picture remains one of sluggish growth," NIESR said.
Middle East Escalation Coincides With Oil Price Key Level
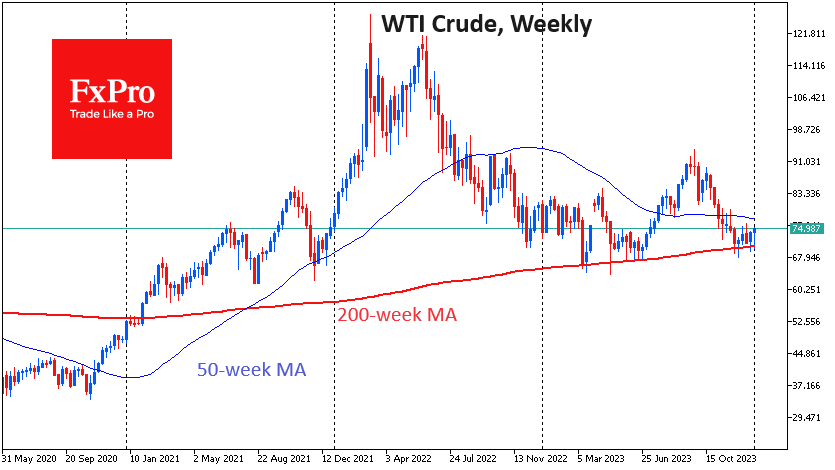
Oil is up 2.8% since the start of the day on Friday following a new round of escalation in the Middle East. The price of Brent rose above $80, while a barrel of WTI traded above $75. The US and the UK carried out strikes on military targets in Yemen, which has vowed not to let the attacks go unanswered. The potential for a chain reaction is alarming, promising severe logistical problems in a major shipping artery that accounts for 15% of the world’s trade. And that’s not to mention the risks to global oil supplies from a region that accounts for a third of the world’s supply.
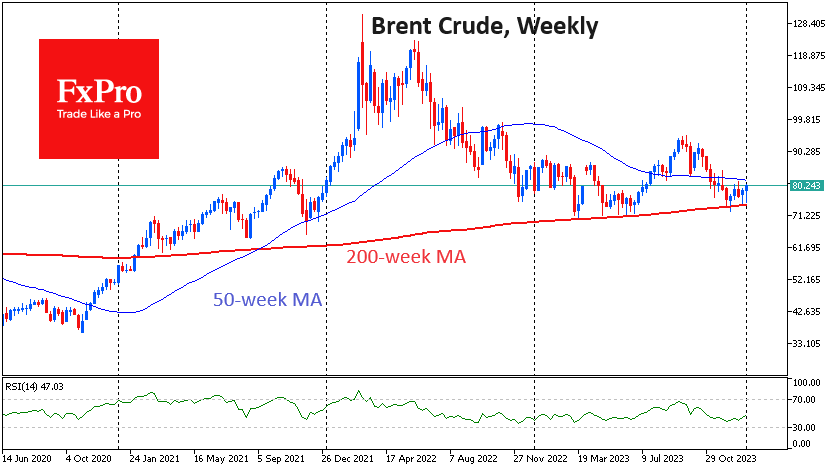
The geopolitical escalation in the Middle East came during another test of a key price level. Throughout 2023, oil fell sharply on signs of weak demand from a slowing China and a sluggish Europe. But each time, the downside was halted at the 200-week moving average for Brent and WTI. OPEC+ production quota cuts or a new round of escalation have often halted the sell-off in oil. The beginning of January has so far continued last year’s pattern, with no chance of the price falling below the average level of the last four years.
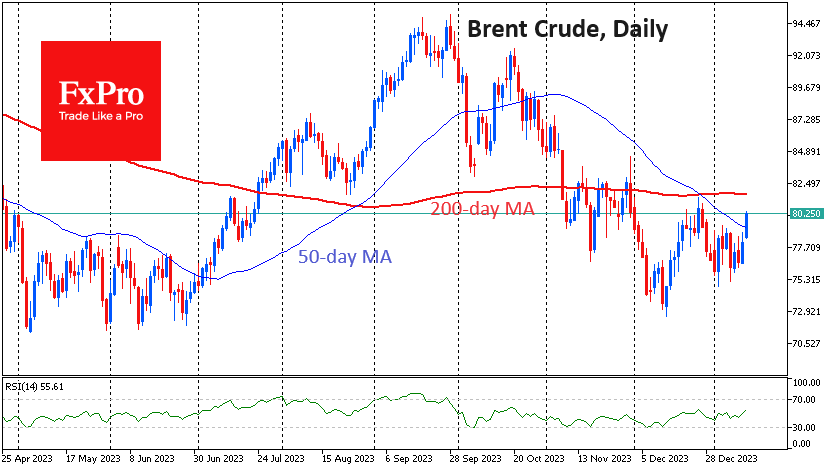
We can say that Russia and the Middle East are trying to outline the price floor. A technical confirmation of the change in trend could be a rise above the previous local highs of late December of $81.5 for Brent and $76.5 for WTI.
Other technical factors could also come into play. Brent was above its 50-day average intraday on Friday, and previous highs are close to the 200-day average, the crossing of which very often reinforces a breakout move. And in our case, it could be a quick rise towards $85 or even $92 a barrel for Brent.
For WTI, this bullish scenario opens up an easy path to the $80s and on to $86.
On the other hand, the fact that oil and gas have ignored geopolitics for so long and have not retreated from crucial support levels suggests that there are significant domestic pressures. We cannot completely rule out a scenario in which the sworn friends within OPEC return to fighting for market share that is being methodically taken away by other countries, led by the US.
Australian Dollar Edges Up as China CPI Slips
- China’s CPI declines by 0.3%
- Fed’s Mester pushes back against March rate cut expectations
The Australian dollar has edged higher on Friday. In the European session, AUD/USD is trading at 0.6693, up 0.09%.
Policy makers at Australia’s central bank are keeping a close eye on this week’s inflation data out of Australia and China. Australia’s CPI eased to 4.3% y/y in November, down from 4.9% in October and below the market estimate of 4.4%. This marked the lowest inflation rate since January 2022, as food and energy prices decelerated in November compared to a month earlier.
China, the world’s second-largest economy, continues to struggle with deflation. CPI fell by 0.3% y/y in December, the third consecutive monthly decline. That hasn’t happened since 2009. Monthly, CPI rose 0.1% rebounding from -0.5% in November but missed the market estimate of 0.2%. Core CPI increased by 0.6% y/y for a third straight month.
The lack of inflation points to a bumpy recovery for the Asian giant, which is not good news for Australia as China is its number one export destination. Weaker activity in the Chinese economy means less demand for Australian exports and that could have a negative impact on the Australian dollar.
Mester pushes back against March rate cut
The markets have become accustomed to inflation falling in the US, which made the upswing in December’s inflation report a rude surprise. Inflation rose 3.4%, up from 3.1% in November and higher than the market estimate of 3.2%.
The rise in US inflation is a reminder that the battle to bring inflation back to the 2% target will be bumpy. The Fed has done a good job in lowering inflation but the final stretch is looking to be the most difficult. Services and housing inflation remains sticky and deflationary pressures from goods and energy have been fading.
The markets have trimmed their expectations for a March rate cut in response to the inflation release and last week’s nonfarm payrolls, which was also higher than expected. The odds of a March rate hike are around 70% but the Fed hasn’t signalled what timeline it has in mind for an initial rate cut. Cleveland Fed President Mester pushed back against market expectations on Thursday, following the inflation release. Mester said that it was “too early” to cut rates in March because the upswing in inflation showed that restrictive policy was needed to bring down inflation to the 2% target.
AUD/USD Technical
- There is resistance at 0.6732 and 0.6824
- 0.6625 and 0.6533 are providing support
AUDUSD Remains in Positive Territory
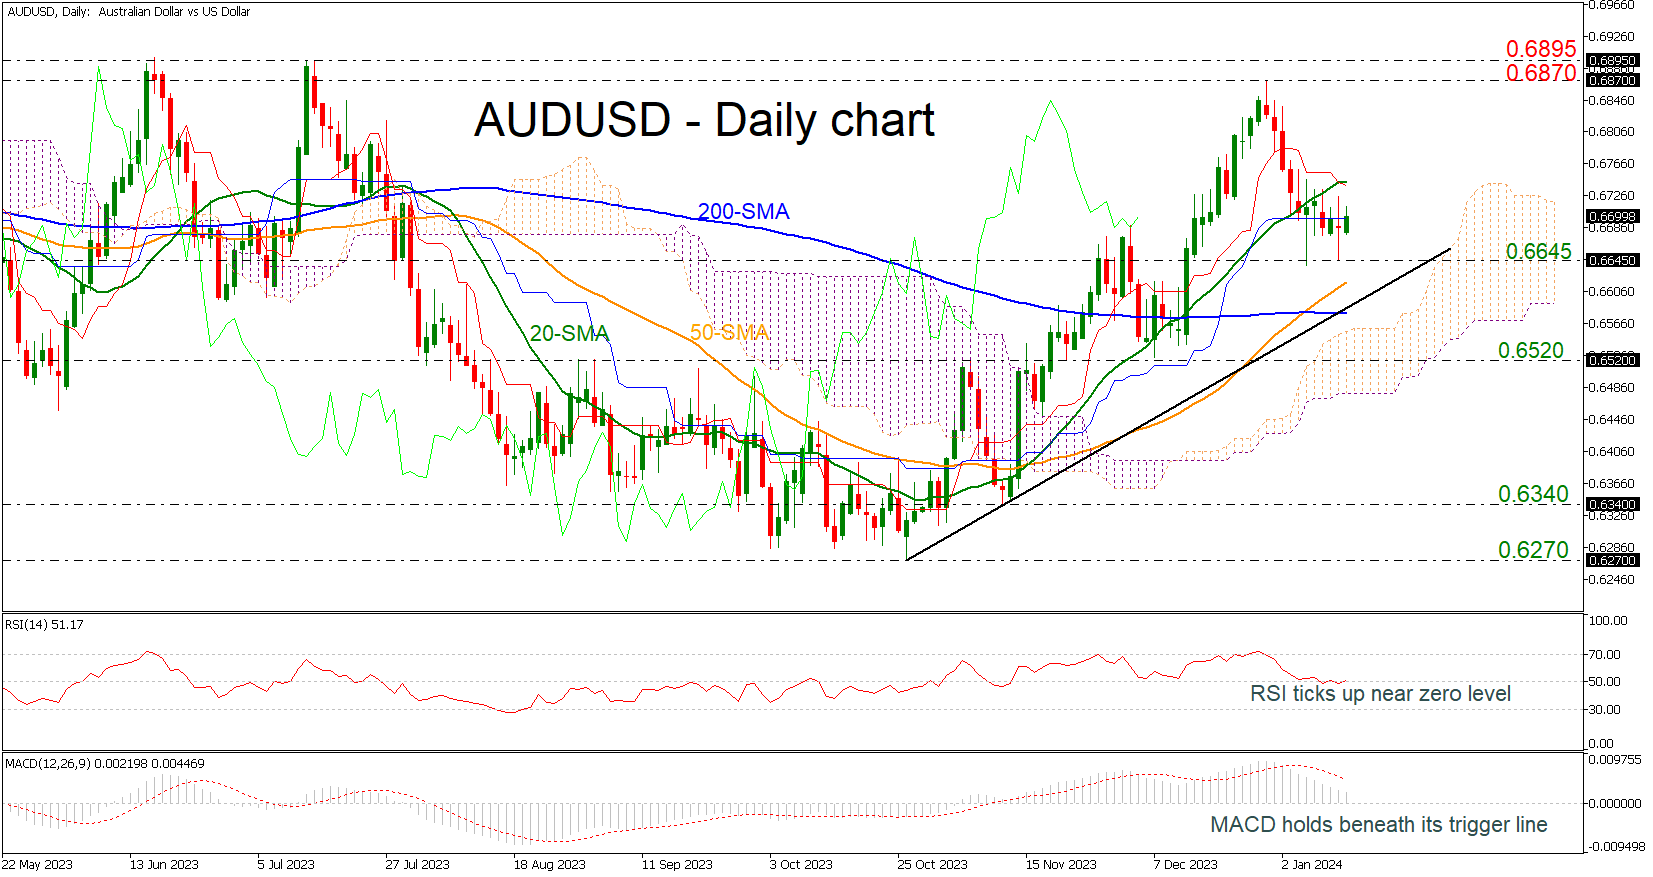
- AUDUSD fails to fall below 0.6645
- Price holds well above uptrend line
- RSI is flattening
AUDUSD has been in a somewhat positive corrective mode during the week, earning back some losses from the December 28 high of 0.6870.
Entering the 0.6700 area has been a struggle over the past few days, and there might be another tough obstacle within the 0.6740 region, which is the 20-day simple moving average, but the bulls may not give the battle yet according to the technical indicators. Specifically, the RSI is moving horizontally near the 50 level, while the MACD is still in the positive area but with weaker momentum than before.
In the event the pair re-activates its uptrend above 20-day SMA at 0.6740, the next target will be the 0.6870 region and then the 0.6895 barrier, taken from the peak on July 14.
On the downside, the 0.6645 support has been guarding selling forces over the last five days. Hence a step beneath that line at the 50-day SMA at 0.6615 might produce a fresh bearish wave, likely squeezing the price towards the 200-day SMA at 0.6580, which overlaps with the medium-term ascending trend line. Another defeat there could add more fuel to the negative move, bringing the 0.6520 support immediately under the spotlight.
Overall, AUDUSD has been sustaining an upward trend since October 2026 in the daily picture. To attract new buyers, the pair will need to pierce through the 0.6870 bar.
USDCAD Bears Show Up Near Key Resistance
- USDCAD pauses rebound near key resistance trendline
- Market sentiment remains fragile below 1.3440
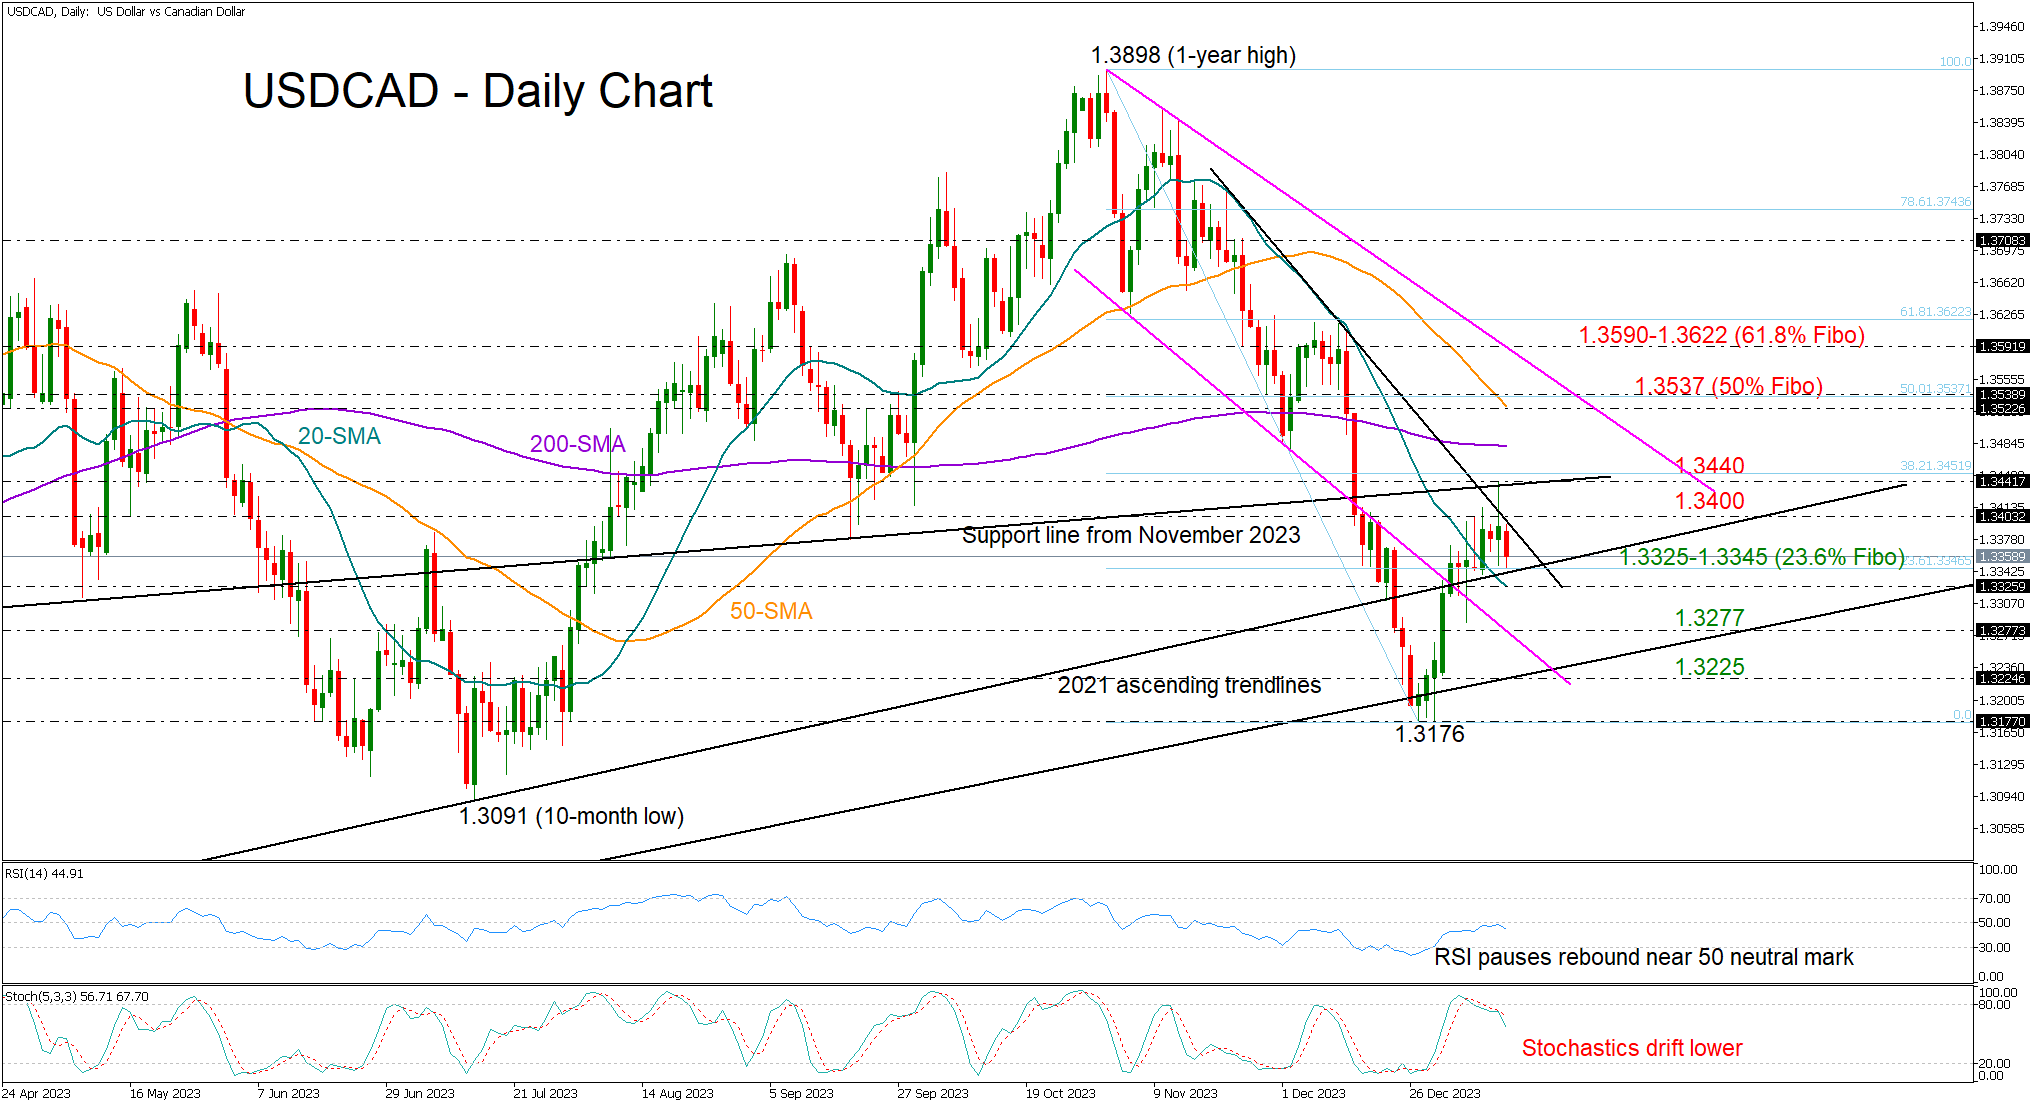
USDCAD could not climb into the 1.3400 zone despite the slight positive surprise in the US CPI inflation numbers on Thursday, staying below the ascending trendline drawn from November 22.
The pair also seems to be trapped between the upper 2021 ascending trendline around 1.3440 and the constraining line from November 2022 near 1.3345.
Encouragingly, the price has built a floor around the 23.6% Fibonacci mark of the November-December downtrend to close above the 20-day simple moving average (SMA) after two months. Despite that, the RSI has yet to enter the bullish territory above 50, while the stochastic oscillator seems to have already started a new bearish cycle, suggesting that sellers could remain active in the market.
Should the current weakness in the price extend below the 1.3325-1.3345 region, the focus could turn to the falling line from early November at 1.3277. If the bears ignore that barrier too, the pair might seek support near the lower 2021 ascending trendline at 1.3225, a break of which could bring December’s floor of 1.3176 back under the spotlight.
On the upside, the bulls will need to pierce through the 1.3440 wall and the 38.2% Fibonacci mark to speed up to the 50-day SMA and the 50% Fibonacci of 1.3537. Additional gains from there could stabilize somewhere between the tentative descending trendline from November’s highs at 1.3590 and the 61.8% Fibonacci of 1.3622.
In summary, USDCAD has not escaped negative risks despite starting the year on a good note. A decisive close above 1.3400-1.3440 could resume buying confidence in the market.
GBP/USD Yawns After Strong UK GDP
- UK GDP rebounds to 0.3%, but economy remains weak
- US inflation hotter than expected at 3.4%
The British pound is showing limited movement on Friday. In the European session, GBP/USD is trading at 1.2769, up 0.05%.
UK GDP bounces back in November
The British economy grew in November by 0.3% m/m, rebounding from a 0.3% decline in October and edging above the market estimate of 0.2%. This was the sharpest GDP growth since July and was driven by stronger activity in services, retail sales and manufacturing. The news was not as good from a three-month snapshot, however. The economy contracted 0.2% in the three months to November, unchanged from the previous release and missing the market estimate of -0.1%.
The December GDP release will answer the question of whether the UK economy is in a shallow recession. Third quarter GDP was revised to -0.1% and if Q4 also posts negative growth, the economy would technically be in a recession. Even if the economy manages to avoid a recession, it will likely point to stagnation.
The weak UK economy presents the Bank of England with a dilemma. The BoE is under pressure to lower rates to kick-start the economy, but inflation is running at a 3.9% which is almost double the 2% target. The BoE would prefer to maintain a ‘higher for longer” rate path and let restrictive rates continue to push inflation lower. The central bank is likely to keep interest rates on hold at the next meeting on February 1.
US inflation higher than expected
In the US, inflation was higher than expected in December, with a gain of 3.4%. This was a rude surprise for the markets, which have become accustomed to inflation heading lower. The Fed won’t be losing sleep over the upswing, as Core CPI, which is a better indicator of inflation trends, dipped lower to 3.9%.
The rise in US inflation is a reminder that the battle to bring inflation back to the 2% target will be bumpy. The Fed has done an admirable job in lowering inflation but the final stretch is looking to be the most difficult. Services and housing inflation remains sticky and deflationary pressures from goods and energy have been fading.
The markets have pared their expectations for a March rate cut to around 70% but the Fed has been pushing back against these expectations. Cleveland Fed President Mester said on Thursday after the inflation report that it was “too early” to cut rates in March because the inflation release showed that restrictive policy was needed to bring down inflation to the 2% target.
GBP/USD Technical
- GBP/USD is putting pressure on resistance at 1.2795. Above, there is resistance at 1.2826
- There is support at 1.2742 and 1.2711
Crypto Market Fluctuates But Does Not Move
Market picture
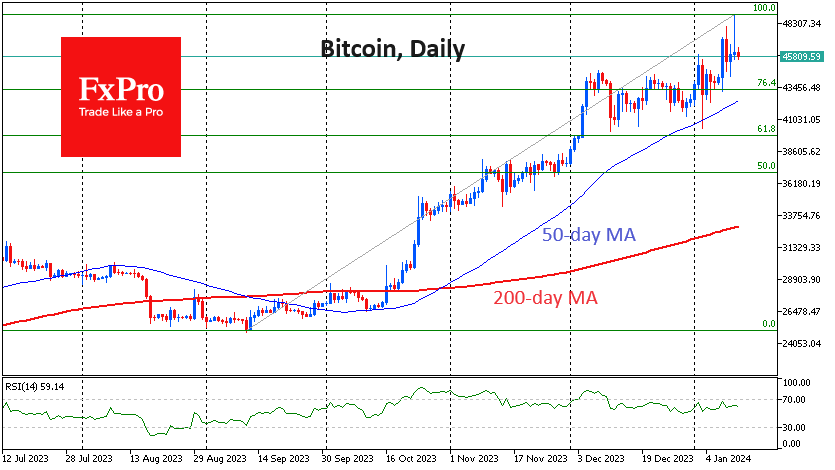
Cryptocurrency market capitalisation is at the same level as the previous day at $1.76 trillion, with the market showing impressive intraday amplitude on Thursday, gaining and then losing around 7% across the major instruments.
At the start of spot ETP trading, the price of bitcoin was close to $49K but was pushed back to $46K, where it is now. It seems that some investors have moved from crypto exchanges to owning the first cryptocurrency through an exchange-traded product.
The launch of spot ETPs is a positive long-term move that supports the reputation and liquidity of the cryptocurrency market, but it by no means avoids a bumpy start to the journey – just like the launch of bitcoin futures on the Chicago exchange.
The first cryptocurrency’s volatility has increased significantly over the past three days, but the price has repeatedly been brought back to the $46K area. On the other hand, we haven’t seen the much-anticipated ‘sell on the facts’ reaction yet.
Technically, such a correction could drag the price below $40K, but the markets need an accompaniment from the deteriorating macroeconomic outlook. Without it, the first cryptocurrency may well drift towards $50K or see another long sideways consolidation, as it did in November.
News background
The influx of institutional investment will increase trading volumes and crypto market liquidity and may even reduce bitcoin volatility in the long run, DRC believes.
It is not worth expecting funds to buy Bitcoin for tens of billions of dollars in the following weeks. But in the long run, there will be demand for cryptocurrencies.
Justin Sun, founder of Tron Blockchain, was optimistic about the approval of spot bitcoin ETFs in the US and said Asian markets would follow.
South Korean authorities have announced a ban on cryptocurrency ETFs. According to the Financial Services Commission of South Korea (FSC), the regulator considers financial stability and investor protection to be orders of magnitude higher than populist decisions.
Jamie Dimon, CEO of JP Morgan, once again spoke out against cryptocurrencies. According to him, “BTC is being used for human and drug trafficking, tax evasion and terrorist financing.” At the same time, the bank itself is one of the participants in BlackRock’s Spot Bitcoin ETF.
Technical Outlook and Review
DXY:
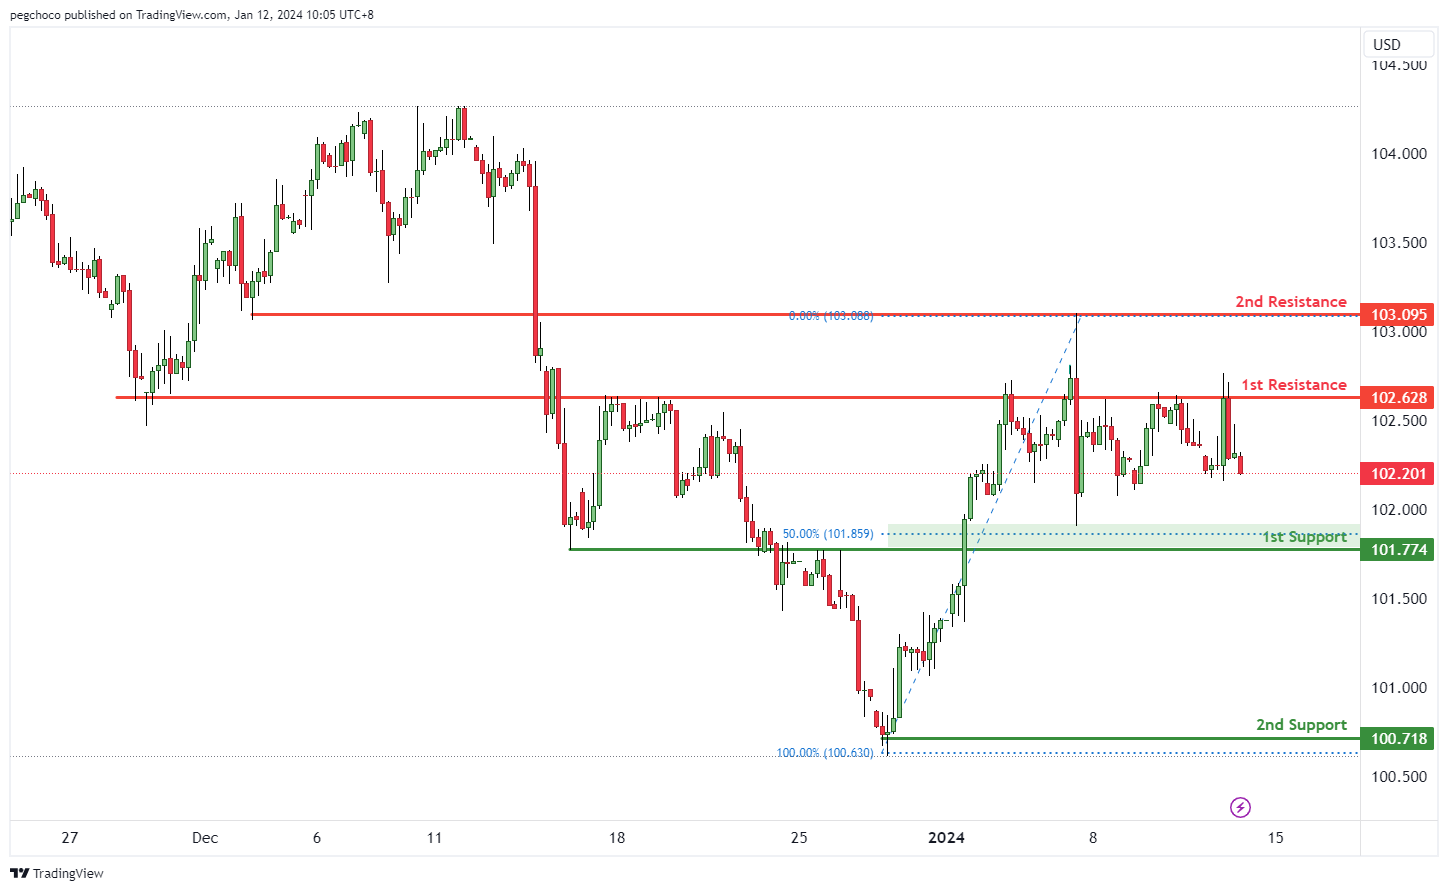
The DXY (US Dollar Index) chart currently demonstrates a bearish overall momentum, indicating a weaker stance for the US Dollar. This momentum suggests the potential for a bearish continuation towards the 1st support level.
The 1st support at 101.77 is recognized as an overlap support and coincides with the 50% Fibonacci Retracement level. This confluence of factors makes it a significant potential support zone, indicating a level where buyers may step in, temporarily supporting the DXY.
The 2nd support at 100.71 is identified as a swing low support, further reinforcing its importance as a potential support area.
On the resistance side, the 1st resistance at 102.62 is categorized as an overlap resistance, suggesting a level where selling pressure or a potential reversal may occur.
The 2nd resistance at 103.09 is also considered an overlap resistance, adding to its significance as a potential barrier to the price’s upward movement in the context of the bearish momentum.
EUR/USD:
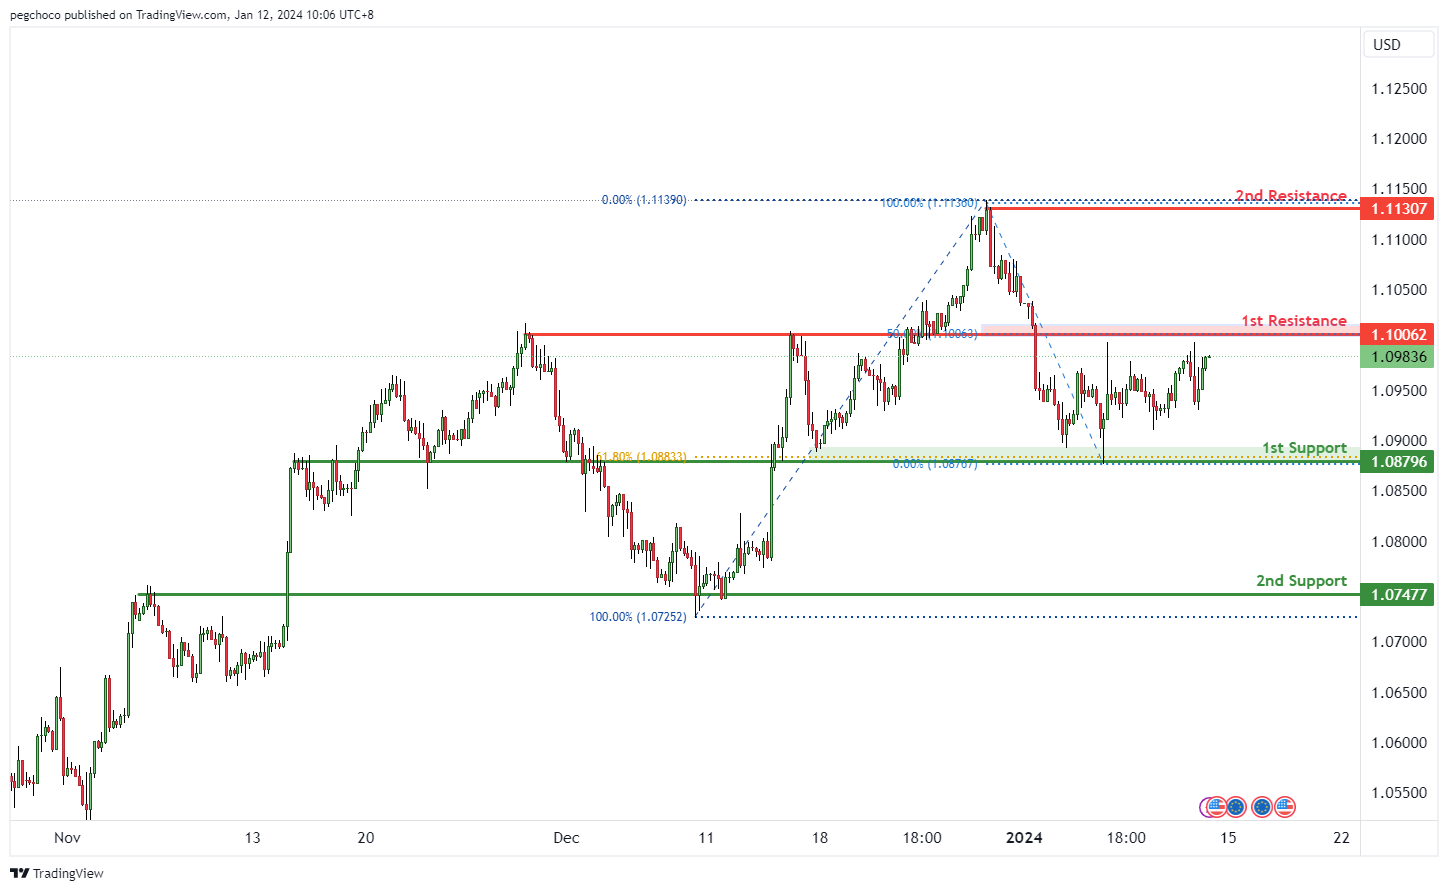
The EUR/USD chart currently exhibits a neutral overall momentum, suggesting a lack of strong directional bias in the near term. Given this neutral stance, there’s a potential scenario where the price may fluctuate between the 1st resistance and 1st support levels.
The 1st support at 1.0879 is identified as an overlap support and aligns with the 61.80% Fibonacci Retracement level. This confluence of factors makes it a significant potential support zone, indicating a level where buyers may show interest in the EUR/USD pair, potentially providing temporary support.
The 2nd support at 1.0747 is categorized as an overlap support, further reinforcing its significance as a potential support area.
On the resistance side, the 1st resistance at 1.1006 is marked as an overlap resistance, suggesting a level where selling pressure or a potential reversal may occur.
The 2nd resistance at 1.1130 is categorized as a swing high resistance, indicating a point where price has previously encountered resistance or reversal.
EUR/JPY:
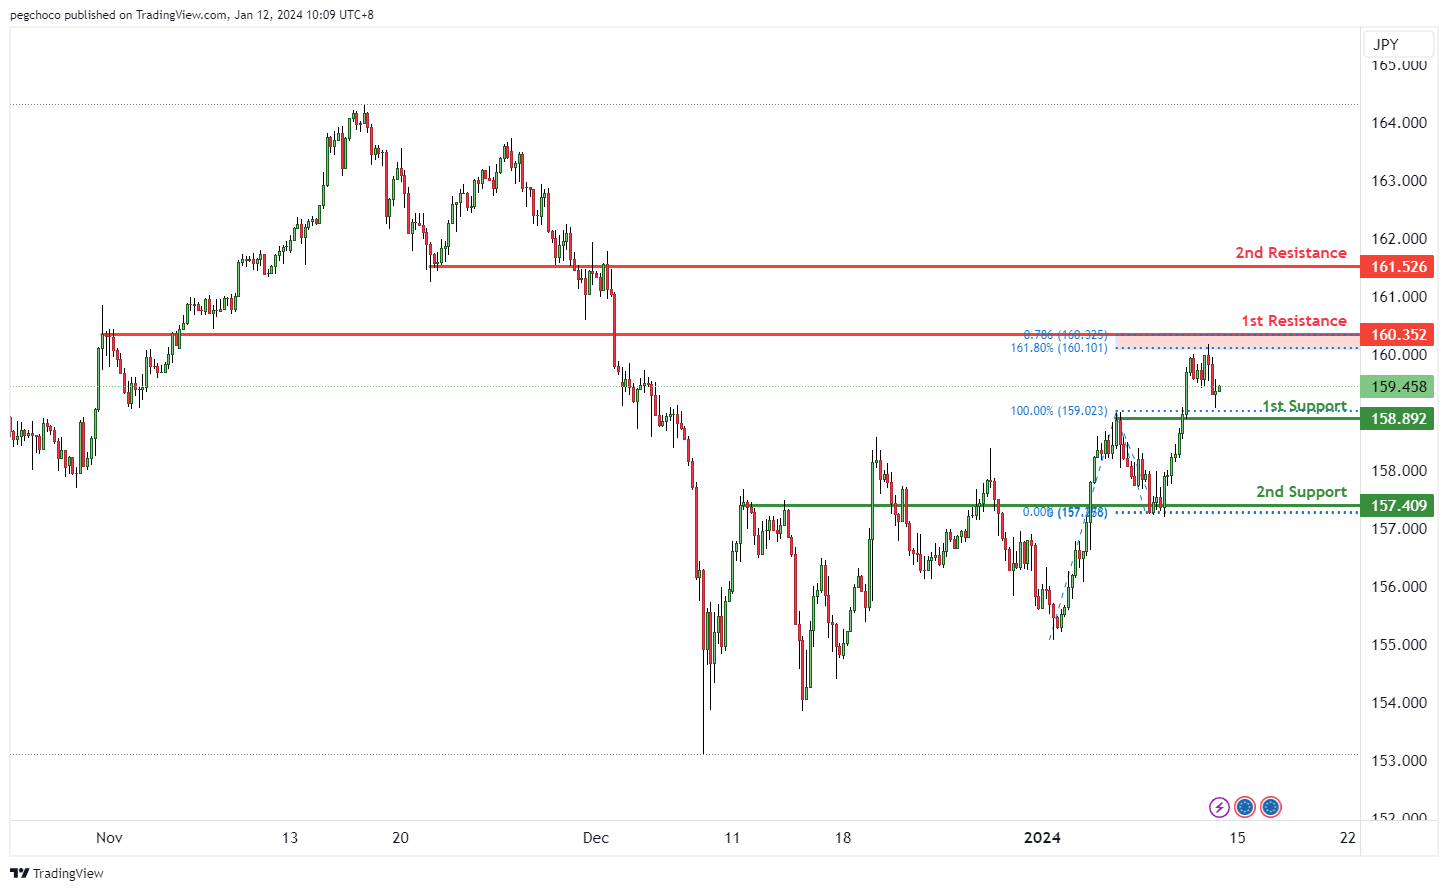
The EUR/JPY chart currently maintains a bullish overall momentum, indicating strength in the Euro relative to the Japanese Yen. This momentum suggests the potential for a bullish bounce off the 1st support level with a subsequent move towards the 1st resistance level.
The 1st support at 158.89 is identified as a pullback support, making it a significant level where buyers may step in, providing temporary support for EUR/JPY. Additionally, this level aligns with the 161.80% Fibonacci Extension and the 78.60% Fibonacci Projection, indicating a confluence of Fibonacci levels, further reinforcing its importance as a potential support zone.
Furthermore, there is a 2nd support at 157.40, categorized as an overlap support, which adds to its significance as a potential support area.
On the resistance side, the 1st resistance at 169.35 is marked as a pullback resistance, where selling interest may emerge, and it also aligns with the 161.80% Fibonacci Extension and the 78.60% Fibonacci Projection, indicating Fibonacci confluence.
The 2nd resistance at 161.52 is categorized as an overlap resistance, which may act as a barrier to any further upward price movement.
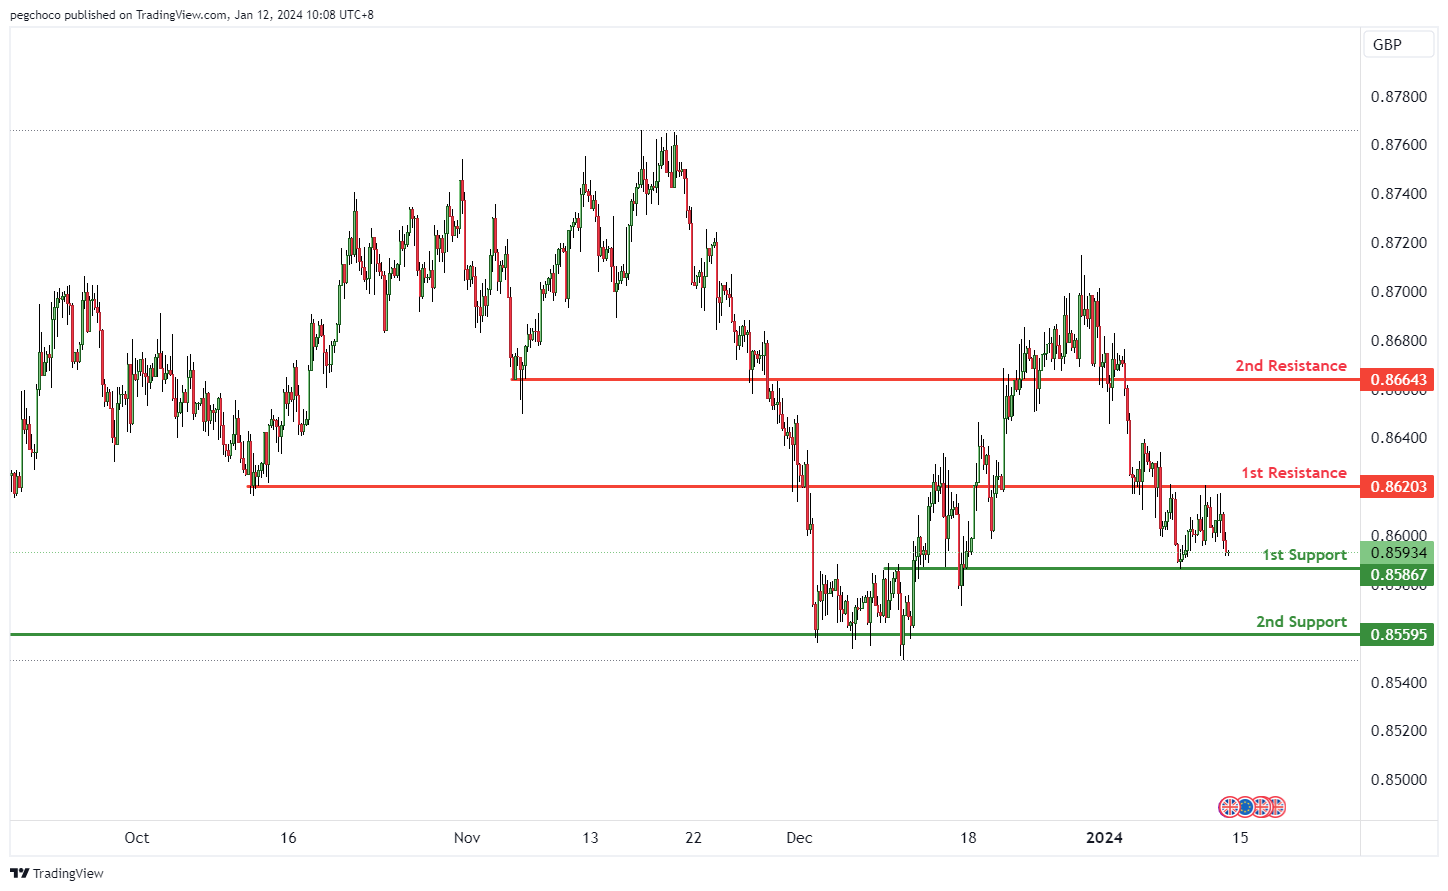
EUR/GBP:
The EUR/GBP chart currently exhibits a bearish overall momentum, indicating weakness in the Euro relative to the British Pound. This momentum suggests the potential for a bearish continuation towards the 1st support level.
The 1st support at 0.8586 is marked as an overlap support, indicating a level where buyers may find interest and temporarily halt the bearish momentum.
Additionally, there is a 2nd support at 0.8559, categorized as multi-swing low support, which further strengthens its significance as a potential support zone.
On the resistance side, the 1st resistance at 0.8620 is identified as an overlap resistance, indicating a potential area where selling interest may emerge, causing a bearish reaction.
The 2nd resistance at 0.8664 is categorized as pullback resistance, reinforcing its significance as a potential barrier for any upward price movement.
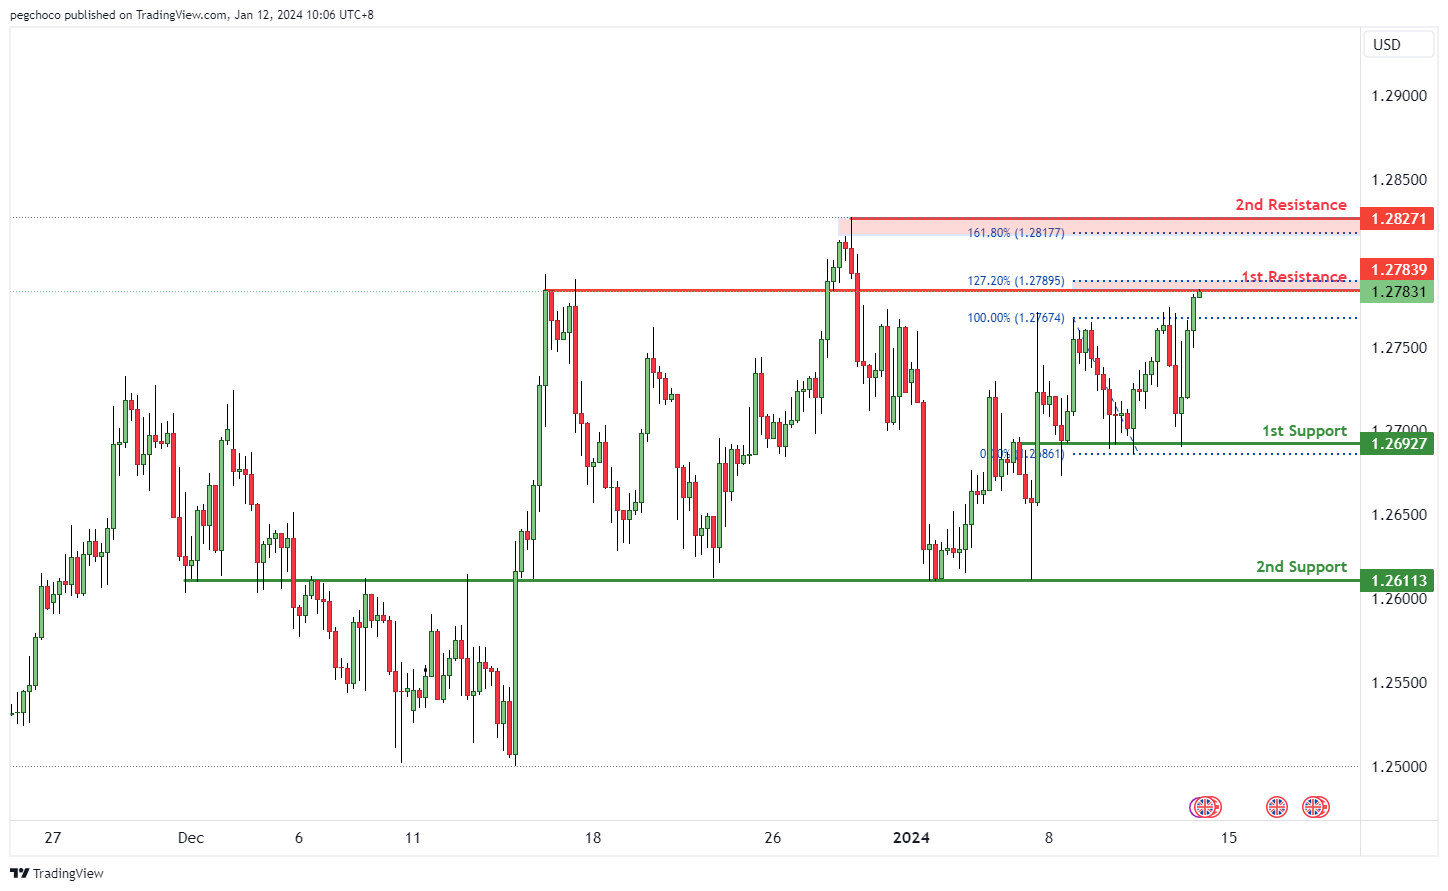
GBP/USD:
The GBP/USD chart currently shows a bearish overall momentum, indicating a stronger US Dollar relative to the British Pound. In the short term, there is a potential scenario where the price reacts bearishly off the 1st resistance level and drops towards the 1st support.
The 1st support at 1.2692 is identified as an overlap support, making it a significant potential support level where buyers may step in and provide temporary support for the GBP/USD pair.
The 2nd support at 1.2611 is also categorized as an overlap support, reinforcing its significance as a potential support area.
On the resistance side, the 1st resistance at 1.2783 is considered a pullback resistance and aligns with the 127.20% Fibonacci Extension level, making it a strong potential barrier for the price.
The 2nd resistance at 1.2827 is marked as a swing high resistance and aligns with the 161.80% Fibonacci Extension level, adding to its significance as a potential point of reversal or resistance.
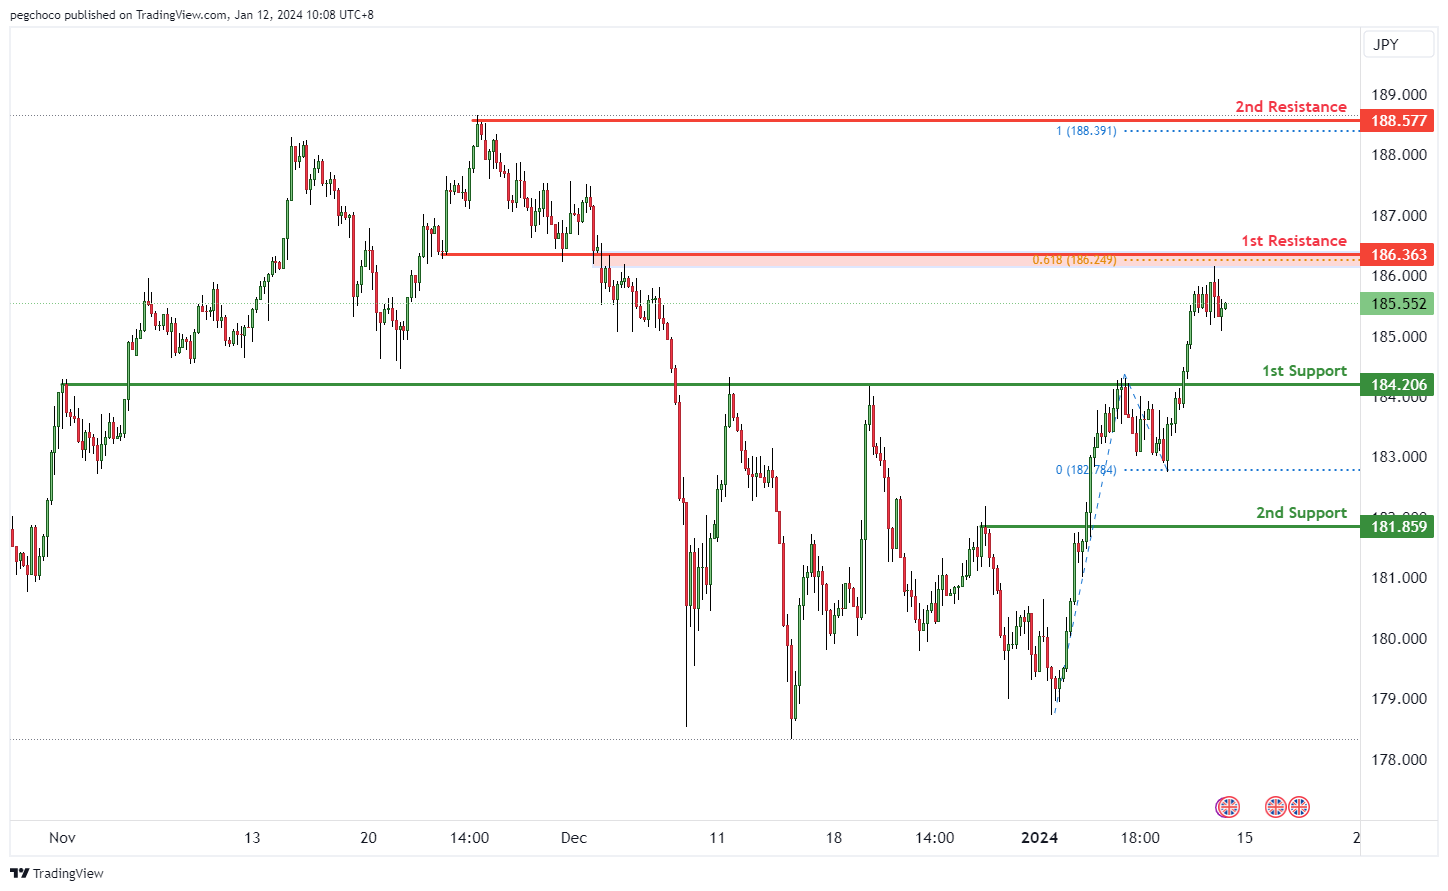
GBP/JPY:
The GBP/JPY chart currently has a bearish overall momentum, suggesting weakness in the British Pound relative to the Japanese Yen. This momentum indicates the potential for a bearish continuation towards the 1st support level.
The 1st support at 184.20 is identified as a pullback support, indicating a level where buyers might step in, providing temporary support for the GBP/JPY pair.
There is also a 2nd support at 181.85, categorized as pullback support as well, reinforcing its significance as a potential support area.
On the resistance side, the 1st resistance at 186.36 is marked as an overlap resistance, suggesting a potential area where selling interest may emerge, causing a bearish reaction.
The 2nd resistance at 188.57 is a swing high resistance and also aligns with the 100% Fibonacci Projection level, making it a strong potential barrier for further price advancement.
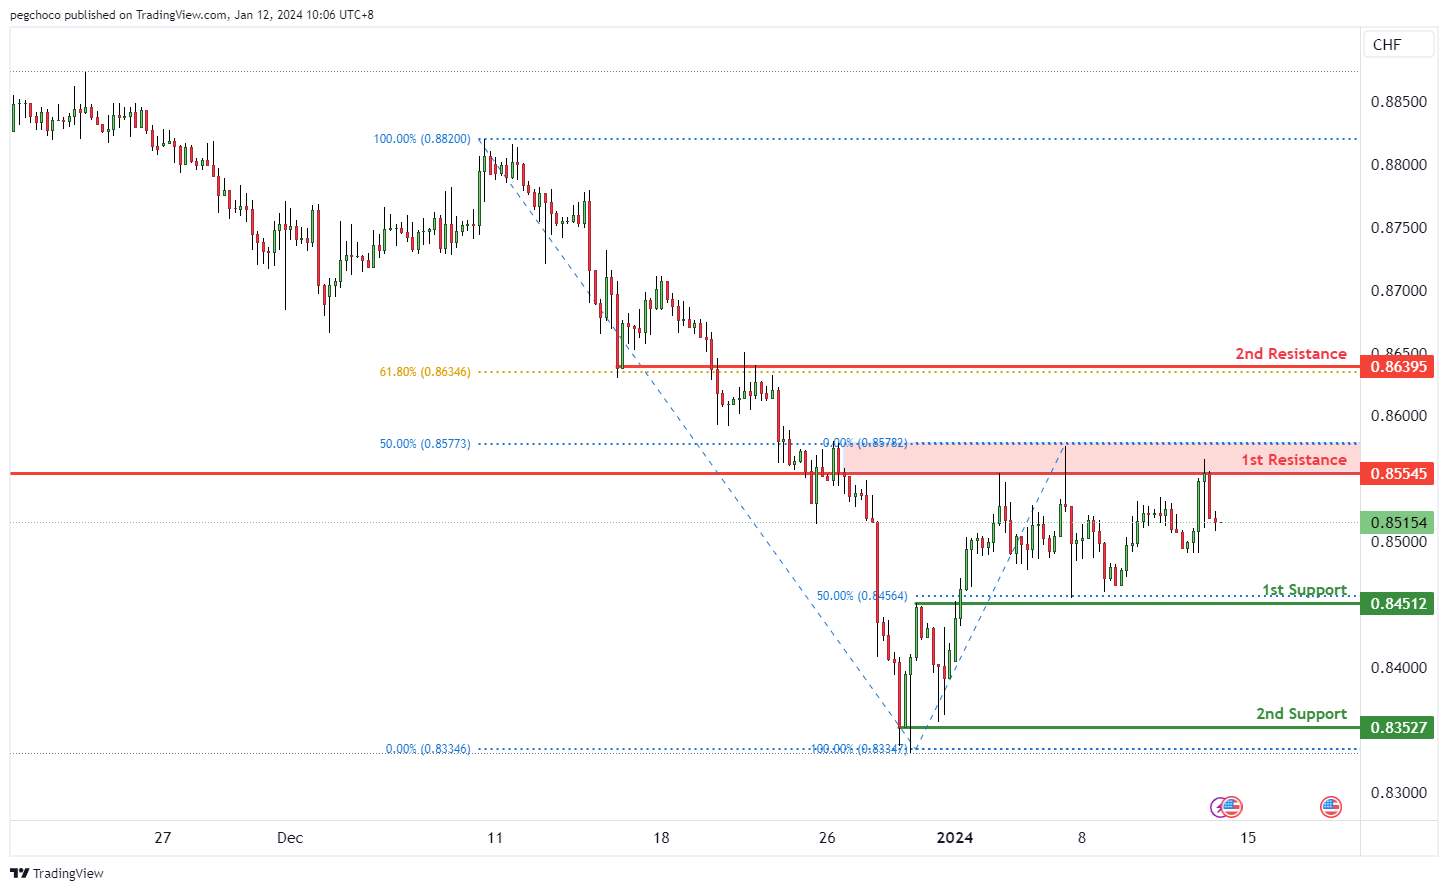
USD/CHF:
The USD/CHF chart currently exhibits a bearish overall momentum, suggesting a stronger Swiss Franc compared to the US Dollar. There is potential for a bearish continuation towards the 1st support level.
The 1st support at 0.8451 is considered an overlap support and aligns with the 50% Fibonacci Retracement level. This confluence of technical factors makes it a significant potential support zone, where selling pressure may temporarily abate, providing a potential bounce for USD/CHF.
The 2nd support at 0.8352 is categorized as multi-swing low support, further reinforcing its importance as a potential support area.
On the resistance side, the 1st resistance at 0.8554 is marked as an overlap resistance and coincides with the 50% Fibonacci Retracement level, making it a strong potential barrier for the price.
The 2nd resistance at 0.8639 is categorized as an overlap resistance and aligns with the 61.80% Fibonacci Retracement level, adding to its significance as a potential point of reversal or resistance.
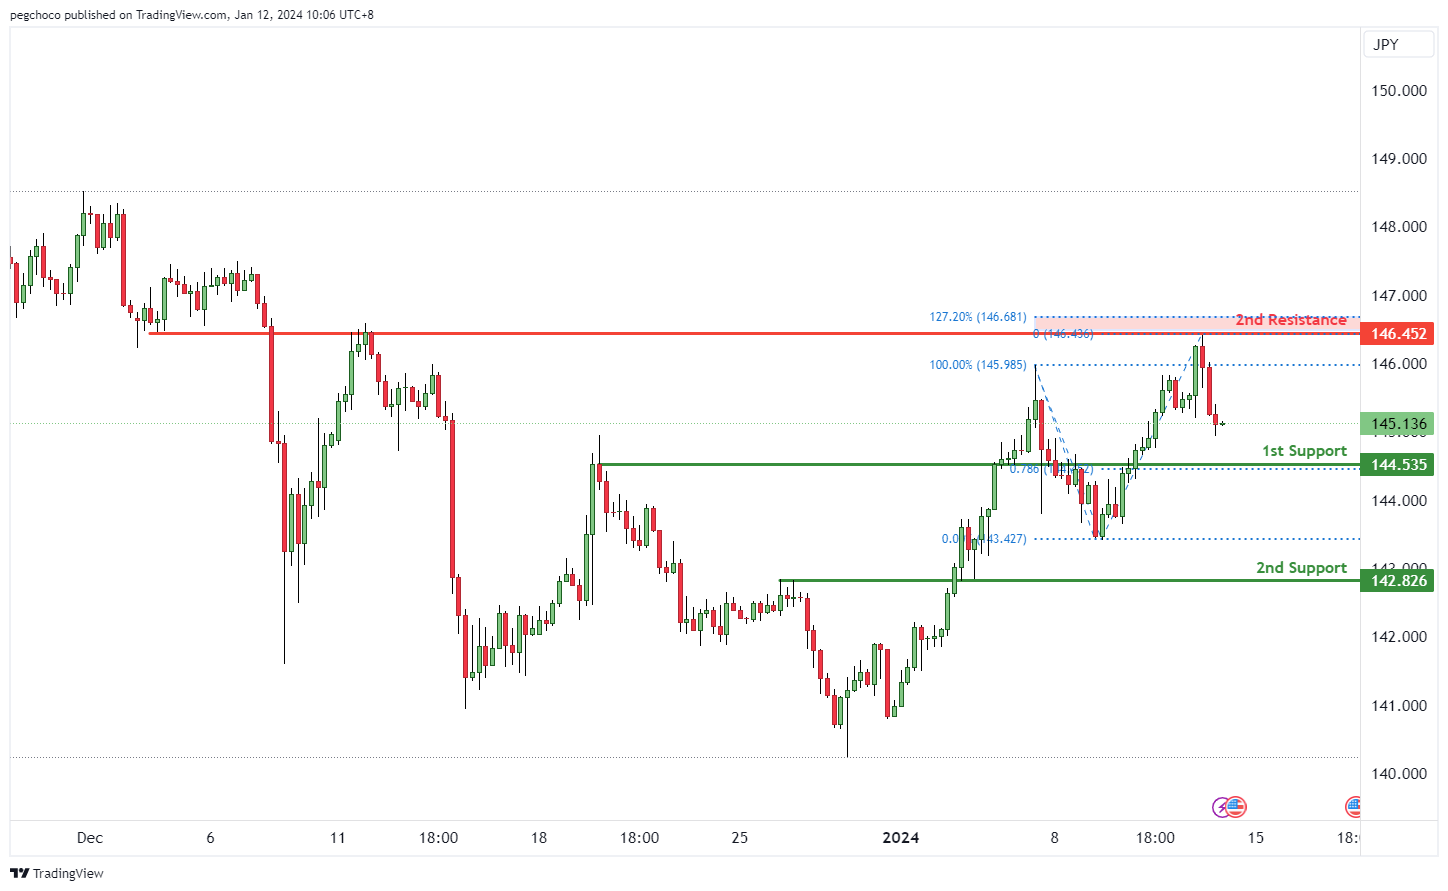
USD/JPY:
The USD/JPY chart currently displays a bearish overall momentum, indicating a weaker US Dollar compared to the Japanese Yen. This momentum suggests the potential for a bearish continuation towards the 1st support level.
The 1st support at 142.75 is identified as a pullback support and aligns with the 50% Fibonacci Retracement level. This level is significant as it suggests a potential area where buying interest may emerge, providing temporary support for USD/JPY.
The 2nd support at 140.73 is categorized as multi-swing low support, further reinforcing its significance as a potential support zone.
On the resistance side, the 1st resistance at 145.34 is marked as a swing high resistance. Swing highs often act as points of reversal or resistance in price movement.
The 2nd resistance at 146.56 is categorized as an overlap resistance, adding to its significance as a potential barrier for the price.'
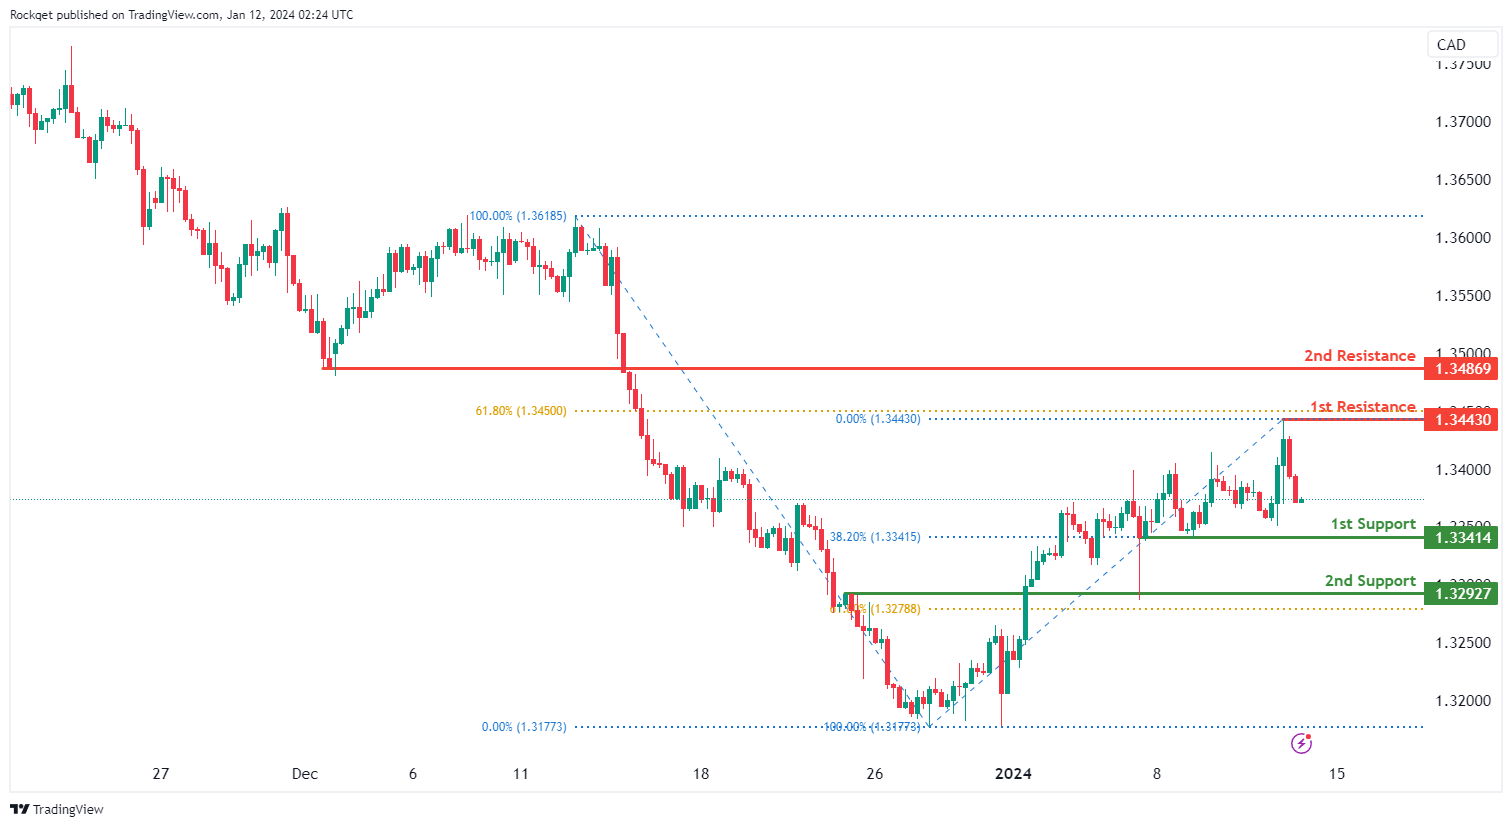
USD/CAD:
The USD/CAD chart currently exhibits an overall bullish momentum. However, there is a potential scenario for price to fall towards the 1st support before making a bullish bounce.
The 1st support level at 1.3341 is identified as a pullback support that aligns with the 38.20% Fibonacci retracement level. Further below, the 2nd support level at 1.3292 is marked as an overlap support that aligns close to the 61.80% Fibonacci retracement level, further reinforcing its importance as a key support level.
To the upside, the 1st resistance level at 1.3443 is identified as a pullback resistance that aligns close to the 61.80% Fibonacci retracement level. Higher up, the 2nd resistance level at 1.3486 is also noted as a pullback resistance, further reinforcing its significance as a potential resistance zone.
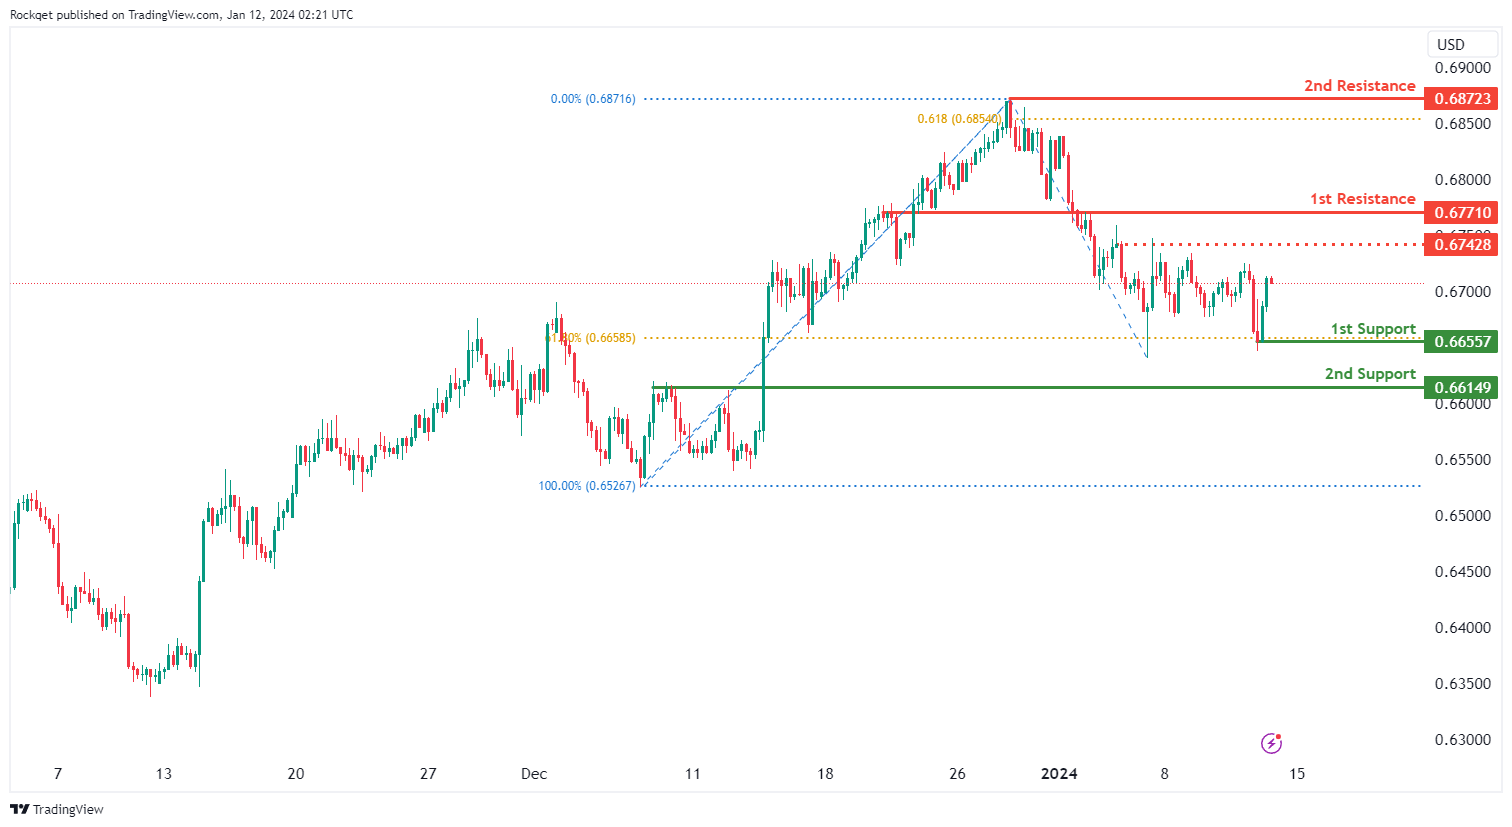
AUD/USD:
The AUD/USD chart currently exhibits a neutral bias. However, there is a potential scenario for price to make a bullish rise towards the 1st resistance should it break above the intermediate resistance.
The intermediate resistance level at 0.6742 is identified as a pullback resistance while the 1st resistance level at 0.6771 is identified as an overlap resistance. Higher up, the 2nd resistance level at 0.6872 is noted as a swing-high resistance that aligns close to the 61.80% Fibonacci projection level, suggesting a potential barrier for further upside movement.
To the downside, the 1st support level at 0.6655 is identified as a pullback support that aligns with the 61.80% Fibonacci retracement level. Further below, the 2nd support level at 0.6614 is also marked as an pullback support, further reinforcing its importance as a key support level.
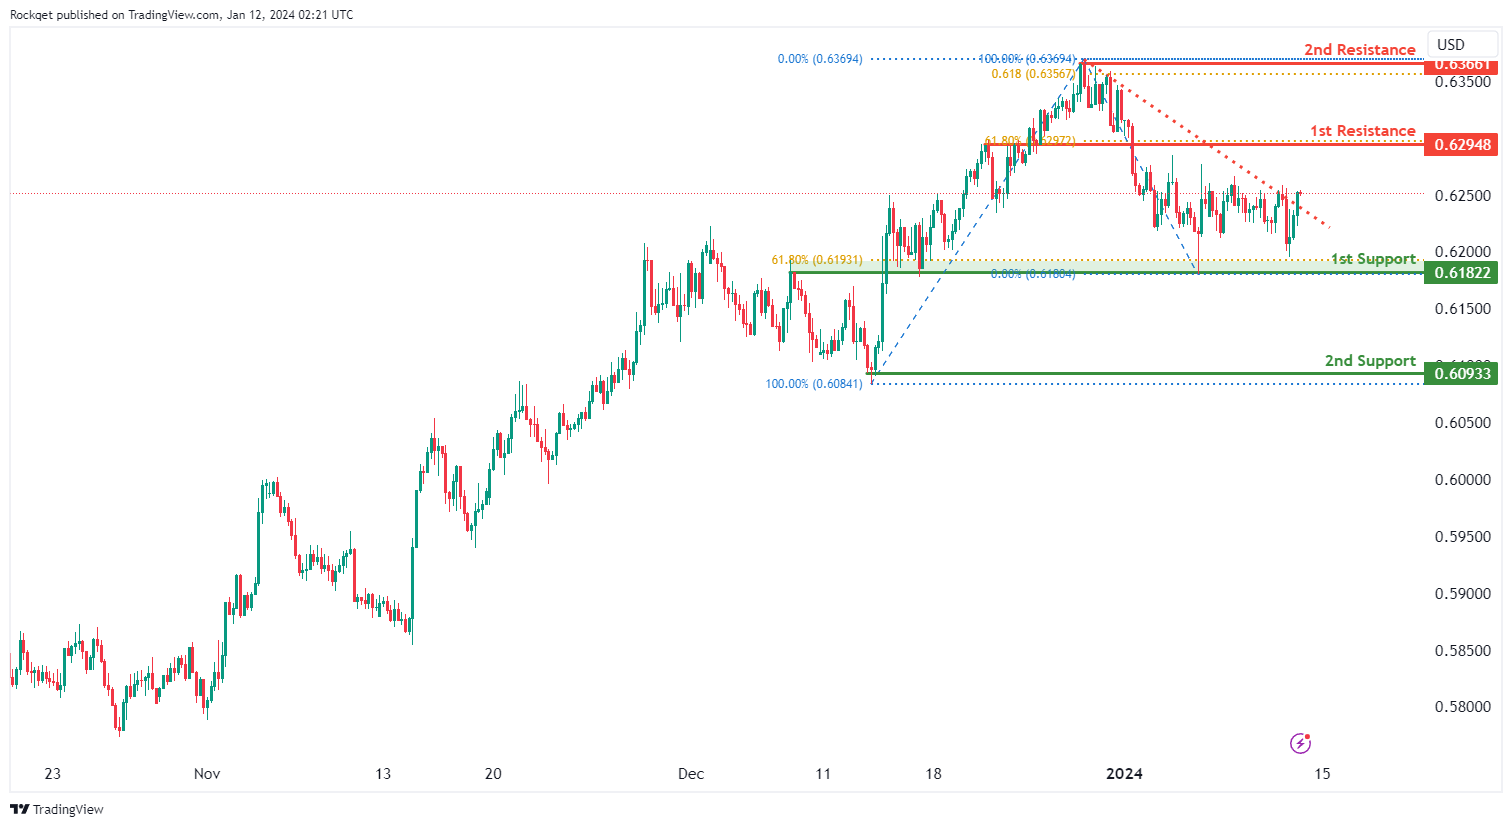
NZD/USD
The NZD/USD chart currently exhibits a neutral bias. However, there is a potential scenario for price to make a bullish rise towards the 1st resistance should it break above the descending trendline.
The 1st resistance level at 0.6294 is identified as an overlap resistance that aligns with the 61.80% Fibonacci retracement level. Higher up, the 2nd resistance level at 0.6366 is noted as a swing-high resistance that aligns close to the 61.80% Fibonacci projection level, suggesting a potential barrier for further upside movement.
To the downside, the 1st support level at 0.6182 is identified as an overlap support that aligns close to the 61.80% Fibonacci retracement level. Further below, the 2nd support level at 0.6093 is marked as a swing-low support, further reinforcing its importance as a key support level.
DJ30:
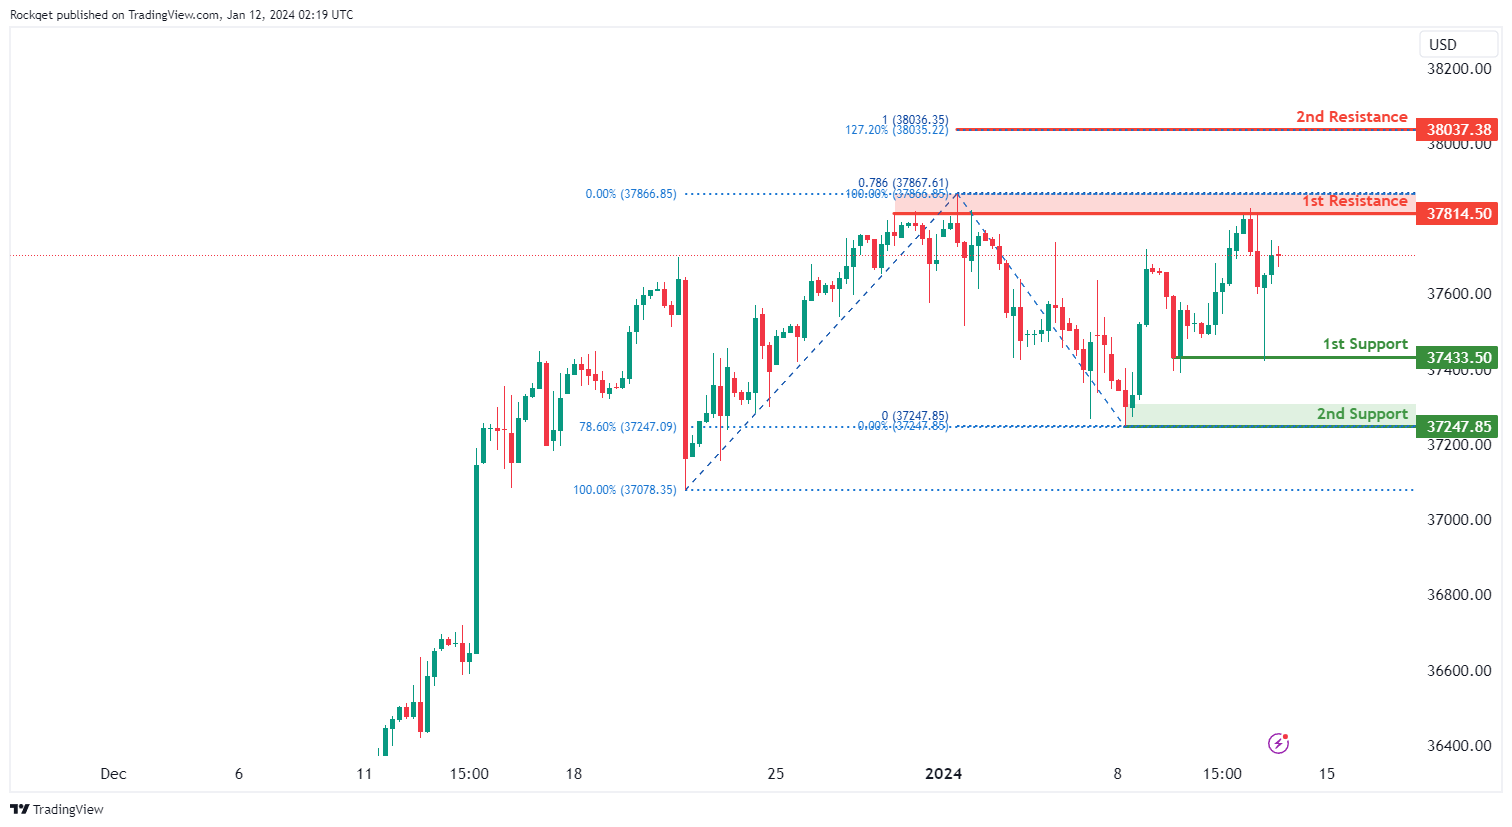
The DJ30 chart currently displays an overall bullish momentum. In this context, there is a potential scenario for price to make a bullish continuation towards the 1st resistance.
The 1st resistance level at 37,814.50 is identified as a pullback resistance that aligns close to the 78.60% Fibonacci projection level. Higher up, the 2nd resistance level at 38,037.38 is recognized as a resistance that aligns with a confluence of Fibonacci levels i.e. the 127.20% extension and the 100.00% projection, adding significance to this potential resistance level.
On the support side, the 1st support level at 37,433.50 is identified as a pullback support. Further below, the 2nd support level at 37,247.85 is also recognized as a pullback support that aligns with the 78.60% Fibonacci retracement level, further adding to its potential as a key support zone.
GER40:
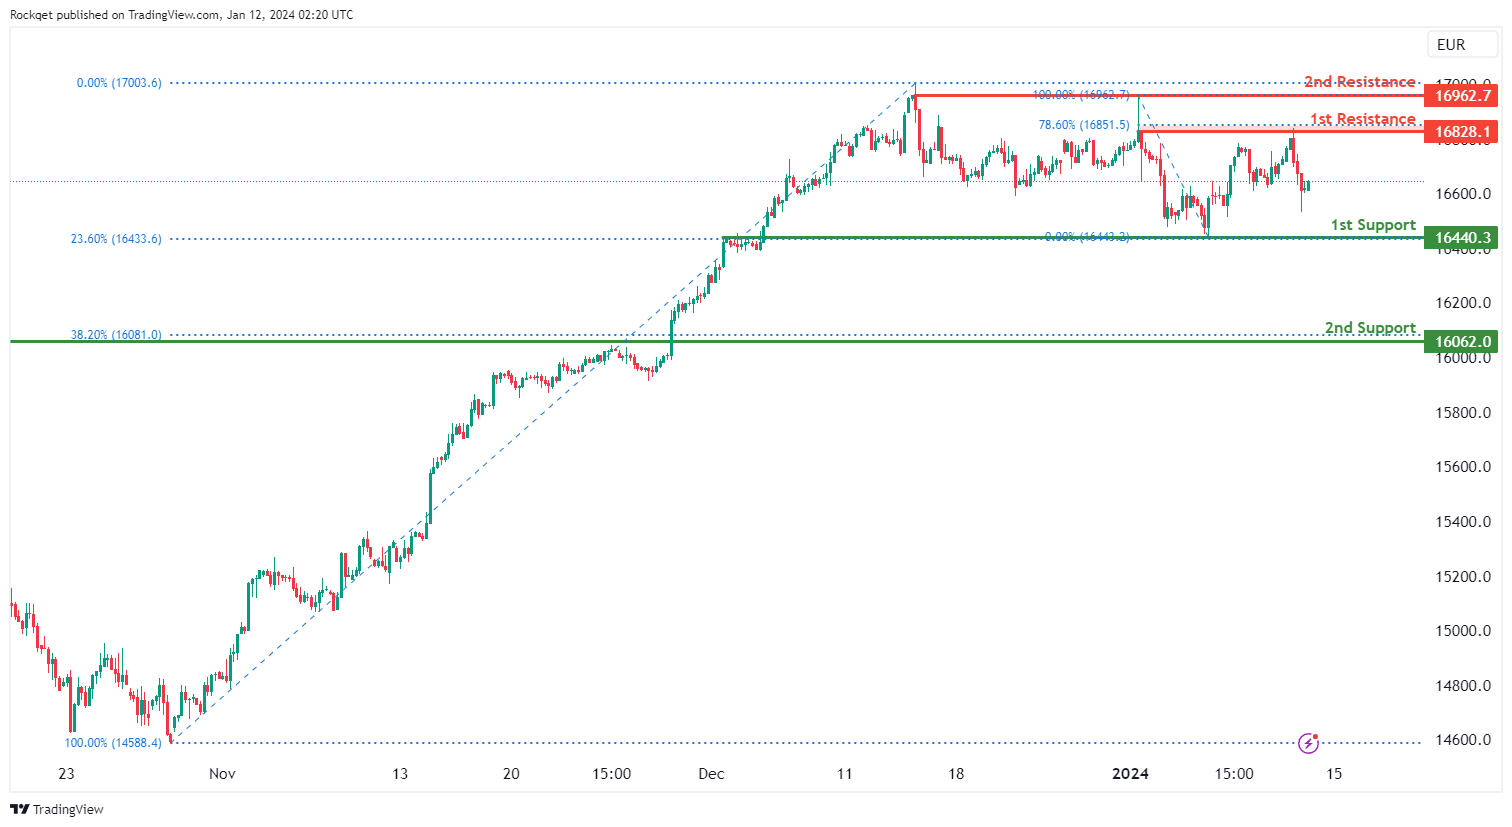
The GER40 chart currently displays an overall bullish momentum. In this context, there is a potential scenario for price to make a bullish continuation towards the 1st resistance.
The 1st resistance level at 16,828.10 is identified as a pullback resistance that coincides with the 78.60% Fibonacci retracement level. Higher up, the 2nd resistance level at 16,962.70 is also noted as a pullback resistance, further reinforcing its potential as a barrier to upward movement.
On the support side, the 1st support level at 16,440.30 is identified as an overlap support that aligns with the 23.60% Fibonacci retracement level. The 2nd support level at 16,062.00 is recognized as a pullback support that aligns with the 38.20% Fibonacci retracement level, adding to its potential significance as a level of historical importance.
US500:
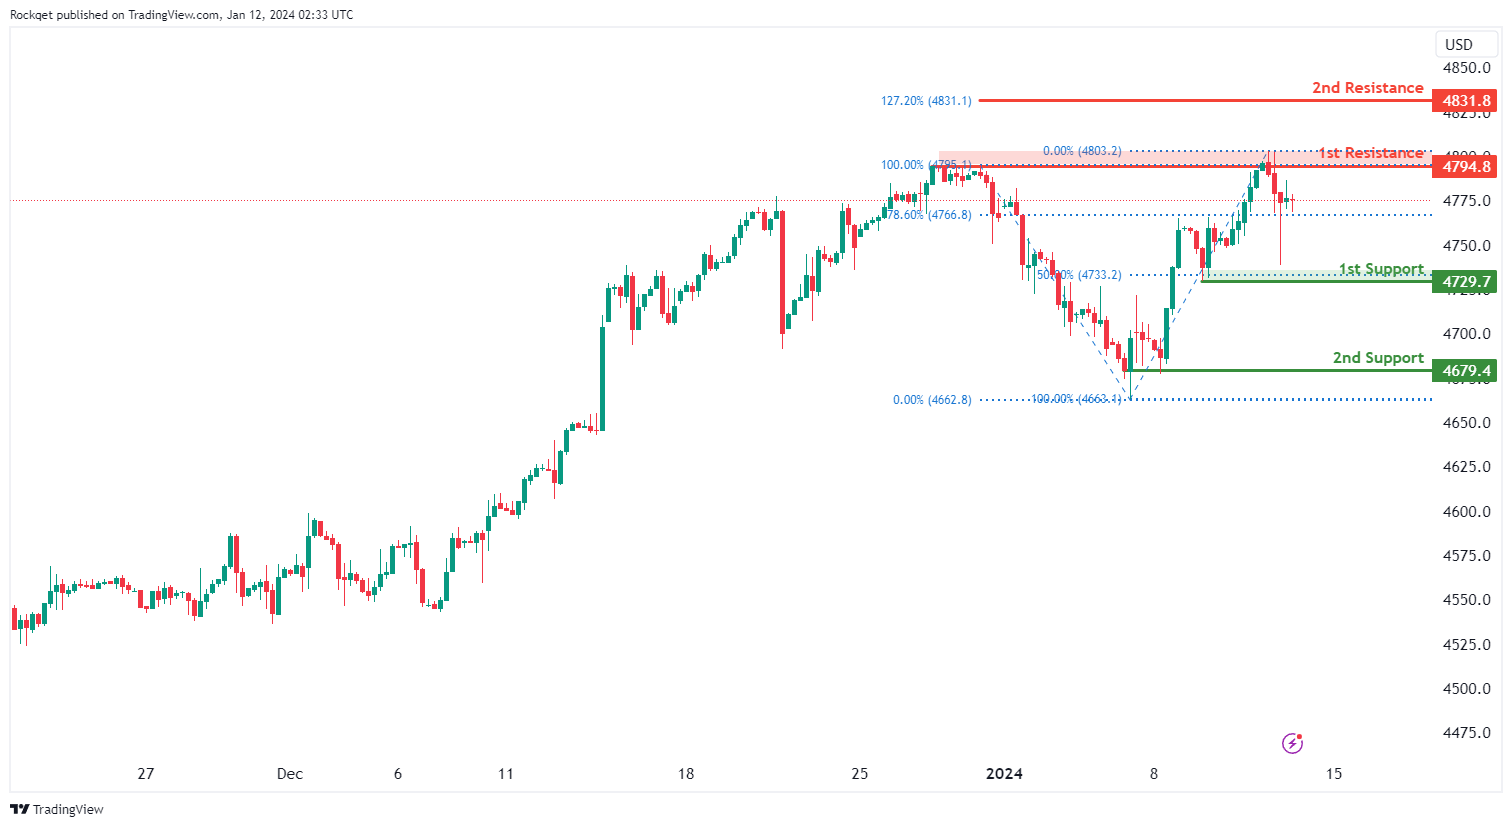
The US500 chart currently displays an overall bullish momentum. In this context, there is a potential for price to make a bullish continuation towards the 1st resistance.
The 1st resistance level at 4,794.80 is identified as a pullback resistance. Higher up, the 2nd resistance level at 4,831.80 is identified as a resistance that aligns with the 127.20% Fibonacci extension level.
On the support side, the 1st support level at 4,729.70 is identified as a pullback support that aligns with the 50.00% Fibonacci retracement level. Further below, the 2nd support level at 4,679.40 is recognized as a swing-low support, adding to its potential as a support level.'
BTC/USD:
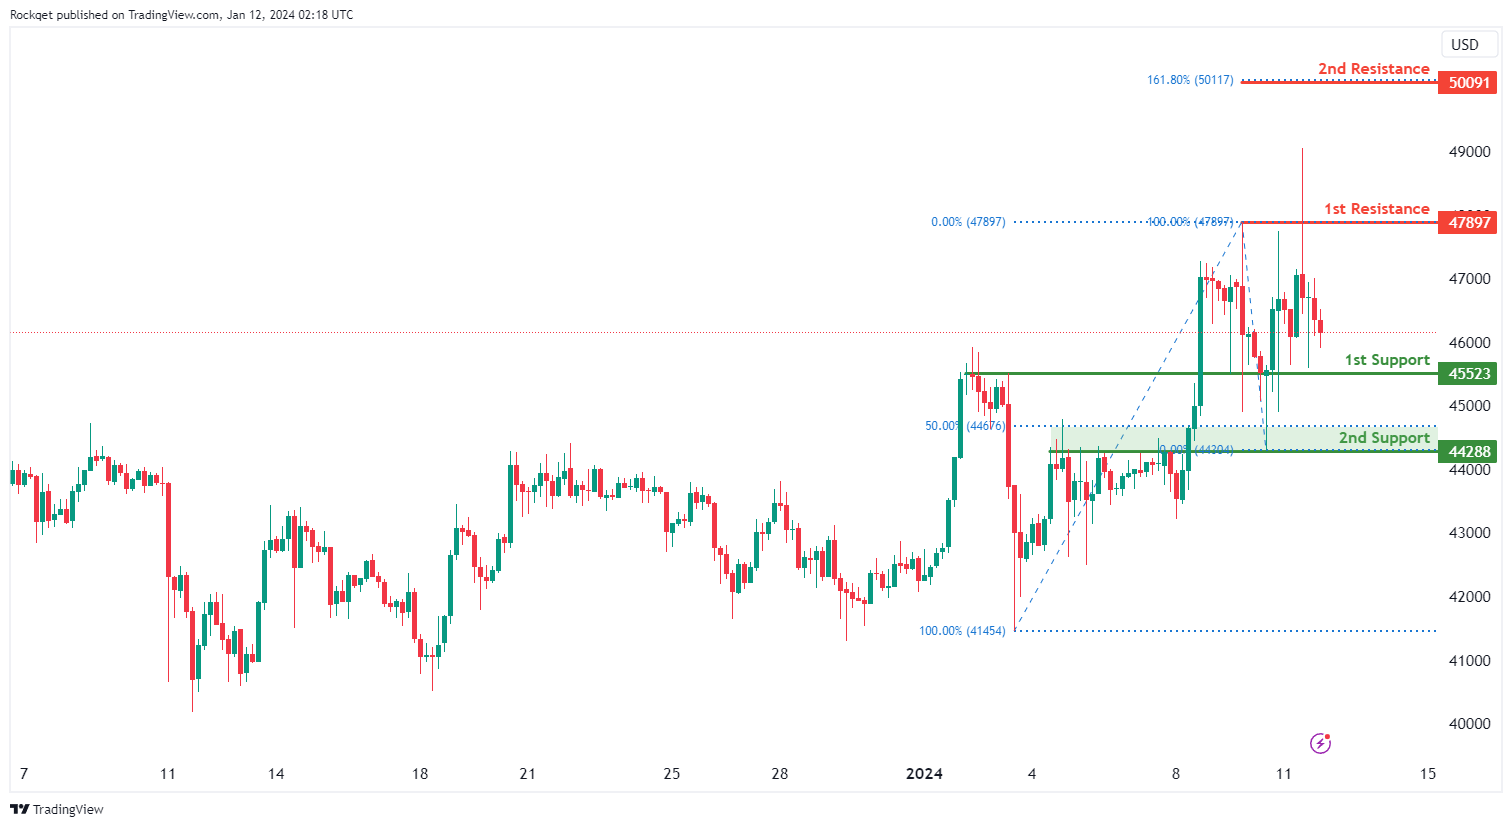
The BTC/USD chart currently exhibits a neutral bias, indicating a potential for price to fluctuate between the 1st resistance and the 1st support.
The 1st support level at 45,523 is identified as an overlap support. Further below, the 2nd support level at 44,288 is also recognized as an overlap support that aligns close to the 50.00% Fibonacci retracement level, adding to its potential as a key support.
On the resistance side, the 1st resistance level at 47,897 is identified as a pullback resistance. Higher up, the 2nd resistance level at 50,091 is recognized as a resistance that aligns with the 161.80% Fibonacci extension level, suggesting a level where selling interest could materialize.
ETH/USD:
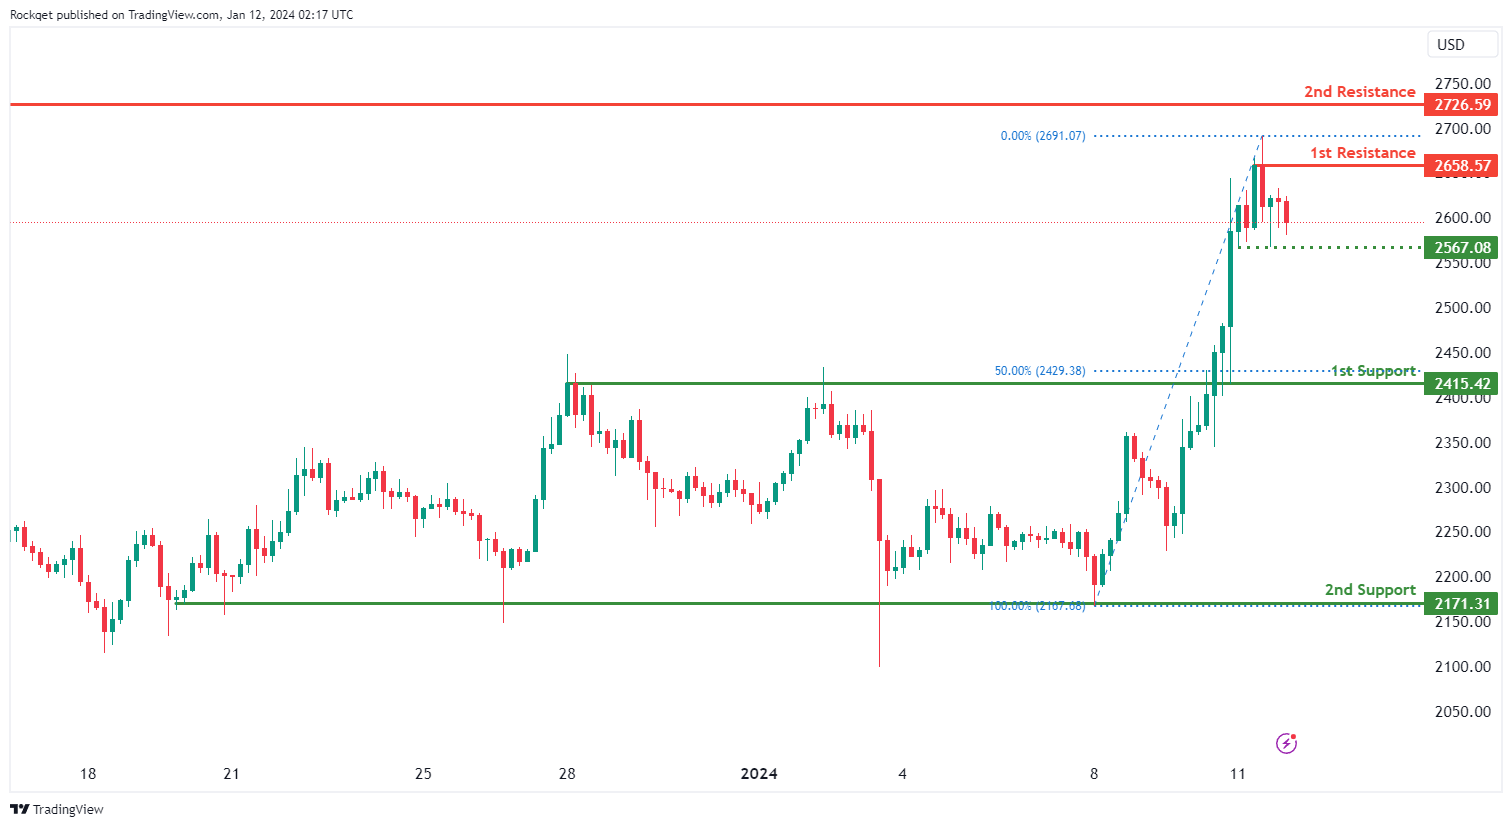
The ETH/USD chart currently exhibits an overall bullish momentum. However, there is a potential scenario for price to fall towards the intermediate support before making a bullish bounce.
The intermediate support level at 2,567.08 is identified as a pullback support while the 1st support level at 2,415.42 is also noted as a pullback support that aligns close to the 50.00% Fibonacci retracement level. Further below, the 2nd support level at 2,171.31 is recognized as a multi-swing-low support, adding to its potential as a key support.
On the resistance side, the 1st resistance level at 2,658.57 is identified as a pullback resistance. Higher up, the 2nd resistance level at 2,726.59 is also recognized as a pullback resistance, suggesting a potential barrier for further upside movement.
WTI/USD:
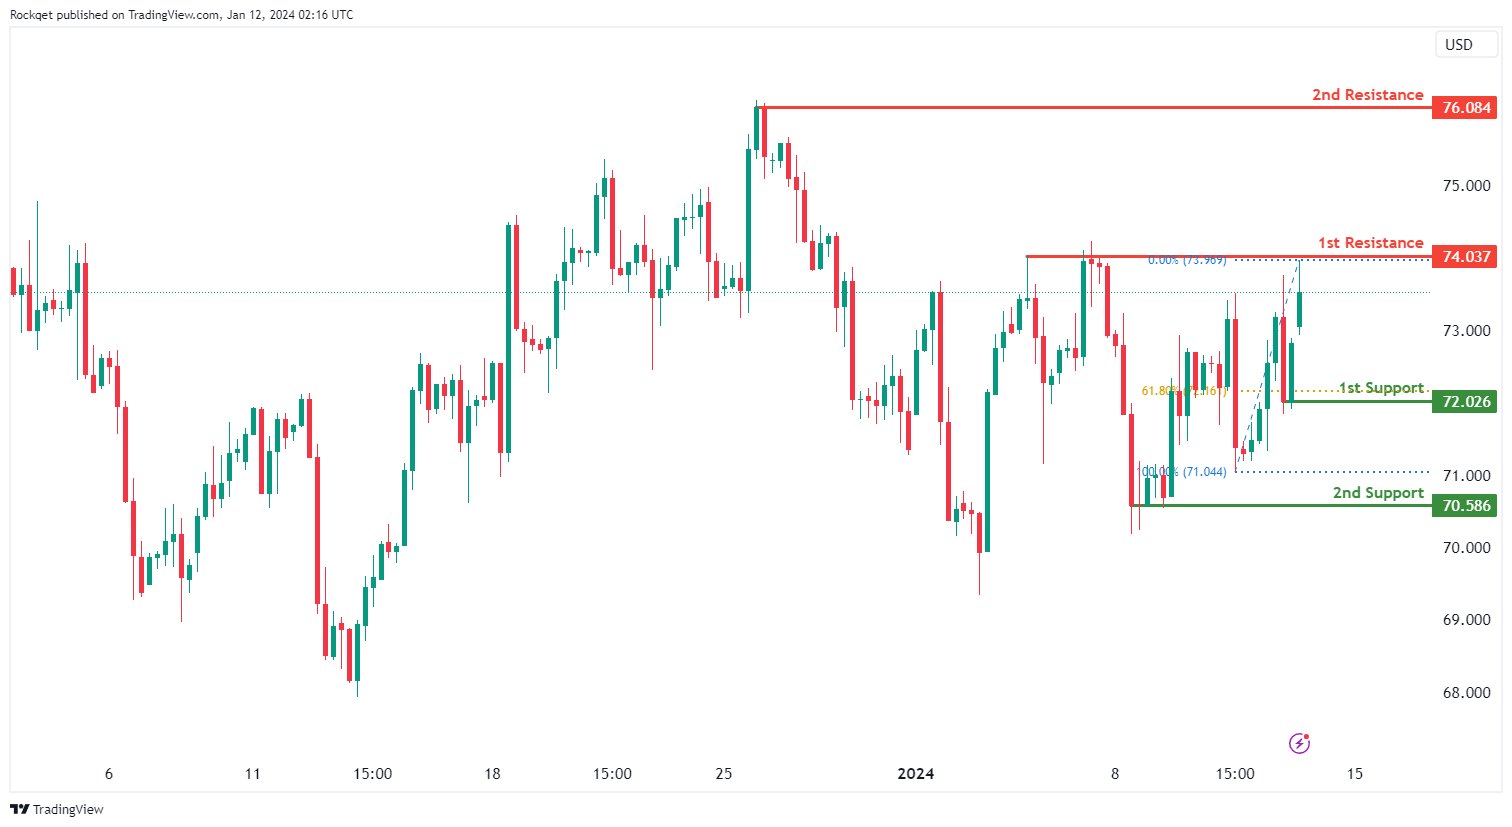
The WTI (West Texas Intermediate) chart currently exhibits a neutral bias, indicating a potential for price to fluctuate between the 1st resistance and the 1st support.
The 1st resistance level at 74.03 is identified as a pullback resistance. Higher up, the 2nd resistance level at 76.08 is noted as a swing-high resistance, suggesting a potential barrier for further upside movement.
To the downside, the 1st support level at 72.02 is identified as a pullback support that aligns close to the 61.80% Fibonacci retracement level. Further below, the 2nd support level at 70.58 is also marked as a pullback support, further reinforcing its importance as a key support level.
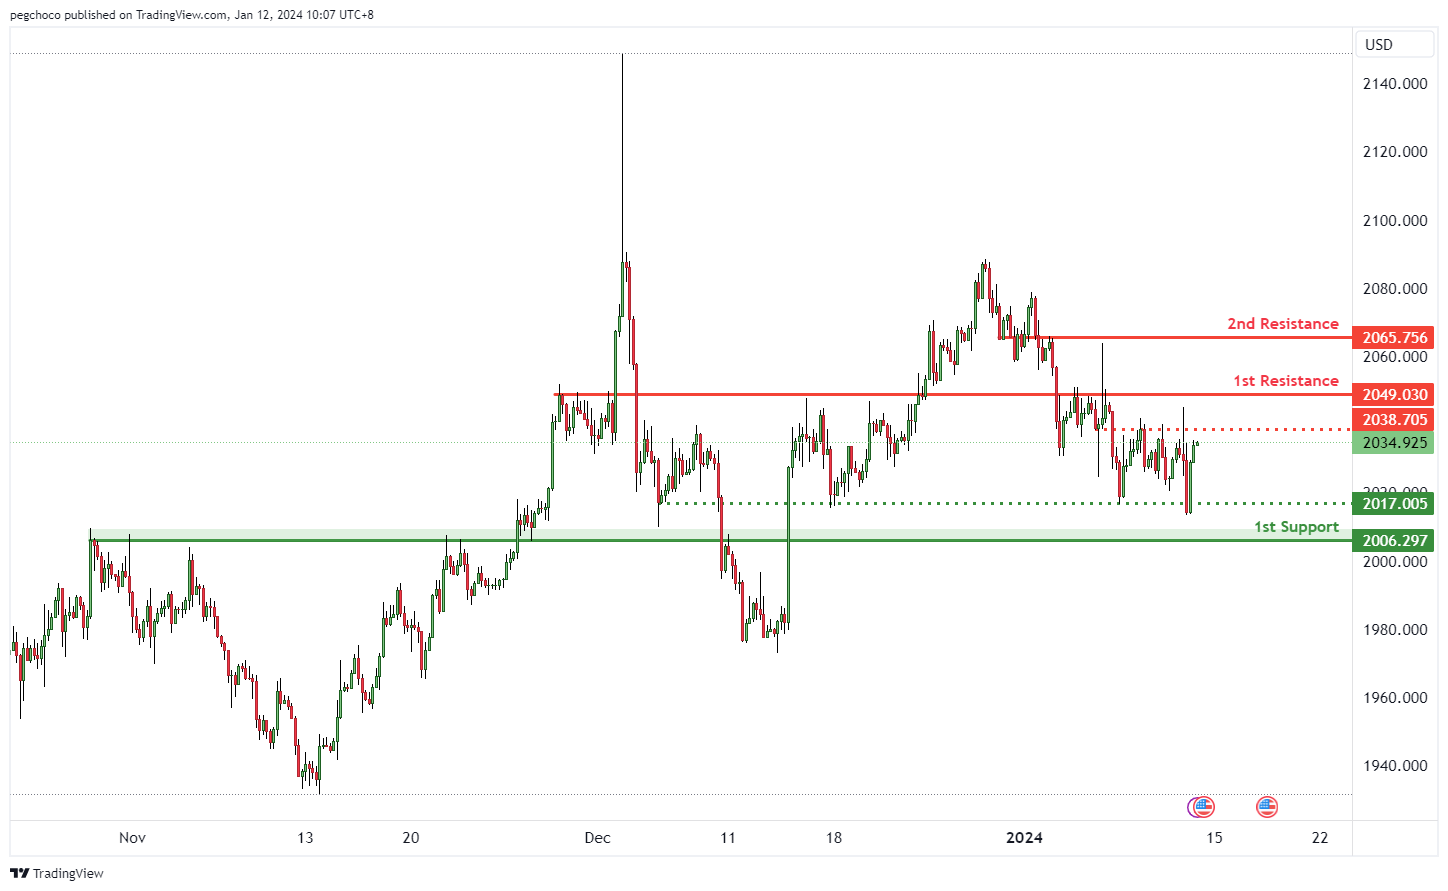
XAU/USD (GOLD):
The XAU/USD chart currently exhibits a bearish overall momentum, suggesting weakness in the price of Gold relative to the US Dollar. This momentum indicates the potential for a bearish reaction off the 1st resistance level, followed by a drop towards the 1st support level.
The 1st support at 2006.29 is identified as a pullback support, indicating a level where buyers might step in, providing temporary support for the XAU/USD pair.
There is also an intermediate support at 2017.00, which is categorized as a multi-swing low support, further reinforcing its significance as a potential support area.
On the resistance side, the 1st resistance at 2049.03 is considered an overlap resistance, suggesting a potential area where selling interest may emerge, leading to a bearish reaction.
The 2nd resistance at 2065.75 is another overlap resistance, indicating a potential barrier to further price advancement.
Additionally, there is an intermediate resistance at 2038.44, marked as an overlap resistance, further adding to the potential resistance levels for XAU/USD.