

Sample Category Title
ECB’s Lagarde: We can now observe very attentively
ECB President Christine Lagarde, said at Bundesbank event today that the central bank has "already done a lot" in fighting inflation, referring to the series of rate hikes. Now, given the "amount of ammunition" being deployed, ECB is positioned to "observe very attentively".
With observations on how tightening have impacted people's economic life, ECB can decide, "how long we have to stay there and what decision we have to make — up or down, she added.
However, despite these efforts, Lagarde emphasized that "the battle is not over and we're certainly not declaring victory."
Is Gold Forming a Double Top Pattern?
- Gold gets rejected a tad below its recent 5-month peak
- A failure to claim that level could validate a double top structure
- While momentum indicators remain tilted to the upside
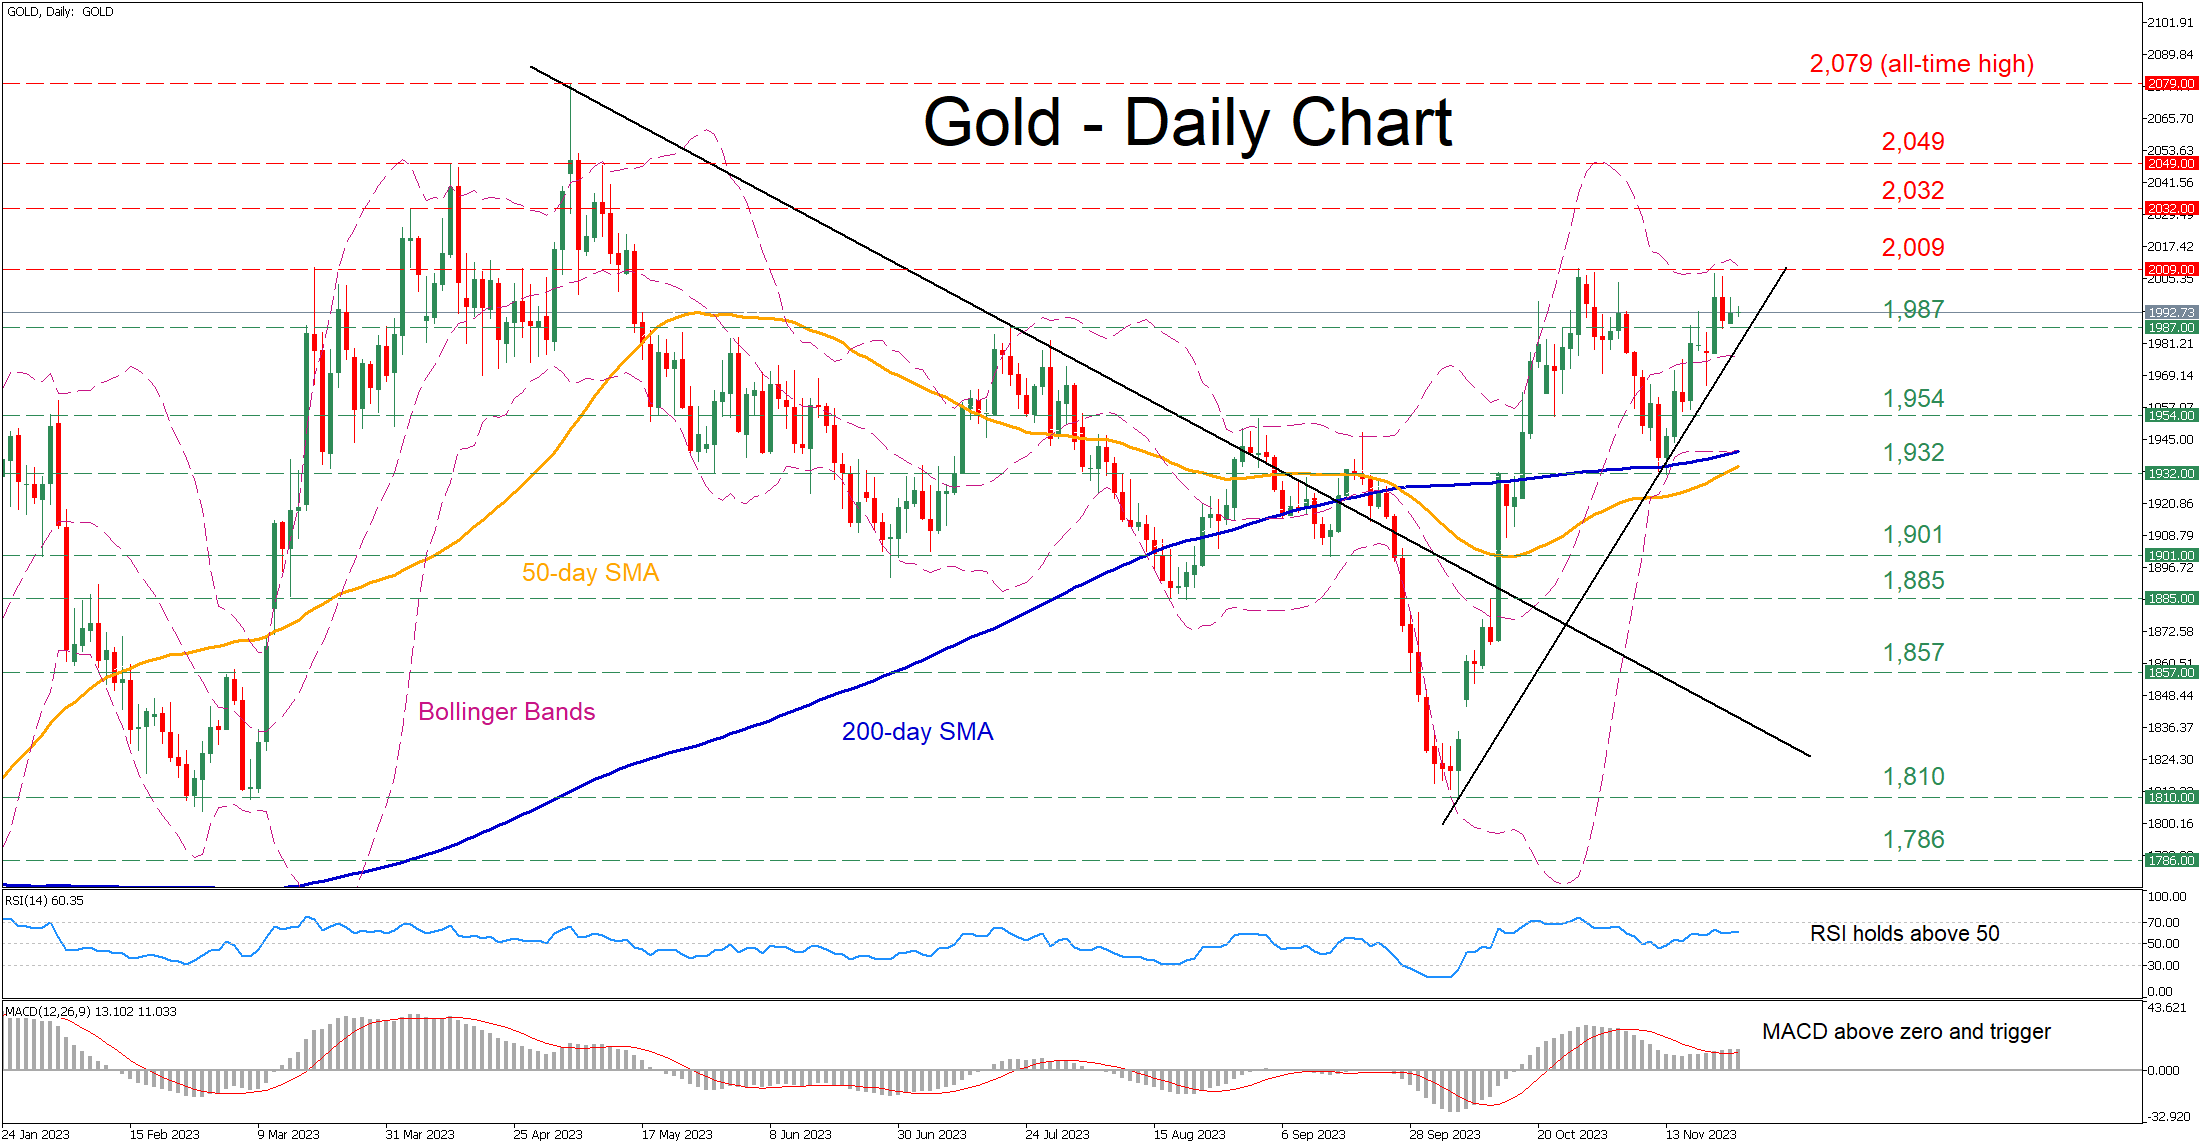
Gold had been in a steep uptrend since November 10, when the price bounced off the crucial 200-day simple moving average (SMA). The latest rally seems to be faltering though after bullion failed to surpass its five-month high of 2,009, but the short-term oscillators suggest that buyers have not given up yet.
Should the bulls attempt to push the price higher, the recent five-month peak of 2,009 could be the first barrier for them to conquer. A break above that territory could bring the April resistance of 2,032 under examination. Surpassing that region, bullion could then challenge the April-May resistance zone of 2,049.
On the flipside, bearish actions could send the price lower towards the July resistance of 1,987, which could serve as support in the future. Further declines might then cease at the October support of 1,954. Failing to halt there, gold could challenge its November bottom of 1,932.
In brief, gold’s failure to post a fresh higher high after testing its previous five-month peak is increasing the odds of a double top pattern. Should that scenario materialize, it could be the beginning of a downside correction.
Germany 30 Technical: Bullish Momentum Remains Intact
- Key elements remain positive that support the ongoing short-term uptrend phase.
- Watch the key short-term support at 15,930.
- Next intermediate resistance stands at 16,200.
Since its bullish breakout from its former medium-term descending channel resistance last Tuesday, 14 November, the price actions of the Germany 30 Index (a proxy for the DAX futures) have continued to exhibit positive elements.
Oscillating within a short-term uptrend phase since end of October 2023
Firstly, it has continued to oscillate within the upper half of a minor ascending channel in place since the 27 October 2023 low of 14,586.
Secondly, the hourly RSI momentum indicator managed to stage a rebound from key parrel support at the 45 level without any prior bearish divergence condition at its overbought condition which suggests that short-term bullish momentum remains intact.
Watch the 15,930 key short-term pivotal support (the median line of the minor ascending channel & minor congestion area of 21/23 November 2023 and a clearance above 16,050 near-term resistance sees the next intermediate resistance coming in at 16,200 (upper boundary of the minor ascending channel & Fibonacci extension cluster.
On the flip side, failure to hold at 15,930 negates the bullish tone for a minor corrective decline towards the next intermediate support zone of 15,660/560 (also the 200 and 20-day moving averages).
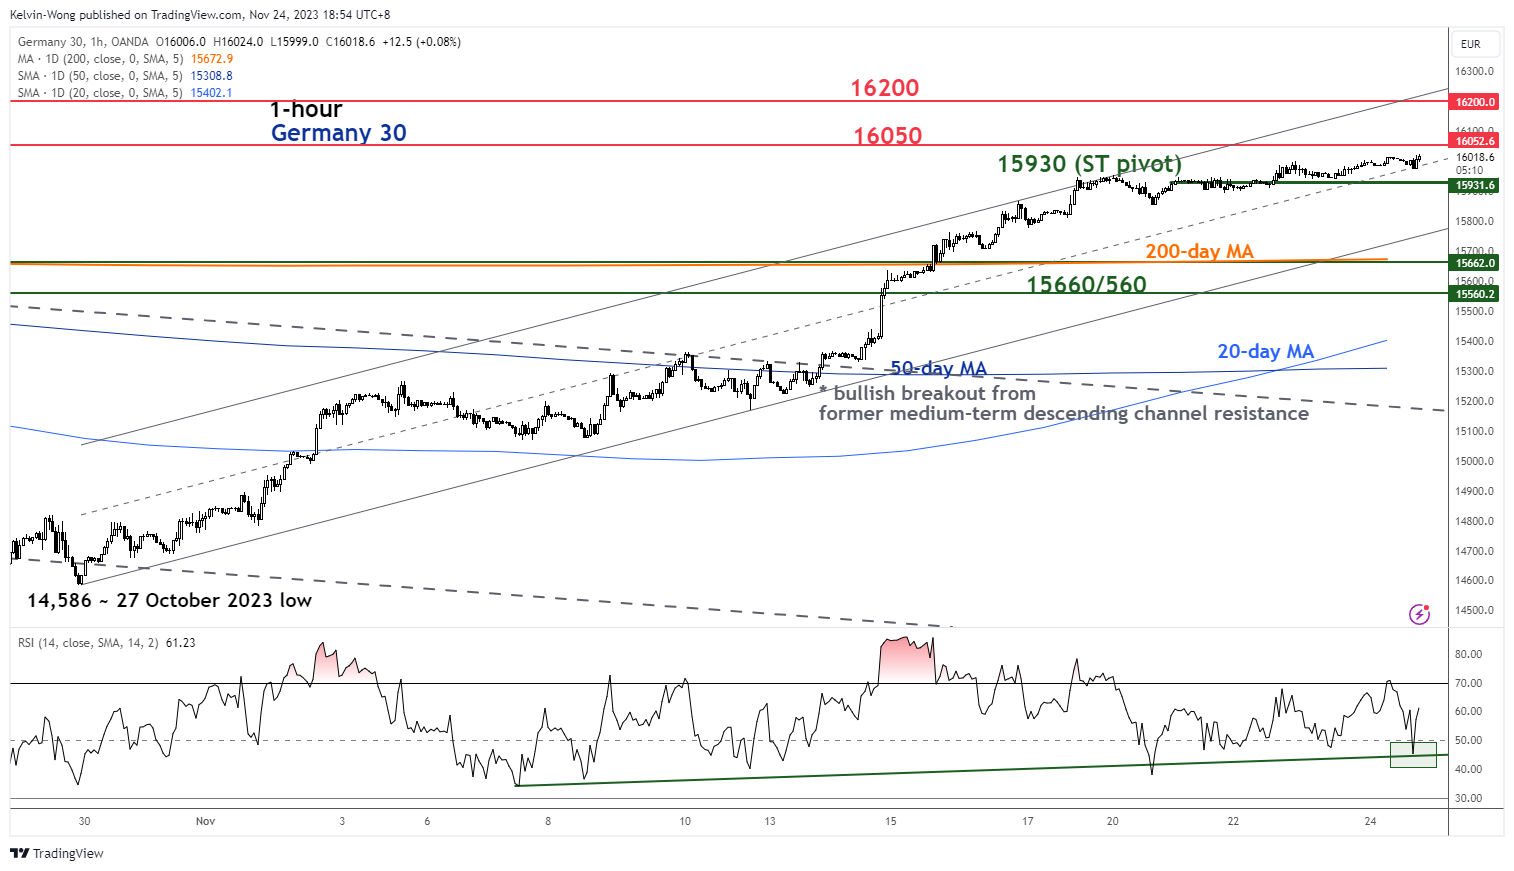
Fig 1: Germany 30 minor short-term trend as of 24 Nov 2023 (Source: TradingView, click to enlarge chart)
EUR/USD Steady as German GDP Contracts
- German GDP shrinks in Q3
- US to release manufacturing and services PMIs
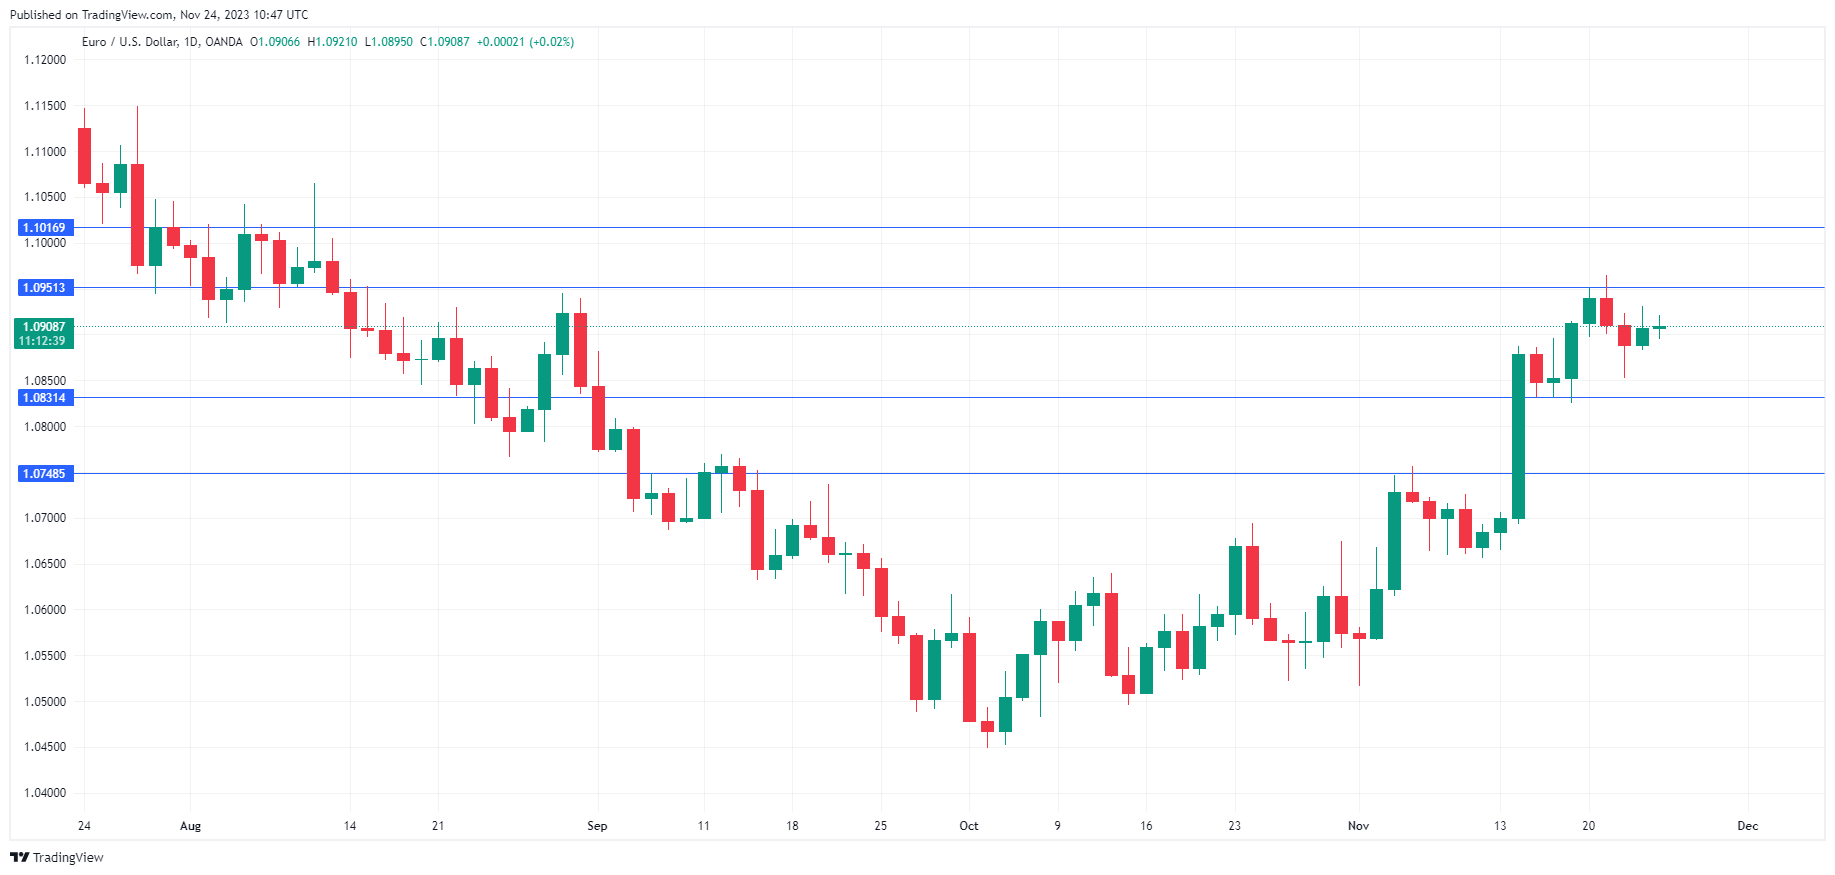
The euro is almost unchanged on Friday. In the European session, EUR/USD is trading at 1.0903, down 0.03%.
German economy declines
German GDP posted a minor drop in the third quarter, coming in at -0.1% q/q. This was down slightly from -0.1% in the second quarter and matched the market consensus. On an annualized basis, GDP declined by 0.4%, down from a revised o.1% gain in Q2 and missing the market consensus of -0.3%. The consumer spending component of GDP decelerated in the third quarter and was a key driver of the decline in GDP. German consumers remain in a sour mood and are being squeezed by rising interest rates and a high inflation rate of 3.8%.
The German business sector is also pessimistic about economic conditions. The Ifo Business Climate index managed to climb to 87.3 in November, up from 86.9 in October but below the market consensus of 87.5. A reading below 100 indicates that a majority of the companies surveyed expect business conditions to deteriorate in the next six months. Earlier this week, German services and manufacturing PMIs pointed came in below 50, which points to contraction. The manufacturing sector is particularly weak and has been in decline since June 2022.
It has been a relatively light week for US releases, with markets back in action after the Thanksgiving holiday. Later today, the US releases manufacturing and services PMIs, with little change expected. Still, the markets will be watching carefully, as the data will provide insights into the strength of the US economy. The consensus estimates for November are 49.8 for manufacturing (Oct: 50.0) and 50.4 for services (Oct. 49.8). If the readings diverge significantly from the estimates, we could see some strong movement from the US dollar before the weekend.
EUR/USD Technical
- There is resistance at 1.0943 and 1.0997
- 1.0831 and 1.0748 are providing support
USD/JPY: Recovery Turns Sideways Between Daily Cloud Top and Psychological 150 Barrier
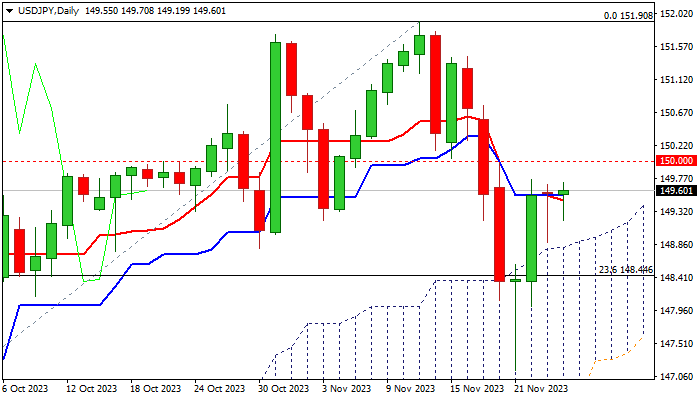
USDJPY is holding within a narrow consolidation for the second consecutive, with quiet mode seen as a result of lower volumes on closure of US markets for Thanksgiving Day holiday.
Recent recovery from 147.15 (Nov 21 low of correction from 151.90 peak) seems to be losing traction, despite formation of reversal pattern on daily chart and the action still being underpinned by thick ascending daily Ichimoku cloud.
Weakening studies on daily chart as14-d momentum returned to negative territory, with 10/20 and 10/30DMA bear-cross adding to initial warning of recovery stall under 150 barrier.
However, fresh signals require confirmation on penetration into daily cloud (cloud top lays at 148.90) and violation of Fibo support at 148.44 (23.6% retracement of 137.23/151.90 rally), to open way for attack at 147.15 (Nov 21 spike low) and expose pivotal supports at 146.73/30 (100DMA / Fibo 38.2%).
Fundamentals also contribute to such scenario, as narrowing rate gap between the Fed and BOJ and quick change in Fed’s rate outlook from further hikes towards rate cuts, may prompt traders to exit dollar longs and increase pressure on greenback.
Res: 150.00; 150.23; 151.00; 151.43.
Sup: 148.90; 148.44; 148.01; 147.15.
German Ifo business climate rose to 87.3, economy stabilizing
German Ifo Business Climate rose from 86.9 to 87.3 in November, slightly below expectation of 87.5. But that is still the third consecutive increase. Current Assessment index ticked up from 89.2 to 89.4, matched expectations. Expectations index also rose from 84.8 to 85.2, missed expectation of 85.7.
By sector, manufacturing rose from -15.7 to -13.5. Services fell from -1.5 to -2.5. Construction rose from -30.8 to -29.4. Trade rose from -27.3 to -22.2.
Ifo said: "The German economy is stabilizing, albeit at a low level."
NZD/USD Edges Higher as Retail Sales Beat Expectations
- New Zealand retail sales flatline in Q3
- US releases PMIs later today
The New Zealand dollar has posted slight gains on Friday. In the European session, NZD/USD is trading at 0.6059, up 0.17%. The New Zealand dollar is headed to a second-straight winning week and has sparkled in November, with gains of 4% against the US dollar.
New Zealand retail sales unchanged
The New Zealand consumer hasn’t been in the mood to spend and the markets were braced for a decline in third-quarter retail sales. The news was better than expected, however, as retail sales were flat at 0.0% q/q, breaking a streak of three straight losing quarters. The improvement in retail sales points to resilience in the New Zealand economy.
On an annual basis, retail sales came in at -3.4%, little changed from the second-quarter reading of -3.5%. The sharp decline is a result of the central bank’s aggressive tightening and an inflation rate of 5.6%, which is very high and well above the 1%-3% target band.
The Reserve Bank of New Zealand meets on November 29th and is expected to leave the cash rate unchanged at 5.5%. The RBNZ has held rates three straight times and market speculation is rising that the RBNZ will pivot and trim rates in 2024. The RBNZ is unlikely to send any signals about cutting rates, however, especially with inflation well above the target.
I expect the RBNZ to maintain its ‘higher for longer’ policy, which would mean further rate pauses well into 2024. This would provide RBNZ policy makers the flexibility to raise rates if inflation unexpectedly rises or to trim rates once inflation drops closer to 3%, which is the top of the target range, without risking a loss of credibility.
The US wraps up with the release of US manufacturing and services PMIs, with little change expected. Still, the markets will be watching carefully, as the data will provide insights into the strength of the US economy. The consensus estimates for November stand at 49.8 for manufacturing (Oct: 50.0) and 50.4 for services (Oct. 49.8). If either of the PMIs miss expectations, that could translate into volatility from the US dollar in the North American session.
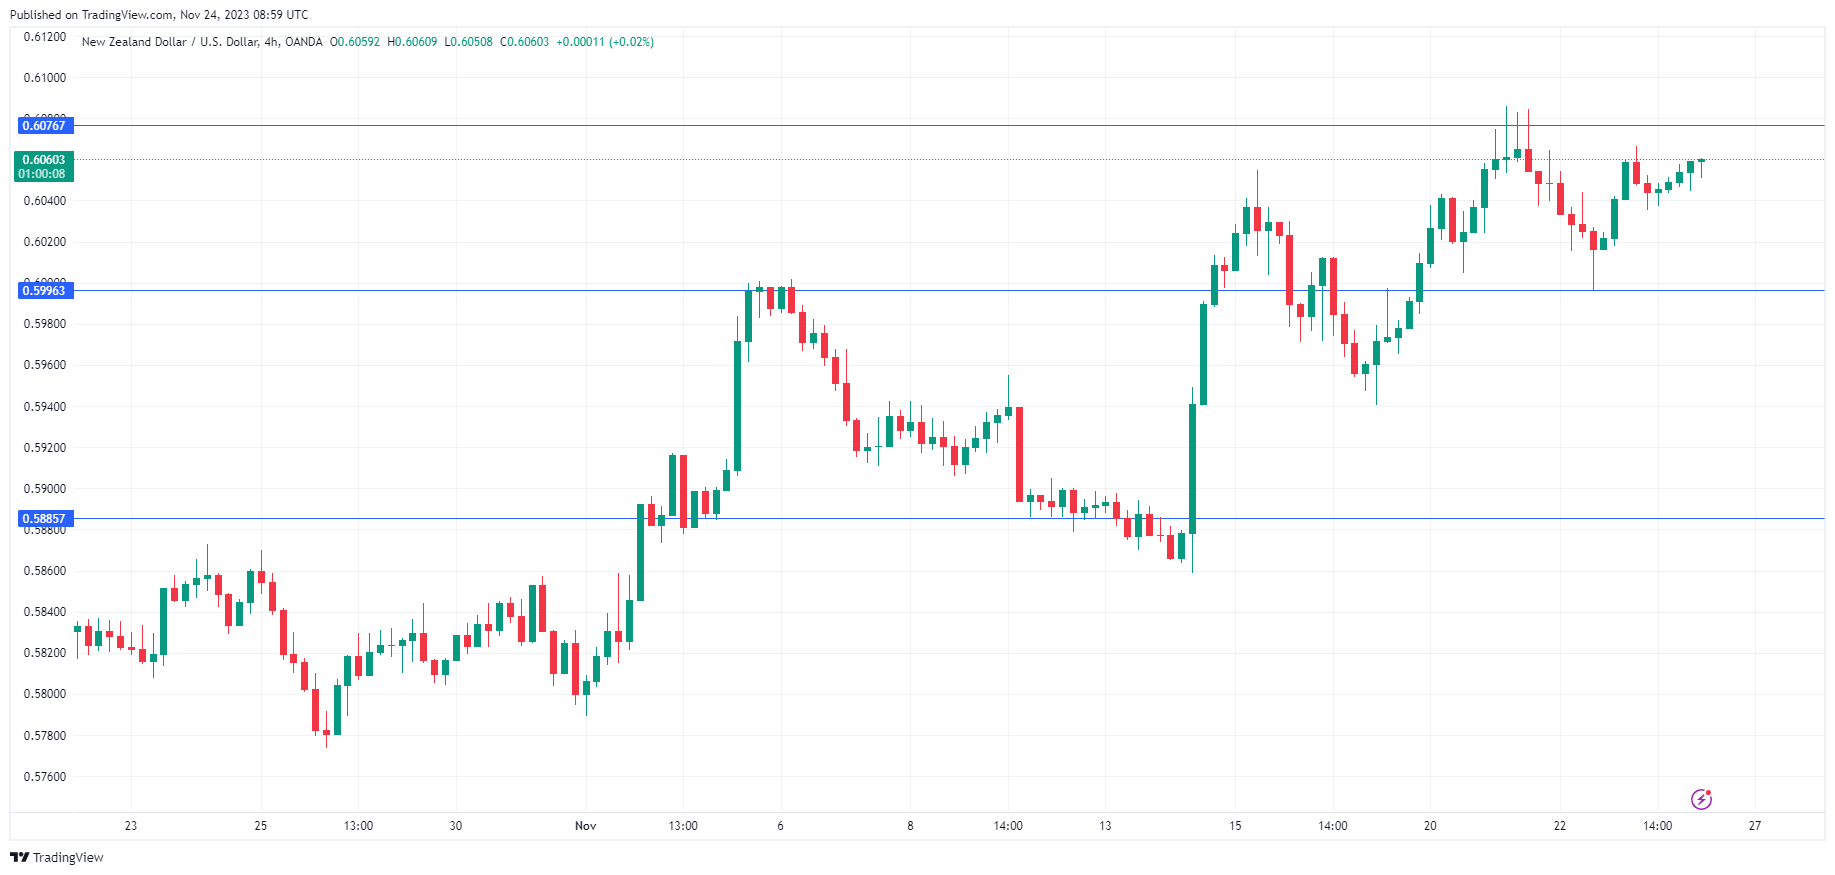
NZD/USD Technical
- NZD/USD continues to put pressure on resistance at 0.6076. The resistance line 0.6161
- There is support at 0.5996 and 0.5885
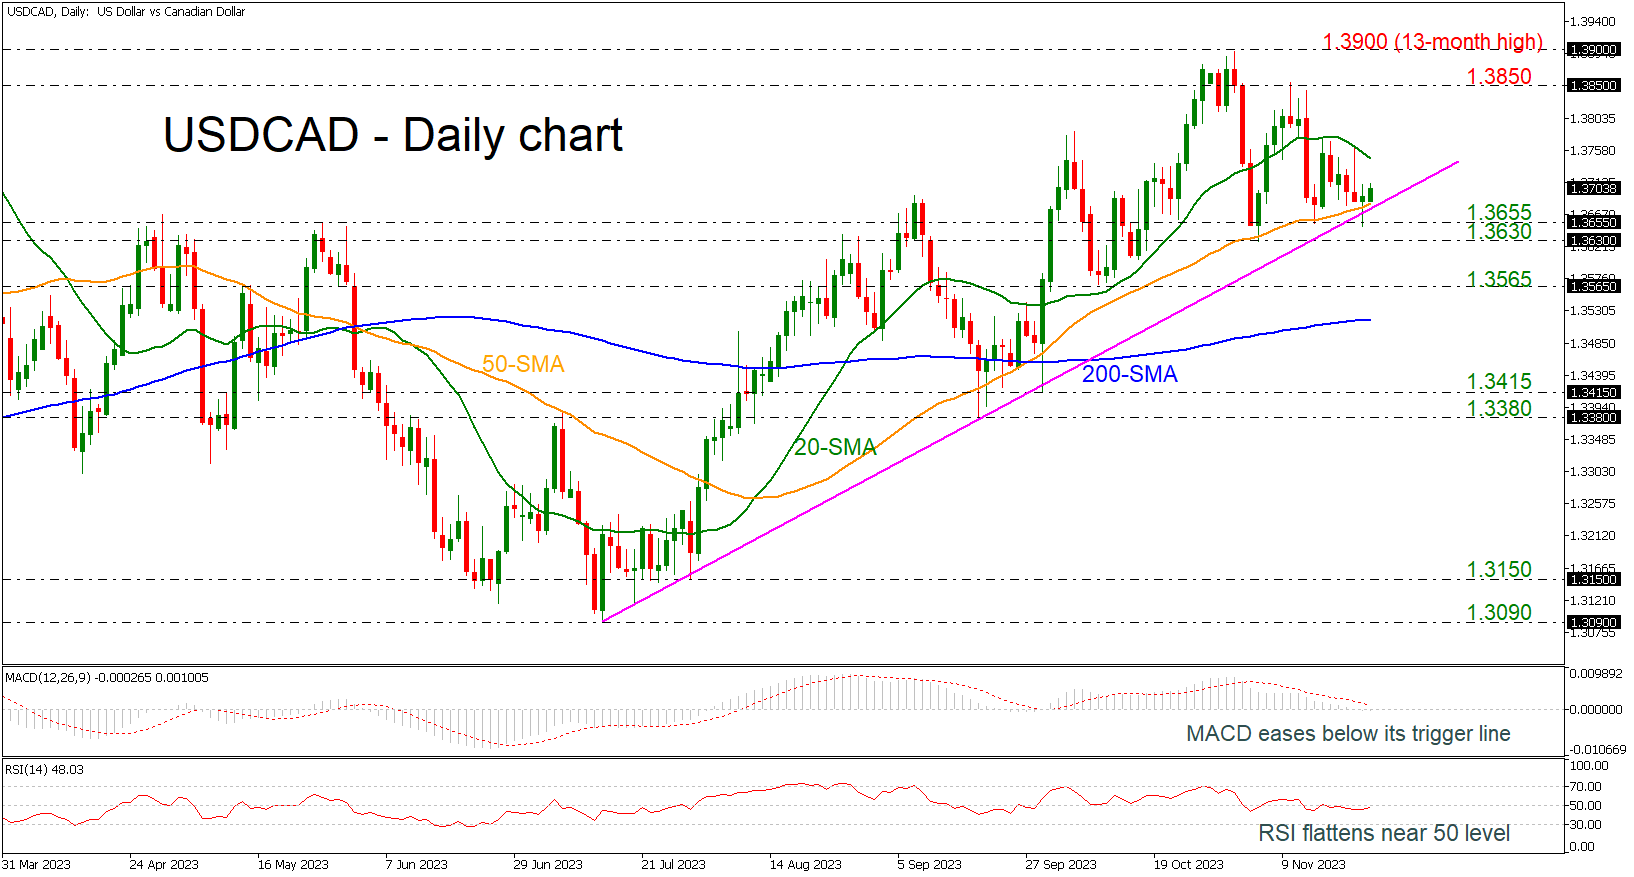
USDCAD Rises After Finding Support on Ascending Line
- USDCAD rebounds off the uptrend line
- Holds within short-term SMAs
- MACD and RSI muted bearish momentum
USDCAD is hovering within the downward sloping 20- and the 50-day simple moving average (SMA) lines but is still standing above the medium-term rising trend line. The pair found support near the 1.3655 support level and the bearish correction may come to an end.
Moving higher, the market may retest the 20-day SMA at 1.3745 before rallying towards the 1.3850 resistance. Above these obstacles the pair would reach the 13-month high of 1.3900.
On the other hand, if the bears take the upper hand and break the uptrend line to the downside would test the 1.3630-1.3655 region. More downside movements could open the way towards the 1.3565 barricade, taken from the low on October 10 before challenging the 200-day SMA at 1.3520.
The technical oscillators muted the bearish action. The MACD is marginally below its trigger and zero lines, while the RSI is moving beneath the 50 level and is ready to cross it to the upside, indicating a bullish movement in the next few sessions.
To sum up, USDCAD is showing some signs for a resumption of the upward movement in the short-term, while in the medium-term it has been posting higher highs and higher lows since July 14.
Gold Price Dips From $2K While Crude Oil Price Recovers
Gold price surged toward the $2,000 zone before the bears appeared. Crude oil price is attempting a recovery wave above the $75.00 zone.
Important Takeaways for Gold and Oil Prices Analysis Today
- Gold price started a steady increase from the $1,965 zone against the US Dollar.
- A key bearish trend line is forming with resistance at $1,995 on the hourly chart of gold at FXOpen.
- Crude oil prices started a decent recovery wave from the $73.80 support.
- There is a connecting bearish trend line forming with resistance near $77.00 on the hourly chart of XTI/USD at FXOpen.
Gold Price Technical Analysis
On the hourly chart of Gold at FXOpen, the price found support near the $1,965 zone. The price remained in a bullish zone and started a strong increase above $1,985.
There was a decent move above the 50-hour simple moving average. The bulls pushed the price above the $1,985 and $1,995 resistance levels. Finally, the price tested the $2,005 zone before the bears appeared.
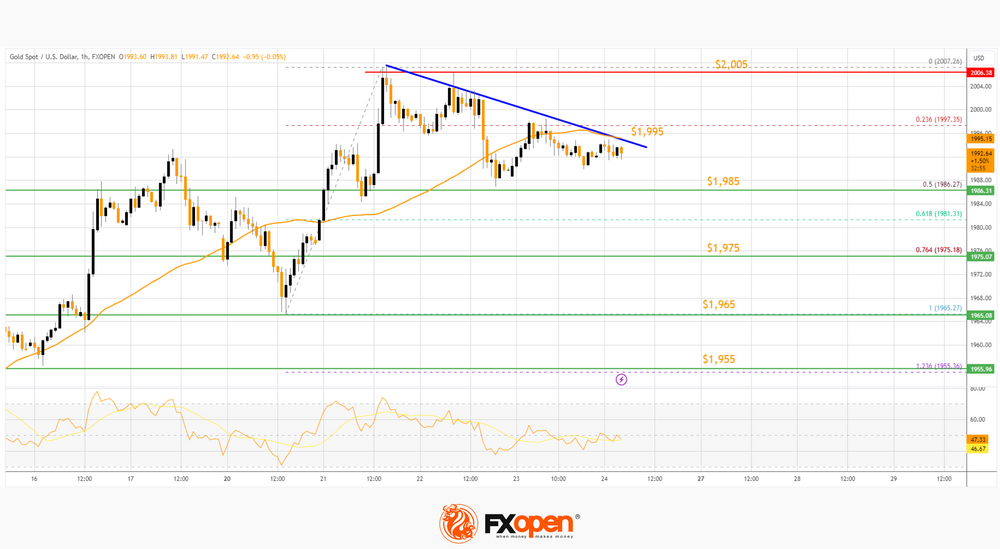
There was a minor downside correction below $2,000 and the RSI dipped below 50. There was a move below the 23.6% Fib retracement level of the upward move from the $1,965 swing low to the $2,007 high.
Initial support on the downside is near the 50% Fib retracement level of the upward move from the $1,965 swing low to the $2,007 high at $1,985. The first major support is near the $1,975 zone.
If there is a downside break below the $1,975 support, the price might decline further. In the stated case, the price might drop toward the $1,965 support.
Immediate resistance is near a key bearish trend line at $1,995 and the 50-hour simple moving average. The next major resistance is near the $2,005 level. An upside break above the $2,005 resistance could send Gold price toward $2,020. Any more gains may perhaps set the pace for an increase toward the $2,032 level.
Oil Price Technical Analysis
On the hourly chart of WTI Crude Oil at FXOpen, the price found support near the $73.80 zone against the US Dollar. The price formed a base and started a recovery wave above $74.50.
The bulls were able to push the price above the 50% Fib retracement level of the downward move from the $78.44 swing high to the $73.81 low. The hourly RSI is back above the 50 level, but the price is struggling near the 50-hour simple moving average.
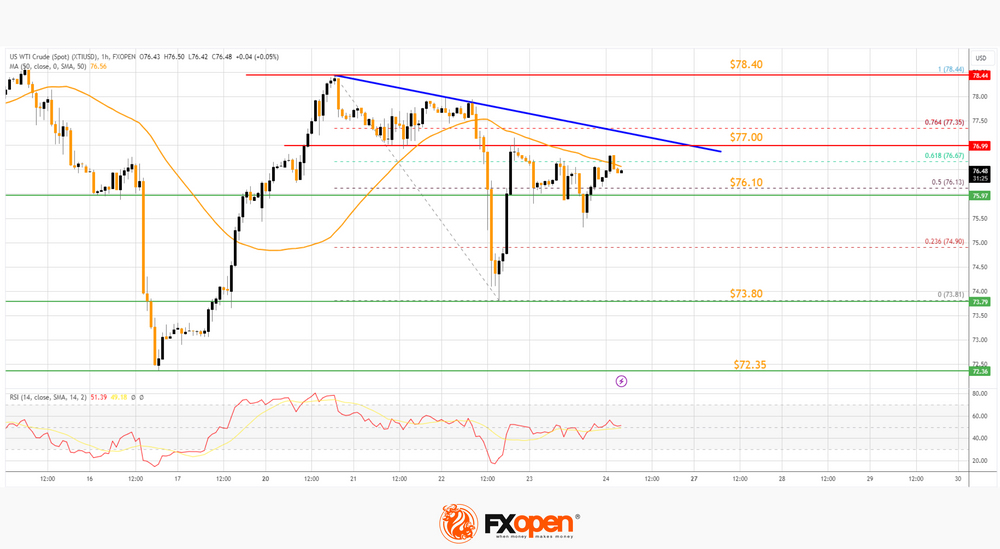
There is also a connecting bearish trend line forming with resistance near $77.00. It is close to the 61.8% Fib retracement level of the downward move from the $78.44 swing high to the $73.81 low.
A clear move above the trend line resistance could send the price toward the $78.40 resistance. Any more gains might send the price toward the $80.00 level.
Conversely, the price might start a fresh decline from the $77.00 resistance. Immediate support sits near the $76.10 level. The next major support on the WTI crude oil chart is $73.80.
If there is a downside break, the price might decline toward $72.35. Any more losses may perhaps open the doors for a move toward the $70.00 support zone.
This article represents the opinion of the Companies operating under the FXOpen brand only. It is not to be construed as an offer, solicitation, or recommendation with respect to products and services provided by the Companies operating under the FXOpen brand, nor is it to be considered financial advice.
Gold Fails to Hold Above 2,000 for the Third Day
The gold price increased slightly in the quiet trading session on Thursday as the U.S. dollar declined during the Thanksgiving holiday.
Possible effects for traders
XAUUSD rose by 0.10% yesterday in a very quiet trading session due to the decline of the U.S. dollar, while the U.S. treasury market remained closed for the holiday. Gold maintained its position above the important 1,990 level. The strength of XAUUSD is largely attributed to the growing anticipation that the Federal Reserve (Fed) may have concluded its cycle of interest rate hikes. Economic reports suggest that the U.S. central bank has effectively eased inflation, reinforcing expectations of a more dovish Fed policy. Lower interest rates decrease the opportunity cost of holding gold. 'Absent any fresh influences, I still don't think that gold has the momentum to maintain prices much above 2,000 for the rest of the year,' said StoneX analyst Rhona O'Connell.
In the Asian and early European trading sessions, gold prices rose due to the weakening of the U.S. dollar. In terms of geopolitical developments, Israel and Hamas initiated a four-day ceasefire this Friday, marking the first break in the conflict that has been ongoing for nearly seven weeks. Easing tensions may put downward pressure on XAUUSD, but some analysts expect the metal to remain strong. 'Spot gold may retest a resistance at $1,999 per ounce, a break above which could lead to a gain into the 2,009–2,016 range,' said Reuters analyst Wang Tao.