Sample Category Title
Bullish Price Action on Crude May Not Be Over Yet
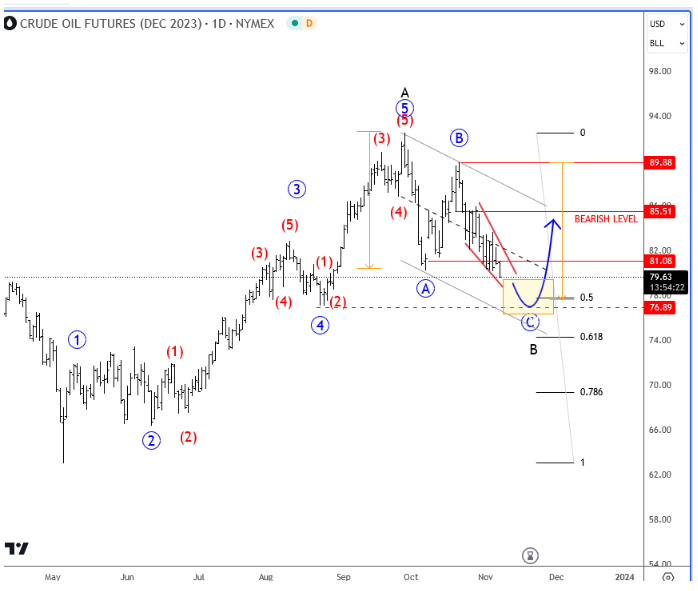
Crude oil bounced sharply back in October after attacks between Israel and Hamas. We have seen a jump of around 10% on crude oil to $90 in just a few days. In fact, back then, analysts started calling for $100 per barrel, so for me it was a bit overcrowded expectation, and that’s why we expected the opposite. Keep in mind that the market is the most sensitive when the news comes out, but then, after a few days the dust settles, and trading goes back to normal. And thats exactly what I have been expecting; a continuation lower, which makes sense from an Elliott wave perspective as energy showed us a top formation already at the end of September at 92-93 area. That was an end of an impulsive recovery from May to October, which we see it as first higher degree leg A of a three-wave A-B-C recovery, so more upside is still expected for wave C, ideally now as current A-B-C subwaves in wave B are coming into some attractive support. We are tracking final stages of wave C of B that can ideally find the base at the former wave 4 swing low, between 50% – 61,8% Fibonacci retracement that comes around $76-78 area.
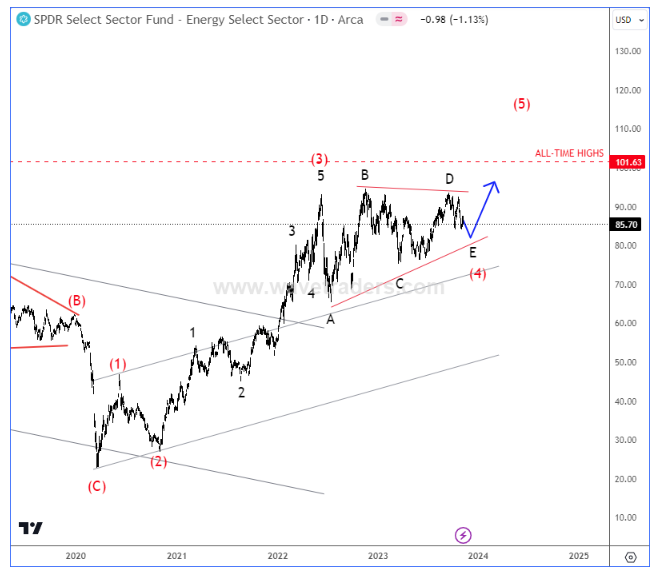
The main reason why Crude oil can see another recovery is also the energy sector (XLE), which we see it consolidating within a bullish running triangle pattern for wave (4) that can push the price into all-time highs for wave (5).
As soon as Crude oil and XLE charts complete their corrections, this is when we can expect a continuation higher, ideally now at the end of 2023 or at the beginning of 2024.
Can EURJPY Carry on Recording Higher Highs?
- EURJPY makes new 15-year high
- Intervention threat has not dented bullish appetite
- Bullish momentum indicators but exhaustion signs appear
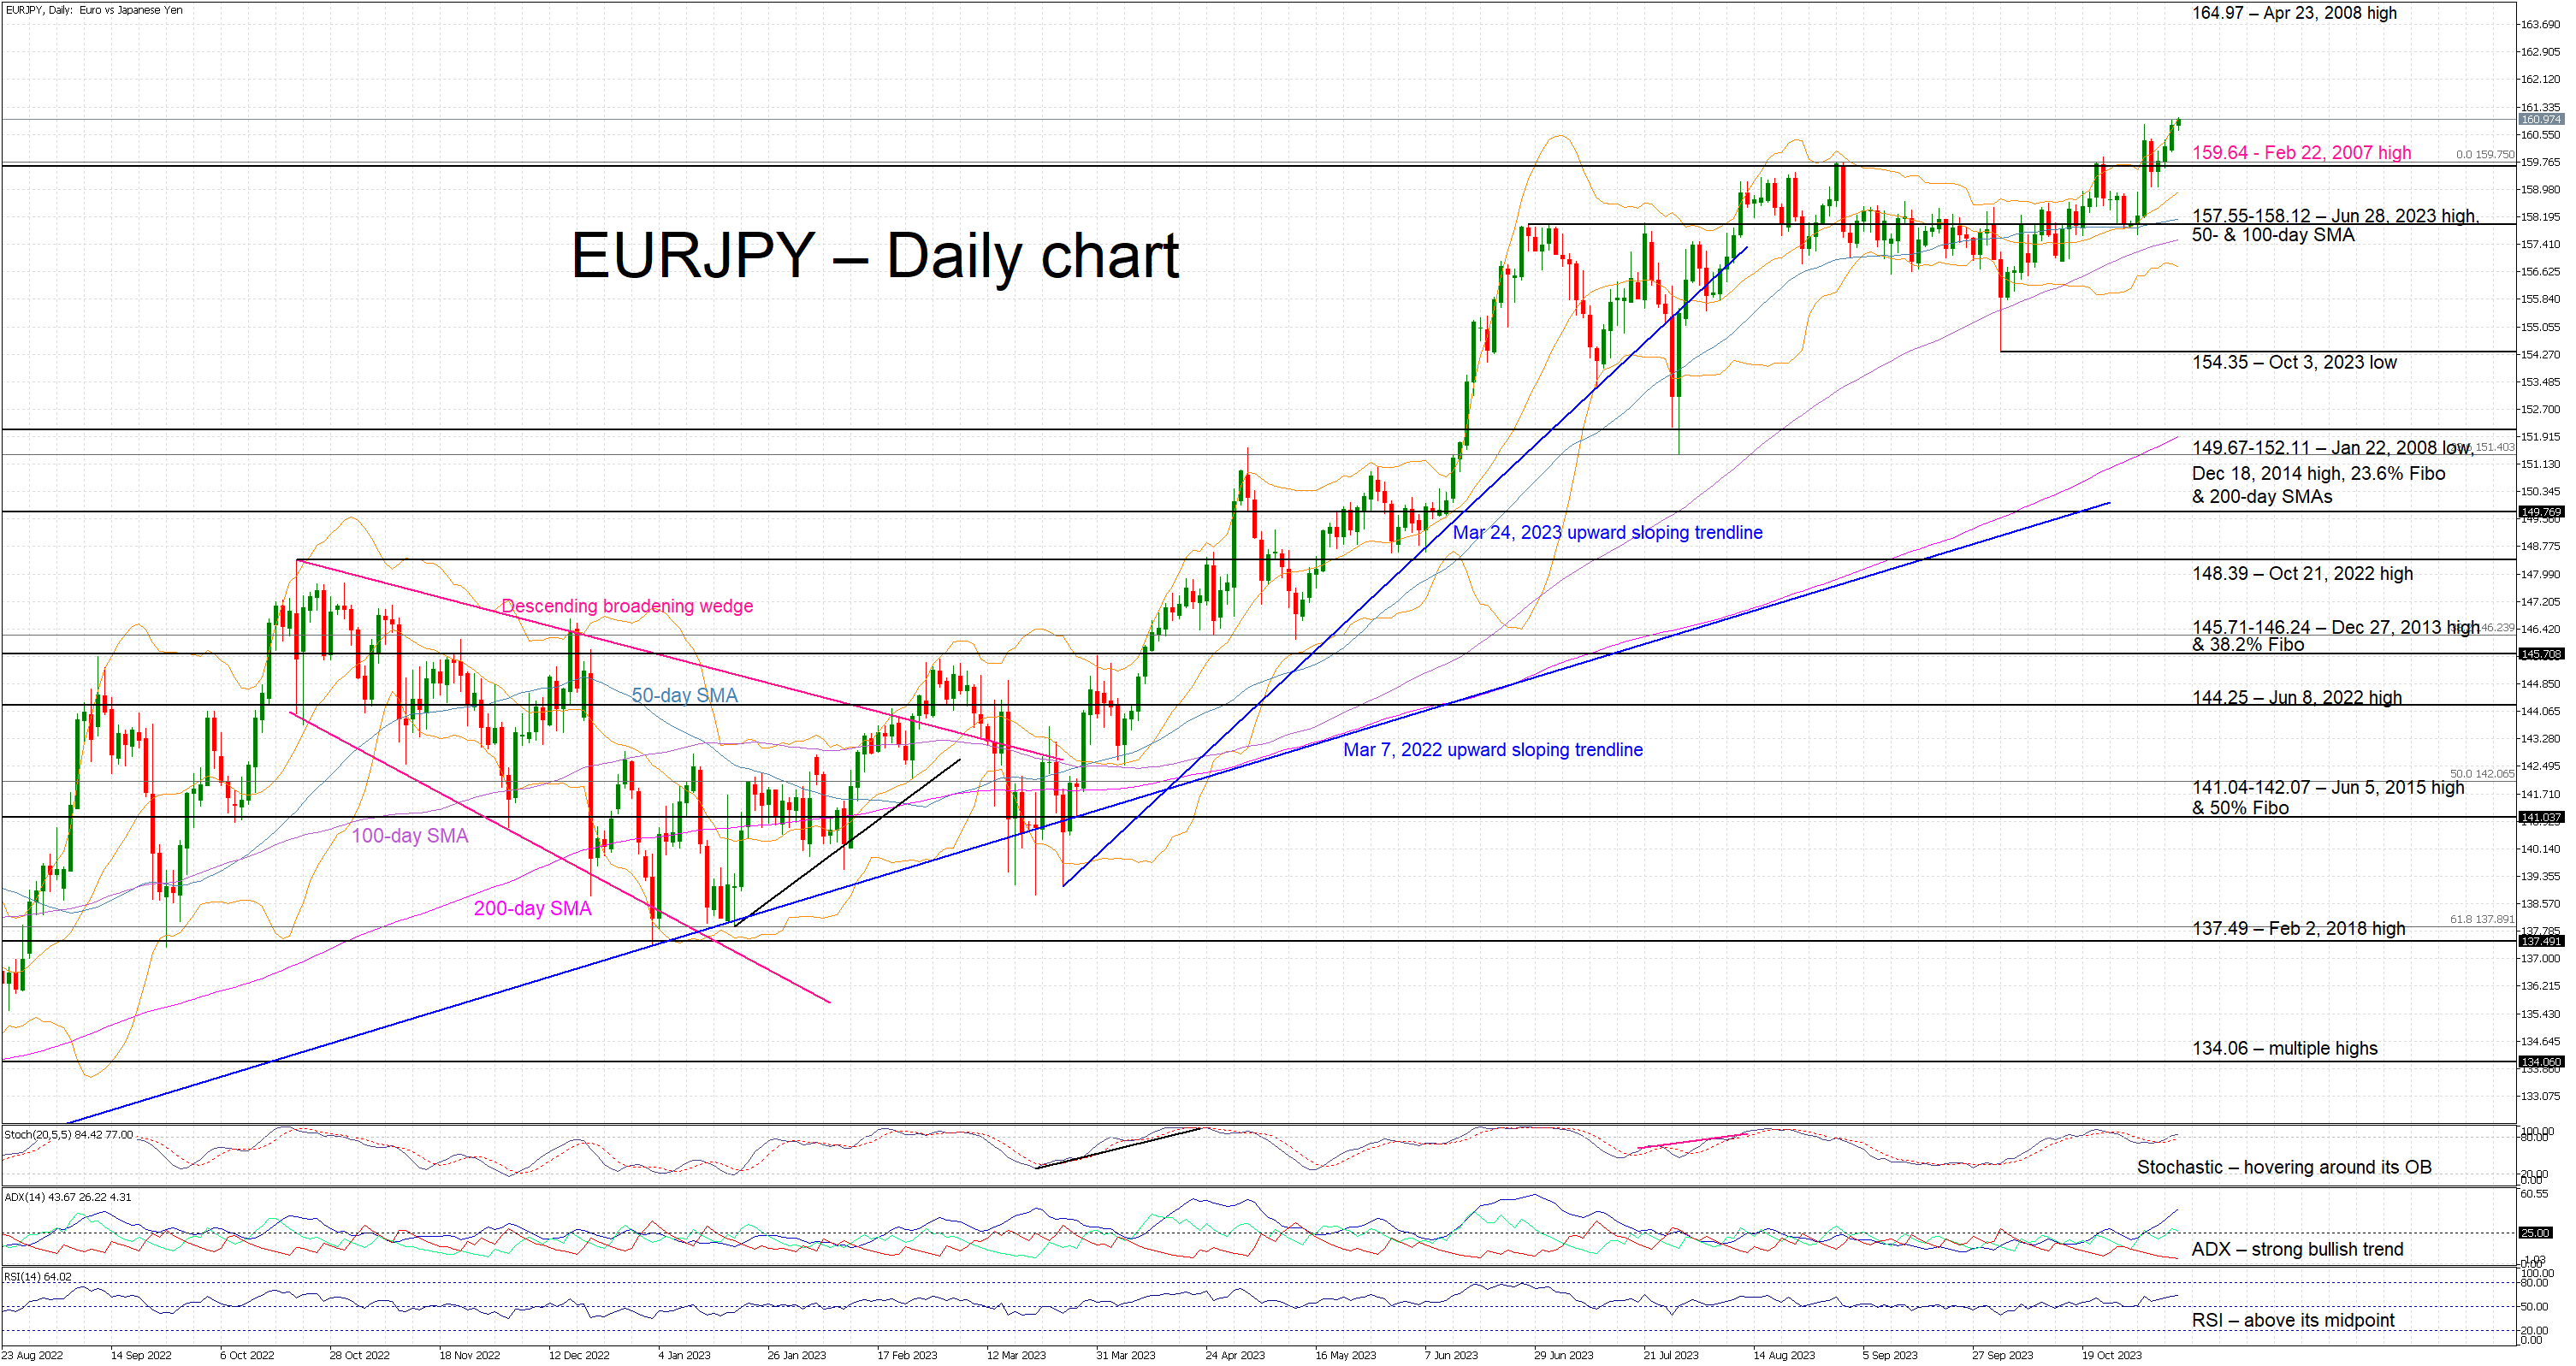
EURJPY is edging higher today, trying to record its fourth consecutive green candle. It has made a new 15-year high after finally managing to surpass the 159.64 level that has greatly been troubling the bulls over the past three months. Last week’s BoJ meeting announcements and the intervention threat do not seem to dent the bullish appetite.
Turning to the momentum indicators and there is strong support for the current upleg. In more detail, the Average Directional Movement Index (ADX) is edging higher, far above its 25-threshold, and signaling a strong bullish trend in the market. Similarly, the RSI remains above its midpoint and close to a 4-month high. More importantly, the stochastic oscillator has rejoined its overbought territory, confirming the current bullishness in the EURJPY. However, the higher high in this currency pair has been met by a lower high in the stochastic and thus raises questions about the viability of the current upleg.
Should the bulls ignore the intervention threat, they would aim to keep EURJPY above 159.64 and record a new higher high on a daily basis. They could gradually try to push EURJPY towards the April 23, 2008 high at 164.97.
On the other hand, the bears are desperately trying to recoup part of their losses. They could attempt to push EURJPY back below the February 22, 2007 high at 159.64 and then test the support set by the busy 157.55-158.12 area. This is defined by the June 28, 2023 high and the 50- and 100-day simple moving averages (SMAs). If successful, the bears could have a go at reaching the October 3, 2023 low at 154.35.
To sum up, EURJPY bulls remain in control of the market and are recording multiple higher highs despite the intervention threat and the stochastic oscillator showing some early signs of rally exhaustion.
GBP/USD Turns Green While USD/CAD Eyes Fresh Increase
GBP/USD started a decent increase above the 1.2225 resistance. USD/CAD is recovering and might aim for a move toward the 1.3795 resistance.
Important Takeaways for GBP/USD and USD/CAD Analysis Today
- The British Pound climbed above the 1.2225 and 1.2315 resistance levels.
- There is a connecting bullish trend line forming with support near 1.2315 on the hourly chart of GBP/USD at FXOpen.
- USD/CAD declined toward the 1.3635 zone before the bulls took a stand.
- It broke a major bearish trend line with resistance near 1.3660 on the hourly chart at FXOpen.
GBP/USD Technical Analysis
On the hourly chart of GBP/USD at FXOpen, the pair found support near the 1.2100 zone. The British Pound formed a base and started a recovery wave above 1.2225 against the US Dollar.
The pair was able to clear the 1.2315 resistance and the 50-hour simple moving average. Finally, it spiked toward 1.2430. A high is formed near 1.2430 and the pair is now correcting gains. There was a move below the 23.6% Fib retracement level of the upward move from the 1.2097 swing low to the 1.2428 high.
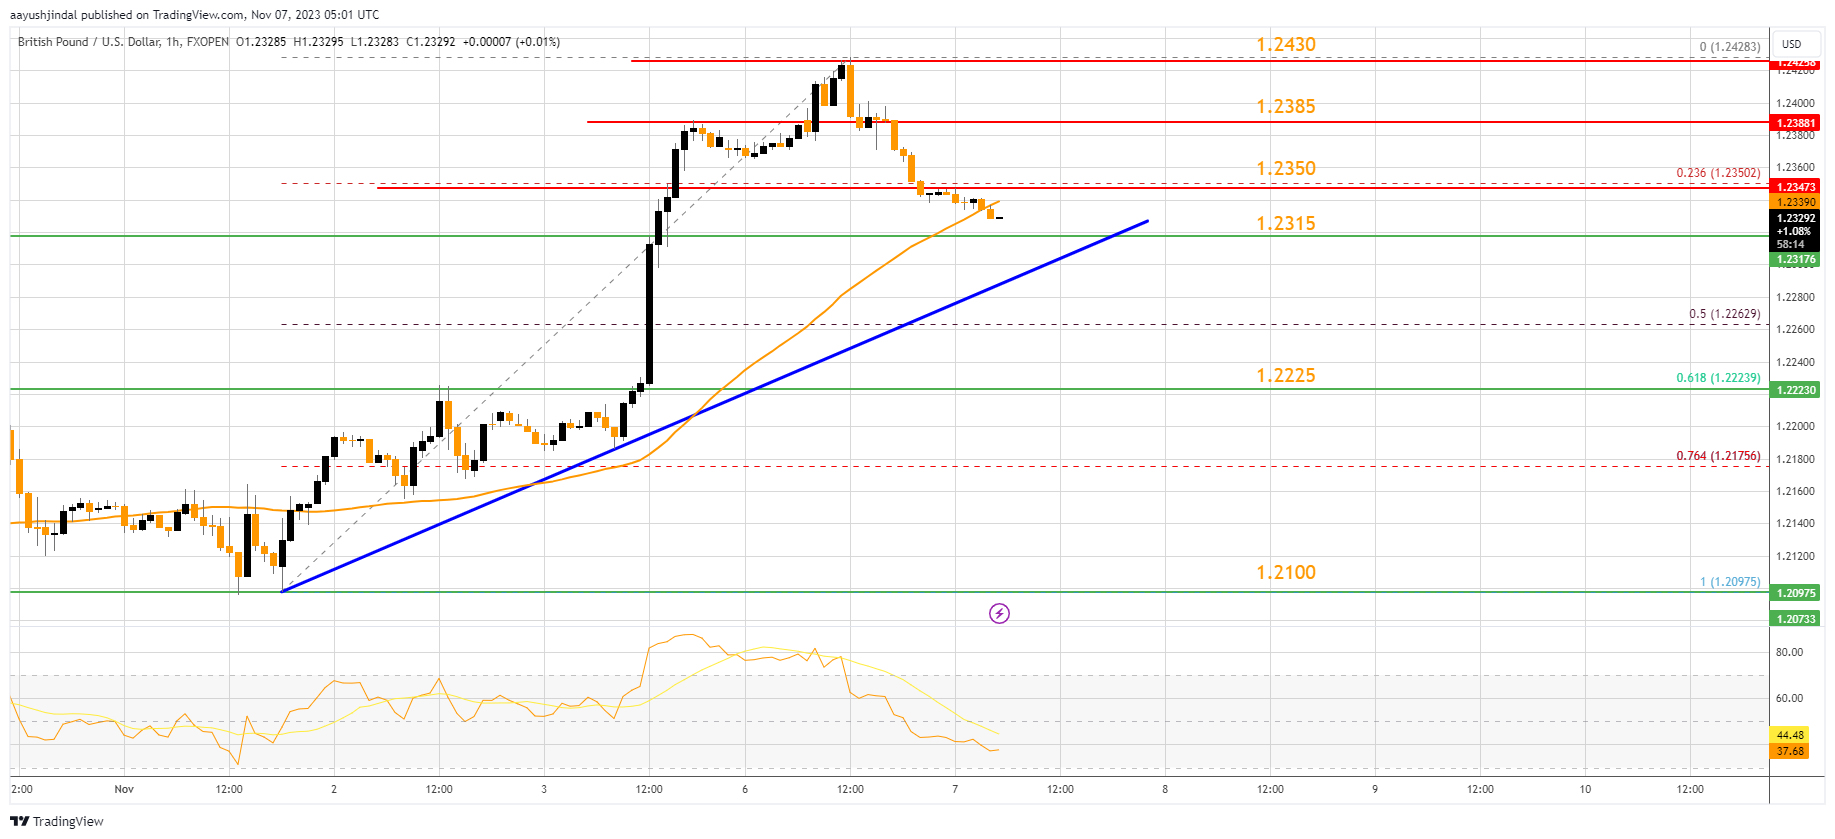
The RSI moved below the 40 level on the GBP/USD chart and the pair is now approaching a major support at 1.2315. There is also a connecting bullish trend line forming with support near 1.2315.
A downside break below the trend line might send the pair toward the 61.8% Fib retracement level of the upward move from the 1.2097 swing low to the 1.2428 high at 1.2225. The next major support is 1.2100. Any more losses might call for a test of the 1.2000 support.
On the upside, the pair might face resistance near 1.2350. The next resistance is near 1.2385. An upside break above the 1.2385 zone could send the pair toward 1.2430. Any more gains might open the doors for a test of 1.2500.
USD/CAD Technical Analysis
On the hourly chart of USD/CAD at FXOpen, the pair rallied toward the 1.3900 resistance zone before the bears appeared. The US Dollar formed a high near 1.3899 and recently declined below the 1.3765 support against the Canadian Dollar.
The pair even tested the 1.3636 zone and recently started a recovery wave. It broke a major bearish trend line with resistance near 1.3660.
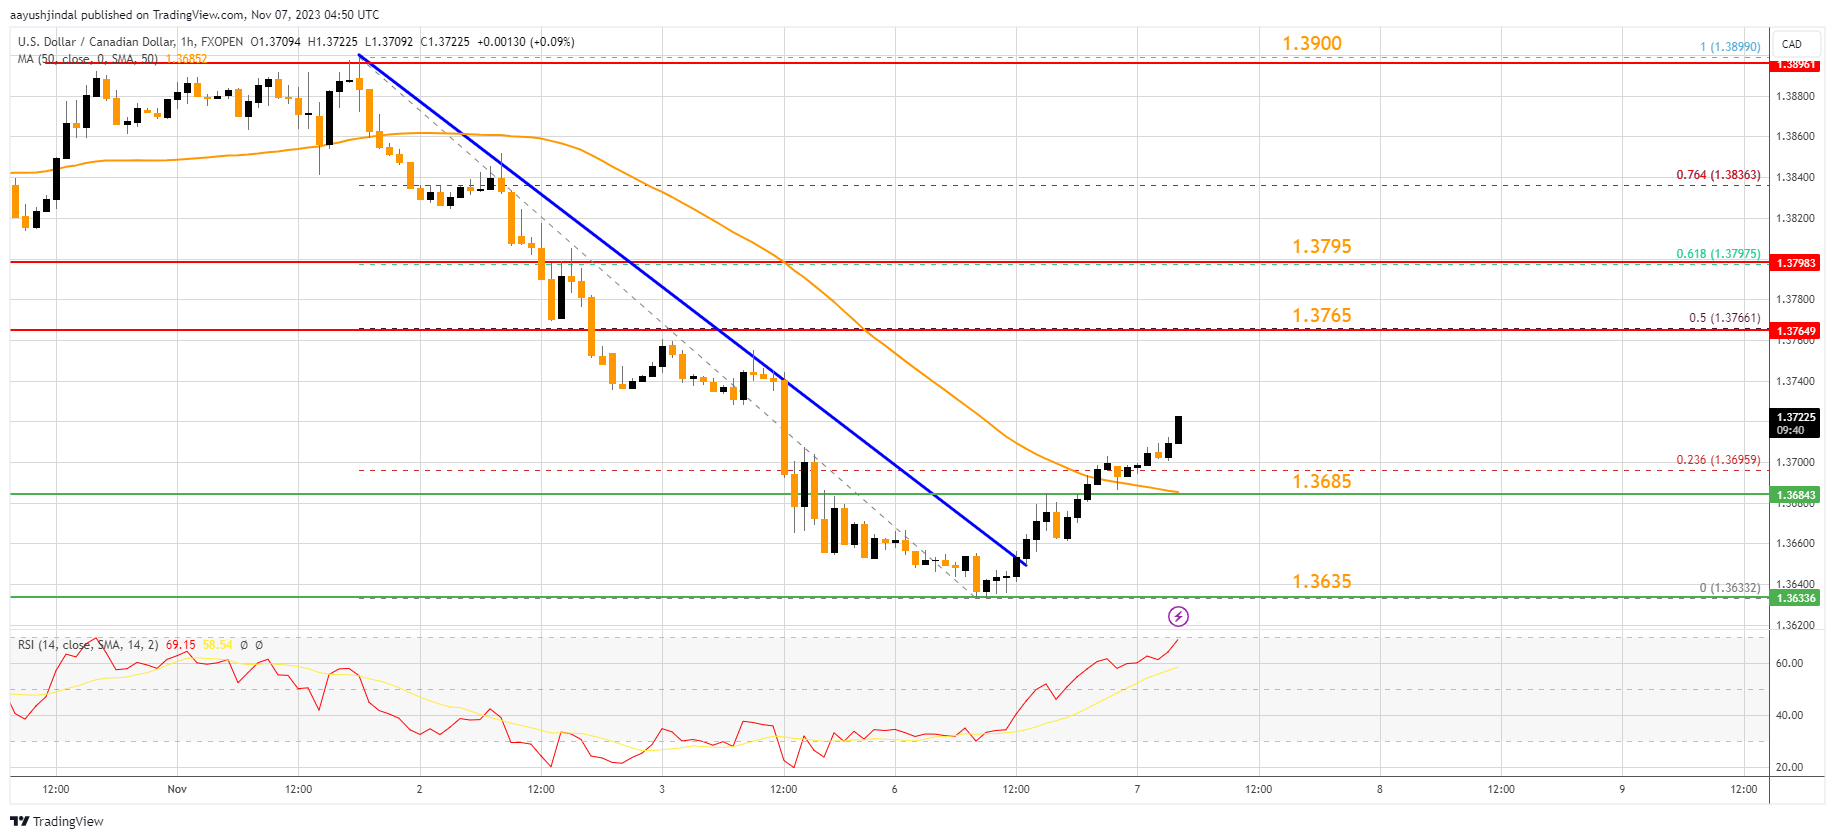
There was a move above the 50-hour simple moving average and the 23.6% Fib retracement level of the downward move from the 1.3900 swing high to the 1.3633 low. The pair is now showing positive signs and might aim for more upsides.
Immediate resistance is near the 50% Fib retracement level of the downward move from the 1.3900 swing high to the 1.3633 low at 1.3765. The next key resistance on the USD/CAD chart is 1.3795.
If there is an upside break above 1.3795, the pair could rise toward the 1.3900 resistance. The next major resistance is near the 1.3920 level, above which it could rise steadily toward the 1.4000 resistance zone.
If not, the pair might decline again. Immediate support is near the 50-hour simple moving average at 1.3685. The first major support is 1.3635. A close below the 1.3635 level might trigger a strong decline. In the stated case, USD/CAD might test 1.3550. Any more losses may possibly open the doors for a drop toward the 1.3500 support.
Trade global forex with the Innovative Broker of 2022*. Choose from 50+ forex markets 24/5. Open your FXOpen account now or learn more about trading forex with FXOpen.
* FXOpen International, Innovative Broker of 2022, according to the IAFT
This article represents the opinion of the Companies operating under the FXOpen brand only. It is not to be construed as an offer, solicitation, or recommendation with respect to products and services provided by the Companies operating under the FXOpen brand, nor is it to be considered financial advice.
Stocks Continue to Climb: Nasdaq’s Impressive Winning Streak
The stock market saw modest gains on Monday, building upon the robust rally it experienced last week. The Nasdaq Composite, in particular, achieved its lengthiest positive streak since January, marking a significant milestone for the tech-heavy index.
Closing the day at 13,518.78, the Nasdaq surged by 0.3%. Meanwhile, the S&P 500 inched up 0.18%, settling at 4,365.98. The Dow Jones Industrial Average displayed a subtle increase, gaining 34.54 points, equivalent to 0.1%, and concluding at 34,095.86.
The market's current demeanour can be attributed to its endeavour to assimilate the substantial rally from the previous week. As it pauses to consolidate recent gains, investors eagerly await the emergence of the next bullish catalyst. This catalyst could potentially be influenced by the decisions of Federal Reserve policymakers, particularly Jerome Powell, or by the forthcoming corporate earnings season.
In a notable streak, the Nasdaq Composite logged seven consecutive days of gains, a feat unseen since January. In tandem, the Dow and S&P 500 secured their sixth consecutive day of growth, a remarkable achievement given that this had not occurred since July and June, respectively.
Investor sentiment was bolstered by a surge of optimism from Bank of America, propelling Nvidia's shares by approximately 1.7%. Conversely, Bumble faced a 4.4% dip in its shares following the announcement of its CEO's resignation scheduled for January. On the flip side, SolarEdge Technologies experienced a 5.1% decline after Wells Fargo issued a downgrade.
Yields, in contrast to last week's trend, displayed an upward trajectory, with the 10-year Treasury yield registering a 9-basis point increase, reaching approximately 4.653%.
The stock market's performance during the past week marked the strongest of 2023. The Dow secured its most substantial weekly gain since October 2022, while the S&P and Nasdaq both celebrated their most impressive weeks since November 2022. Contributing to this surge was a soft monthly jobs report that lowered bond yields, providing a boost to equities.
November has witnessed a robust start in the stock market, coinciding with the prevalent sentiment indicators. Although the surge in yields had prompted concerns, the hope remains that the impact on US equities may be limited.
The upcoming week is anticipated to bring a lull in economic data and company earnings releases.
However, seasonal tailwinds might serve as a driving force behind the stock market's recovery. November is renowned as the best-performing month for the S&P, according to the Stock Traders' Almanac. LPL Financial's Adam Turnquist noted that it also heralds the commencement of the market's most lucrative six-month return period since 1950. On average, the S&P has yielded a 7% return from November through April during this period.
While earnings season is winding down, investors are keenly awaiting updates from prominent companies like Walt Disney, Wynn, MGM Resorts, and Occidental Petroleum.
Furthermore, Federal Reserve Chair Jerome Powell is set to make two appearances in the coming days. Last week, the central bank chose to maintain the current interest rates for the second consecutive meeting, primarily in response to declining bond yields. Investors are closely monitoring the possibility of the Fed's rate-hiking campaign drawing to a close.
This article represents the opinion of the Companies operating under the FXOpen brand only. It is not to be construed as an offer, solicitation, or recommendation with respect to products and services provided by the Companies operating under the FXOpen brand, nor is it to be considered financial advice.
Did GBPUSD Get Caught in a False Breakout?
- GBPUSD trims gains after rejection from 200-SMA
- Buying appetite falls; support at 1.2260-1.2300
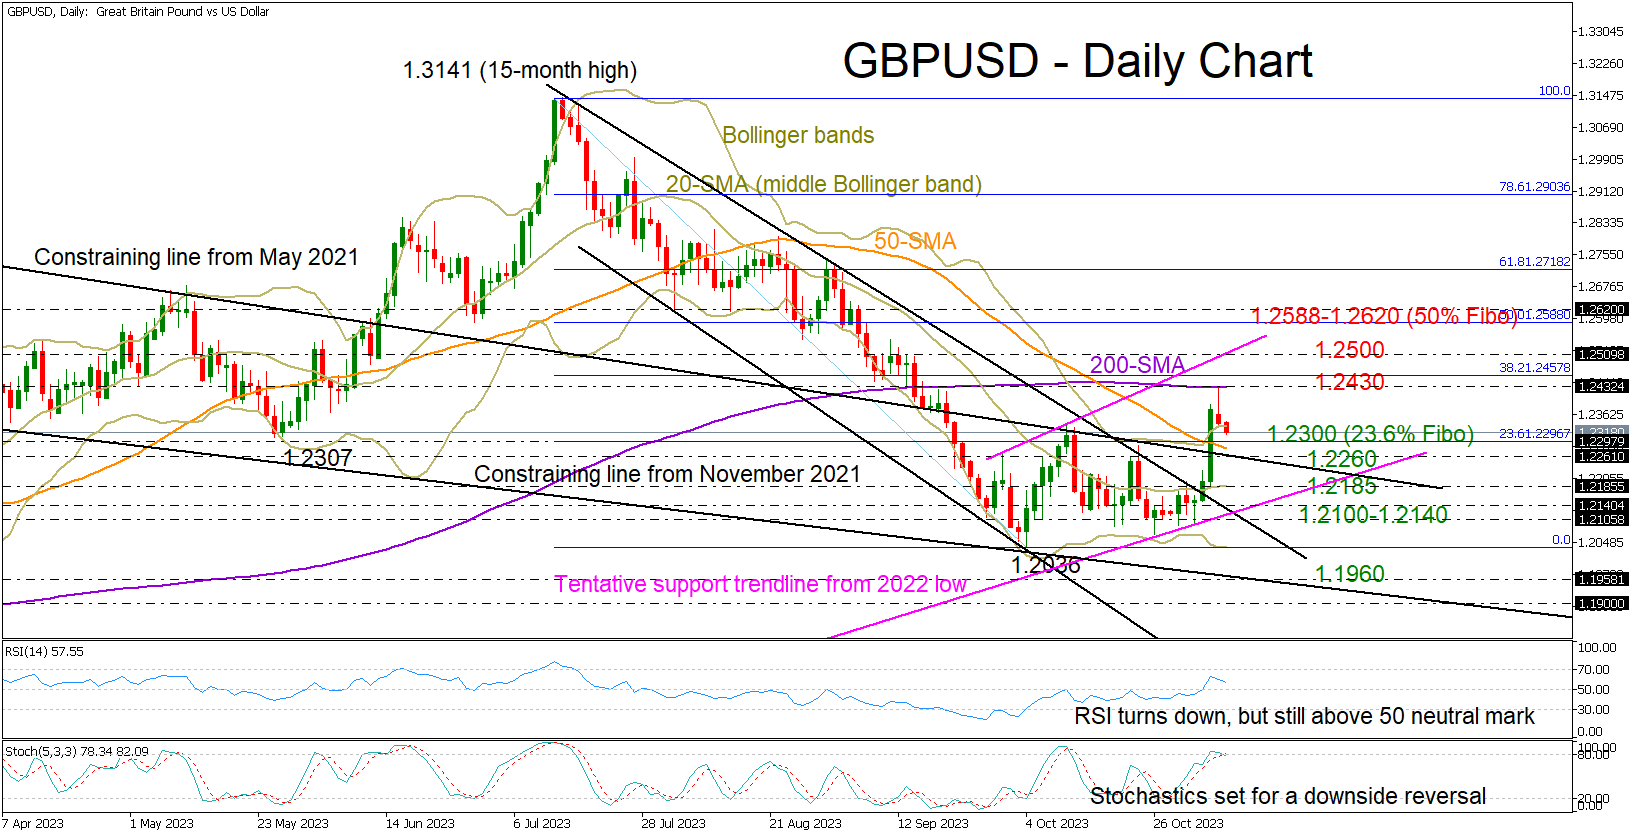
GBPUSD could not find enough buyers to expand Friday’ bull run above its 200-day simple moving average (SMA), closing with marginal losses within the 1.2300 area on Monday.
Given the current negative momentum in the price, the question now is whether the pair will stay resilient above the 1.2260-1.2300 key region. A clear step below it and beneath the 50-day SMA would wipe out Friday’s boost, pressing the price back to the 20-day SMA. Slightly lower, the tentative ascending line from the 2022 low at 1.2140 and the upper band of the broken bearish channel at 1.2100 could prevent a drop towards October’s low of 1.2036. If not, the sell-off might stretch towards the falling support line from November 2021 at 1.1960.
Technically, the short-term risk is leaning to the downside. The price has closed above the upper Bollinger band, while the stochastic oscillator seems to have peaked above its 80 overbought level, both suggesting that the latest spike in the price is overdone.
Nevertheless, the RSI is still some distance above its 50 neutral mark, raising speculation that the bulls still have the power to stage a rebound. In this case, traders will wait for a close above the 200-day SMA at 1.2430, and more importantly, beyond the 1.2500 mark to upgrade their outlook. Then, the next battle could take place somewhere between the 50% Fibonacci retracement of the previous downleg at 1.2588 and the 1.2620 barrier.
To sum up, the latest spike in GBPUSD has not excited traders yet. An extension above the 200-day SMA and the 1.2500 number is still required to make the upturn look more credible. Note that the death cross between the 50- and 200-day SMAs is intact.
Asian Markets Return to Risk-off Mode
Markets
The new trading week yesterday started with a countermove on last week’s overall easing in financial conditions. Maybe the market has been running a bit ahead of itself in declaring an end to the Fed’s tightening cycle or at least it was too early to pencil in rate cuts before the summer of next year. Contrary to what was the case last week, there was little economic news to ‘explain’ the move. Technical levels probably played a role, with US yields end last week testing key support levels (e.g. 4.50% for the 10-y). Upcoming supply maybe also was a good reason for investors to turn more cautious to further rush into bonds (US Treasury refinancing starting today). Whatever the driver, US yields yesterday rebounded between 9.6 bps (2-y) and 4.2 bps (30-y). At 4.635%, the 10-y US yield again created some breathing space compared to the 4.50% reference. Overnight, Minneapolis Fed governor Kashkari joined yesterday’s market mood as he warned that it’s too soon to declare victory on inflation. More data are needed to be sure that ‘the inflation genie’ is back in the bottle, he assessed. EMU/German yields followed the broader rise but as was the case on Friday, the curve move again was a bit different from the US (bear steepening, 2-y +6.2 bps; 10-y +9.4 bps). ECB’s Holzmann, admittedly a notable hawk, came with a similar conclusion as did Kashkari (not declaring victory yet). Doubts on the room for early (Fed) easing also blocked that rebound in equities. US indices finished with limited gains (Dow +0.1%, Nasdaq +0.3%). First key resistance levels (Dow 34148, S&P 4394, Nasdaq 13714) are under test or within reach, but not recovered yet. This also applies for the Eurostoxx50 (+0.38%, ST top at 4.234). Oil ($ 85 p/b) hardly gained even as Russia and Saudi Arabia extended production cuts. The dollar halted Friday’s sell-off, but its performance remained unconvincing (DXY 105.21 from 105.02, EUR/USD 1.0718 from 1.073). Sterling underperformed both the dollar (cable close 1.2344) and the euro (EUR/GBP close 0.8682).
This morning, Asian markets return to risk-off mode. China October trade data show a mixed picture exports (USD -6.4% Y/Y) disappointed. Imports rose more than expected (+6.4%Y/Y). US Treasuries gain marginally as does the dollar (DXY 105.4). Later today, eco data (US trade balance, German production) probably won’t have a lasting impact on trading. Interest rate markets will keep a close eye at the $ 48 bln sale of 3-y Treasury Notes. Still, technical trading might again prevail. On interest rate markets, yesterday’s price action suggests that a sustained decline below last week’s lows won’t be that evident. On FX markets we look out whether the dollar will be able to profit more from a global risk-off than was the case of late. Sterling (EUR/GBP 0.868) this morning hardly reacts to mediocre BRC October retail sales (+2.5% Y/Y from 2.8%).
News & Views
The Reserve Bank of Australia hiked its policy rate by 25 bps to 4.35%, interrupting a four-meeting pause during which it judged that higher interest rates were balancing the economy and that some tightening impact was yet to be felt. Today, however, it concluded that the progress in CPI declining towards target is slower than in the August forecasts expected. The latest reading “indicates that while goods price inflation has eased further, the prices of many services are continuing to rise briskly.” Inflation is seen at around 3.5% by end 2024 and at the top of the 2-3% target by end 2025. The risk of inflation (expectations) being higher for longer against the background of a stronger than expected economy and still tight labour market thus warranted another rate increase. The RBA said uncertainties around the outlook are significant and often two-sided. Further tightening in such circumstances will depend upon the data and the evolving assessment of risks, it said. The Australian dollar’s attempt to rise on the not fully discounted rate hike was shortlived. After touching AUD/USD 0.65, the pair turned south to trade around 0.648 currently. Australian government bond yields ease 2.9-3.3 bps.
The Fed’s Q3 Senior Loan Officer Opinion Survey (SLOOS) yesterday showed how lending standards tightening across all kinds of loans. In the business segment, survey respondents reported tighter standards and weaker demand for commercial and industrial loans to firms of all sizes. Tighter standards and weaker demand also prevailed for all commercial real estate loan categories. Consumer lending tightened and demand weakened across all categories of residential real estate. The same applied for credit card, auto and other consumer loans.
GBP/JPY Daily Outlook
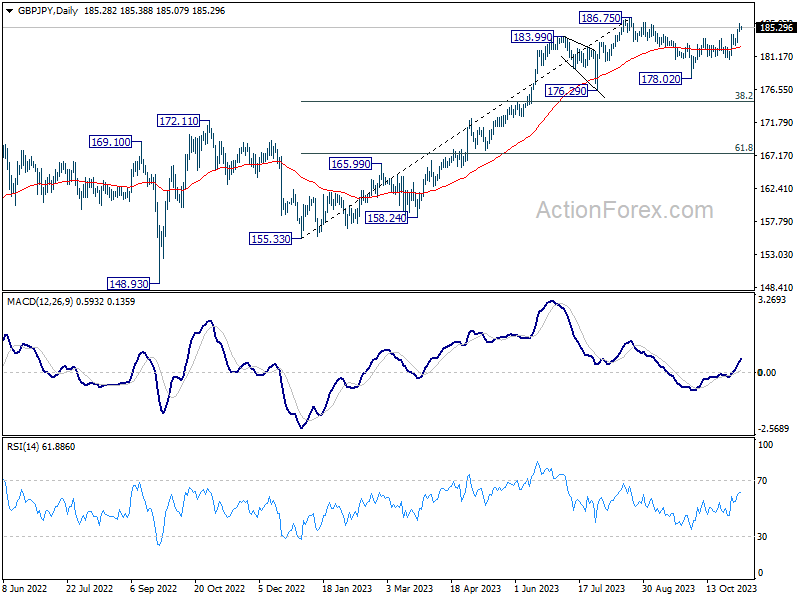
Daily Pivots: (S1) 184.66; (P) 185.32; (R1) 185.90; More...
Intraday bias in GBP/JPY remains on the upside for the moment. Current rise from 178.02 should target a retest of 186.76 resistance. Decisive break there will resume larger up trend. On the downside, below 184.29 minor support will turn intraday bias neutral and bring consolidations first, before staging another rally.
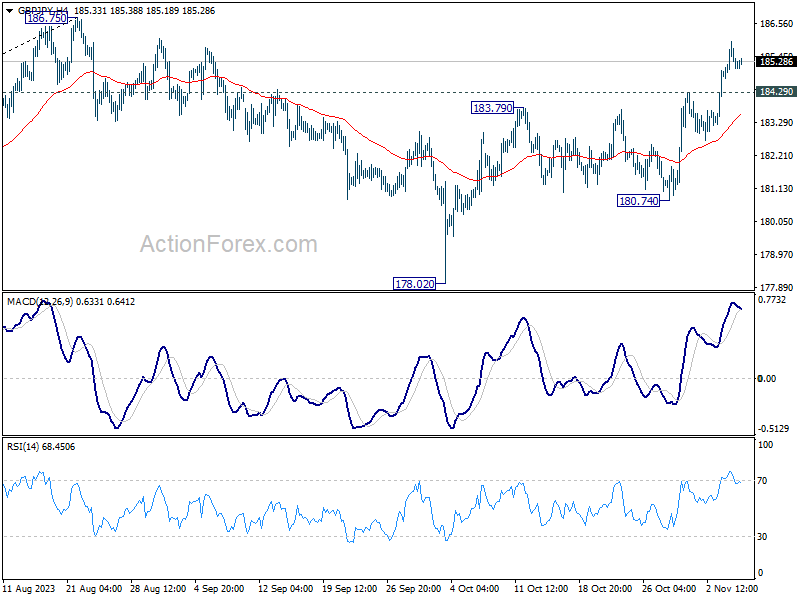
In the bigger picture, as long as 176.29 support holds, larger up trend from 123.94 (202 low) should still be in progress. Break of 186.75 will target 195.86 (2015 high). Nevertheless, firm break of 176.29 will confirm medium term topping, and bring lengthier and deeper consolidations.
EUR/JPY Daily Outlook
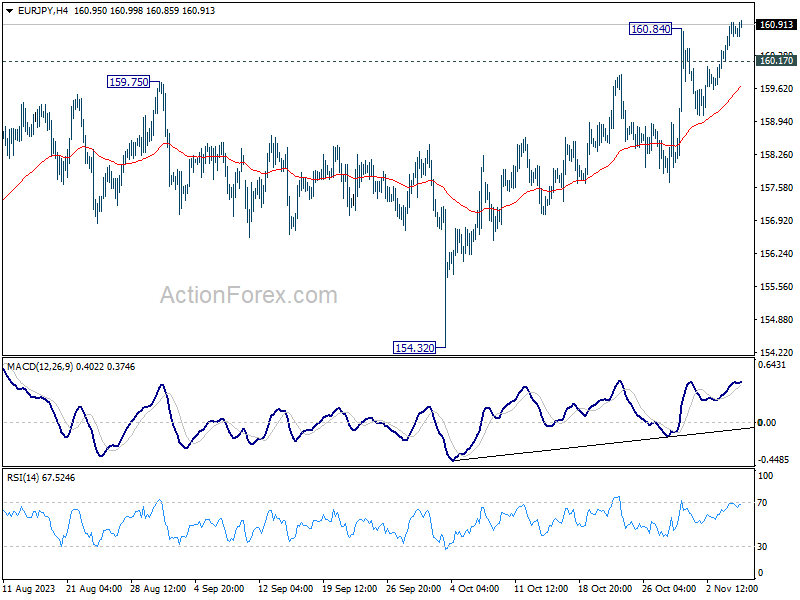
Daily Pivots: (S1) 160.32; (P) 160.65; (R1) 161.17; More....
Break of 160.84 resistance indicates resumption of larger up trend in EUR/JPY. Intraday bias is back on the upside for 163.06 projection level next. On the downside, break of 160.17 minor support will turn intraday bias neutral and bring consolidations first, before staging another rise.
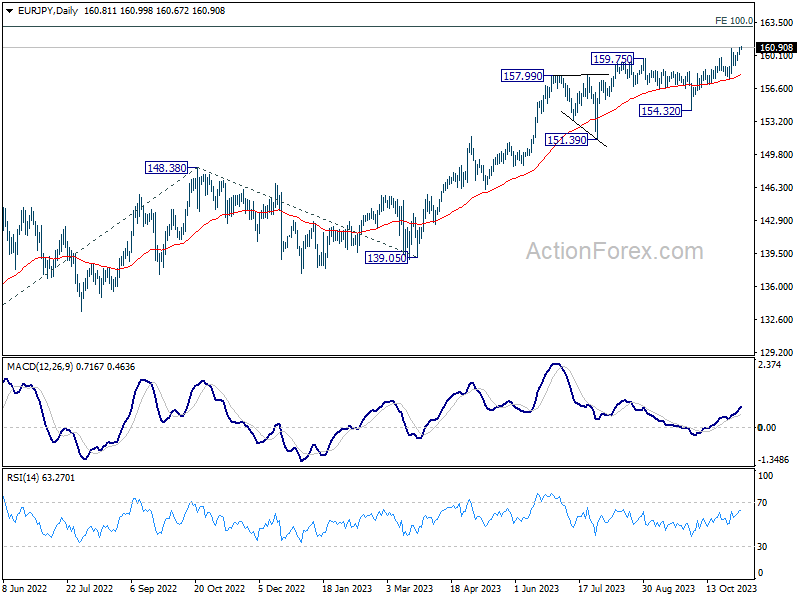
In the bigger picture, rise from 114.42 (2020 low) is in progress. Next target is 100% projection of 124.37 to 148.38 from 139.05 at 163.06. On the downside, break of 154.32 support is needed to be the first sign of medium term topping. Otherwise, outlook will remain bullish even in case of deep pullback.
EUR/GBP Daily Outlook
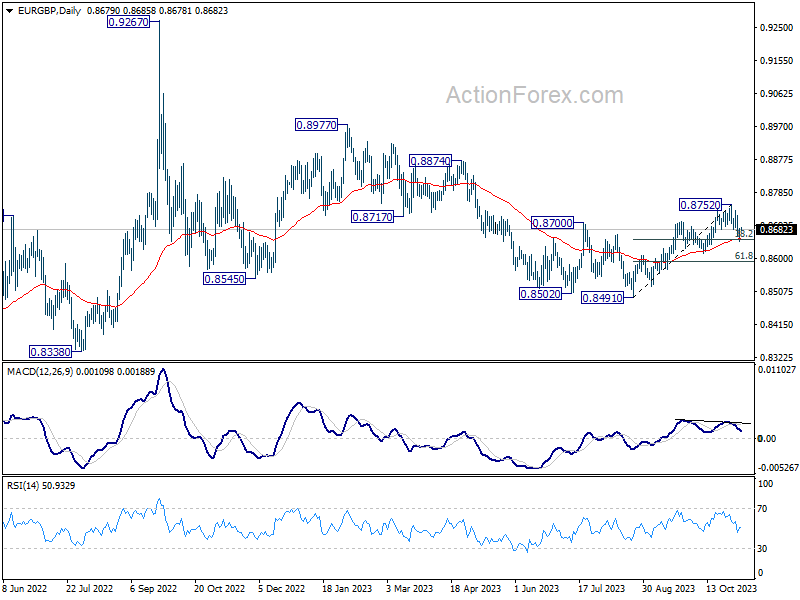
Daily Pivots: (S1) 0.8659; (P) 0.8673; (R1) 0.8696; More....
EUIR/GBP recovered after drawing support from 38.2% retracement of 0.8491 to 0.8752 at 0.8652 and intraday bias is turned neutral first. Pull back from 0.8752 could still extend lower, but downside should be contained by 0.8614 support to bring rebound. Break of 0.8752 resistance to resume the rally from 0.8491 is expected at a later stage.
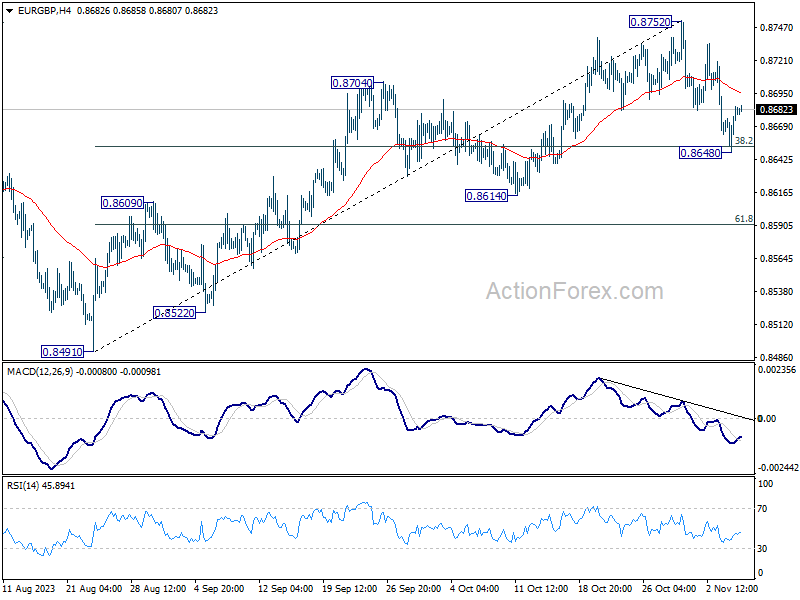
In the bigger picture, current development suggests that whole down trend from 0.9267 (2022 high) has completed with three down to to 0.8491. Rise from 0.8491 is seen as another leg inside that pattern from 0.9499 (2020 high). Further rally should be seen to 0.8977 resistance and above. This will remain the favored case as long as 0.8614 support holds.
EUR/AUD Daily Outlook
Daily Pivots: (S1) 1.6450; (P) 1.6492; (R1) 1.6518; More...
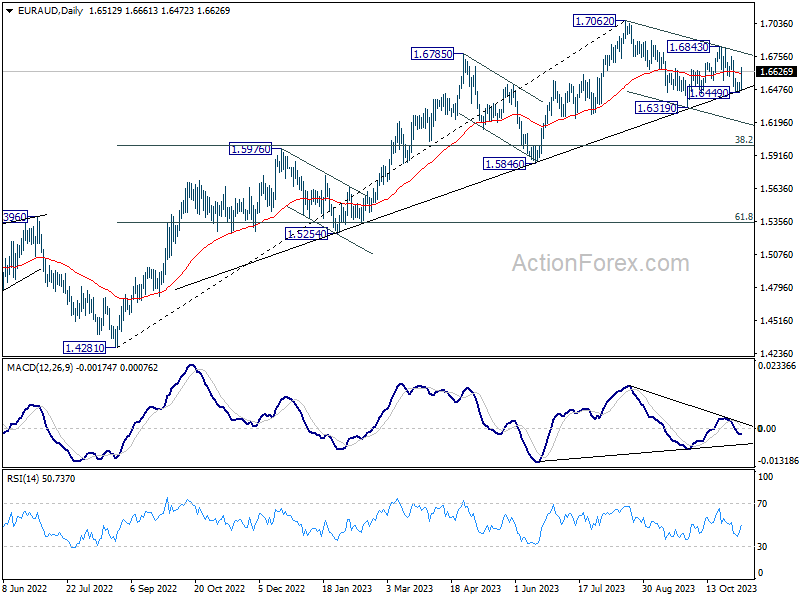
Intraday bias in EUR/AUD is turned neutral first with current recovery. On the downside, break of 1.6449 will target 1.6319 support first. Firm break there will resume the whole decline from 1.7062. However, above 1.6843 will resume the rebound from 1.6319 towards 1.7062 resistance instead.
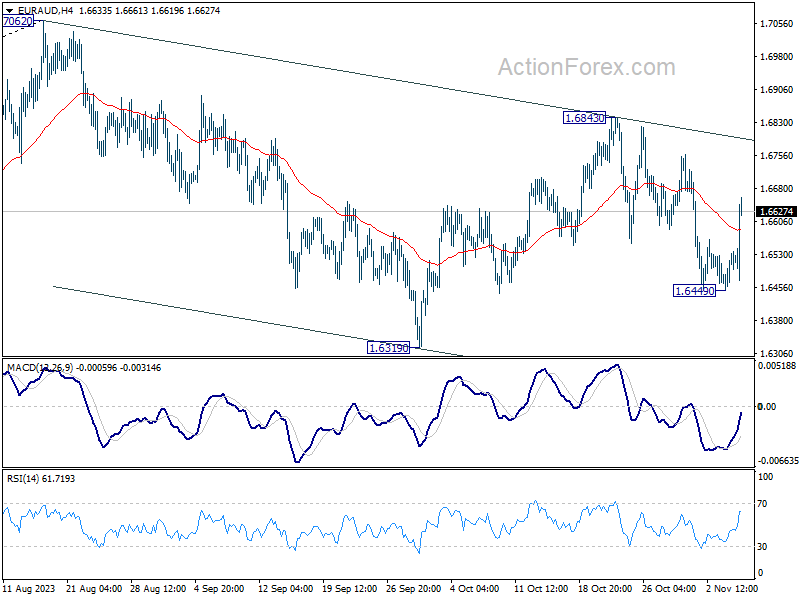
In the bigger picture, current development suggests that 1.7062 is already a medium term top. Fall from there is seen as a correction to the up trend from 1.4281 (2022 low). While deeper decline might be seen, strong support should emerge from 38.2% retracement of 1.4281 to 1.7062 at 1.6000 to contain downside. However, sustained break of 1.6000 will raise the chance of bearish tend reversal.