

Sample Category Title
AUD/USD Daily Report
Daily Pivots: (S1) 0.6393; (P) 0.6448; (R1) 0.6492; More...
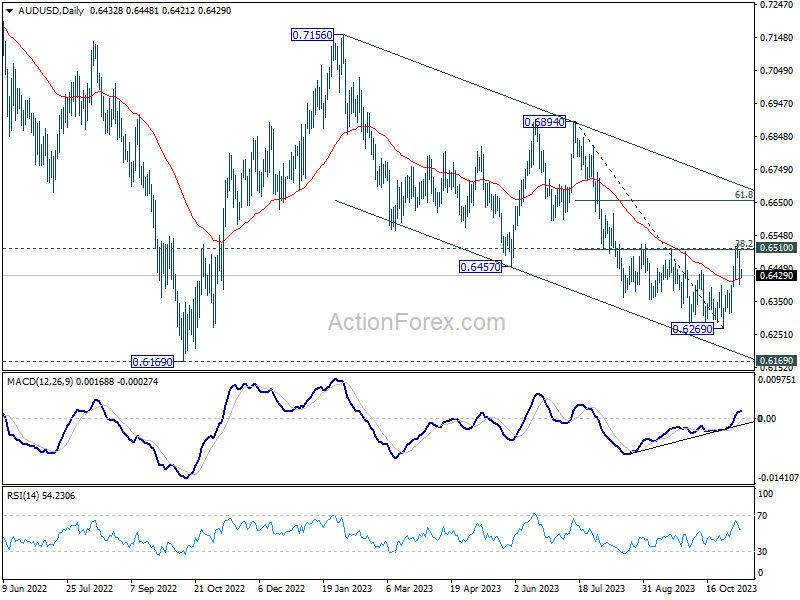
AUD/USD recovered after hitting 0.6411 minor support as well as 55 4H EMA. Intraday bias stays neutral first. On the downside, firm break of 0.6411 will indicate rejection by 0.6510 cluster resistance (38.2% retracement of 0.6894 to 0.6269 at 0.6508) , and turn bias back to the downside for retesting 0.6269 low. Nevertheless, decisive break of 0.6508/10 will argue that whole decline from 0.7156 might be completed with three waves down to 0.6269. Stronger rally should then be seen to medium term trend line resistance (now at 0.6700).
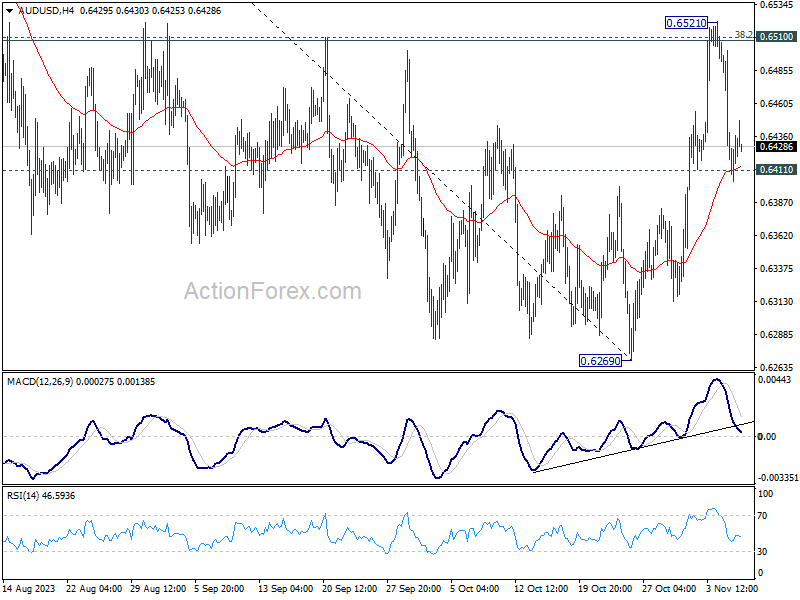
In the bigger picture, there is no confirmation that down trend from 0.8006 (2021 high) has completed. While current rebound from 0.6269 might extend higher, it could be the third leg of a corrective pattern from 0.6169 (2022 low) only. For now, medium term bearishness will remain as long as 0.6894 resistance holds.
Dollar Pauses Rebound, Await More Clues from Fed Officials
Dollar found itself hovering within a narrow range during Asian session, as market participants paused to reflect on recent comments from hawkish Fed members hinting at more tightening. Despite these hawkish tones, the overall risk mood found its footing after the US markets displayed resilience, with only a slight dip in Asian equities following suit.
Market focus is now shifting towards a lineup of speeches from various Fed officials scheduled for today. Fed Chair Jerome Powell. It is anticipated that Fed Chair Jerome Powell will adopt a balanced tone, potentially leaving the task of shaping market expectations to his colleagues. Of special interest is the perspective of New York Fed President John Williams, whose insights often carry significant weight.
In the currency arena, Dollar is leading the pack, with Swiss Franc and Euro trailing behind. Commodity-linked currencies, however, are languishing at the bottom, with Australian Dollar leading. Yen is an outlier, displaying mixed performance despite the supportive rhetoric from BoJ Governor, as traders show little enthusiasm for advancing Yen's position.
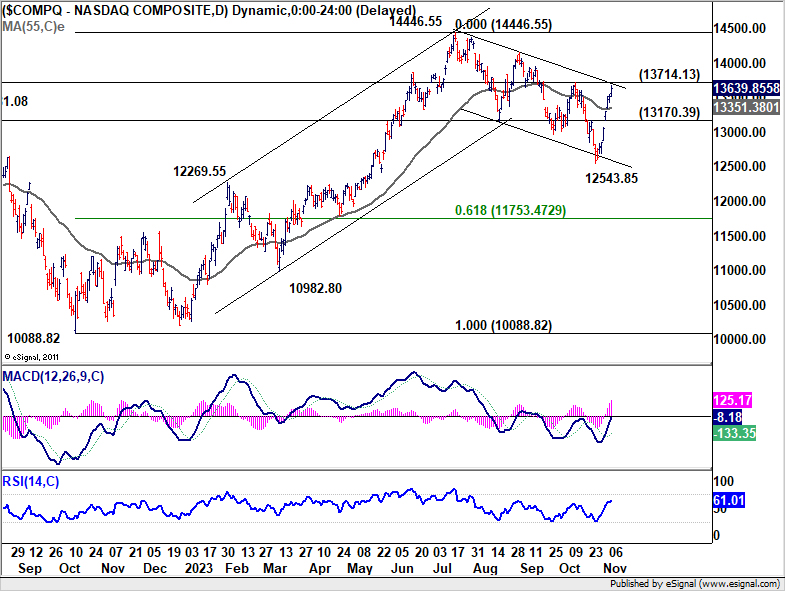
Technically, NASDAQ is in proximity to 13714.13 resistance, which is also close to falling channel resistance. Decisive break there would confirm that whole correction from 14446.55 has completed at 12543.85. Further rally should be seen to retest this high. If materializes, that would solidify near term risk-on sentiment in the overall markets. However, rejection by 13714.13 could open up another fall to extend the correction from 14446.55.
In Asia, at the time of writing, Nikkei is down -0.21%. Hong Kong HSI is down -0.50%. China Shanghai SSE is down -0.35%. Singapore Strait Times is down -1.46%. Japan 10-year JGB yield is down -0.0246 at 0.852. Overnight, DOW rose 0.17%. S&P 500 rose 0.28%. NASDAQ rose 0.90%. 10-year yield dropped -0.091 to 4.571.
Fed's Logan: Tight financial conditions crucial to steer inflation back to target
At a Fed conference overnight, Dallas Fed President Lorie Logan said that inflation appears to be "trending toward 3%", a figure still above the 2% target.
Despite a cooling labor market, Logan highlighted that it remains "too tight," implying that the job market's strength could continue to put upward pressure on wages and, consequently, inflation.
Logan emphasized the need "see tight financial conditions in order to bring inflation to 2% in a timely and sustainable way". She will be looking at "data" and "financial conditions" as the next meeting in December approaches.
With a particular focus on recent retracement in 10-year Treasury yield and broader financial conditions, Logan suggests these elements will play a pivotal role in shaping Fed's forthcoming monetary policy decisions.
Fed's Bowman expects to raise interest rates further
In a speech overnight, Fed Governor Michelle Bowman asserted, "I continue to expect that we will need to increase the federal funds rate further to bring inflation down to our 2% target in a timely way."
She acknowledged that interest rates "appears to be restrictive" while financial conditions "have tightened since September". However, "We don't yet know the effects of tightened financial conditions on economic activity and inflation, she cautioned.
"There is an unusually high level of uncertainty regarding the economy and my own economic outlook, especially considering recent surprises in the data, data revisions, and ongoing geopolitical risks," she noted.
BoJ Ueda suggests easy policy exit could precede real wage recovery
In an address to the parliament today, BoJ Governor Kazuo Ueda indicated a forward-looking approach to monetary policy, wherein the anticipation of rising real wages could be a determinant for policy normalization, rather than their current state.
Ueda posited, "Real wages would likely have turned positive when a positive wage-inflation cycle kicks off."
Delving into the timing of potential policy shifts, Ueda mentioned, "But in terms of how long we maintain our massive monetary easing... real wages don't necessarily have to turn positive before that decision is made."
Clarifying this point, he further elaborated that "The decision could be made if we can foresee with some certainty that real wages will turn positive ahead."
Ueda also addressed the persistent gap between current inflation rates and the bank's longstanding target, stating, "When looking at trend inflation, there's still some distance towards our 2% target. That is why we are continuing with massive easing."
Short-term inflation fears abate according to RBNZ survey
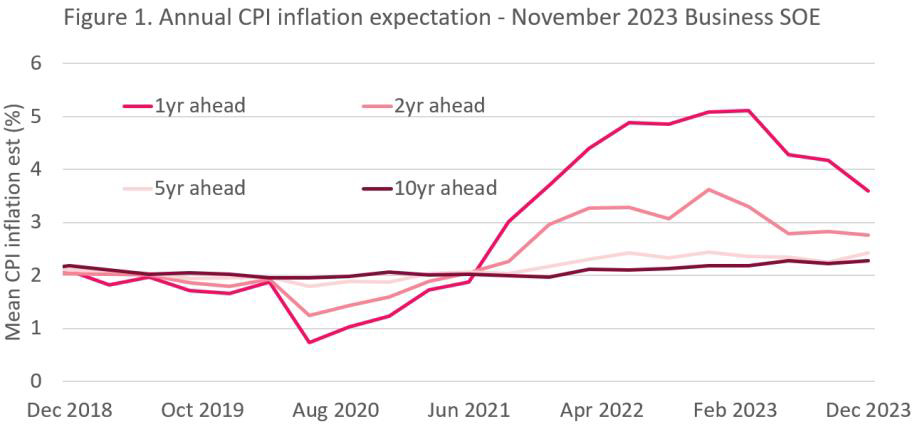
In the latest RBNZ quarterly Business Survey of Expectations, near-term outlook for inflation has cooled, with one-year-ahead expectations retreating from 4.17% to 3.60%, a significant decline of 57 basis points. On a two-year horizon, the expectation for inflation has seen a marginal dip of 7 basis points to 2.76%.
Conversely, expectations for inflation over a five and ten-year span have inched upwards. The survey revealed a mean five-year-ahead annual inflation expectation of 2.43%, marking an 18 basis points increase from the previous quarter's estimate. Ten-year expectations also saw a modest rise of 6 basis points to 2.28%.
With regard to the Official Cash Rate (OCR), the consensus is that it would hover at 5.50% by the end of December 2023. Looking one year ahead, the mean OCR expectation has fallen to 4.99%, indicating that businesses anticipate a loosening of monetary policy in the future once the immediate inflationary pressures have been mitigated.
On the growth front, respondents to the survey are more bullish. The mean one-year-ahead GDP growth expectation increased to 1.26%, up from 1.02%. The forecast for two-year-ahead GDP growth also saw an uptick, rising to 2.15% from the prior 1.95%.
Looking ahead
Germany CPI final, France trade balance, Italy retail sales, and Eurozone retail sales will be release in European session. Later in the day, US wholesale inventories final will be featured. Canada building permits and BoC summary of deliberations will be released too.
AUD/USD Daily Report
Daily Pivots: (S1) 0.6393; (P) 0.6448; (R1) 0.6492; More...
AUD/USD recovered after hitting 0.6411 minor support as well as 55 4H EMA. Intraday bias stays neutral first. On the downside, firm break of 0.6411 will indicate rejection by 0.6510 cluster resistance (38.2% retracement of 0.6894 to 0.6269 at 0.6508) , and turn bias back to the downside for retesting 0.6269 low. Nevertheless, decisive break of 0.6508/10 will argue that whole decline from 0.7156 might be completed with three waves down to 0.6269. Stronger rally should then be seen to medium term trend line resistance (now at 0.6700).
In the bigger picture, there is no confirmation that down trend from 0.8006 (2021 high) has completed. While current rebound from 0.6269 might extend higher, it could be the third leg of a corrective pattern from 0.6169 (2022 low) only. For now, medium term bearishness will remain as long as 0.6894 resistance holds.
Economic Indicators Update
| GMT | Ccy | Events | Actual | Forecast | Previous | Revised |
|---|---|---|---|---|---|---|
| 02:00 | NZD | RBNZ Inflation Expectations Q4 | 2.76% | 2.83% | ||
| 05:00 | JPY | Leading Economic Index Sep P | 108.7 | 108.8 | 109.2 | |
| 07:00 | EUR | Germany CPI M/M Oct | 0.00% | 0.00% | ||
| 07:00 | EUR | Germany CPI Y/Y Oct | 3.80% | 3.80% | ||
| 07:45 | EUR | France Trade Balance (EUR) Sep | -8.1B | -8.2B | ||
| 09:00 | EUR | Italy Retail Sales M/M Sep | -0.20% | -0.40% | ||
| 10:00 | EUR | Eurozone Retail Sales M/M Sep | -0.20% | -1.20% | ||
| 12:30 | CAD | Building Permits M/M Sep | 1.20% | 3.40% | ||
| 15:00 | USD | Wholesale Inventories Sep F | 0.00% | 0.00% |
Hang Seng Index Technical: Potential Bullish Reversal in Progress
- Daily MACD indicator has exhibited a potential medium-term trend change behaviour from bearish to bullish.
- Recent price actions have shaped a minor bullish “Double Bottom” breakout and traded above the 20-day moving average.
- Watch the short-term key support at 17,540.
In the past two weeks, the price actions of the Hong Kong 33 Index (a proxy of the Hang Seng Index futures) have started to exhibit short-term to medium-term bullish bottoming configurations.
Daily MACD continues to show a persistent slow-down in downside momentum
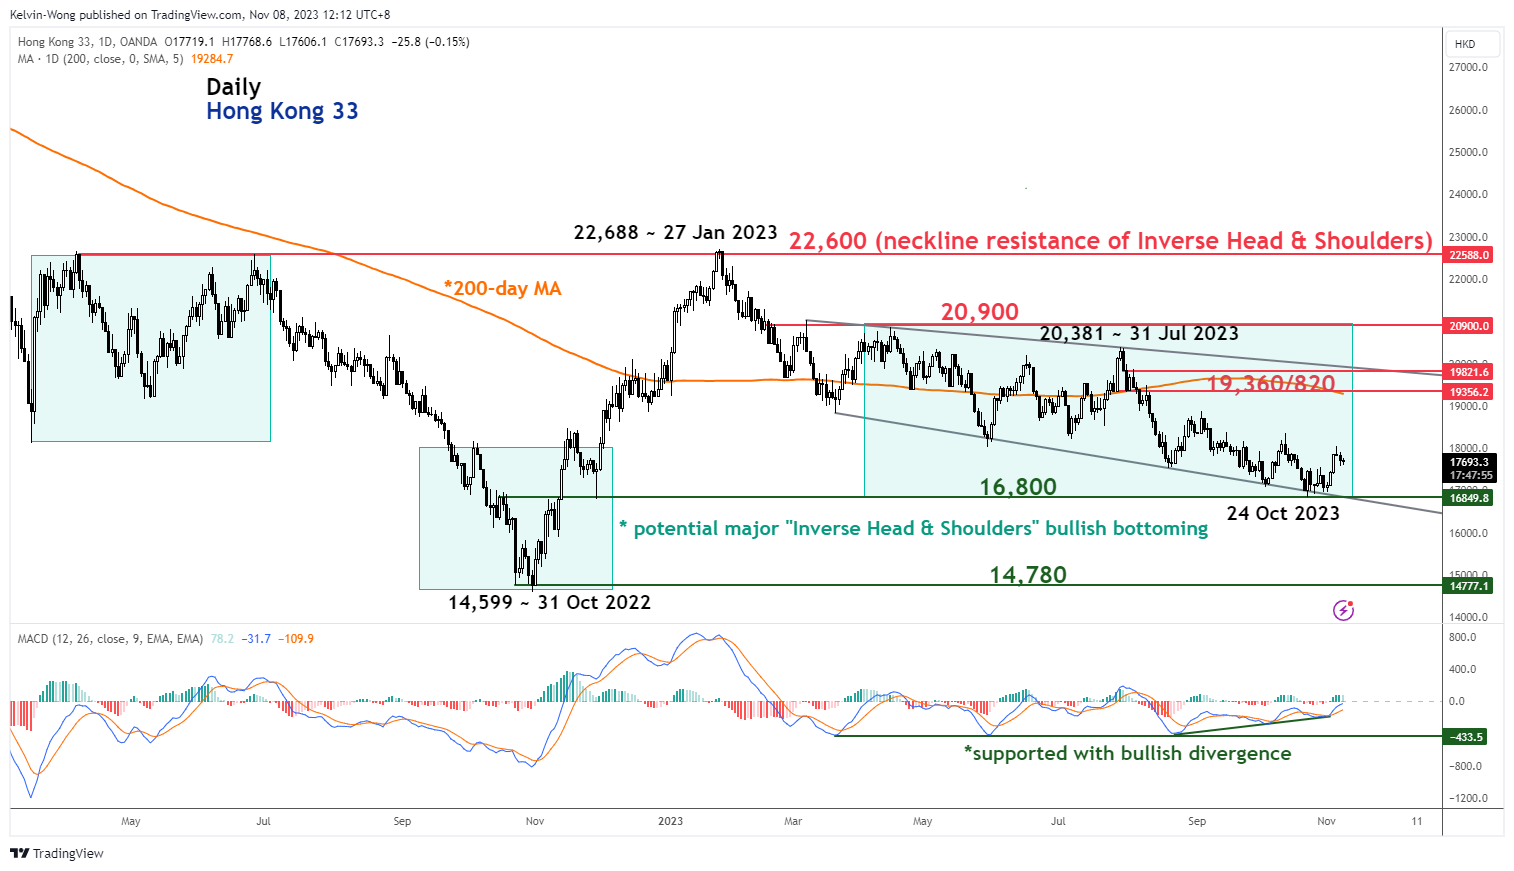
Fig 1: Hong Kong 33 medium-term trend as of 8 Nov 2023 (Source: TradingView, click to enlarge chart)
The medium-term downtrend phase in place since the 27 January 2023 high of 22,688 of the Hong Kong 33 Index has continued to trace out a series of “lower swing lows” attributed to fears of the deflationary spiral in China, geopolitical tensions between the US and China, and lack of ample stimulus measures from China top policymakers.
In the lens of technical analysis, our primary focus lies more on price actions and their reactions from news flows (analysis of how much has been priced into the tradable instruments from either positive or negative related news flow). For example, if market participants are fully aware of the available negative news flows that drive down the tradable price of a highly liquid transacted financial instrument in the current state, a tiny subtle infusion of positive news flow is likely to see a positive reversal in price actions as these negative news flows have been almost fully priced in.
Relative strength study (rate of change or momentum) is one of the major focuses in technical analysis to decipher potential reversal zones of highly liquid transacted financial instruments and also act as a gauge of the strength of trending behaviours as market participants digest and react to the related news flows.
The daily MACD indicator of the Hong Kong 33 Index has started to flash out a series of “higher lows” since 5 October 2023, a bullish divergence condition in contrast with the “lower lows” seen in the price actions of the Index over the same period (relative over here as the MACD is a momentum indicator as well on top of its trend-following elements).
This observation suggests the strength of the medium-term downtrend phase has started to ease which in turn suggests any subtle new positive news flow may trigger a potential sustainable upmove or bullish reversal in the price actions of the Index going forward.
Minor “Double Bottom” bullish breakout, watch the 17,540 key short-term support
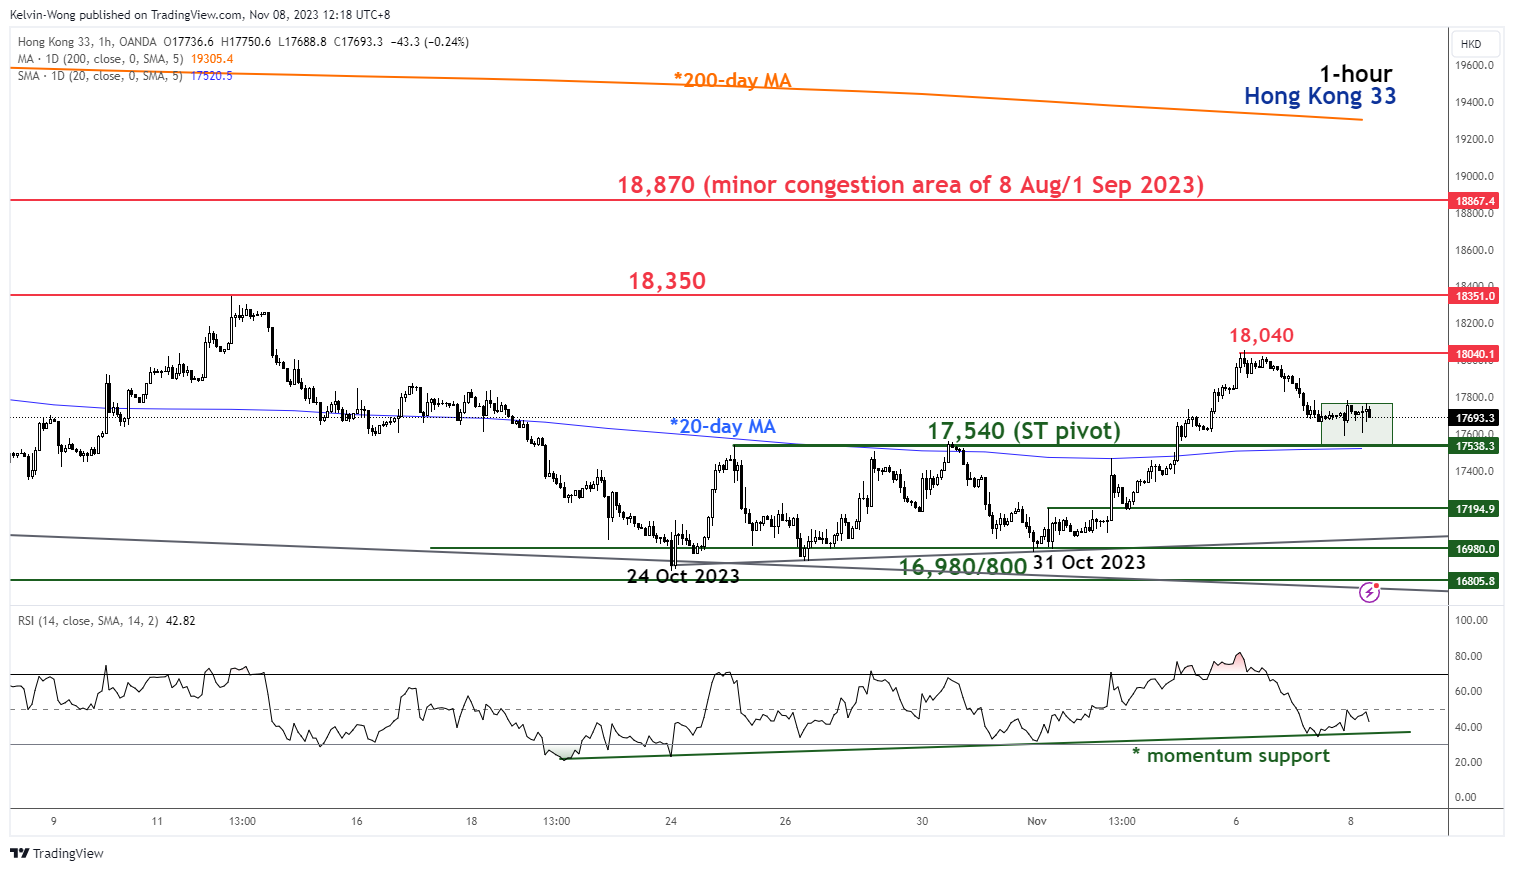
Fig 2: Hong Kong 33 minor short-term trend as of 8 Nov 2023 (Source: TradingView, click to enlarge chart)
In the short-term as seen on its hourly chart, the Index has traced out a minor bullish “Double Bottom” bullish reversal configuration via its recent price actions from 24 October to 31 October 2023.
It has staged a bullish breakout of the neckline resistance of the minor “Double Bottom” and 20-day moving average and price actions since Monday, 6 November have retraced/pull-backed towards these elements now acting as confluence support of 17,540.
In addition, the hourly RSI momentum indicator has managed to stage a rebound from its ascending support yesterday, 7 November which suggests a revival of short-term bullish momentum.
A clearance above 18,040 near-term resistance (6 November minor swing high) may see a further potential push-up towards the next immediate resistance at 18,350 in the first step.
On the flip side, failure to hold at the 17,540 short-term pivotal support negates the bullish tone for a slide to retest the 16,980/16,800 key medium-term support zone.
Short-term inflation fears abate according to RBNZ survey
In the latest RBNZ quarterly Business Survey of Expectations, near-term outlook for inflation has cooled, with one-year-ahead expectations retreating from 4.17% to 3.60%, a significant decline of 57 basis points. On a two-year horizon, the expectation for inflation has seen a marginal dip of 7 basis points to 2.76%.
Conversely, expectations for inflation over a five and ten-year span have inched upwards. The survey revealed a mean five-year-ahead annual inflation expectation of 2.43%, marking an 18 basis points increase from the previous quarter's estimate. Ten-year expectations also saw a modest rise of 6 basis points to 2.28%.
With regard to the Official Cash Rate (OCR), the consensus is that it would hover at 5.50% by the end of December 2023. Looking one year ahead, the mean OCR expectation has fallen to 4.99%, indicating that businesses anticipate a loosening of monetary policy in the future once the immediate inflationary pressures have been mitigated.
On the growth front, respondents to the survey are more bullish. The mean one-year-ahead GDP growth expectation increased to 1.26%, up from 1.02%. The forecast for two-year-ahead GDP growth also saw an uptick, rising to 2.15% from the prior 1.95%.
BoJ Ueda suggests easy policy exit could precede real wage recovery
In an address to the parliament today, BoJ Governor Kazuo Ueda indicated a forward-looking approach to monetary policy, wherein the anticipation of rising real wages could be a determinant for policy normalization, rather than their current state.
Ueda posited, "Real wages would likely have turned positive when a positive wage-inflation cycle kicks off."
Delving into the timing of potential policy shifts, Ueda mentioned, "But in terms of how long we maintain our massive monetary easing... real wages don't necessarily have to turn positive before that decision is made."
Clarifying this point, he further elaborated that "The decision could be made if we can foresee with some certainty that real wages will turn positive ahead."
Ueda also addressed the persistent gap between current inflation rates and the bank's longstanding target, stating, "When looking at trend inflation, there's still some distance towards our 2% target. That is why we are continuing with massive easing."
NZ First Impressions: RBNZ Survey of Expectations, Q4 2023
Today’s survey was a mixed bag for the RBNZ. Inflation expectations were down at shorter horizons. However, expectations for inflation at longer horizons have picked up and they remain above 2%.
Inflation expectations
- One year ahead: 3.60% (Prev: 4.17%, down 0.57 points)
- Two years ahead: 2.76% (Prev: 2.83%, down 0.07 points)
- Five years ahead: 2.43% (Prev: 2.25%, up 0.18 points)
- Ten years ahead: 2.28% (Prev: 2.22%%, up 0.06 points)
November’s update on inflation expectations was a mixed bag for the RBNZ. Inflation is expected to continue dropping over the next few years and it’s expected to be back below 3% within two years. However, the survey’s respondents are looking increasingly sceptical that inflation is heading back to the 2% target midpoint anytime soon.
Looking at the details of the November quarter report, expectations for inflation one year ahead have dropped sharply, falling from 4.17% in the previous survey to 3.60% now. That’s a large fall and follows the lower-than-expected September quarter inflation result – inflation in the year to September was 5.6%, below the RBNZ’s forecast for a 6% rise.
Similarly, expectations for inflation in two years have nudged down from 2.83% to 2.76%. That’s not a big change, but the RBNZ will take some comfort from the fact that expectations at this closely watched horizon are gradually edging down. Similarly, expectations for wage growth over the next few years have also been softening.
However, the survey’s respondents are more circumspect about the outlook for inflation further ahead. Expectations for inflation five and ten years ahead have picked up and remain above 2%.
Overall, the results of today’s survey won’t prompt any change in the RBNZ’s stance at its upcoming November policy meeting. The RBNZ is set to keep the OCR on hold at 5.50%.
However, the persistence in longer term inflation expectations does reinforce the likelihood that the RBNZ will have to keep the OCR at elevated levels for an extended period to get inflation back to levels consistent with its target.
We’re forecasting another rate hike from the RBNZ next year. Given the lingering strength in domestic inflation and inflation expectations, we don’t think rate cuts will come on to the table until early 2025.
Lastly, expectations for house prices have continued to rise. The survey’s respondents now expect house prices will rise by 4.8% over the coming year (previously, a rise of only 1.4% was expected).
Technical Outlook and Review
DXY:
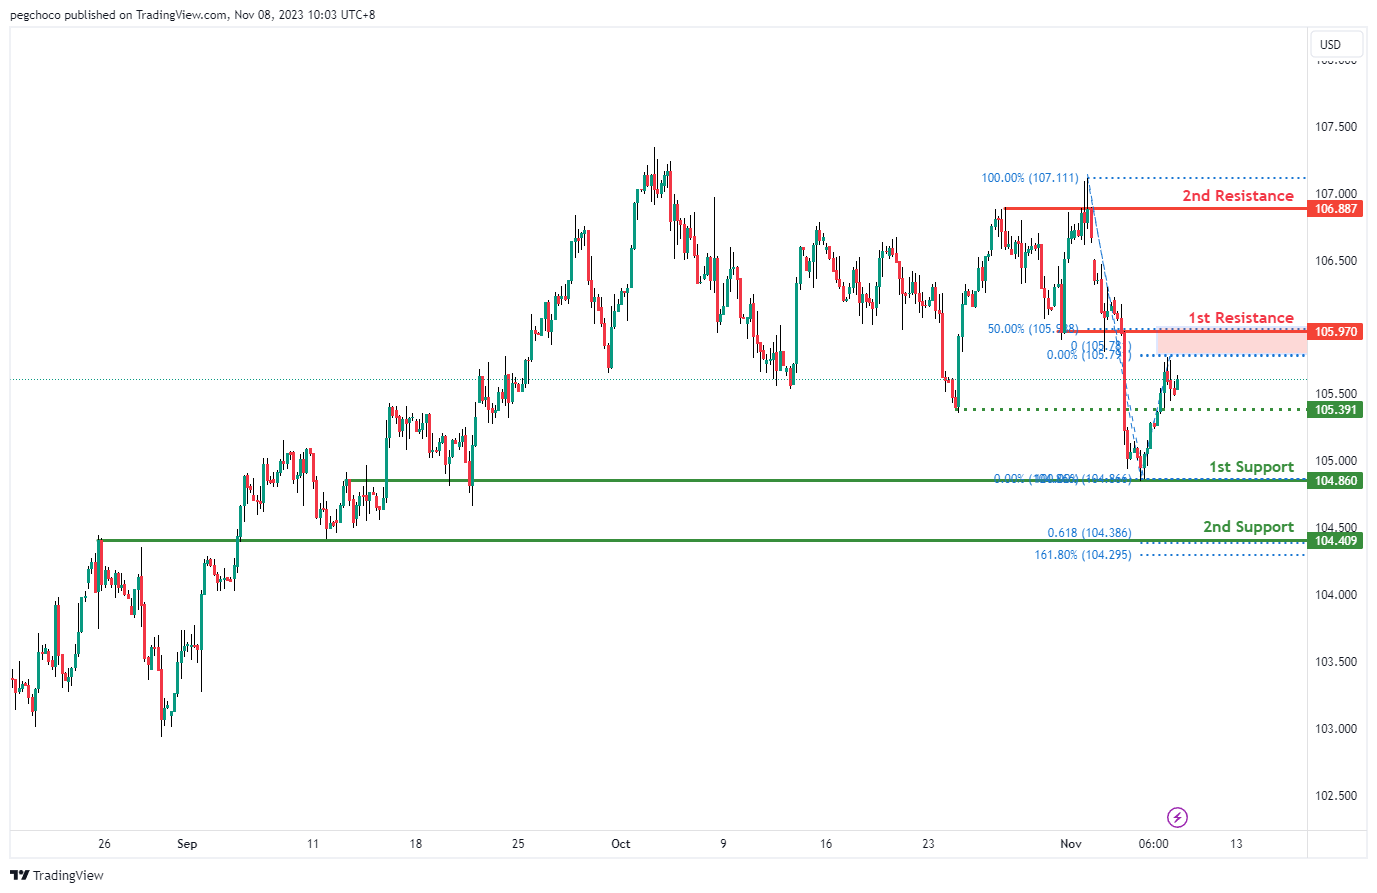
The DXY (US Dollar Index) chart currently exhibits a bearish overall momentum, suggesting the potential for a bearish reaction off the 1st resistance level, followed by a drop towards the 1st support level.
The 1st support at 104.86 is identified as an overlap support, indicating it could be a significant level where the price might find support. Additionally, the 2nd support at 104.40 is considered an overlap support and is reinforced by the presence of the 161.80% Fibonacci Extension and the 61.80% Fibonacci Projection, indicating Fibonacci confluence. This makes it a strong support zone where buyers may step in.
On the resistance side, the 1st resistance at 105.97 is categorized as a pullback resistance, suggesting it could act as a level where the price faces selling pressure and potentially reverses its bearish movement.
Furthermore, the 2nd resistance at 106.88 is identified as a multi-swing high resistance, indicating another potential level where the price may encounter obstacles in its upward movement.
Intermediate support at 105.39 is noted as a pullback support, providing an additional support level to watch for potential price movements.
EUR/USD:
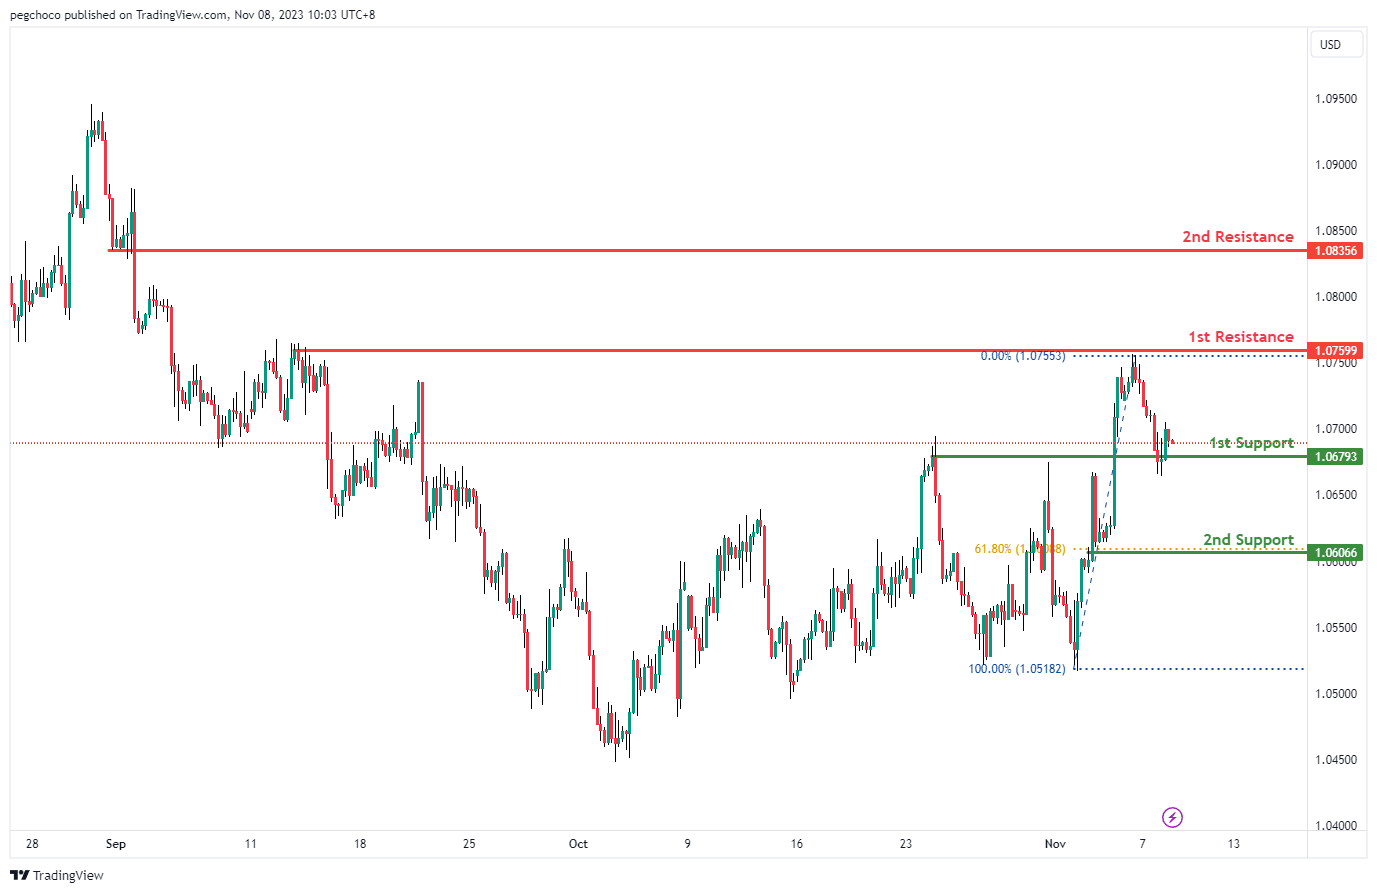
The EUR/USD chart currently exhibits a bullish overall momentum, indicating the potential for a bullish continuation towards the 1st resistance level.
The 1st support at 1.0679 is identified as an overlap support, suggesting it could be a significant level where the price may find buying interest. Additionally, the 2nd support at 1.0606 is reinforced by the presence of the 61.80% Fibonacci Retracement, making it another strong support level.
On the resistance side, the 1st resistance at 1.0759 is categorized as a multi-swing high resistance, indicating it could act as a level where the price faces selling pressure and may encounter obstacles in its upward movement.
Furthermore, the 2nd resistance at 1.0835 is identified as a pullback resistance, suggesting it could also serve as a point where the price may find resistance and potentially reverse.
EUR/JPY:
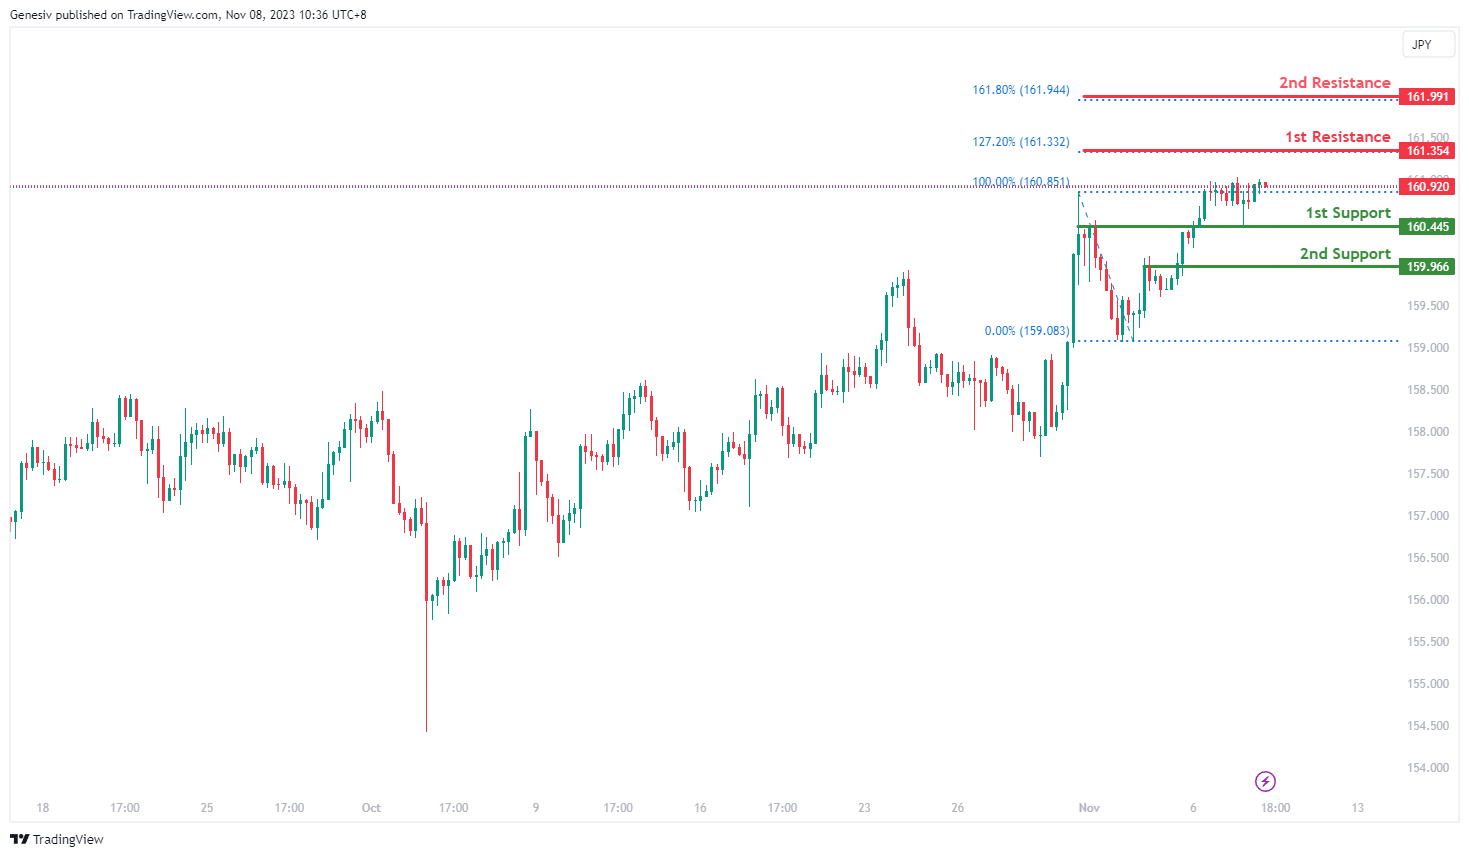
For EUR/JPY, considering the current bearish momentum in the chart, there’s a potential scenario where the price could increase towards the first resistance in the short term before reversing from that level and dropping towards the first support.
The first support at 160.45 is identified as an overlap support, marking a significant level where the price might find substantial support during a potential decline in the bearish trend.
The second support at 159.96 is recognized as a level of pullback support, indicating an additional area that might offer crucial support in case of a price decline within the bearish trend.
On the resistance side, the first resistance at 161.35 is associated with the 127.20% Fibonacci Extension, presenting a level that may act as a significant barrier to the price’s upward movement in the short term within the prevailing bearish scenario.
Furthermore, the second resistance at 161.99 is identified as a level coinciding with the 161.80% Fibonacci Extension, suggesting it as an additional substantial obstacle to the price’s upward movement within the current bearish trend.
EUR/GBP:
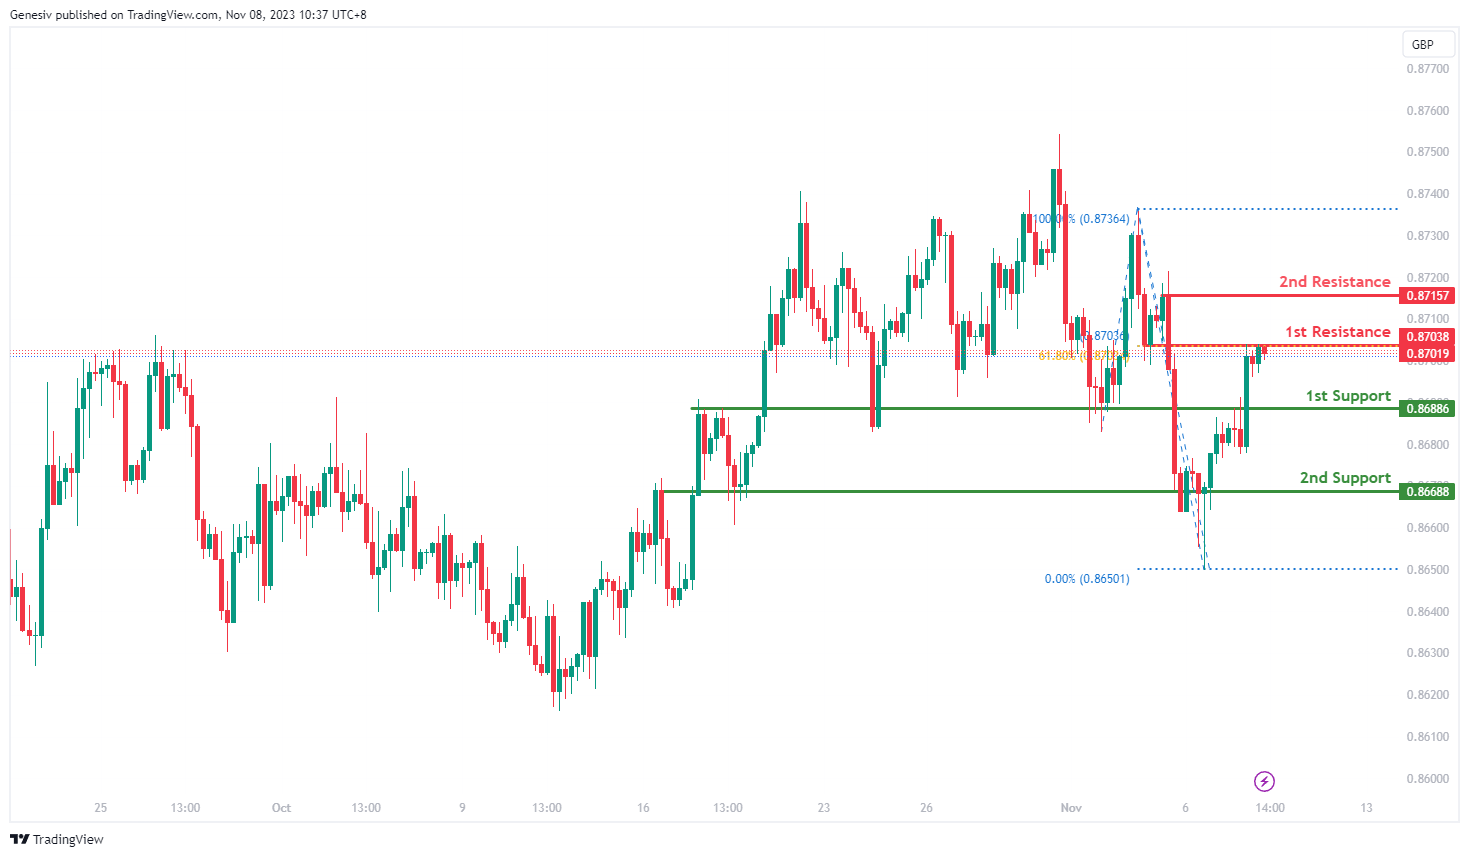
For EUR/GBP, given the bearish momentum in the chart, there’s a potential scenario where the price might exhibit a bearish reaction off the first resistance and subsequently drop towards the first support.
The first support at 0.8688 is identified as a level of pullback support, suggesting it could serve as a significant area where the price might find substantial support during a potential decline in the bearish trend.
The second support at 0.8668 is also recognized as pullback support, indicating an additional area that could offer crucial support in case of a price drop within the bearish trend.
On the resistance side, the first resistance at 0.8703 is characterized as an overlap resistance, coinciding with the 61.80% Fibonacci Retracement and the 100% Fibonacci Projection. This convergence of Fibonacci levels suggests it as a key level where the price might face considerable resistance and potentially trigger a bearish move.
Additionally, the second resistance at 0.8715 is identified as a swing high resistance, indicating it as an additional substantial barrier to the price’s upward movement within the prevailing bearish trend.
GBP/USD:
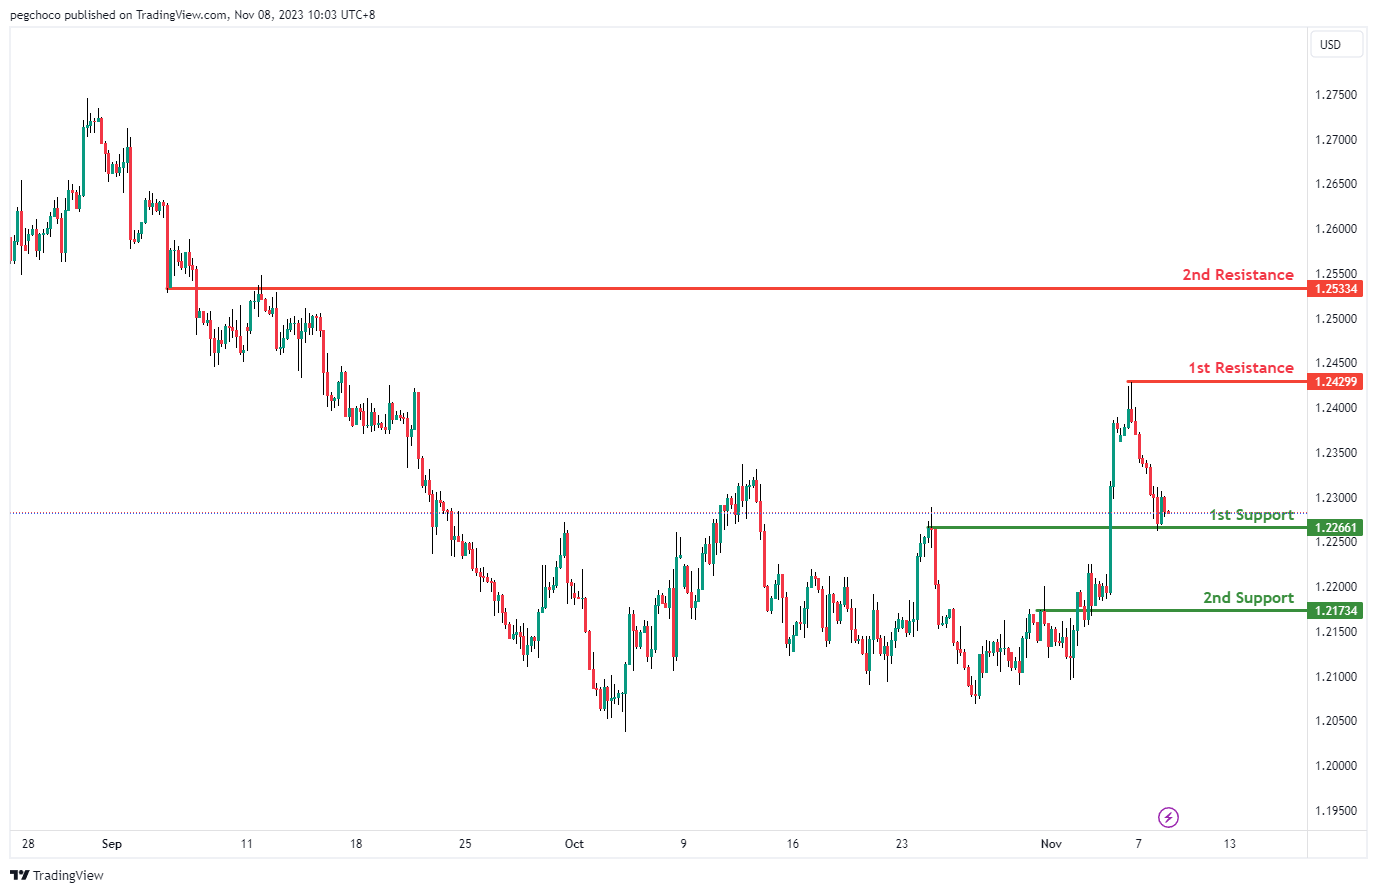
The GBP/USD chart currently exhibits a bullish overall momentum, suggesting the potential for a bullish bounce off the 1st support level and a move towards the 1st resistance.
The 1st support at 1.2266 is identified as an overlap support, indicating it could be a significant level where the price might find buying interest. Additionally, the 2nd support at 1.2173 is reinforced by the presence of an overlap support, further strengthening its potential as a support level.
On the resistance side, the 1st resistance at 1.2429 is categorized as a swing high resistance, suggesting it could act as a level where the price faces selling pressure and may encounter obstacles in its upward movement.
Furthermore, the 2nd resistance at 1.2533 is identified as an overlap resistance, indicating another potential level where the price may find resistance.
GBP/JPY:
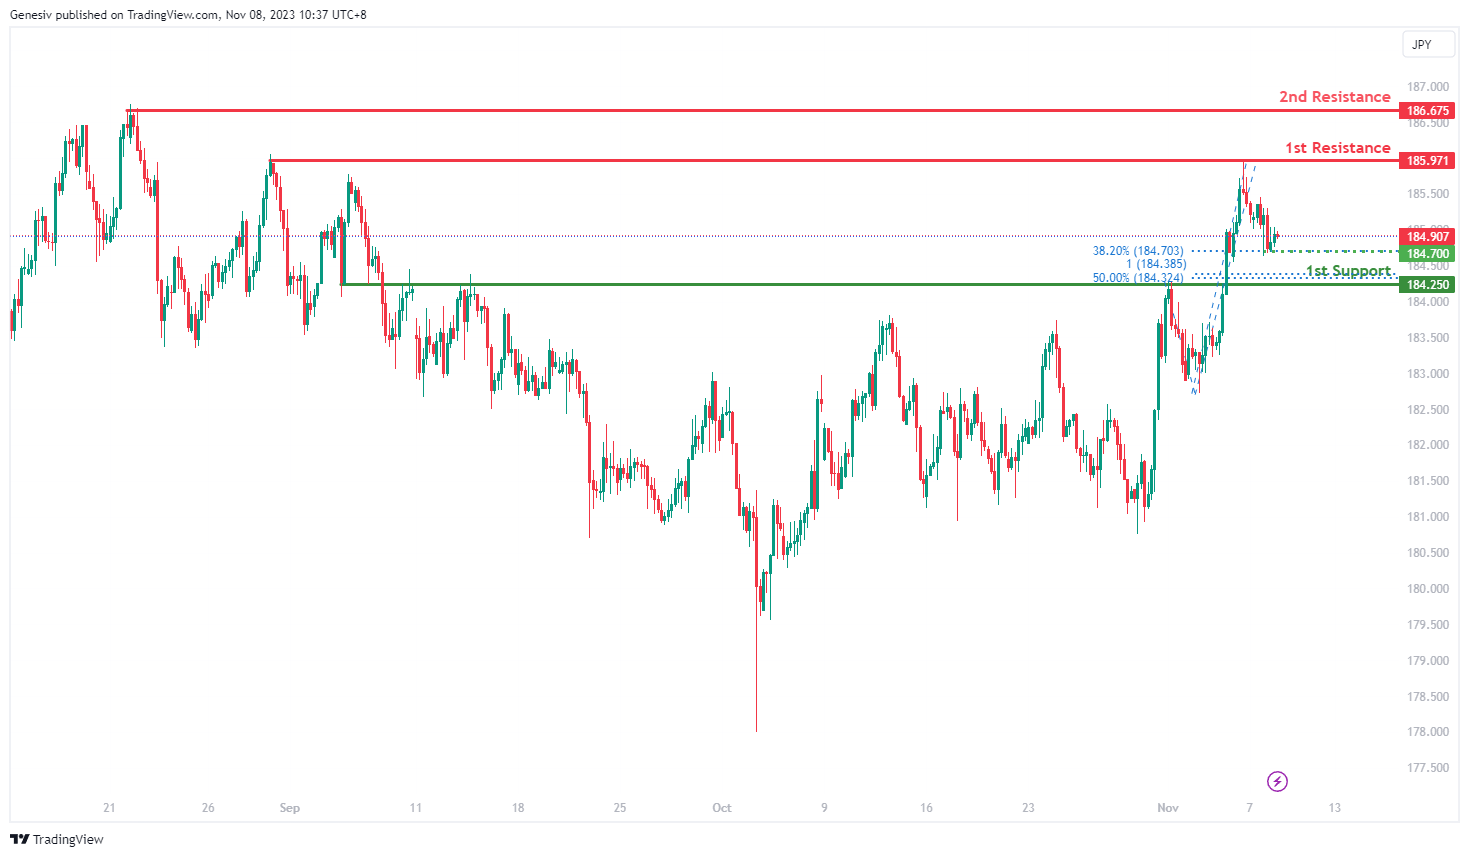
For GBP/JPY, considering the current bearish momentum in the chart, there’s a potential scenario where the price might continue in a bearish direction towards the first support level.
The first support at 184.25 is identified as a crucial level of pullback support, coinciding with both the 50% Fibonacci Retracement and the 100% Fibonacci Projection. This confluence of Fibonacci levels indicates a significant area where the price could potentially find strong support and initiate a rebound within the bearish trend.
The intermediate support at 184.70 is also considered a relevant level, marked as a swing low support and aligned with the 38.20% Fibonacci Retracement. It further reinforces this area as a potential support level within the bearish trajectory.
On the resistance side, the first resistance at 185.97 is identified as a multi-swing high resistance, indicating it as a significant barrier that the price may struggle to surpass during a bearish movement.
Additionally, the second resistance at 186.67 is recognized as a level of swing high resistance, suggesting it as an additional obstacle to the price’s upward movement within the prevailing bearish trend.
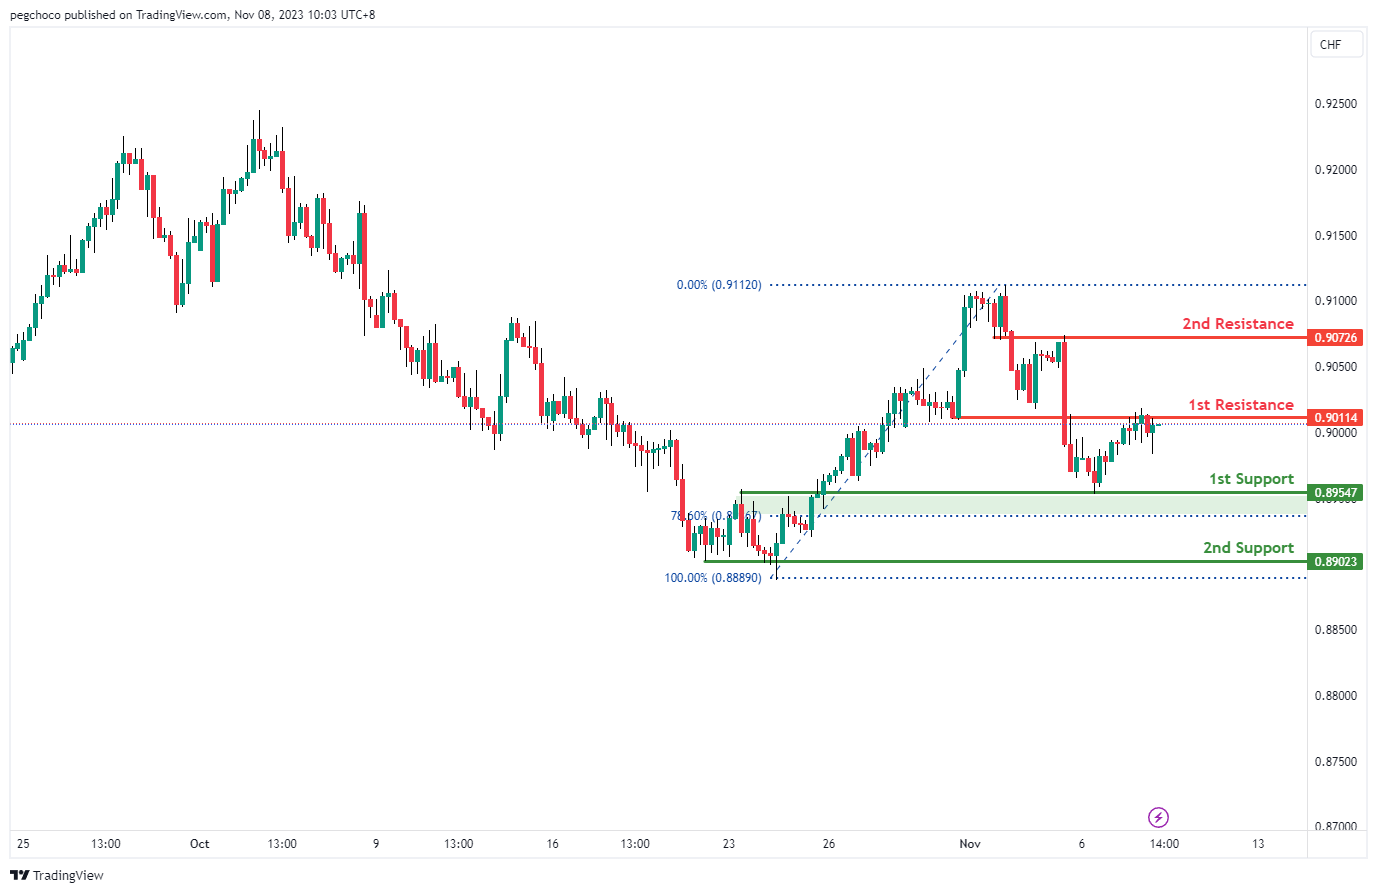
USD/CHF:
The USD/CHF chart currently has a bearish overall momentum, suggesting the potential for a bearish reaction off the 1st resistance level and a drop towards the 1st support.
The 1st support at 0.8954 is identified as an overlap support, and it also coincides with the 78.60% Fibonacci Retracement level. This makes it a significant level where the price might find buying interest.
Additionally, the 2nd support at 0.8902 is considered a multi-swing low support, further reinforcing its potential as a support level.
On the resistance side, the 1st resistance at 0.9011 is categorized as an overlap resistance, suggesting it could act as a level where the price may face selling pressure and potentially trigger a bearish reaction.
Furthermore, the 2nd resistance at 0.9072 is also identified as an overlap resistance, adding another layer of potential resistance for the price.
USD/JPY:
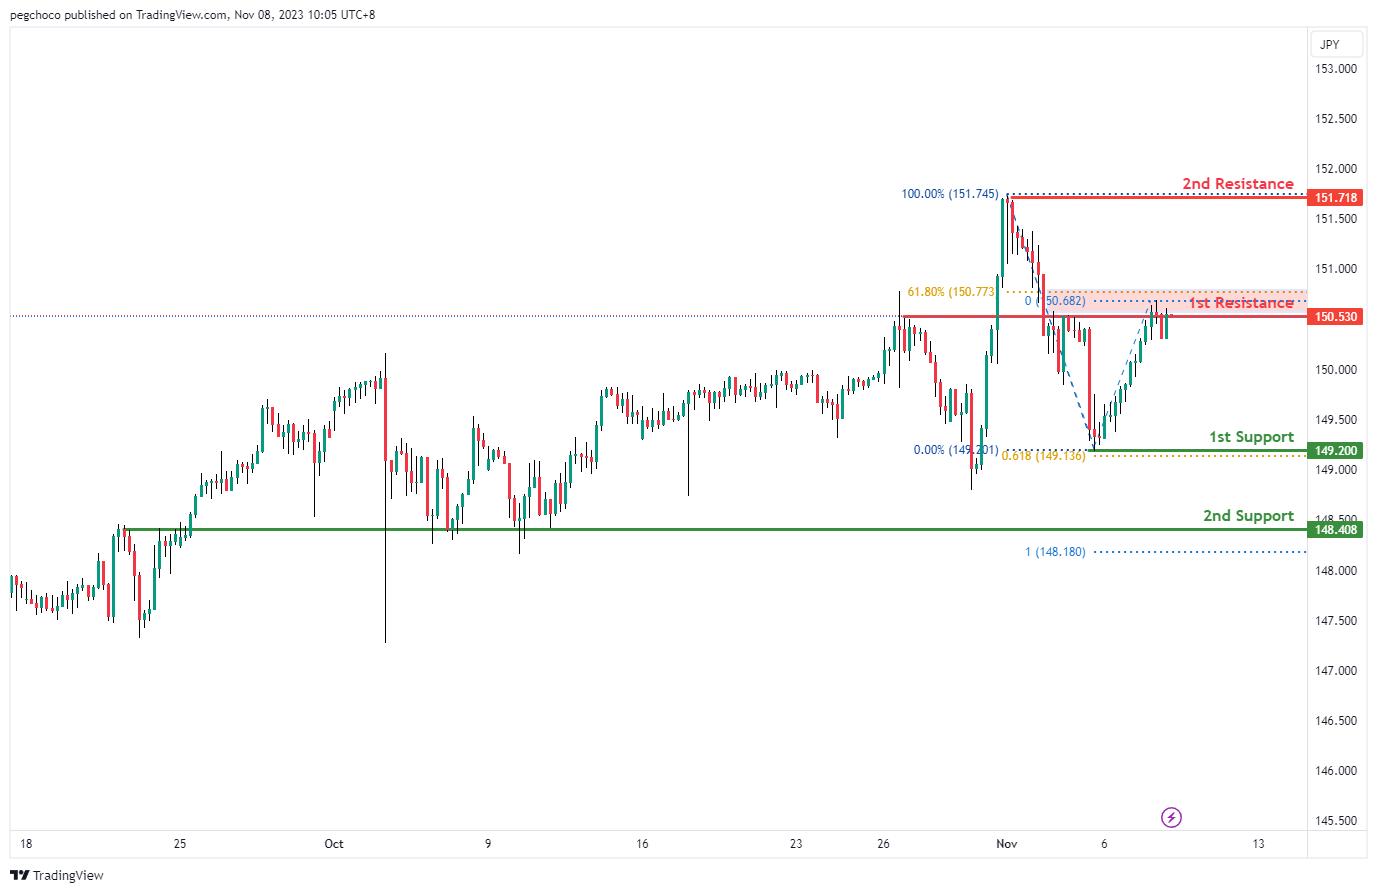
The USD/JPY chart currently exhibits a bearish overall momentum, suggesting the potential for a bearish reaction off the 1st resistance level and a subsequent drop towards the 1st support.
The 1st support at 149.20 is identified as a swing low support and also coincides with the 61.80% Fibonacci Projection level, making it a significant level where the price might find buying interest.
Additionally, the 2nd support at 148.40 is considered an overlap support, which further reinforces its potential as a support level.
On the resistance side, the 1st resistance at 150.53 is categorized as a pullback resistance, and it coincides with the 61.80% Fibonacci Retracement level, suggesting it could act as a level where the price may face selling pressure and potentially trigger a bearish reaction.
Furthermore, the 2nd resistance at 151.71 is identified as a swing high resistance, indicating another potential level where the price may encounter obstacles in its upward movement.
USD/CAD:
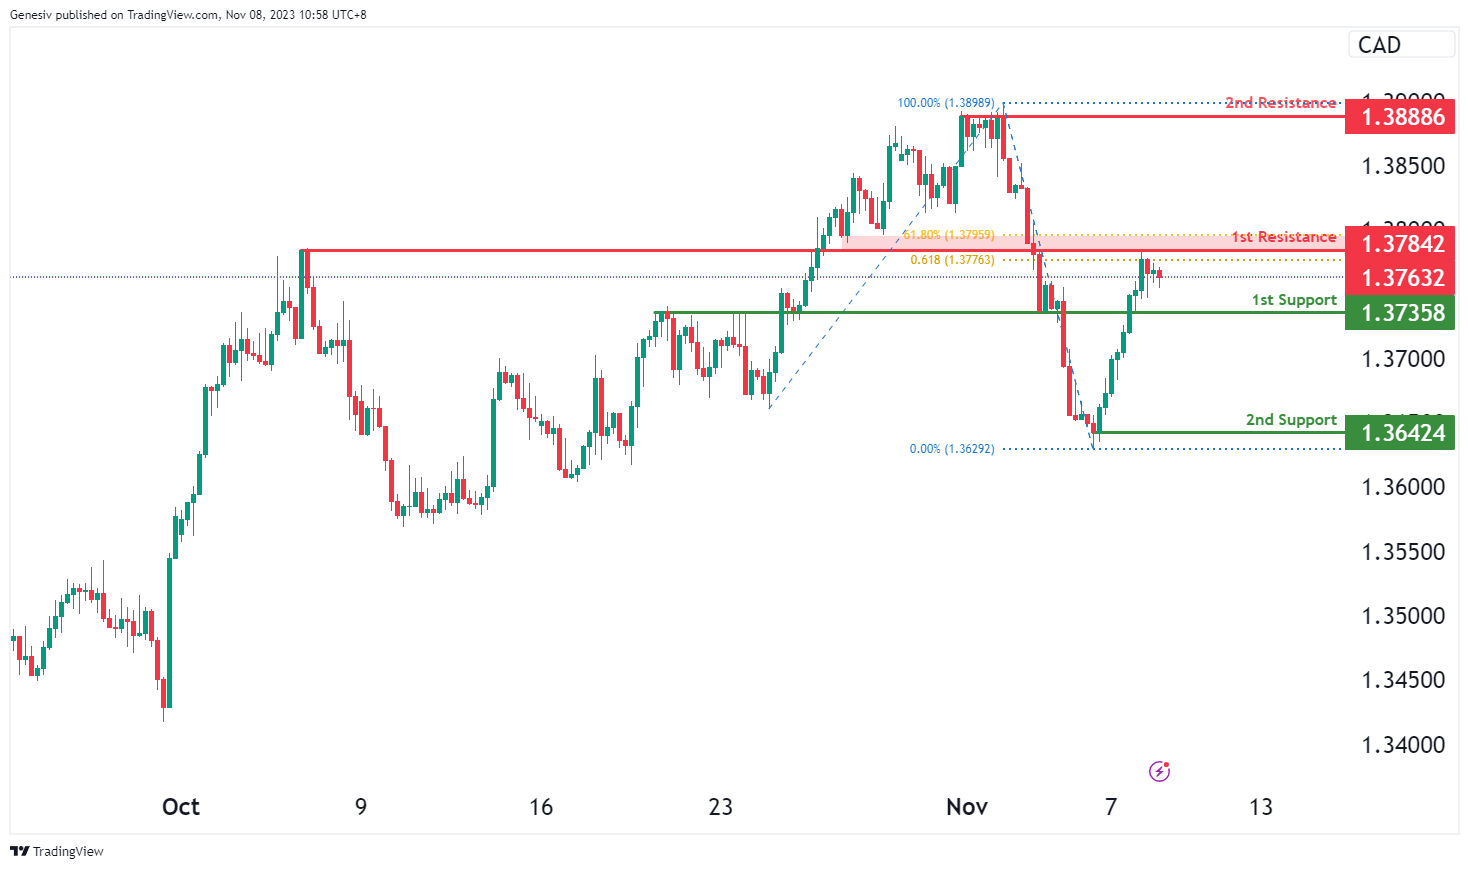
The USD/CAD chart is currently exhibiting an overall bullish momentum, indicating a potential for price to make a bullish continuation towards the 1st resistance.
The 1st resistance level at 1.3784 is identified as an overlap resistance that aligns with a confluence of Fibonacci levels i.e. the 61.80% retracement and the 61.80% projection levels. Higher up, the 2nd resistance level at 1.3889 is marked as a pullback resistance, suggesting that it may act as a strong resistance zone.
To the downside, the 1st support level at 1.3736 is identified as an overlap support. Further below, the 2nd support level at 1.3642 is noted as a swing-low support, adding to its potential as a level where price could find support.
AUD/USD:
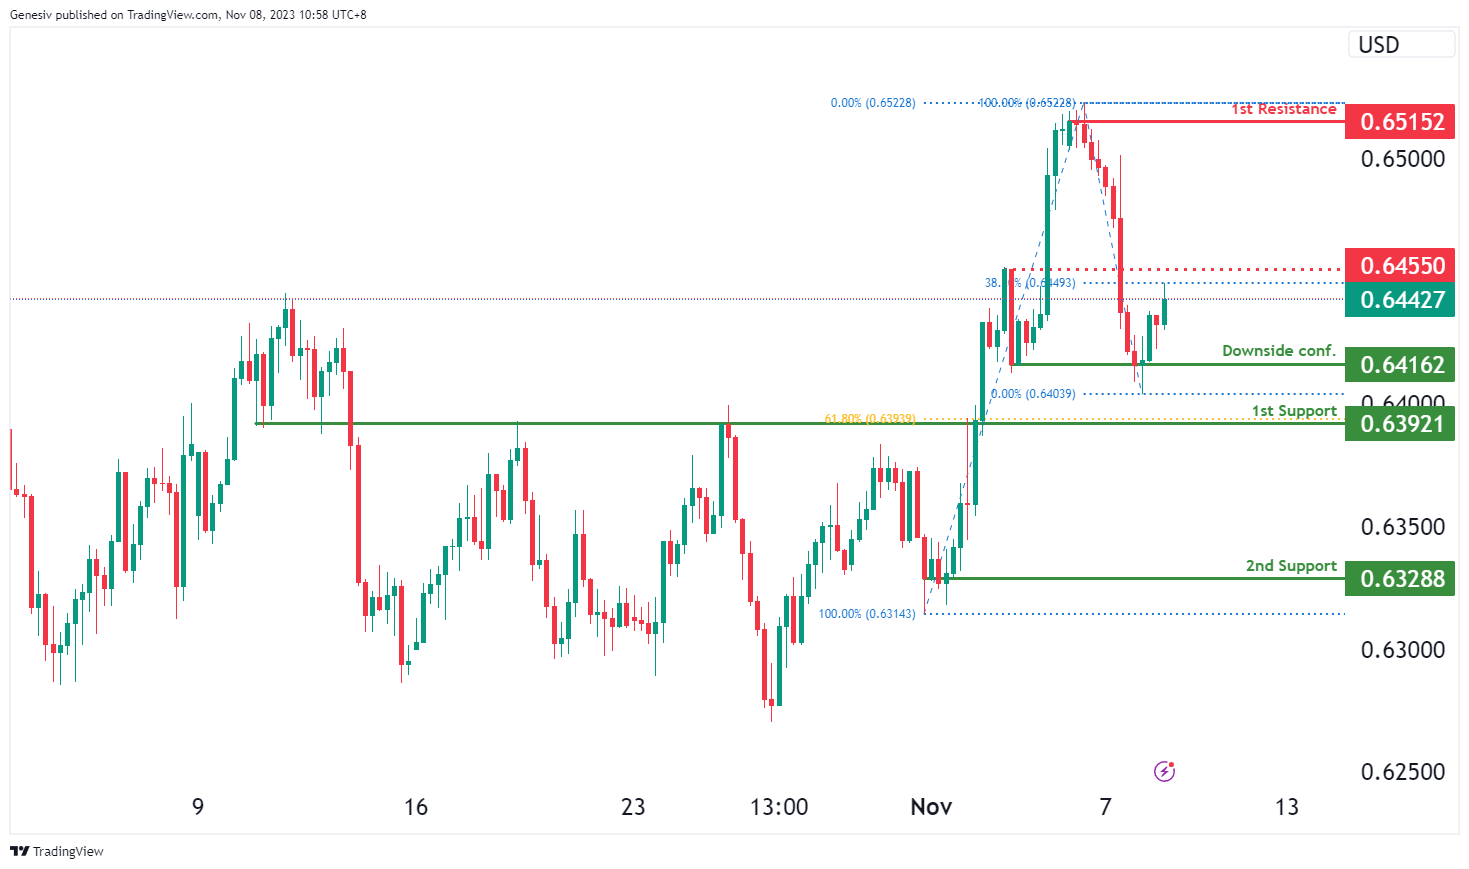
The AUD/USD chart is currently characterized by a weak bullish momentum. However, there is potential for a bearish continuation towards the 1st support level should price break below the downside confirmation level.
The downside confirmation level at 0.6416 is identified as a pullback support while the 1st support level at 0.6392 is marked as an overlap support that aligns with the 61.80% Fibonacci retracement level. Further below, the 2nd support level at 0.6329 is noted as a pullback support, reinforcing its potential as a level of support for the price.
On the resistance side, the intermediate resistance level at 0.6455 is identified as a pullback resistance that aligns close to the 38.20% Fibonacci retracement level. Additionally, the 1st resistance level at 0.6515 is marked as a swing-high resistance, indicating another potential obstacle for the price’s upward movement.
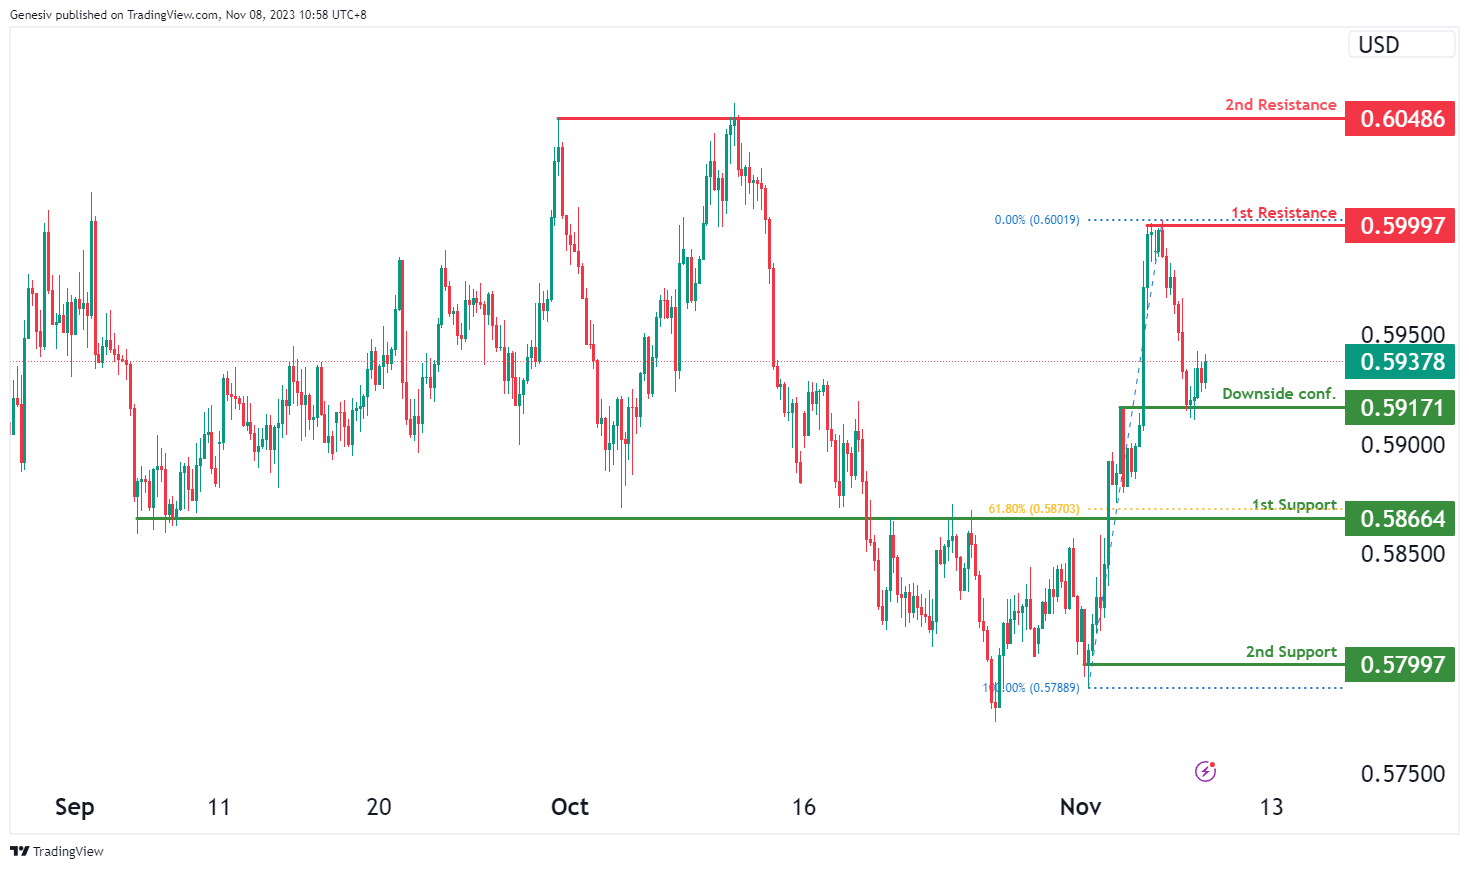
NZD/USD
The NZD/USD chart is currently characterized by a weak bullish momentum. However, there is potential for a bearish continuation towards the 1st support level should price break below the downside confirmation level.
The downside confirmation level at 0.5917 is identified as an overlap support while the 1st support level at 0.5866 is also noted as an overlap support that aligns with the 61.80% Fibonacci retracement level. Further below, the 2nd support level at 0.5799 is marked as a swing-low support, reinforcing its potential significance as a level of support.
On the resistance side, the 1st resistance level at 0.5999 is identified as a swing-high resistance. Higher up, the 2nd resistance level at 0.6049 is marked as a multi-swing-high resistance, indicating another potential level where the price may face obstacles in its upward movement.
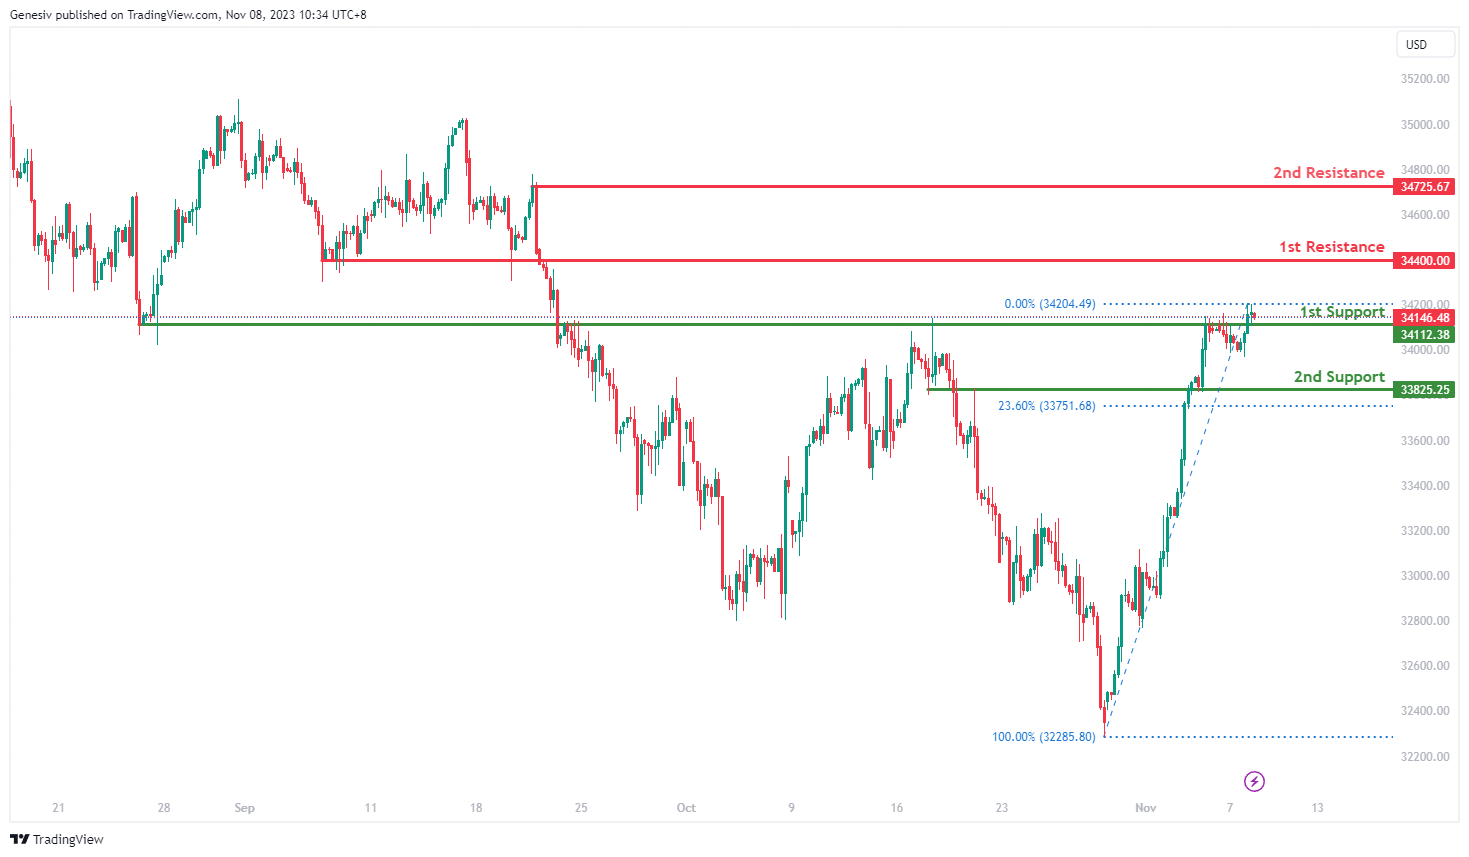
DJ30:
For DJ30, with the current bullish momentum on the chart, there’s a potential scenario where the price might experience a bullish bounce off the first support and move towards the first resistance.
The first support at 34112.38 is identified as an overlap support, indicating a significant level where the price might find substantial support during a potential retracement in the bullish trend.
The second support at 33825.25 is recognized as another overlap support and coincides with the 23.60% Fibonacci Retracement, marking an additional area that might offer crucial support in case of a price decline within the bullish trend.
On the resistance side, the first resistance at 34400.00 is characterized as a level of pullback resistance, representing a significant barrier to the price’s upward movement within the current bullish scenario.
Moreover, the second resistance at 34725.67 is identified as a level of swing high resistance, suggesting it as an additional significant obstacle to the price’s upward movement within the prevailing bullish trend.
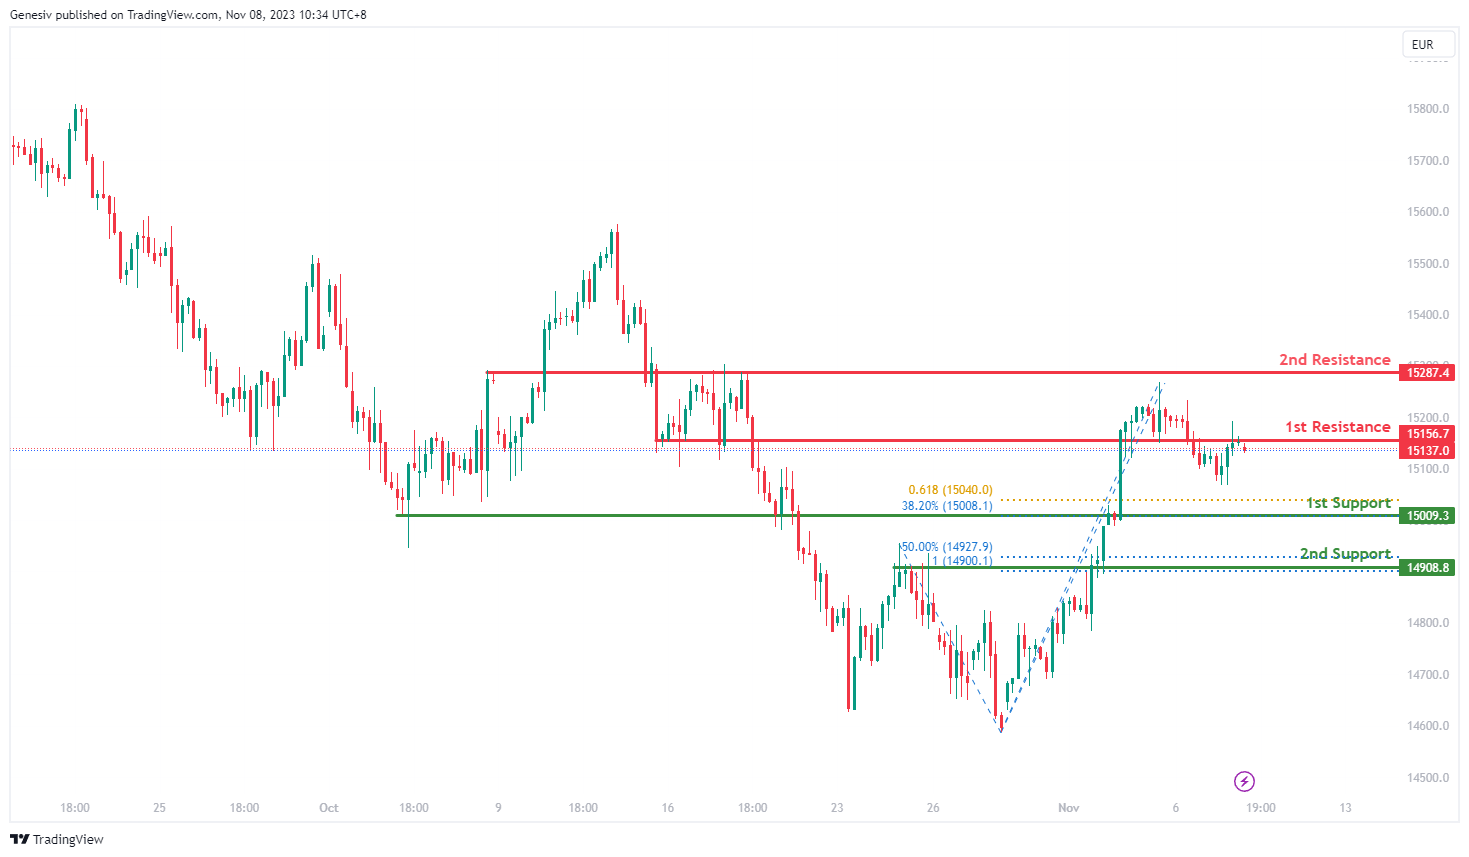
GER40:
For GER40, given the bearish momentum on the chart, there’s a potential scenario where the price might have a bearish reaction off the first resistance and decline towards the first support.
The first support at 15009.30 is identified as a level of pullback support, aligning with both the 38.20% Fibonacci Retracement and the 61.80% Fibonacci Projection, indicating a confluence of Fibonacci levels. This signifies a crucial area where the price might find substantial support during a potential decline within the bearish trend.
The second support at 14908.80 is also recognized as pullback support and coincides with the 50% Fibonacci Retracement and the 100% Fibonacci Projection, further indicating an area where the price might find strong support in case of a bearish move.
On the resistance side, the first resistance at 15156.70 is characterized as an overlap resistance, suggesting it as a significant barrier to the price’s upward movement within the current bearish scenario.
Additionally, the second resistance at 15287.40 is also identified as an overlap resistance, indicating it as an additional significant obstacle to the price’s upward movement in the prevailing bearish trend.
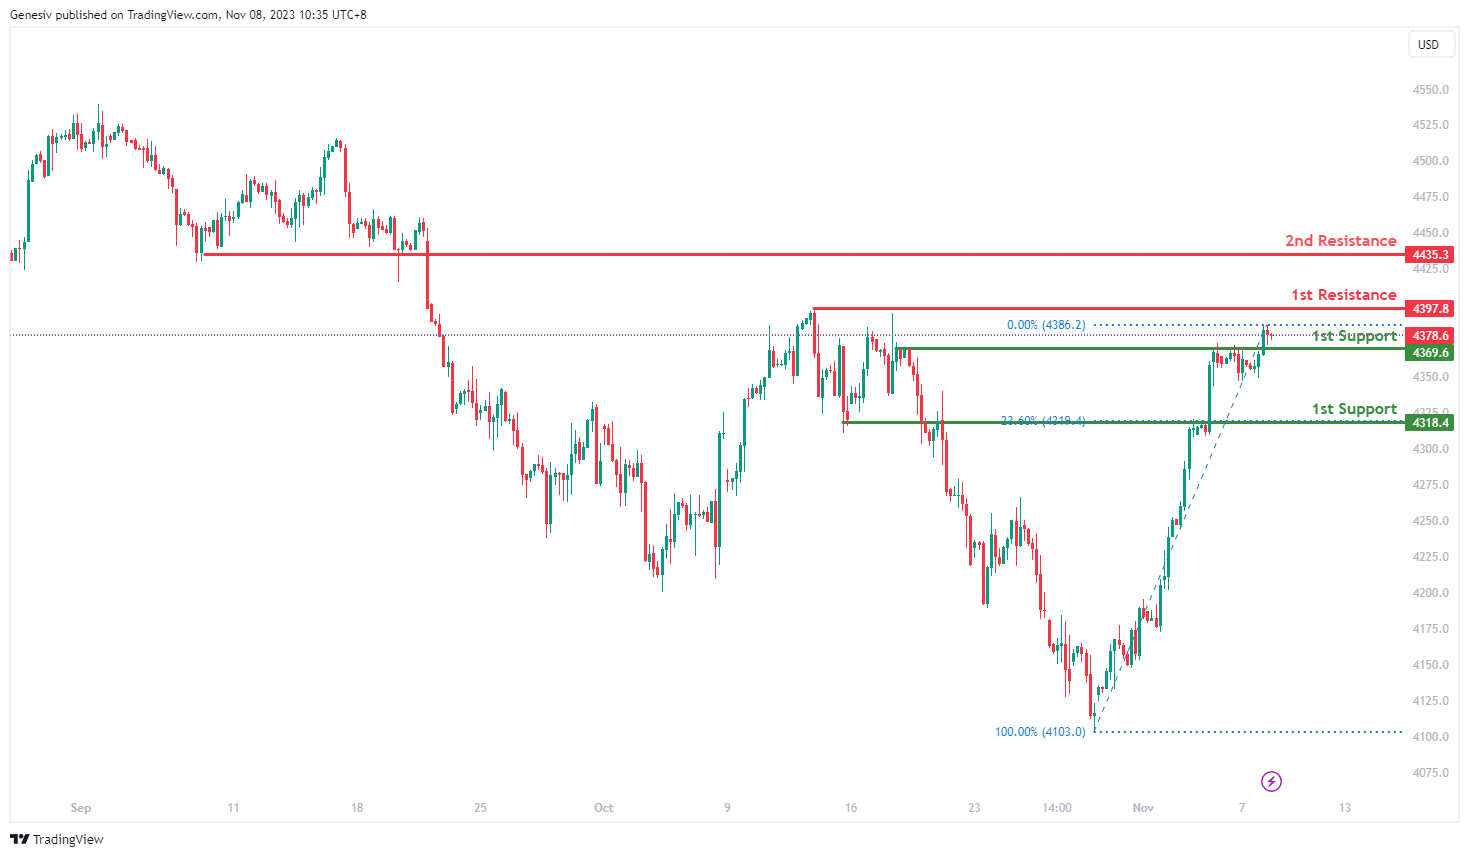
US500
For US500, with the current bullish momentum in the chart, there’s a potential scenario where the price might experience a bullish bounce off the first support and move towards the first resistance.
The first support at 4369.6 is identified as a level of pullback support, suggesting it as a significant area where the price might find substantial support during a potential retracement in the bullish trend.
The second support at 4318.4 is recognized as another pullback support and aligns with the 23.60% Fibonacci Retracement, marking an additional area that might offer crucial support in case of a price decline within the bullish trend.
On the resistance side, the first resistance at 4397.8 is characterized as a level of swing high resistance, indicating a significant barrier to the price’s upward movement within the current bullish scenario.
Additionally, the second resistance at 4435.3 is identified as pullback resistance, suggesting it as an additional significant obstacle to the price’s upward movement within the prevailing bullish trend.
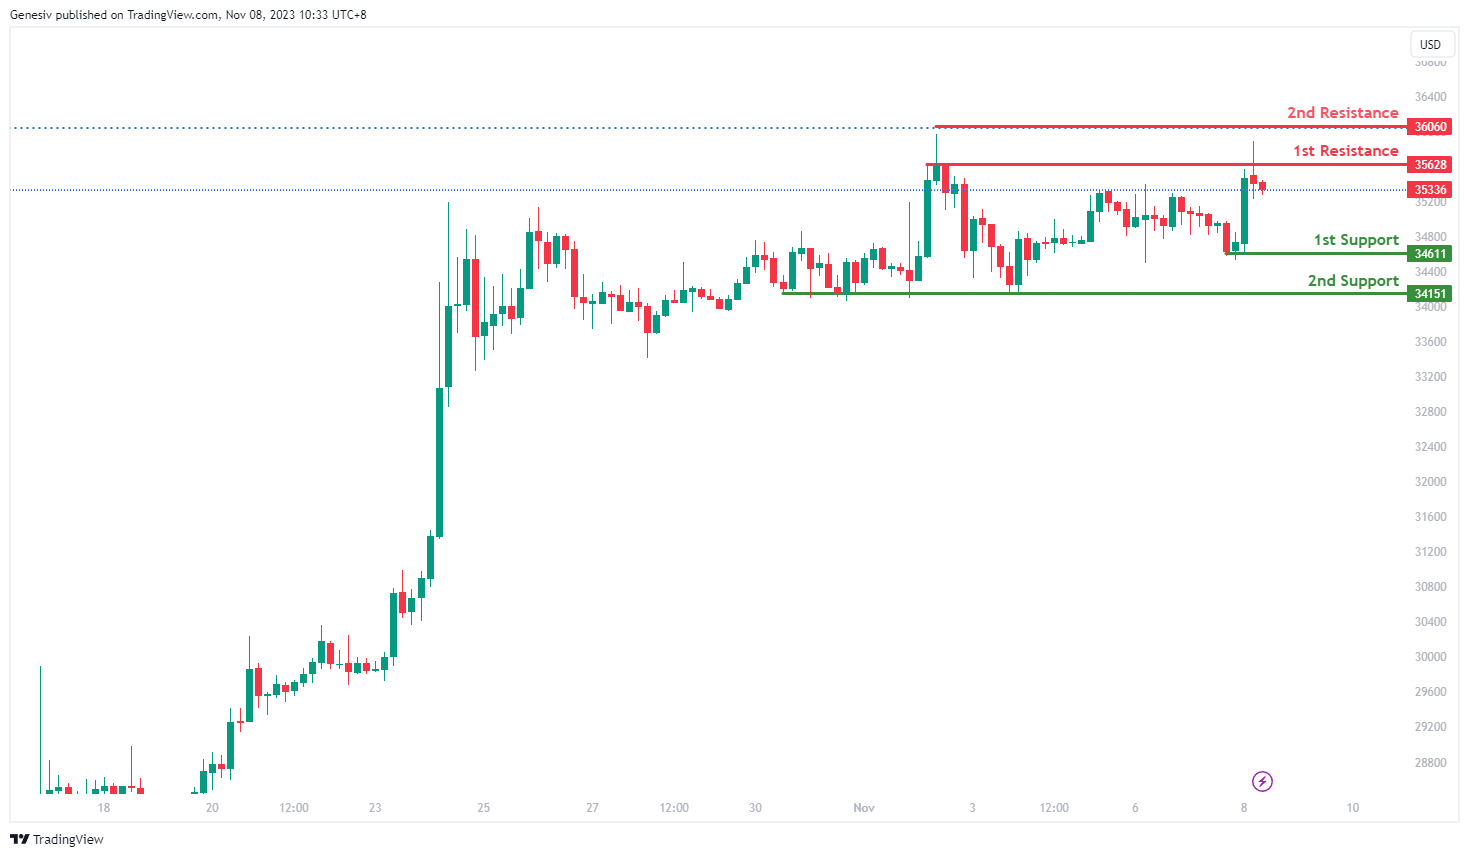
BTC/USD:
For BTC/USD, with the current neutral momentum in the chart, there’s a potential scenario where the price might fluctuate between the first resistance and the first support levels.
The first support at 34611 is identified as a level of swing low support, suggesting it as a significant area where the price might find support during a potential decline or retracement.
The second support at 34151 is recognized as multi-swing low support, providing an additional level that might offer substantial support in case of a price decline within the neutral trend.
On the resistance side, the first resistance at 35628 is characterized as multi-swing high resistance, representing a significant barrier to the price’s upward movement in the current neutral scenario.
Additionally, the second resistance at 36060 is identified as a level of swing high resistance and coincides with the 161.80% Fibonacci Extension, indicating it as an additional substantial barrier to the price’s upward movement within the prevailing neutral trend.
ETH/USD:
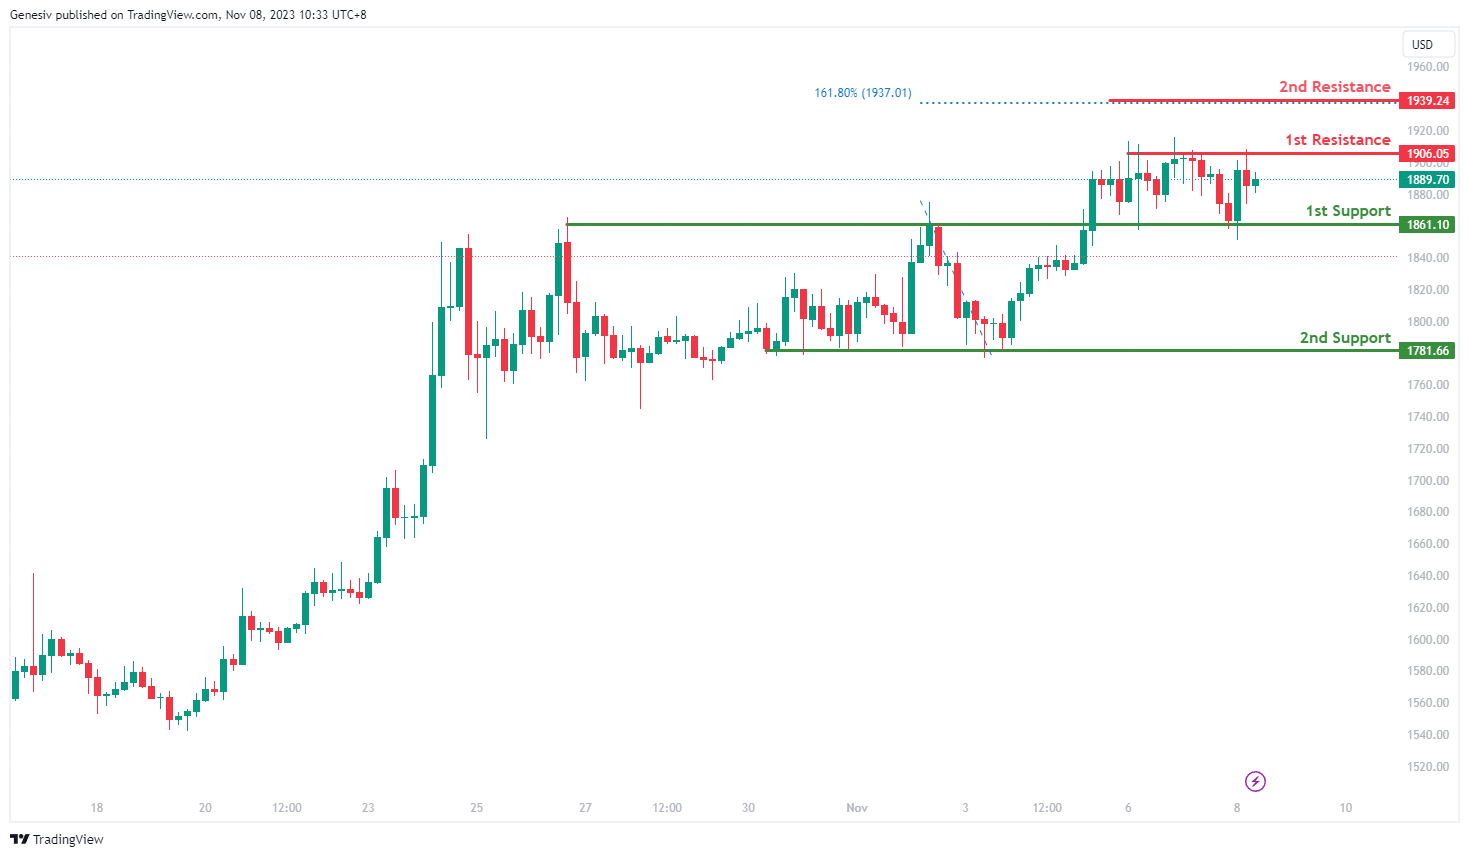
For ETH/USD, the current momentum of the chart indicates a neutral trend, suggesting a potential scenario where the price could fluctuate between the first resistance and the first support levels.
The first support at 1861.10 is identified as an overlap support, indicating a significant level where the price might find support during any potential decline or retracement in the neutral trend.
The second support at 1781.66 is recognized as multi-swing low support, providing an additional level that might offer substantial support in case of a price decline within the neutral trend.
On the resistance side, the first resistance at 1906.05 is characterized as multi-swing high resistance, representing a significant barrier to the price’s upward movement in the current neutral scenario.
Moreover, the second resistance at 1939.24 is identified as a level coinciding with the 161.80% Fibonacci Extension, suggesting it as an additional substantial barrier to the price’s upward movement within the prevailing neutral trend.
WTI/USD:
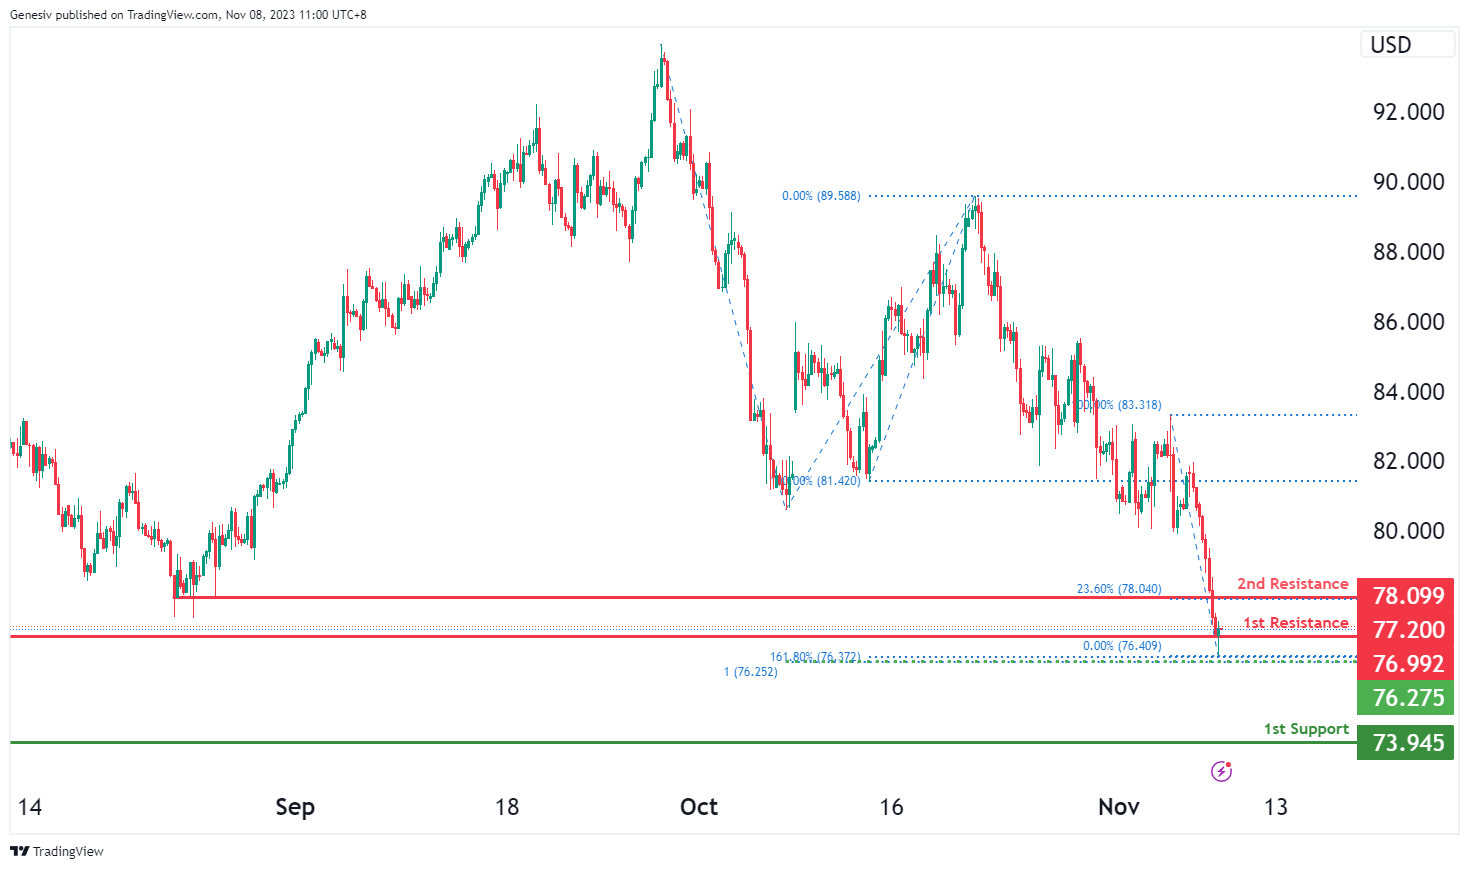
The WTI (West Texas Intermediate) chart currently demonstrates an overall bearish momentum. There is potential for price to break below the intermediate support and drop to the 1st support.
The intermediate support level at 76.28 is identified as a support level that aligns with a confluence of Fibonacci levels i.e. the 100.00% projection and the 161.80% extension levels. Further below, the 1st support level at 73.95 is marked as a swing-low support, potentially acting as a strong support zone.
On the resistance side, the 1st resistance level at 76.99 is identified as an overlap resistance. Higher up, the 2nd resistance level at 78.09 is noted a pullback resistance, indicating another potential area where price could face resistance.
XAU/USD (GOLD):
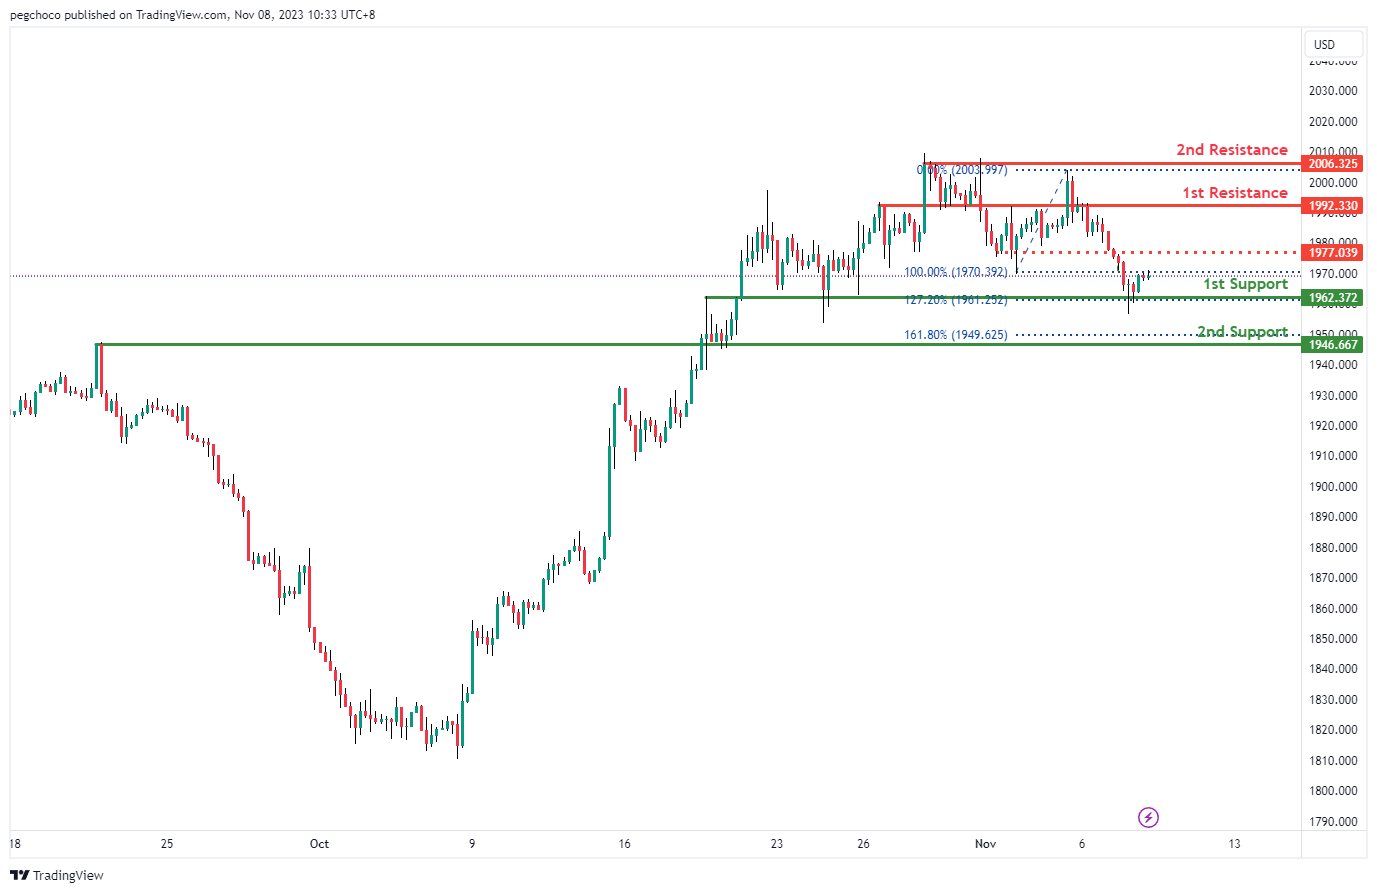
The XAU/USD chart currently exhibits a bullish overall momentum, suggesting the potential for a bullish continuation towards the 1st resistance level.
The 1st support at 1962.37 is identified as an overlap support and coincides with the 127.20% Fibonacci Extension level, making it a significant level where the price might find buying interest.
Furthermore, the 2nd support at 1946.66 is considered a pullback support, and it aligns with the 161.80% Fibonacci Extension level, reinforcing its potential as a support level.
On the resistance side, the 1st resistance at 1992.33 is categorized as an overlap resistance, indicating a level where the price may encounter selling pressure.
Additionally, the 2nd resistance at 2006.32 is identified as a multi-swing high resistance, suggesting another potential level where the price may face obstacles in its upward movement.
Intermediate resistance at 1977.03 is noted as a pullback resistance, indicating another area where the price might find resistance on its way towards the 1st resistance.
XRP Price Rally Seems Far From Over, Oil Price Takes Hit
Key Highlights
- XRP price rallied over 15% and tested the $0.7320 zone.
- A major bullish trend line is forming with support near $0.6300 on the 4-hour chart.
- Bitcoin price is consolidating below the $36,000 resistance.
- Crude oil prices are moving lower below the $80.00 support.
XRP Price Technical Analysis
XRP price started a major rally from the $0.4750 zone. The bulls pumped the price above the $0.500 and $0.600 resistance levels.
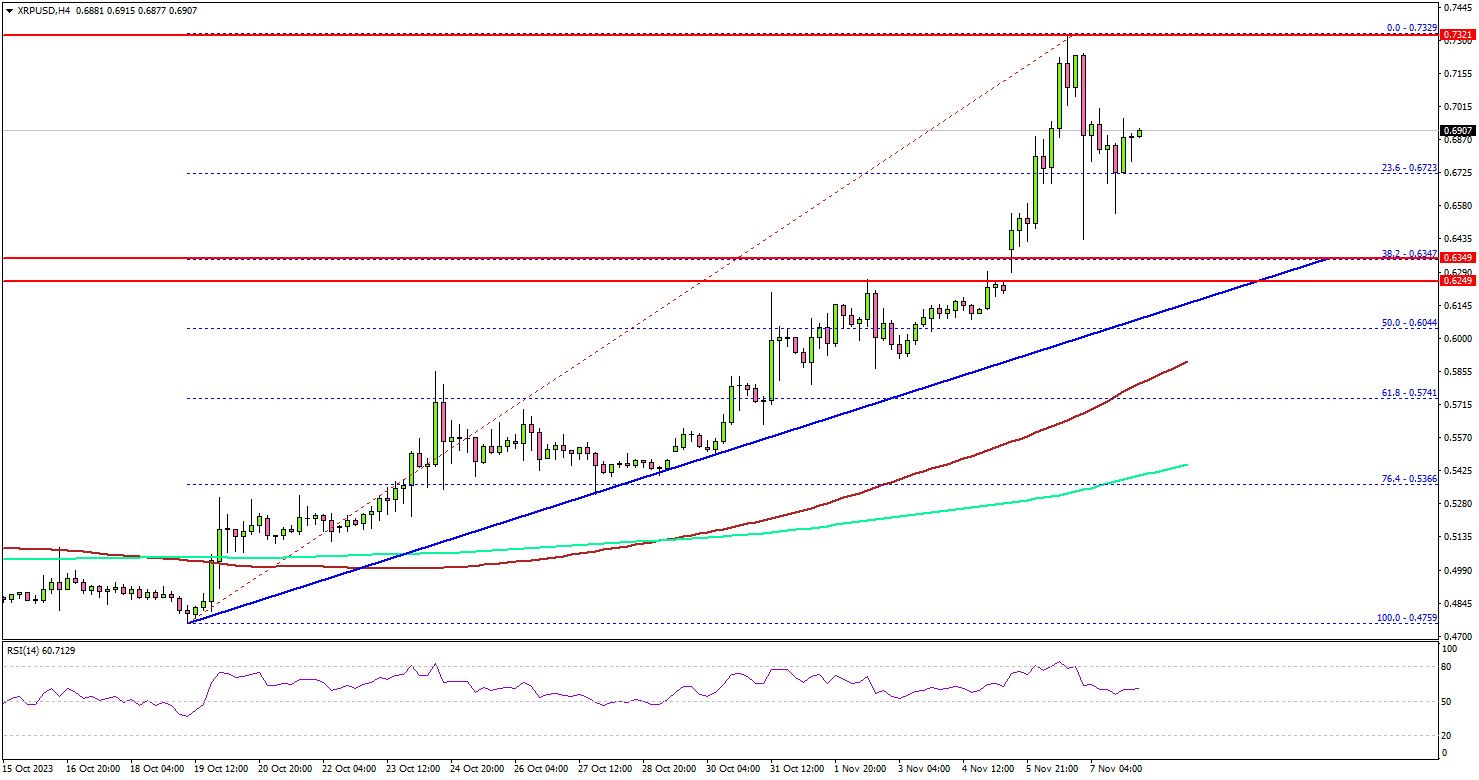
Looking at the 4-hour chart, the price surged over 15% in three days and climbed above the $0.700 level. A new multi-week high is formed near $0.7329 on TitanFX and the price is now correcting gains. There was a move below the $0.6850 level.
The price spiked below the 23.6% Fib retracement level main increase from the $0.4759 swing low to the $0.7329 high. However, the price is still trading well above the $0.6200 support, the 100 simple moving average (red, 4 hours), and the 200 simple moving average (green, 4 hours).
There is also a major bullish trend line forming with support near $0.6300 on the same chart. Any more losses below the trend line might call for a drop toward $0.5750.
On the upside, XRP price might face resistance near the $0.7050 level. The next major resistance is near $0.7150. A successful close above the $0.7150 level might spark a decent increase.
In the stated case, the price may perhaps rise toward the $0.7320 level. The next stop for the bulls may perhaps be near the $0.7500 level. Any more gains might send XRP toward $0.7850.
Economic Releases
- Fed's Chair Powell speech.
Fed’s Bowman expects to raise interest rates further
In a speech overnight, Fed Governor Michelle Bowman asserted, "I continue to expect that we will need to increase the federal funds rate further to bring inflation down to our 2% target in a timely way."
She acknowledged that interest rates "appears to be restrictive" while financial conditions "have tightened since September". However, "We don't yet know the effects of tightened financial conditions on economic activity and inflation, she cautioned.
"There is an unusually high level of uncertainty regarding the economy and my own economic outlook, especially considering recent surprises in the data, data revisions, and ongoing geopolitical risks," she noted.