Sample Category Title
Stock Markets Ease Further, RBA Hikes After Four-Meeting Hold
Stocks are trading a little lower in Europe on Tuesday and the US is shaping up for a similar open in an hour or so.
Lower bond yields enabled stocks to bounce back strongly in the second half of last week, aided by some less hawkish Fed commentary after the meeting and a softer jobs report. But with yields now stabilizing again, equities are also running low on energy and may require another boost from the data or central bank.
But Fed officials remain extremely cautious, fearing stopping too soon and suffering another onslaught of criticism for underestimating the inflationary pressures. And we're seeing that again, with Kaskari claiming it's too soon to declare victory and that doing too much is preferable to too little.
A raft of policymakers will be making appearances today and it will be interesting to see whether they take a similar approach in light of bond yields now cooling again. Policymakers can't afford to bounce between messaging depending purely on how bond yields are performing, especially when they are largely responsible for the moves, but they are clearly paying close attention to them.
RBA hikes after four-meeting hold
As they will what other central banks are doing, including the RBA which today ended a series of four rate pauses and hiked by another 25 basis points. While its decision-making is independent of the Fed's, the challenges it faces are similar, and the fact that it's needed to hike again after such a long time will only strengthen the Fed's position that it needs to maintain the higher for longer mantra, and potential for more, until the last minute.
The RBA may now refrain from warning about further hikes going forward but it will certainly leave the door ajar as it can no longer be confident that inflation won't stubbornly remain above target. As we've heard so much, the RBA is data-dependent, and future moves will be guided by it.
Oil slips further amid a weaker economic outlook
Oil prices declined again on Tuesday, with Brent now erasing the moves that followed the Hamas attack on Israel. Traders will remain on high alert for signs of a wider conflict emerging in the region that could disrupt supplies but it seems those fears are subsiding.
That we're seeing data that confirms economies are struggling under the pressure of high interest rates which are not expected to decline soon may also have contributed to oil reversing its gains. It's no surprise then that Saudi Arabia and Russia remain committed to their end-of-year cuts, it's just a question of whether they will be extended. That they haven't already perhaps suggests there's some reluctance too, which may also be weighing on prices a little.
Gold struggles after repeated fails to hold above $2,000
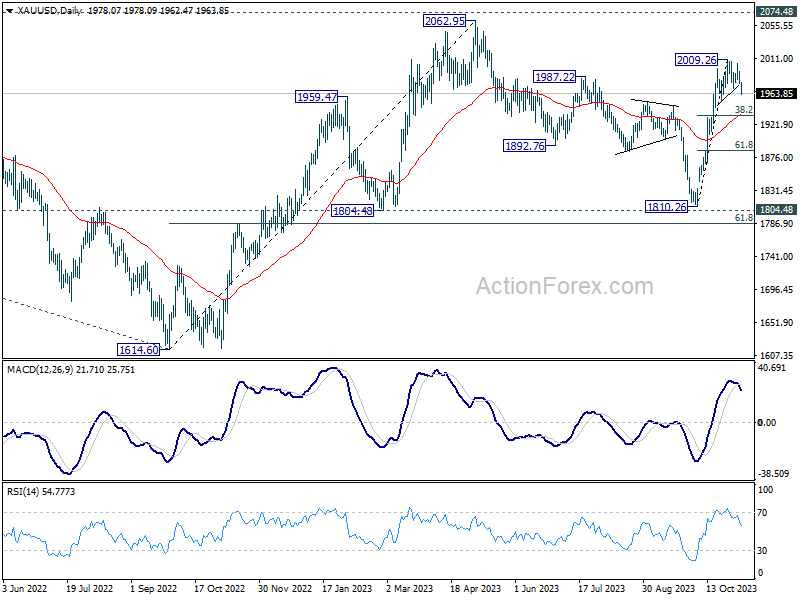
Gold has broken lower today, appearing to enter into a correction phase after failing to significantly break above $2,000 on a number of occasions. Perhaps we're seeing an unwind of some of the geopolitical risk in the markets or just a technical correction in the rally over the last month but the last couple of sessions haven't been great.
It will be interesting to see how gold trades around $1,940 if it reaches that far as this roughly coincides with prior resistance, the 38.2% retracement of the previously mentioned rally, and the 200-day simple moving average.
Dollar Gains as Risk Aversion Spreads, Market Seeks Clarity Amid Global Economic Concerns
As markets across the globe confront a wave of cautious sentiment, Dollar finds itself in a position of strength, capitalizing on a shift in investor mood. European trading sessions have mirrored the apprehensive tone set by Asian markets, although early signs from US pre-markets suggest that the intense selling pressure may be subsiding.
Swiss Franc and Japanese Yen, traditionally seen as safe havens during tumultuous times, rise slightly too . Australian Dollar, however, has been less fortunate, trailing behind with New Zealand Dollar and British Pound. Canadian Dollar is also underperforming, albeit to a lesser extent. Euro stands somewhere in between, struggling to keep pace with its European counterparts.
At the core of the cautious turn in sentiment might be a combination of profit-taking activities, following the previous week's robust stock rally, and fresh concerns sparked by unsatisfactory economic data. Notably, Germany's industrial production has taken a sharper downturn than analysts predicted, shrinking by -1.4% mom. Additionally, persistent softness in China's export figures has contributed to the unease, though a clear driver behind the current mood shift remains elusive.
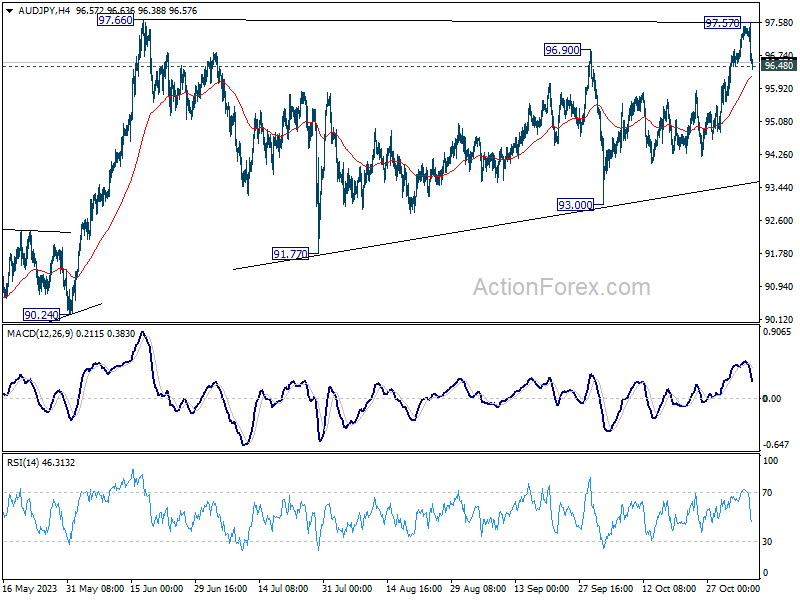
From a technical perspective, AUD/JPY's breach of 97.57 minor suggest is taken as an initial sign of rejection by 97.66 resistance. Sustained break of 55 4H EMA (now at 96.22) will argue that the consolidation pattern from 97.66 is extending with another falling leg. In this case, AUD/JPY would head lower towards lower trendline (now at 93.47).
In Europe, at the time of writing, FTSE is up 0.07%. DAX is down -0.14%. CAC is down -0.51%. Germany 10-year yield is down -0.053 at 2.694. Earlier in Asia, Nikkei dropped -1.34%. Hong Kong HSI dropped -1.65%. China Shanghai SSE dropped -0.04%. Singapore Strait Times dropped -0.21%. Japan 10-year JGB yield rose 0.0029 to 0.877.
Gold completes head and shoulder top, how low will it go?
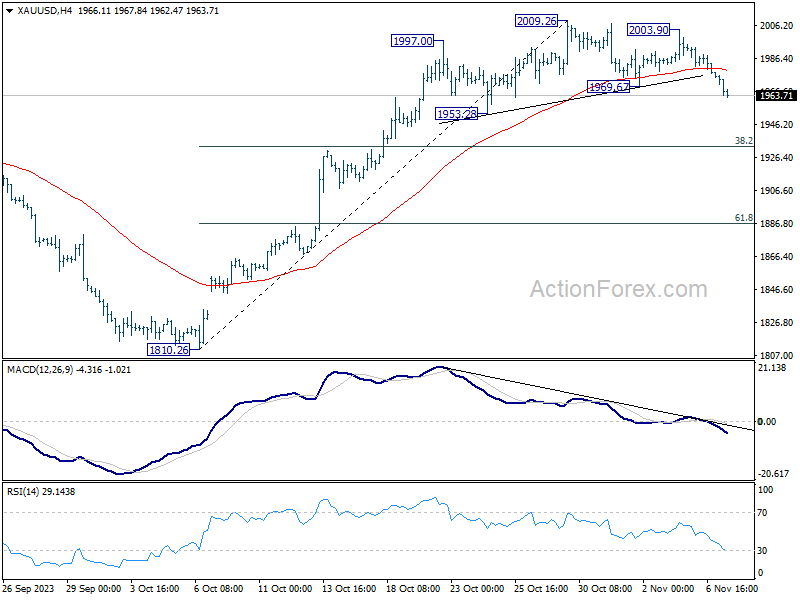
Gold's decline from 2009.26 continued today and the break of 1969.67 support completed a head and shoulder top pattern (ls: 1997.00, h: 2009.26, rs: 2003.90). The development suggests that it's already in correction to the whole rally from 1810.26. Further decline should be seen towards 38.2% retracement of 1810.26 to 2009.26 at 1933.24.
Overall outlook is unchanged that correction from 2062.95 has completed with three waves down to 1810.26. Hence, strong support should be seen from 1933.24, which is close to 55 D EMA (now at 1933.62), to contained downside. Another rally through 2009.26 to retest 2062.95 high should be seen sooner rather than later.
However, sustained break of 1933 support zone, will dampen this above bullish view, and open up deeper fall 61.8% retracement at 1886.27, and possibly below.
Eurozone's PPI at 0.5% mom, -12.4% yoy in Sep
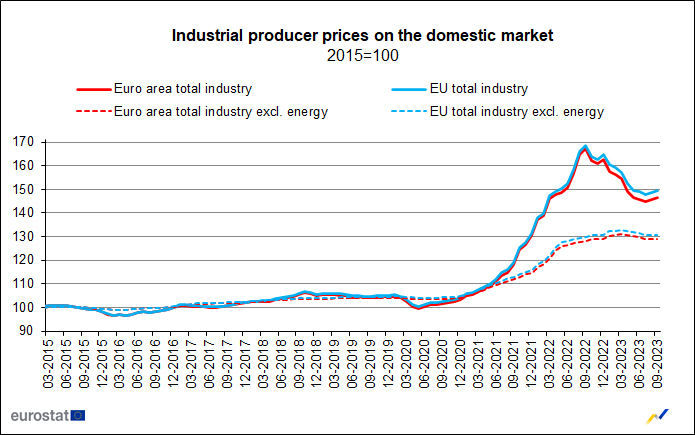
Eurozone PPI came in at 0.5% mom, -12.4% yoy in September, versus expectation of 0.3% mom, -12.5% yoy. For the month, Industrial producer prices increased by 2.2% in the energy sector, while prices remained stable for capital goods and for durable consumer goods, and prices decreased by 0.2% for both intermediate goods and non-durable consumer goods. Prices in total industry excluding energy decreased by 0.1%.
EU PPI came in at -0.6% mom, -11.2% yoy. The biggest monthly increases in industrial producer prices were observed in Luxembourg (+28.5%), Romania (+2.6%) and Bulgaria (+2.1%), while the largest decreases were recorded in Finland (-0.9%), Cyprus and Poland (both -0.3%) and Germany (-0.2%).
RBA hikes to 4.35%, future path hinges on evolving data
RBA announced an increase in cash rate target by 25 bps to 4.35%, aligning with market anticipations. Accompanying this move, RBA signaled a shift to a neutral policy stance, indicating that "whether further tightening of monetary policy is required... will depend upon the data and the evolving assessment of risks ."
In the statement, RBA said inflation is "still too high" and is proving "more persistent than expected a few months ago". A rate hike was was warranted today to be "more assured" that inflation would return to target in a "reasonable timeframe".
The central bank's outlook is tempered by "significant uncertainties," particularly regarding the persistence of services inflation which has been notably resilient internationally and could mirror in the Australian market.
The effectiveness of monetary policy changes and the response of wage settings and pricing decisions amid a slowdown in economic growth are areas of unpredictability, especially given the current tightness of the labor market. Household consumption prospects are also veiled with uncertainty, too. T
Looking abroad, RBA's statement brought to light the ongoing global uncertainties, notably the economic trajectory of China and the far-reaching consequences of international conflicts, adding further dimensions to the central bank's considerations.
China's export decline deepens while imports rebound
China's export figures have taken a sharper downturn than anticipated in October, contracting by -6.4% yoy to USD 274.8B, exceeding market predictions of -3.1% yoy. This downturn marks the sixth consecutive month where China's exports have receded.
In contrast, imports defied expectations with a 3.0% yoy increase, a significant departure from the forecasted -5.4% yoy decline, and putting an end to an 11-month streak of contraction.
The culmination of these trade activities resulted in a considerable narrowing of the trade surplus, which shrunk from USD 77.7B to USD 56.5B. This is a stark contraction compared to the anticipated figure of USD 84.2B.
Japan's labor cash earnings up 1.2% yoy, but real wages down for 18th month
Japan reported a modest increase in nominal labor cash earnings in September, with 1.2% yoy rise that slightly exceeded market expectations of 1.0% yoy gain. This uptick, an improvement from the previous month's 0.8%, may seem like a positive indicator at first glance, with base salary growth also marking an increase to 1.4% yoy from August's 1.2% yoy.
However, not all components of earnings showed strength. Special payments, often a volatile category, continued to decline by -6.0% yoy , albeit a less severe contraction than -6.3% yoy reported in August. Meanwhile, overtime pay exhibited a marginal increase, rising 0.7% yoy, suggesting a modest uptick in extra working hours.
The nuanced picture of Japan's wage situation becomes more concerning when adjusted for inflation. Real wages, which reflect the purchasing power of income, fell sharply by -2.4% yoy compared to the same month last year, marking the 18th consecutive month of decline. This persistent slide in real wages points to the squeeze on household income as inflation outpaces nominal wage growth.
In line with the strain on incomes, household spending dipped by -2.8% yoy , although the figure is marginally better than the anticipated -3.0% yoy fall. This marks the seventh straight month of decline, underscoring the ongoing reticence of Japanese consumers to open their wallets amid economic uncertainties.
On a more positive note, on a seasonally adjusted basis, household spending saw an unexpected increase of 0.3% mom, defying expectations of a -0.4% mom decline.
EUR/USD Mid-Day Outlook
Daily Pivots: (S1) 1.0703; (P) 1.0730; (R1) 1.0743; More...
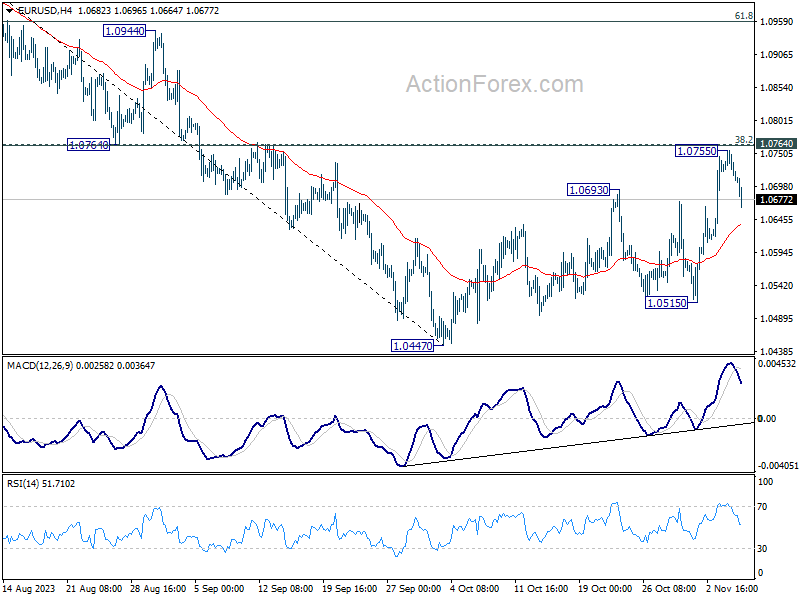
Intraday bias in EUR/USD stays neutral at this point. Further rally is in favor as long as 55 4H EMA (now at 1.0638) holds. Decisive break of 1.0764 cluster resistance (38.2% retracement of 1.1274 to 1.0447 at 1.0763) will extend the rise from 1.0447 to 61.8% retracement at 1.0958 next. However, sustained break of 55 4H EMA will argue that the rebound has completed, and target 1.0515 support, and then 1.0447 low.
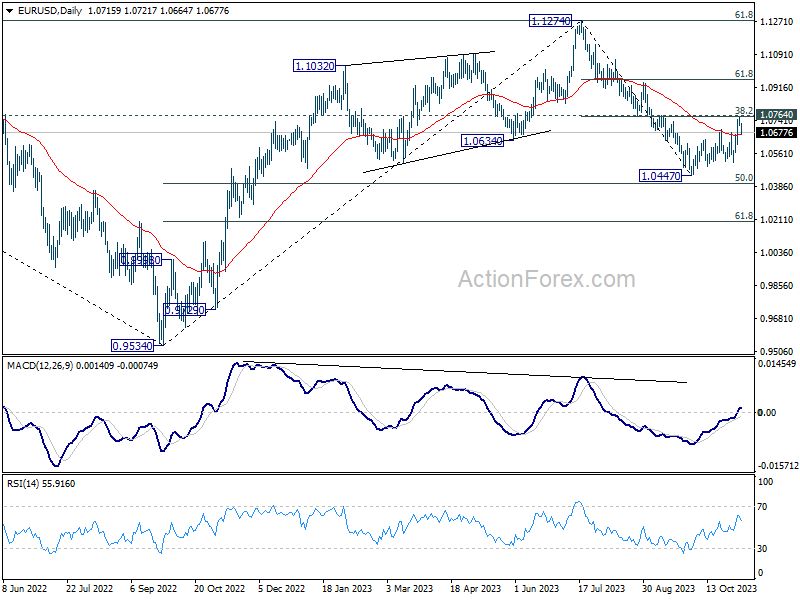
In the bigger picture, price actions from 1.1274 are viewed as a corrective pattern to rise from 0.9534 (2022 low). Rise from 1.0447 is tentatively seen as the second leg. Hence while further rally could be seen, upside should be limited by 1.1274 to bring the third leg of the pattern.
Economic Indicators Update
| GMT | Ccy | Events | Actual | Forecast | Previous | Revised |
|---|---|---|---|---|---|---|
| 23:30 | JPY | Labor Cash Earnings Y/Y Sep | 1.20% | 1.00% | 1.10% | 0.80% |
| 23:30 | JPY | Overall Household Spending Y/Y Sep | -2.80% | -3.00% | -2.50% | |
| 00:01 | GBP | BRC Like-For-Like Retail Sales Y/Y Oct | 2.60% | 2.80% | ||
| 03:00 | CNY | Trade Balance (USD) Oct | 56.5B | 84.2B | 77.7B | |
| 03:30 | AUD | RBA Interest Rate Decision | 4.35% | 4.35% | 4.10% | |
| 06:45 | CHF | Unemployment rate Oct | 2.10% | 2.10% | 2.10% | |
| 07:00 | EUR | Germany Industrial Production M/M Sep | -1.40% | -0.30% | -0.20% | |
| 08:00 | CHF | Foreign Currency Reserves (CHF) Oct | 658B | 678B | ||
| 10:00 | EUR | Eurozone PPI M/M Sep | 0.50% | 0.30% | 0.60% | 0.70% |
| 10:00 | EUR | Eurozone PPI Y/Y Sep | -12.40% | -12.50% | -11.50% | |
| 12:30 | CAD | Trade Balance (CAD) Sep | 2.0B | 1.0B | 0.7B | |
| 13:30 | USD | Trade Balance (USD) Sep | -61.5B | -60.5B | -58.3B | -58.7B |
Gold in Correction
Gold came under pressure this week, losing around 1.4% and retreating to $1966. This drops below previous local lows, forming a short-term downtrend and fitting into a pattern of declines following local overbought conditions.
Gold has been in strong demand since October 7th, following the war in Gaza. However, technical patterns are still at work. We have seen that the entry into the overbought area on the Relative Strength Index on the daily timeframe caused the growth to stall, and more active selling began early last week. As a result, the RSI retreated from the overbought area, which is often a medium-term signal for the end of growth and, at the very least, the beginning of a full-blown correction.
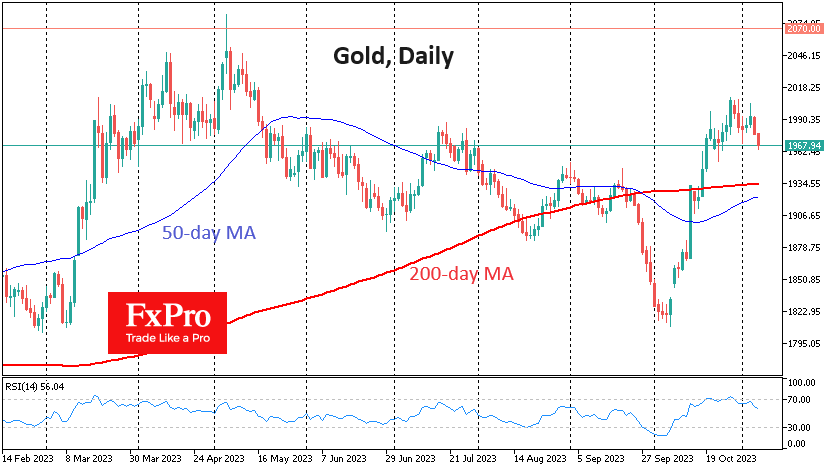
According to the Fibonacci pattern, we should pay more attention to the price dynamics around $1960, which is 76.4% of the amplitude of the October move. With strong buying interest, gold could find support and return to growth. Such shallow corrections are common in strong bull markets.
But we see more potential in a more profound correction with a pullback to $1932. The 61.8% retracement level, a classic Fibonacci pattern marker, is concentrated at this level. In addition, the 200-day moving average passes through here.
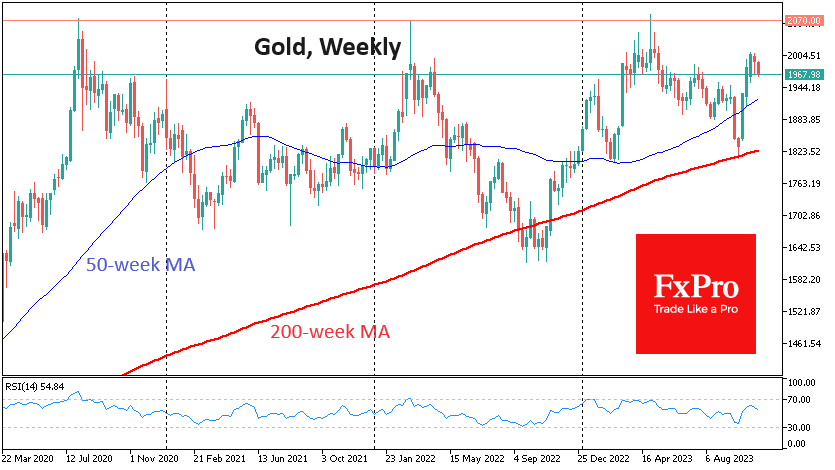
The ability to hold above this level will keep the focus on sustaining the bull market in gold. If the sellers don’t stop here, the broader investment community could join in the selling. As in June 2022 or September 2023, a break below this line could be followed by a sharp decline. In the above cases, the price fell 8.5% and 6%, respectively, after a break below the 200-day average. Repeating this amplitude would wipe out October’s gains or the gains of the last 12 months.
A fall back to near $1800 would take gold below the 200-week average, which it touched so nicely during the reversal in early October. However, it is rare to see such nice touches in gold. For example, a couple of them in 2017 failed to become a starting point for gold’s rally, and only a dip below the 200-week average in late 2018 revived buying interest.
EUR/USD Mid-Day Outlook
Daily Pivots: (S1) 1.0703; (P) 1.0730; (R1) 1.0743; More...
Intraday bias in EUR/USD stays neutral at this point. Further rally is in favor as long as 55 4H EMA (now at 1.0638) holds. Decisive break of 1.0764 cluster resistance (38.2% retracement of 1.1274 to 1.0447 at 1.0763) will extend the rise from 1.0447 to 61.8% retracement at 1.0958 next. However, sustained break of 55 4H EMA will argue that the rebound has completed, and target 1.0515 support, and then 1.0447 low.
In the bigger picture, price actions from 1.1274 are viewed as a corrective pattern to rise from 0.9534 (2022 low). Rise from 1.0447 is tentatively seen as the second leg. Hence while further rally could be seen, upside should be limited by 1.1274 to bring the third leg of the pattern.
GBP/USD Mid-Day Outlook
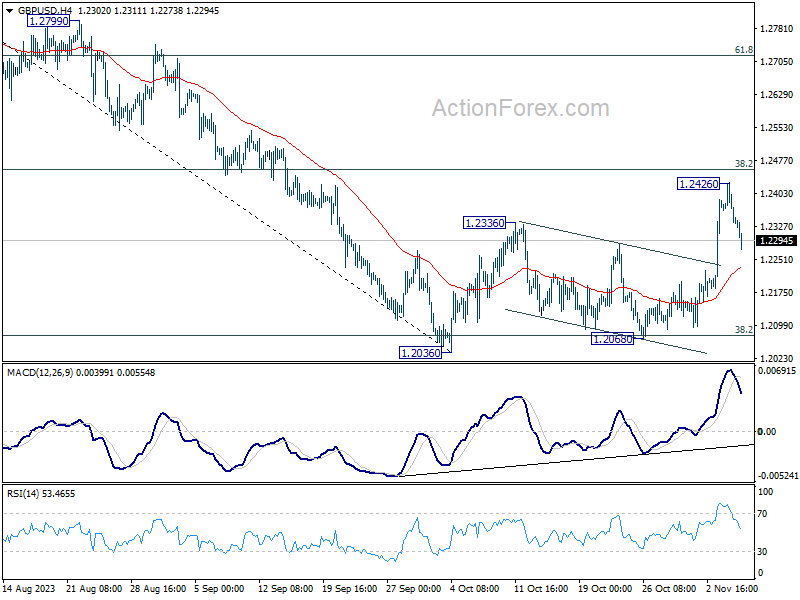
Daily Pivots: (S1) 1.2312; (P) 1.2370; (R1) 1.2402; More
Intraday bias in GBP/USD remains neutral for the moment. Further rise is in favor as as long as 4H 55 EMA (now at 1.2230) holds. Decisive break of 38.2% retracement of 1.3141 to 1.2036 at 1.2458 will pave the way to 61.8% retracement at 1.2783. However, sustained break of 4H 55 EMA will revive near term bearishness and bring retest of 1.2036 low.
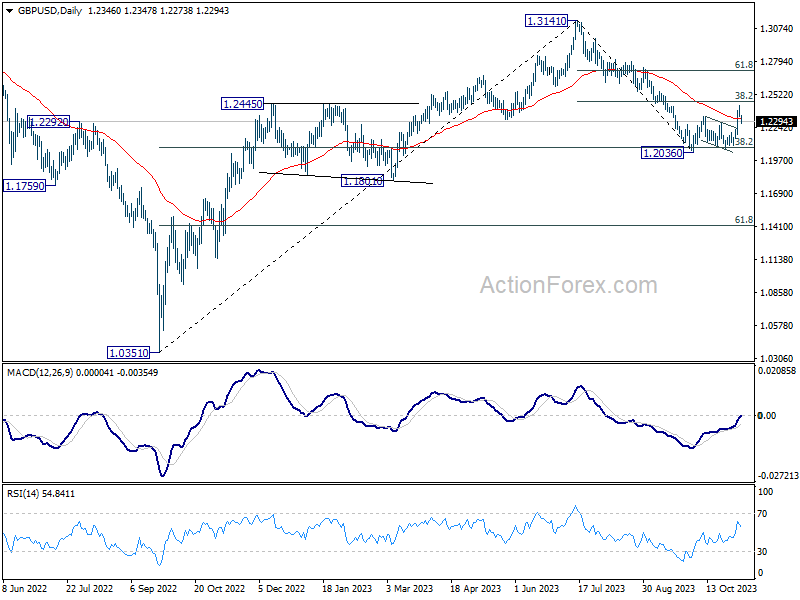
In the bigger picture, the strong rebound from 38.2% retracement of 1.0351 to 1.3141 at 1.2075 argues that price action from 1.3141 are merely a correction to rise from 1.0351 (2022 low). Current rally from 1.2036 is tentatively seen as the second leg of the pattern. Hence, while further rally is in favor, upside should be limited by 1.3141 to start the third leg.
USD/CHF Mid-Day Outlook
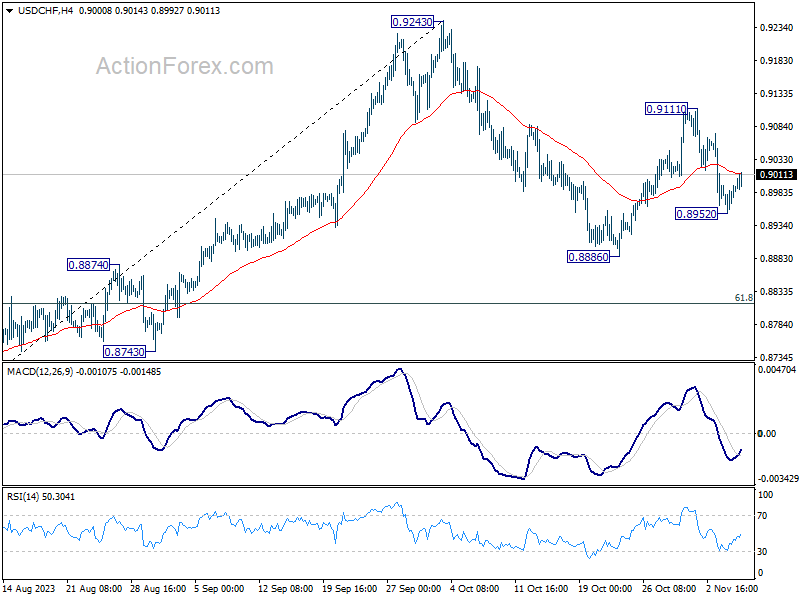
Daily Pivots: (S1) 0.8967; (P) 0.8982; (R1) 0.9010; More....
Intraday bias in USD/CHF stays neutral at this point. On the downside, below 0.8952 will target a test on 0.8886 support first. Break there will resume whole decline from 0.9243 to 0.8815 fibonacci level. However, break of 0.9111 will resume the rebound from 0.8886 instead, and target 0.9243 resistance.
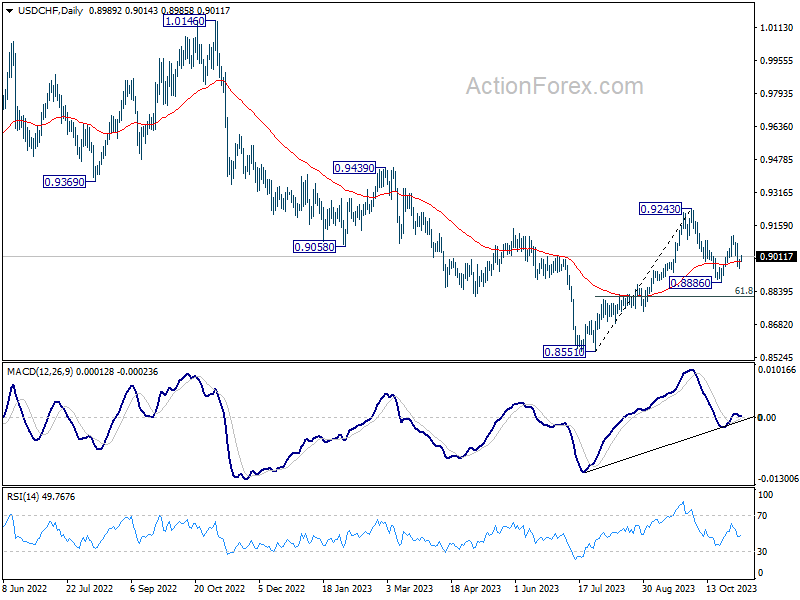
In the bigger picture, outlook is mixed up by the deeper than expected pull back from 0.9243. Yet there was no follow through selling after hitting 0.8886. On the upside, break of 0.9243 resistance will revive the case of medium term bottoming at 0.8851, and turn outlook bullish. However, sustained break of 61.8% retracement of 0.8551 to 0.9243 at 0.8815 will argue that larger decline from 1.0146 is ready to resume through 0.8551 low.
USD/JPY Mid-Day Outlook
Daily Pivots: (S1) 149.59; (P) 149.83; (R1) 150.33; More...
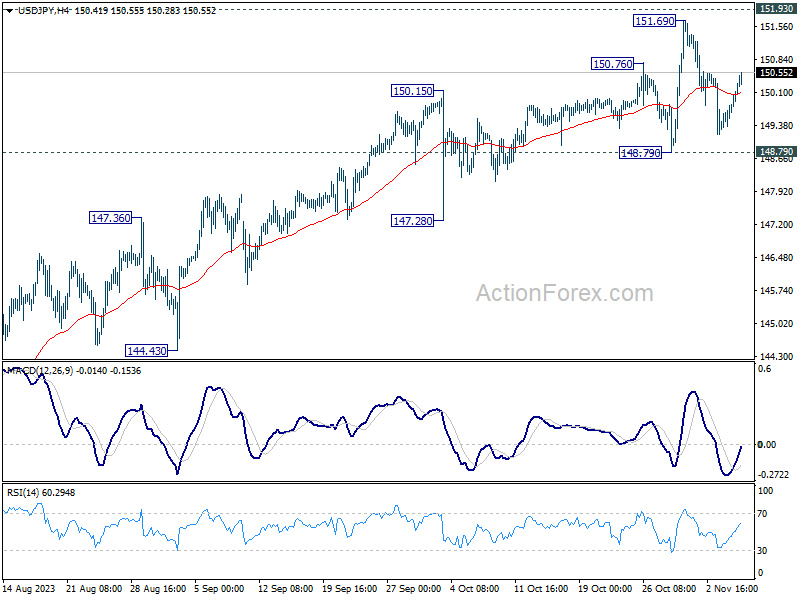
USD/JPY recovers further today but stays inside range of 148.79/151.69. Intraday bias remains neutral for the moment. Further rally is expected as long as 148.79 support holds. Firm break of 151.69 high will resume larger up trend. However, decisive break of 148.79 will indicate rejection by 151.93 key resistance, and bring deeper fall through 147.28 support.
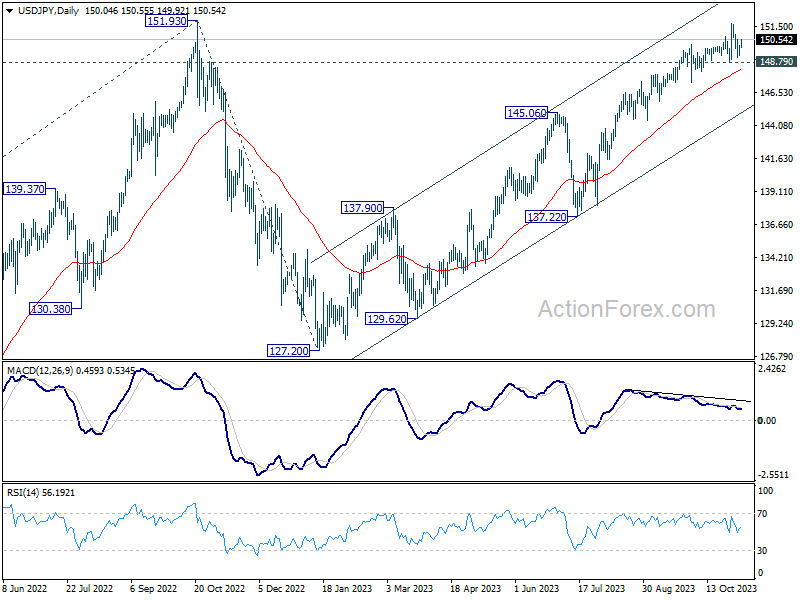
In the bigger picture, immediate focus is on 151.93 resistance (2022 high). Rejection by 151.93, followed by sustained break of 145.06 resistance turned support will argue that rise from 127.20 has completed, and turn outlook bearish for 137.22 support and below. However, sustained break of 151.93 will confirm resumption of long term up trend. Next target will be 61.8% projection of 102.58 to 151.93 from 127.20 at 157.69.
Australian Dollar Plunges after RBA Hike
- RBA raises rates but eases tightening bias
- Australian dollar slides over 1%
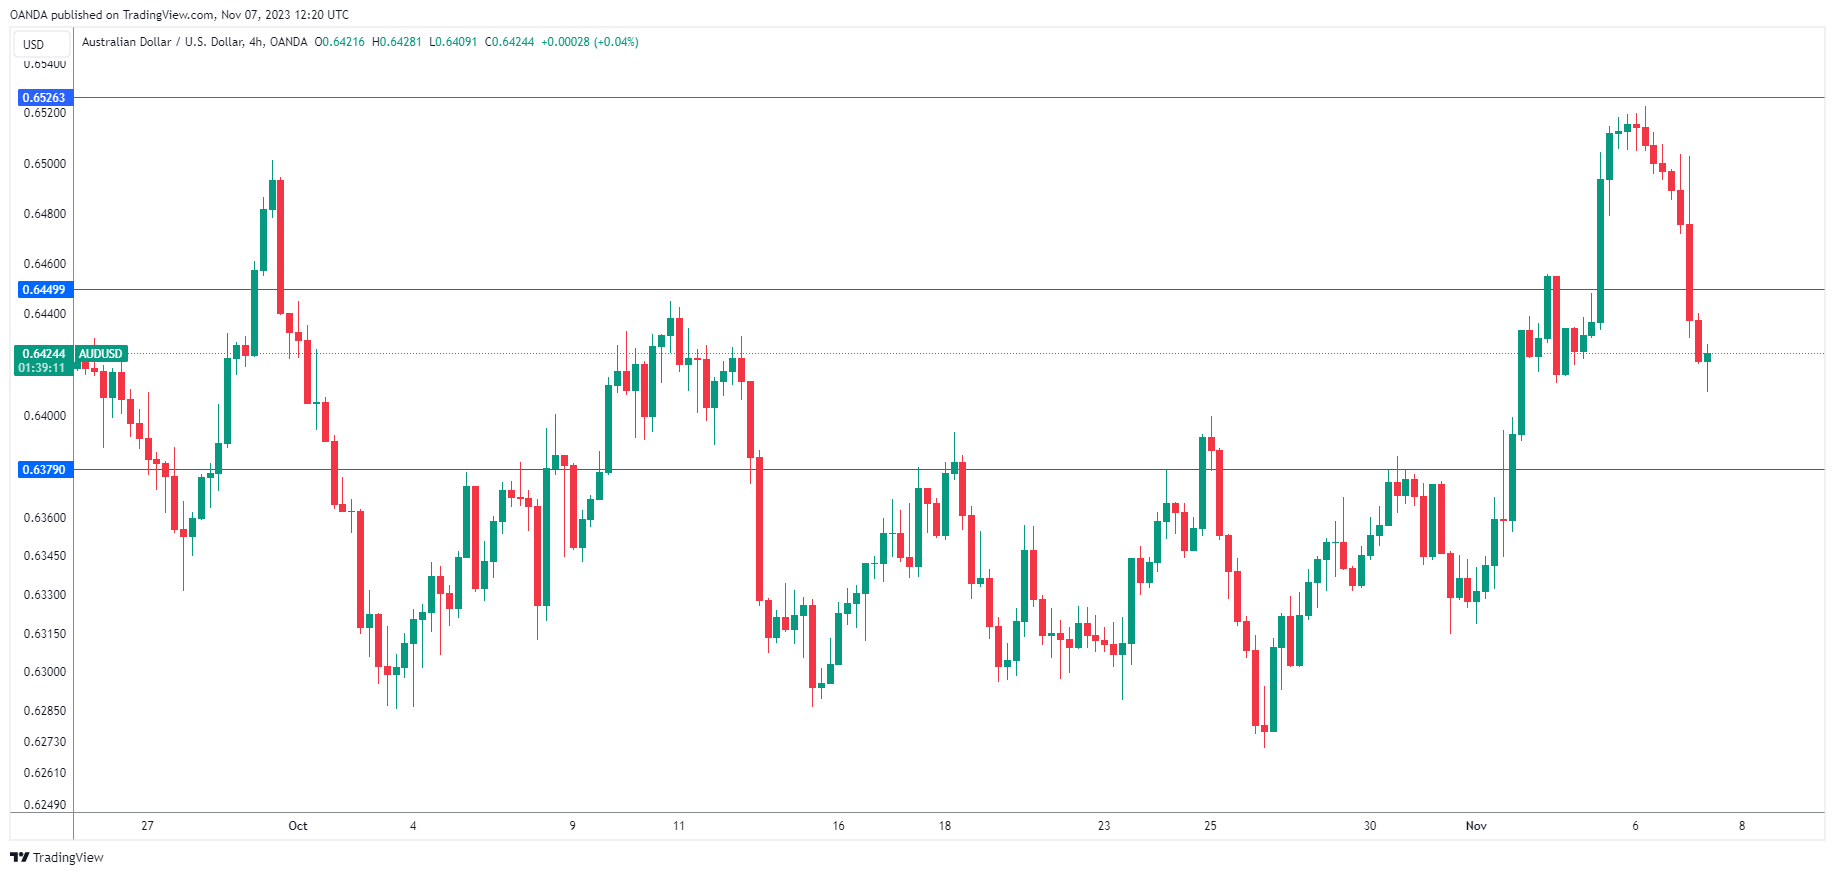
The Australian dollar has recorded massive losses on Monday. In the European session, AUD/USD is trading at 0.6422, down 1.05%. The Aussie continues to show strong volatility after climbing 2.8% last week.
RBA hikes but markets not impressed
The RBA was expected to raise rates today, after holding rates for four straight times. Governor Michelle Bullock duly followed with a quarter-point rate increase, bringing the cash rate to 4.35%. Whenever central banks raise rates, the local currency often rises, but the opposite happened today as the Aussie took a huge drop. At first glance that may seem puzzling, but a close look at the RBA statement can help explain the market reaction.
The RBA statement noted that the rate increase was meant to ensure that “inflation would return to target in a reasonable timeframe.” This points to an easing of the RBA’s tightening basis and raised expectations that the RBA is close to wrapping up its current tightening cycle or may even be done. The statement included the usual rhetoric that future rate decisions would be data-dependent and rate hikes were still on the table, but the cat was out of the bag as the markets viewed today’s move as a ‘dovish hike’ and the Australian dollar took a tumble.
The battle to subdue inflation is by no means over and Governor Bullock acknowledged in the statement that “progress looks to be slower than earlier expected” and that the risk of inflation remaining “higher for longer” has increased. Investors don’t appear as concerned as Bullock about the inflation risk, as indicated by the Aussie’s sharp downturn.
AUD/USD Technical
- There is resistance at 0.6526 and 0.6582
- 0.6449 and 0.6379 are providing support
Gold completes head and shoulder top, how low will it go?
Gold's decline from 2009.26 continued today and the break of 1969.67 support completed a head and shoulder top pattern (ls: 1997.00, h: 2009.26, rs: 2003.90). The development suggests that it's already in correction to the whole rally from 1810.26. Further decline should be seen towards 38.2% retracement of 1810.26 to 2009.26 at 1933.24.
Overall outlook is unchanged that correction from 2062.95 has completed with three waves down to 1810.26. Hence, strong support should be seen from 1933.24, which is close to 55 D EMA (now at 1933.62), to contained downside. Another rally through 2009.26 to retest 2062.95 high should be seen sooner rather than later.
However, sustained break of 1933 support zone, will dampen this above bullish view, and open up deeper fall 61.8% retracement at 1886.27, and possibly below.
Eurozone’s PPI at 0.5% mom, -12.4% yoy in Sep
Eurozone PPI came in at 0.5% mom, -12.4% yoy in September, versus expectation of 0.3% mom, -12.5% yoy. For the month, Industrial producer prices increased by 2.2% in the energy sector, while prices remained stable for capital goods and for durable consumer goods, and prices decreased by 0.2% for both intermediate goods and non-durable consumer goods. Prices in total industry excluding energy decreased by 0.1%.
EU PPI came in at -0.6% mom, -11.2% yoy. The biggest monthly increases in industrial producer prices were observed in Luxembourg (+28.5%), Romania (+2.6%) and Bulgaria (+2.1%), while the largest decreases were recorded in Finland (-0.9%), Cyprus and Poland (both -0.3%) and Germany (-0.2%).