

Sample Category Title
EUR/USD Daily Outlook
Daily Pivots: (S1) 1.0681; (P) 1.0713; (R1) 1.0731; More...
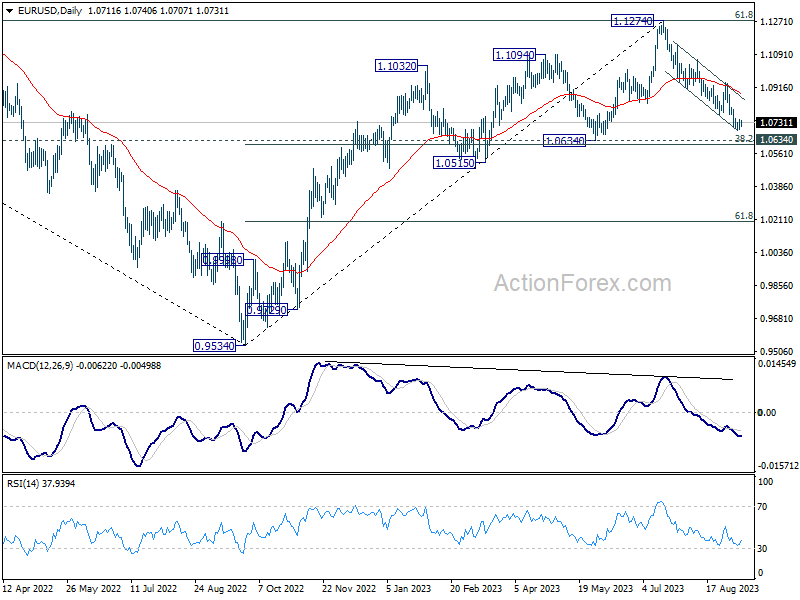
Intraday bias in EUR/USD remains neutral as consolidations continue above 1.0685 temporary low. Outlook will stay bearish as long as 1.0944 resistance holds. On the downside, below 1.0685 will resume the fall from 1.1274 to 1.0609/34 cluster support zone next.
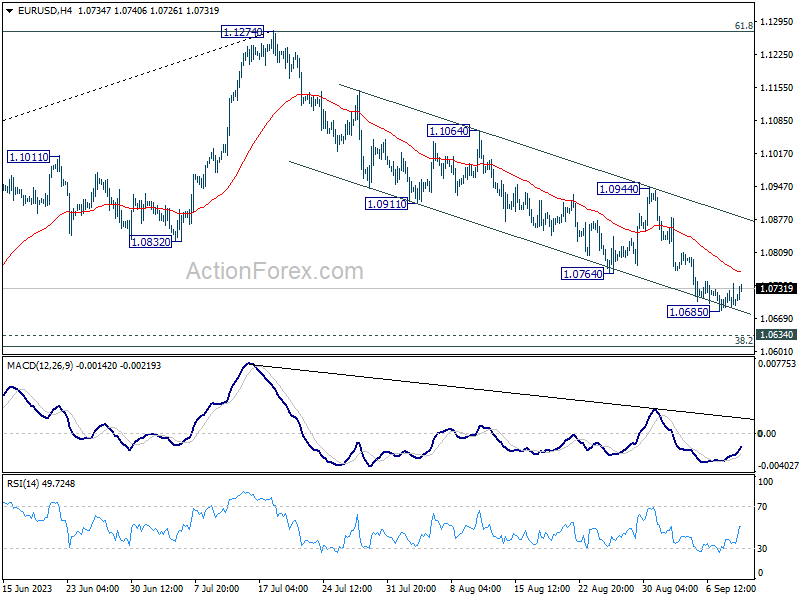
In the bigger picture, fall from 1.1274 medium term top is seen as a correction to up trend from 0.9534 (2022 low). Strong support could be seen from 1.0634 cluster support (38.2% retracement of 0.9534 to 1.1274 at 1.0609) to bring rebound, at least on first attempt. Break of 1.0944 will indicate the start of the second leg, and target retest of 1.1274. However, sustained break of 1.0609/0634 will raise the chance of bearish trend reversal, and target 61.8% retracement at 1.0199.
GBP/USD Daily Outlook
Daily Pivots: (S1) 1.2441; (P) 1.2478; (R1) 1.2504; More...
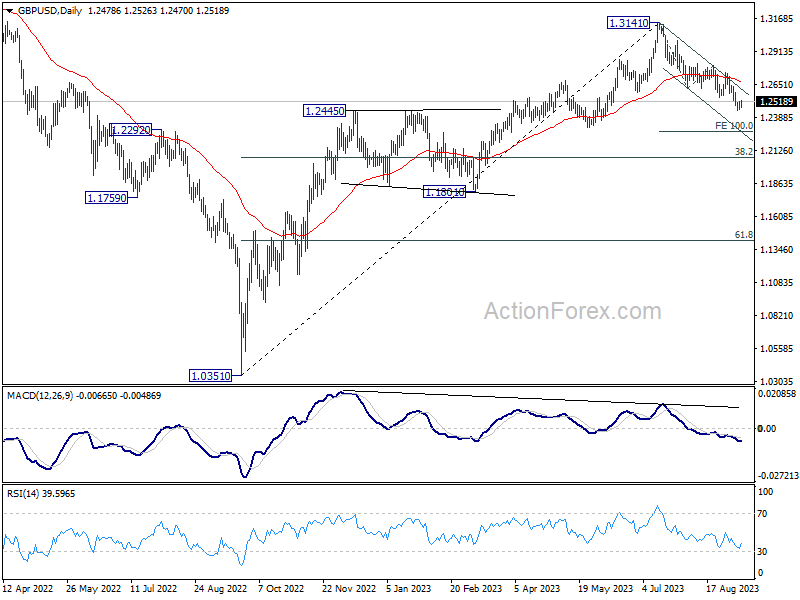
Intraday bias in GBP/USD remains neutral for consolidation above 1.2443 temporary low. Upside of recovery should be limited by 1.2618 support turned resistance to bring another fall. Break of 1.2443 will resume the decline from 1.3141 and target 100% projection of 1.3141 to 1.2618 from 1.2799 at 1.2276.
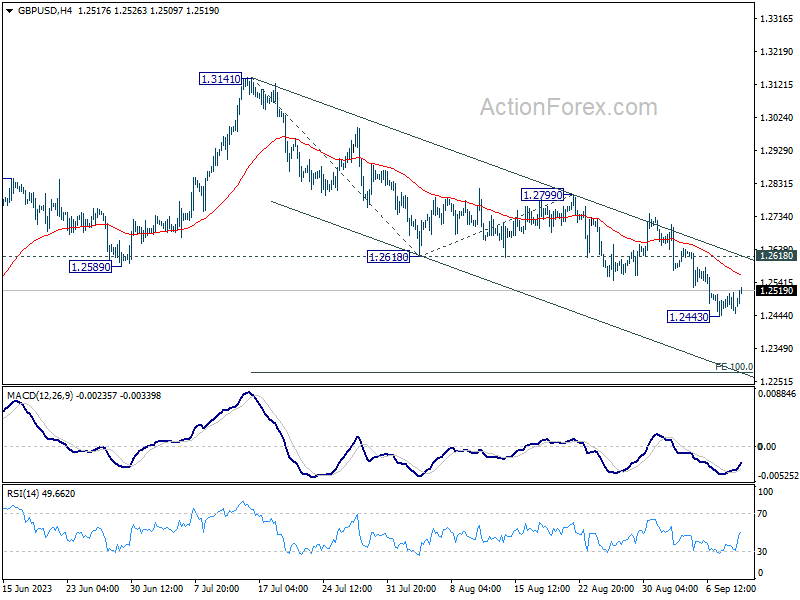
In the bigger picture, fall from 1.3141 medium term top is seen as a correction to up trend from 1.0351 (2022 low). Deeper decline would be seen to 38.2% retracement of 1.0351 to 1.3141 at 1.2075. Strong support would be seen there to bring rebound on first attempt. But outlook will be neutral at best as long as 1.3141 resistance holds, and consolidation from there is set to extend, until further development.
USD/CHF Daily Outlook
Daily Pivots: (S1) 0.8904; (P) 0.8921; (R1) 0.8946; More....
Intraday bias in USD/CHF remains neutral as consolidation from 0.8943 temporary top is extending. While deeper pull back cannot be ruled out, downside should be contained above 0.8743 support to bring another rally. Break of 0.8943 will extend the rise from 0.8551 to 0.9146 cluster resistance.
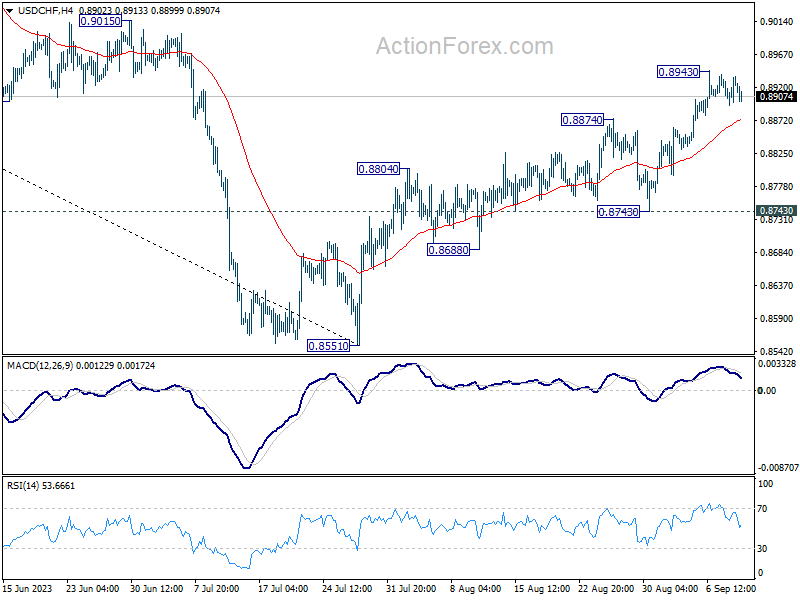
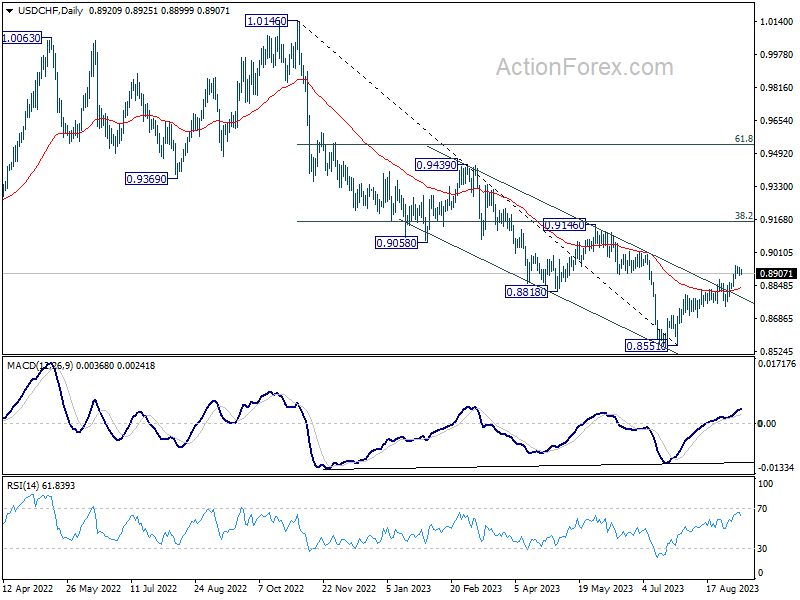
In the bigger picture, rebound from 0.8551 medium term bottom is currently seen as a correction to the downtrend from 1.0146 (2022 high). Further rally would be seen to 0.9146 cluster resistance (38.2% retracement of 1.0146 to 0.8551 at 0.9160). Strong resistance could be seen there to limit upside, at least on first attempt.
A Busy Week Ahead
The S&P 500 ended last week on a meagre positive note, as the selloff in Apple shares slowed. Apple will be unveiling the new iPhone15 after the Chinese storm. Last week’s selloff was certainly exaggerated. Once the Chinese dust settles, Apple’s performance will continue to depend on the overall sentiment regarding the tech stocks, which will in return, depend on the Federal Reserve (Fed) expectations, the rates, energy prices, Chinese property crisis, deflation risks, and how that mix affects the global price dynamics.
China announced this morning that consumer prices rose by 0.1% y-o-y in August, slower than 0.2% penciled in by analysts and after recording its first drop in over two years of 0.3% a month earlier. Core inflation, excluding food and energy prices, rose 0.8% y-o-y, at the same speed as in July, and remained at the fastest pace since January. The numbers remain alarmingly low, and the recent stimulus measures announced by the government did little to boost investors’ appetite. The CSI 300 was thoroughly sold on the rallies following stimulus news. And the yuan continued trending lower against the US dollar.
The US dollar is under a decent selling pressure this morning, particularly against the yen, after comments from the Bank of Japan (BoJ) Governor Ueda were interpreted as being ‘hawkish’. Ueda said that ‘there may be sufficient information by the year-end to judge if wages will continue to rise’, and that will help them decide whether they would end the super-loose monetary policy and step out of the negative rate territory. The remarks were disputably hawkish, to be honest, but given how negatively diverged the Japanese monetary policy is, any hint that the negative rates could end one day boosts hope. The 10-year JGB yield jumped 5bp to 70bp on the news, and the USDJPY fell to 146.30. The USDJPY has a limited upside potential as the Japanese officials have been crystal clear last week that a further selloff would be countered by direct intervention. But the pair has plenty of room to drop significantly, when the BoJ finally decides to jump and leave the negative rates behind.
This week, the US inflation numbers will give the dollar a fresh direction, and hopefully a softish one. The headline inflation is expected to tick higher from 3.2% to 3.6% in August, on the back of rising energy prices, while core inflation may have eased from 4.7% to 4.3%. ‘We’ve gotten monetary policy in a very good place’ said the NY Fed President Williams last week. Indeed, the Fed hiked the rates by more than 500bp and shed its balance sheet by $1 trillion, while keeping the GDP around 2%, as inflation eased significantly from the 9% peak last summer to around 3% this summer. But crude oil cheapened by more than 40% between last summer and this spring, and the prices are now up by nearly 30% since then. The Fed will likely hold fire when it meets this month, but nothing is less sure for the November meeting. This week’s inflation data will be played in terms of November expectations.
For the European Central Bank (ECB), the base case scenario is a no rate hike at this week’s monetary policy meeting, but the European policymakers could announce a 25bp hike despite the latest weakness in economic data. The EURUSD is slightly better bid this morning, expect consolidation and minor correction toward the 200-DMA, 1.0823, into the meeting. The ECB, unlike the Fed, is not worried about surprising the market, on one side or the other. A no rate hike – even if it’s a hawkish pause - could push the EURUSD to below 1.0615, the major 38.2% Fibonacci retracement, into a medium term bearish trend whereas a 25bp hike should trigger a rally toward the 1.09 level.
On the corporate calendar, ARM will go public this week, in what is going to be this year’s biggest IPO. The company is expected to price on the 13th of September with a price range of $47-51 per share, and will start trading on Nasdaq the following day. ARM is expected to be valued at around $52bn, roughly 20 times its last disclosed annual revenue on expectation that the chips needed to power the generative AI will make ARM a sunny to-go place. Hope it won’t be stormy.
Busy Week Ahead
Market movers today
A busy week starts off with inflation data from the Nordics. In Norway, strong wage growth continues to support broader inflation pressures, and we expect August core inflation to tick slightly higher to 6.6% y/y (from 6.4%). In Denmark, inflation likely remained more muted, we think headline prices rose 3.0% y/y in August.
In the euro area, the EU Commission will publish its economic forecast. In their latest forecast from May the Commission expected GDP growth at 1.1% in 2023 and 1.6% in 2024. We expect the forecasts to be revised down due to the weak Q2 GDP growth figures and the deterioration we have seen over the summer in both the manufacturing and the service sector. Headline inflation has come in slightly lower over the summer, so here we also expect a downward revision of the forecast for 2023 and 2024.
Later this week, the main focus will turn to the ECB meeting on Thursday. Both markets and analyst consensus remain divided between a pause and a 25bp hike, we still expect the ECB to opt for the latter, see more details from our ECB preview, 6 September.
On the data front, markets' will pay close attention to the US August CPI release on Wednesday. While higher energy prices likely lifted headline CPI by 0.5% m/m (3.6% y/y), we look for another low core CPI print at 0.2% m/m (4.3% y/y).
The 60 second overview
Markets: Global financial markets closed last week with subdued activity. The S&P index recorded a marginal uptick, while Europe's Stoxx 600 experienced a 0.2% gain, primarily bolstered by the performance of energy stocks, in tandem with the ongoing appreciation of oil prices. Concurrently, US Treasury yields registered an upward trajectory, lending support to the USD, which marked its eighth consecutive week of ascent - a streak not seen since 2005. This robust performance of the USD has increasingly captured the attention of policymakers in Japan and China, triggering deliberations about its potential impact on their respective economies. In China, consumer prices displayed a modest uptick of 0.1% y/y in August, a slight rebound from the 0.3% decline observed in July, aligning with consensus expectations. Although this shift marked an exit from deflationary territory, the persistent softness in pricing pressures is indicative of subdued demand conditions.
Elsewhere, Brent crude prices advanced by 0.8%, extending their weekly gains to over 2% - now at around $90 USD per barrel. This surge has propelled oil prices to their highest levels since November of the preceding year with Saudi Arabia's and Russia's announcement of an extension of supply cuts until year-end.
This morning, Asian markets are mixed. Futures point to a neutral open in Europe. In Japan, the JPY strengthened after Bank of Japan governor, Kazuo Ueda, hinted that the Japanese central bank could have enough information about wage dynamics by year-end - a key factor in deciding when to end its negative monetary policy rate. The yield on 10-year Japanese government bond rose above 0.7% for the first time since 2014 on the back of Ueda's comments.
Equities: Global equities marginally higher Friday in rather dull session. Energy stocks continued to do well while industrials and materials underperformed. Wait-and-see markets ahead of ECB and Fed meetings seems a little early but yields and monetary policy outlook plays and important role for equities. In US on Friday, Dow +0.2%, S&P500 +0.1%, Nasdaq +0.1% and Russell 2000 -0.2%. Action and focus on Asia this morning with a strong yen on the back of a shift in tone from Bank of Japan. Japanese 10-year yields are up 6bp and bank stocks massively outperformed on a day when Nikkei 225 is lower by 0.5%. US and European futures are in green this morning.
FI: It is going to be a busy week in terms of key economic data and central bank meetings. The main events are the US inflation for August on Wednesday, US retail sales for August on Thursday as well as the ECB meeting on Thursday. The core US inflation is expected to rise by 0.2% m/m. ECB is expected to raise rates by 25bp.
FX: EUR/USD is hovering around the 1.07 mark, as strong US data and general risk-off sentiment have weighed on the cross the past couple of months. USD/JPY is trading around the 147 mark, as elevated US yields still add support to the cross. EUR/GBP is just short of the 0.86 mark. EUR/SEK remained range-bound around 11.85-95 all of last week, consolidating in wait of the next trigger. EUR/NOK has been on a downward trajectory in September and is now trading around 11.45. The rally in EUR/DKK stalled on Friday - it traded slightly to the strong side of the 7.4604 central rate.
Credit: The week ended on a positive note with US markets rallying after a relatively slow European session. Credit markets followed suit and Itrax Main tightened 1.1bp to close at 70.9bp, while Itrax Xover tightened 3.5bp to close at 399.5bp. The usual Friday-lull returned to primary markets, which were relatively calm despite the slightly improved risk sentiment.
Nordic macro
Norwegian core inflation has been volatile in recent months, driven largely by food prices. These climbed far less in July than last year, which may mean that they come down more cautiously than normal in August. There are also signs that the biggest price hikes may now be behind us, and producer prices on food have slowed in recent months. On the other hand, we expect services inflation to remain high due to stronger wage growth, and airfares look likely to rise further. We therefore expect core inflation to climb to 6.6% y/y in August.
USD/JPY Daily Outlook
Daily Pivots: (S1) 146.93; (P) 147.40; (R1) 147.76; More...
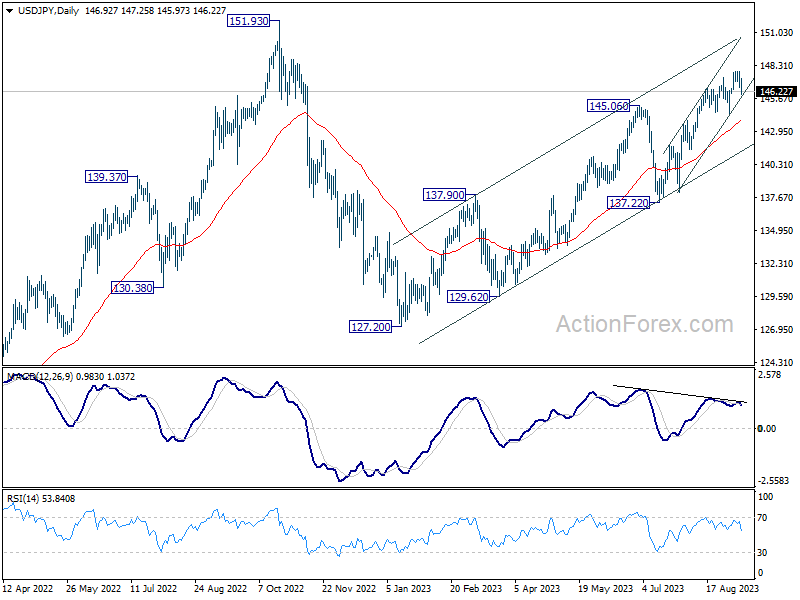
USD/JPY dips notably today, but stays well above 144.43 support. Intraday bias remains neutral at this point, as consolidation from 147.88 could extend. But outlook remains bullish with 144.43 support intact. On the upside, above 147.88 will resume larger rise from 127.20, to retest 151.93 high.
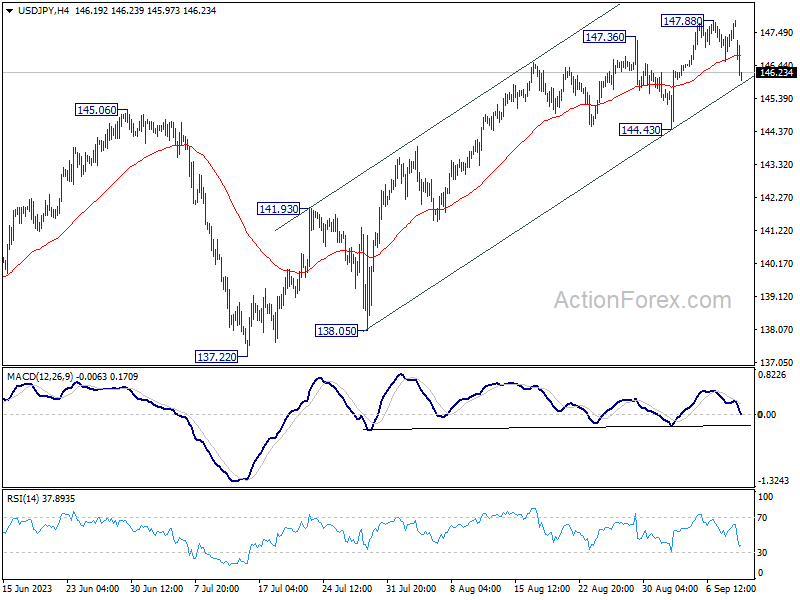
In the bigger picture, while rise from 127.20 is strong, it could still be seen as the second leg of the corrective pattern from 151.93 (2022 high). Rejection by 151.93, followed by break of 137.22 support will indicate that the third leg of the pattern has started. However, sustained break of 151.93 will confirm resumption of long term up trend.
Yen Rebounds on BoJ Ueda’s Hawkish Remarks; US CPI and ECB to Highlight the Week
Yen displayed impressive strength in Asian session, following hawkish remarks from BoJ Governor Kazuo Ueda over the weekend. Speculation is rife that the central bank is laying down preparations to exit negative rates early next year, with sustained wage growth being a key prerequisite, as echoed by various BoJ officials.
Meanwhile, both Australian and New Zealand Dollars are seeing a revival, largely supported by rebound in Chinese Yuan. This bounce back was facilitated by the PBoC's stronger-than-expected daily fixing by a record margin. Reinforcing its stance on currency stability, the Chinese central bank declared its commitment to "correct one-sided and pro-cyclical activities," vowing to stave off undue currency risks and speculatory behaviors that might disrupt the foreign exchange market's orderly operations.
On the other hand, Dollar is trading generally lower as it undergoes a consolidation phase, absorbing some of the gains from last week. The greenback is poised to engage in more consolidative trading as markets anticipate the release of Wednesday's US CPI data. In Europe, Euro presents a mixed picture, with investors keenly awaiting the ECB's rate decision scheduled for Thursday.
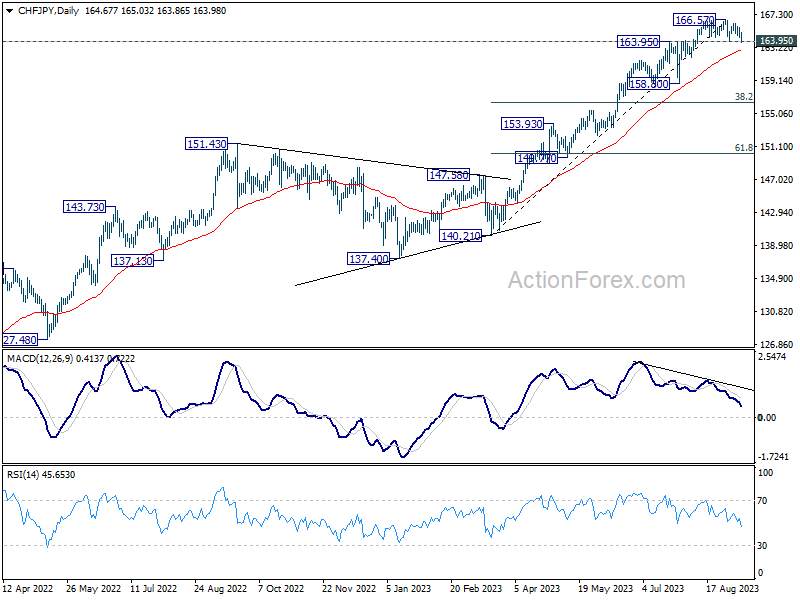
From a technical standpoint, CHF/JPY's breach of 163.95 resistance-turned-support, combined with bearish divergence observed in D MACD, indicates the possibility of a more extensive correction on the horizon. Near term attention has shifted towards 55 D EMA (now at 162.81). Sustained trading below this EMA might instigate a steeper decline towards 38.2% retracement of 140.21 to 166.57 at 156.50. Nonetheless, robust rebound from the EMA would maintain near-term bullish outlook, paving the way for an extension of the recent upward trend, sooner rather than later.
In Asia, at the time of writing, Nikkei is down -0.48%. Hong Kong HSI is down -0.77%. China Shanghai SSE is up 1.13%. Singapore Strait Times is up 0.09%. Japan 10-year JGB yield is up 0.0550 at 0.706.
10-year JGB yield hits 9-year high on BoJ Ueda, Yen rebounds
Yen saw a notable uptick in Asian session, buoyed by hawkish sentiments by BoJ Governor Kazuo Ueda. Concurrently, 10-year JGB yield scaled its highest level in nine years, breaching 0.7% mark.
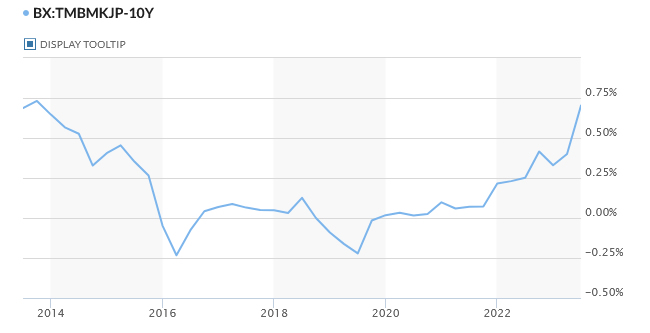
In an interview with Yomiuri newspaper published over the weekend, Ueda hinted at the possibility that BoJ might have sufficient data by the close of the year to contemplate ending its negative interest rate policy. Such remarks from Ueda have spurred speculation among market analysts, with some interpreting them as early signals for the markets, suggesting a potential end to negative interest rates by Q1 2024. Before this step, there also are anticipations of yield curve control being phased out later this year.
On the flip side, certain analysts, referencing recent data which highlights decelerating wage growth, argue that the transition from negative rates might not be imminent. They believe Ueda's remarks might be more of a countermeasure to Yen's recent depreciation.
Ueda, during the interview, emphasized the need for Japan to witness a consistent rise in inflation, complemented by wage growth, before implementing changes. "If we judge that Japan can achieve its inflation target even after ending negative rates, we'll do so," Ueda asserted. However, he also reiterated the central bank's stance on maintaining its ultra-loose policy for now, until there's firm confidence that inflation will consistently hover around the 2% mark, bolstered by robust demand and wage growth.
He cautioned, "While Japan is showing budding positive signs, achievement of our target isn't in sight yet." Looking ahead, Ueda underscored the importance of wage trajectories in the coming year, indicating that conclusive decisions would be data-driven. "We can't rule out the possibility we'll get enough information and data by year-end," Ueda added
A pivotal week with ECB, US CPI, UK GDP and employment, and Chinese data
A series of high-profile events are scheduled for the week, Euro finds itself on unstable grounds ahead of ECB's rate decision slated for this Thursday. Dollar is staying firm as US anticipates pivotal CPI data on Wednesday. There are also substantial economic releases from UK and China.
ECB stands at a crossroads, grappling with the choice of either implementing a 10th consecutive rate hike — potentially elevating main refinancing rate to 4.50% and deposit rate to 4.0% — or pausing to assess the evolving economic and inflation development. The consensus among economists is far from unanimous, although a slightly larger faction envisages ECB holding steady.
Market stakeholders also await the new ECB staff economic projections with bated breath, keen to discern any adjustments to 2023 inflation outlook influenced by rising oil prices since June. However, the pivotal elements in shaping policy guidance remain the projections for 2024 and 2025, given the recent slowdown in the Eurozone service sector and the broader economy hinting at reduced price pressures.
For Euro, the ideal bullish outcome would be a combination of a rate hike along with significant upward revision in inflation forecasts, with growth projections taking only a minor hit. However, such outcome seems to be on the less probable side of the spectrum. Conversely, if ECB signals that the terminal rate has been reached, combined with a subdued economic outlook for the upcoming year, Euro could face a steep decline.
US market is gearing up for the critical release of August CPI data this Wednesday, a development holding notable sway over market movements. Market observers should take note Fed policymakers are placing significant emphasis on the month-on-month core inflation rate, perhaps even more so than its year-over-year counterpart.
Headline CPI could experience a significant surge, leaping by 0.6% mom. This spike can be attributed in large part to almost 10% surge in gas prices. That would translate to re-acceleration in annual headline inflation rate from 3.2% yoy to 3.6% yoy.
However, it's worth noting that this gas-induced inflationary rise might not cause much concern among Fed officials. From their perspective, the real metric to watch is core CPI, which excludes volatile elements like food and energy prices. If core CPI maintains its steady 0.2% mom growth, this would result in an annual rate reduction from 4.7% yoy to around 4.3% yoy. Such deceleration would align with Fed's expectation of moderating inflationary pressures.
In UK, spotlight is firmly on upcoming economic revelations including employment and GDP data, with significant implications for Sterling. Recent comments from BoE Governor Andrew Bailey about being "much nearer now to the top of the cycle" have exerted downward pressure on Pound, positioning it as the second-worst performer of the month, overtaken only by Australian Dollar.
Another BoE rate hike is still widely anticipated on September 21. However, the looming economic releases stand as potential turning points that could alter the path beyond that significantly. Slowdown in wages growth coupled with disappointing GDP figures might drastically reduce the likelihood of further monetary tightening in the aftermath of this forthcoming meeting.
Simultaneously, Australian Dollar will be influenced by both domestic employment data and a suite of economic releases from China, its largest trading partner. In particular, industrial production and retail sales data will reveal much insight into the impact of persistently sluggish exports and weak domestic demand.
Here are some highlights for the week:
- Monday: Japan M2, machine tool orders; Italy industrial production.
- Tuesday: Australia Westpac consumer sentiment, NAB business confidence; UK employment; Germany ZEW;
- Wednesday: UK GDP, production, trade balance; Eurozone industrial production; US CPI.
- Thursday: Japan machine orders; Australia employment; Swiss PPI; ECB rate decision; US PPI, retail sales, jobless claims, business inventories.
- Friday: New Zealand BusinessNZ manufacturing; China industrial production, retail sales, fixed asset investment; Japan tertiary industry index; Eurozone trade balance; Canada manufacturing sales; US Empire State manufacturing, import prices, industrial production, U of Michigan consumer sentiment.
USD/JPY Daily Outlook
Daily Pivots: (S1) 146.93; (P) 147.40; (R1) 147.76; More...
USD/JPY dips notably today, but stays well above 144.43 support. Intraday bias remains neutral at this point, as consolidation from 147.88 could extend. But outlook remains bullish with 144.43 support intact. On the upside, above 147.88 will resume larger rise from 127.20, to retest 151.93 high.
In the bigger picture, while rise from 127.20 is strong, it could still be seen as the second leg of the corrective pattern from 151.93 (2022 high). Rejection by 151.93, followed by break of 137.22 support will indicate that the third leg of the pattern has started. However, sustained break of 151.93 will confirm resumption of long term up trend.
Economic Indicators Update
| GMT | Ccy | Events | Actual | Forecast | Previous | Revised |
|---|---|---|---|---|---|---|
| 23:50 | JPY | Money Supply M2+CD Y/Y Jul | 2.50% | 2.50% | 2.40% | 2.50% |
| 06:00 | JPY | Machine Tool Orders Y/Y Aug P | -19.80% | |||
| 08:00 | EUR | Italy Industrial Output M/M Jul | -0.30% | 0.50% |
Gold Technical: Bears Stalling Again at 200-day Moving Average ahead of US CPI and ECB
- Last Friday’s price actions of spot Gold (XAU/USD) have managed to find support again at the 200-day moving average ahead of the US CPI data release & ECB monetary policy decision this week.
- The recent -5.15 % decline seen in Gold from its 20 July 2023 swing high of US$$1,987.53 has started to see some signs of short-term bullish reversal elements since 21 August 2023.
- The up-trending 10-year US Treasury real yield has also started to consolidate between 1.95% to 2.00% level which may negate the bearish tone on Gold at least in the short-term.
- US$1,910 support and US$1,932 resistance are the two key short-term technical levels to watch.
Since its 20 July 2023 swing high of US$1,987.53, spot Gold (XAU/USD) has declined by -5.15% to print a low of US$1,885 on 17 August 2023 in line with a rising longer-term 10-year US Treasury real yield which increased the opportunity costs of holding gold as it is a non-interest yielding asset.
Major uptrend remains intact
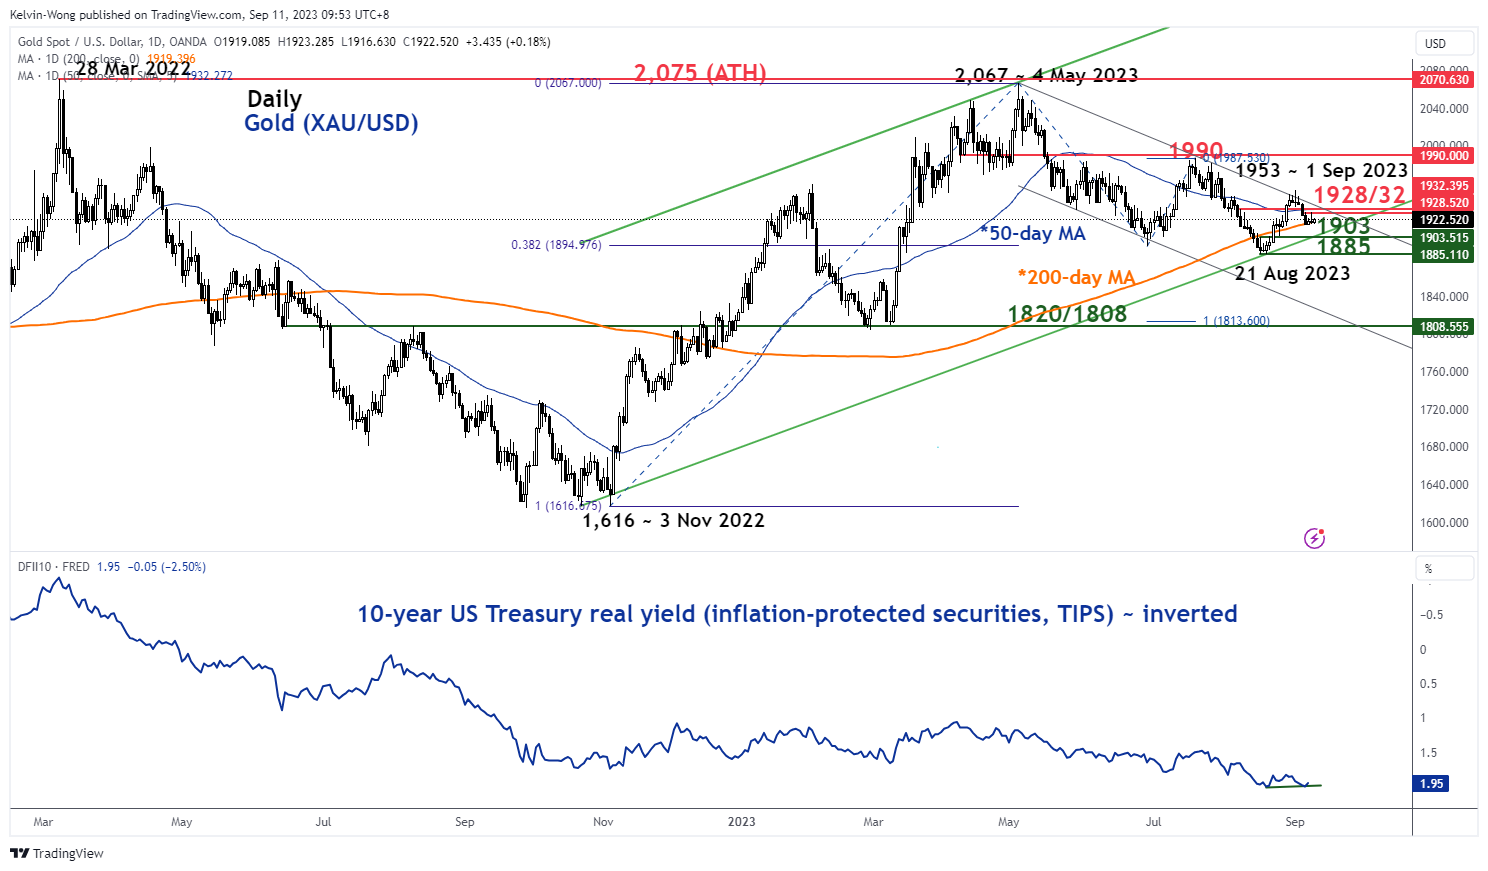
Fig 1: Gold (XAU/USD) major trend as of 11 Sep 2023 (Source: TradingView, click to enlarge chart)
Despite the underperformance of Gold seen in the past five weeks, its major uptrend phase in place since the 3 November 2022 low of US$1,616 remains intact as the -5.15% fall from the 20 July 2023 high of US$1,987.15 has managed to stall at the lower boundary of a major ascending channel from its 3 November 2022 major swing low and close to the 38.2% Fibonacci retracement of the prior major uptrend phase from 3 November 2022 low to 4 May 2023 high (see daily chair).
Also, the up-trending 10-year US Treasury real yield (derived via the inflation-protected securities, TIPS of the same duration) has started to consolidate at the 1.95% to 2.00% level which may negate the bearish tone on Gold at this juncture.
Short-term momentum has tilted toward the bullish camp
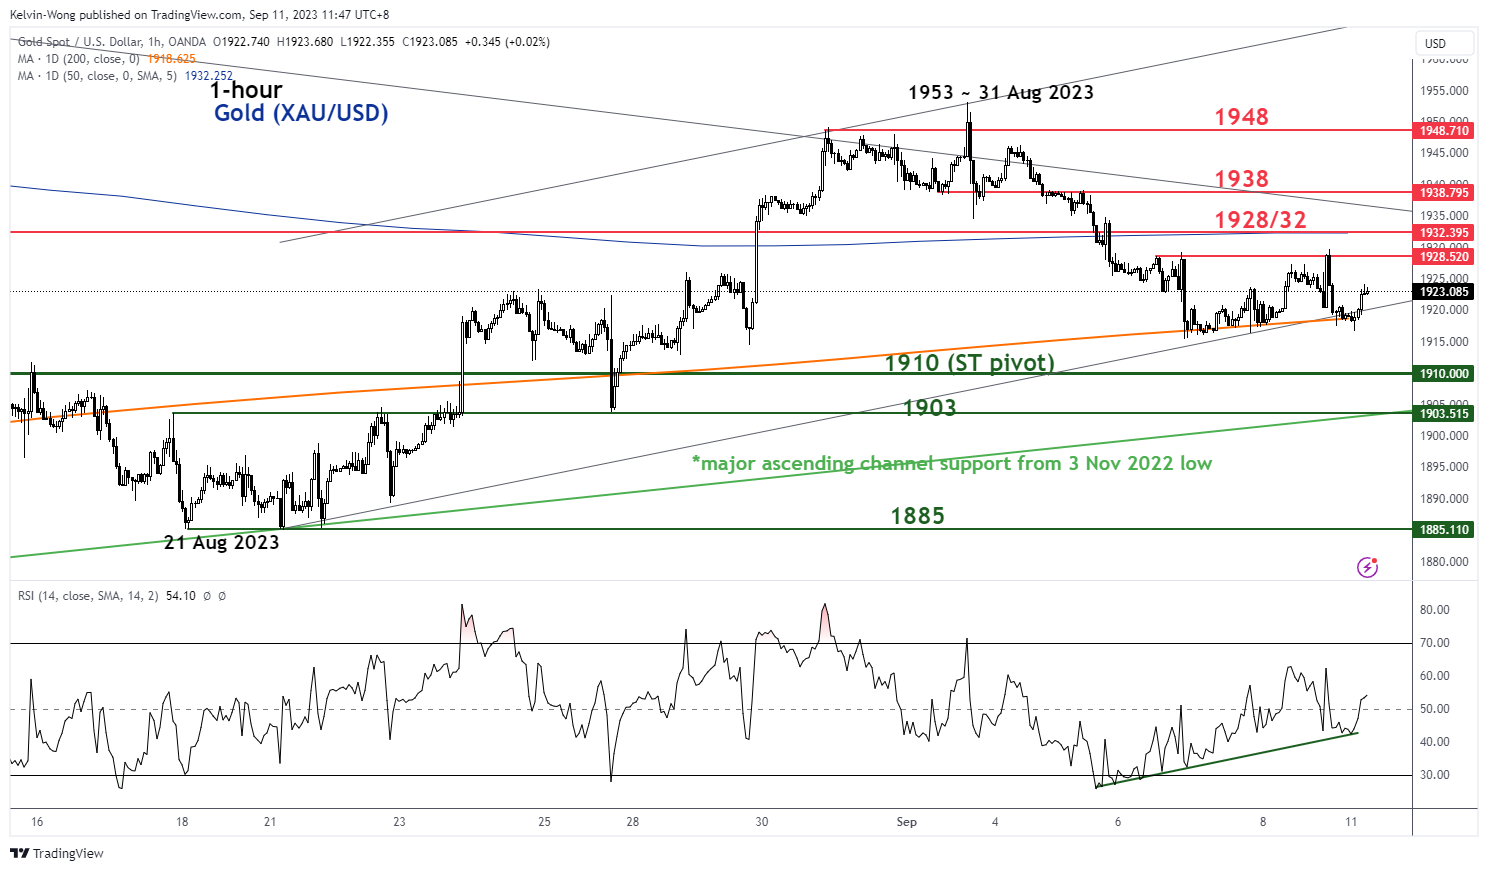
Fig 2: Gold (XAU/USD) minor short-term uptrend as of 11 Sep 2023 (Source: TradingView, click to enlarge chart)
Since 26 August 2023, the price actions of Gold (XAU/USD) have reintegrated back above the key 200-day moving average and its recent slide from its US$1,953 minor swing high of 1 September 2023 has managed to find support at the 200-day moving after a retest on it on last week, the lower boundary of a minor ascending channel from 21 August 2023 low and close to the 50% Fibonacci retracement of the recent minor uptrend from 21 August 2023 low to 1 September 2023 high.
In addition, the hourly RSI oscillator, a gauge of short-term momentum shaped a bullish divergence condition on 7 September 2023 and continued to trace out a series of “higher lows” thereafter.
These observations indicate a revival of short-term bullish momentum conditions that in turn advocates another round of minor potential up leg in Gold. Watch the US$1,910 key short-term pivotal support and a break above the intermediate resistance at US$1,932 (also the 50-day moving average) may see a further push-up for the next resistances to come in at US$1,938 and US$1,949.
On the other hand, failure to hold at US$1,910 invalidates the bullish scenario for a further slide to expose the major support at US$1,903.
Technical Outlook and Review
DXY:
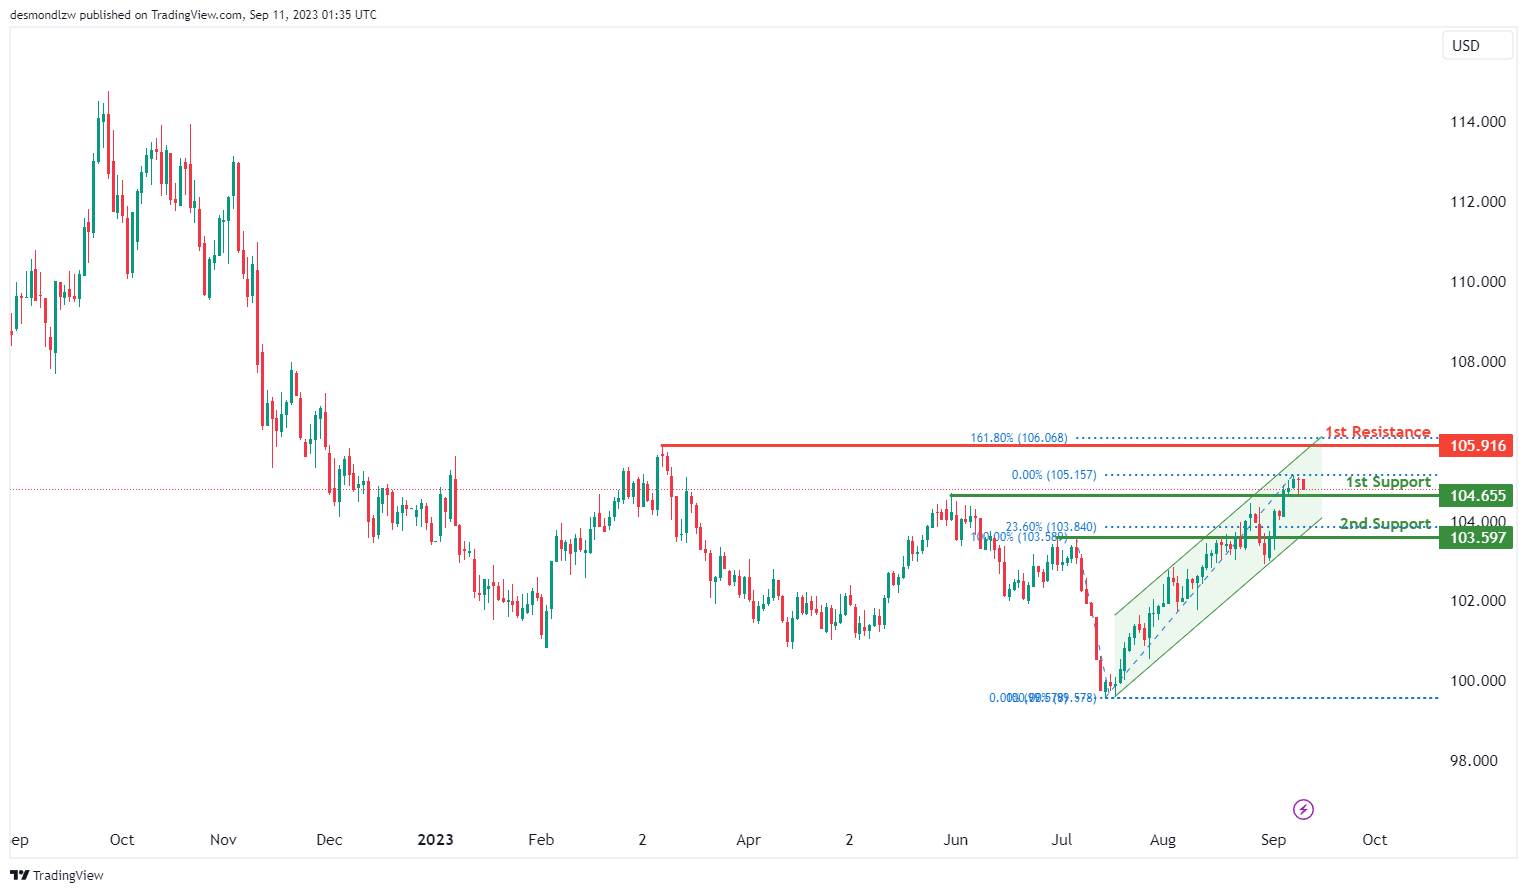
The DXY (US Dollar Index) chart currently displays a bullish overall momentum, with price situated within a bullish ascending channel.
There’s potential for a bullish bounce off the 1st support level at 104.65, identified as an overlap support.
Additionally, the 2nd support at 103.59 is noted as a pullback support, further reinforcing its significance as a potential area of price support.
On the resistance side, the 1st resistance at 105.91 is designated as an overlap resistance, and it aligns with the 161.80% Fibonacci Retracement level. This confluence of factors enhances its potential as a resistance zone.
EUR/USD:
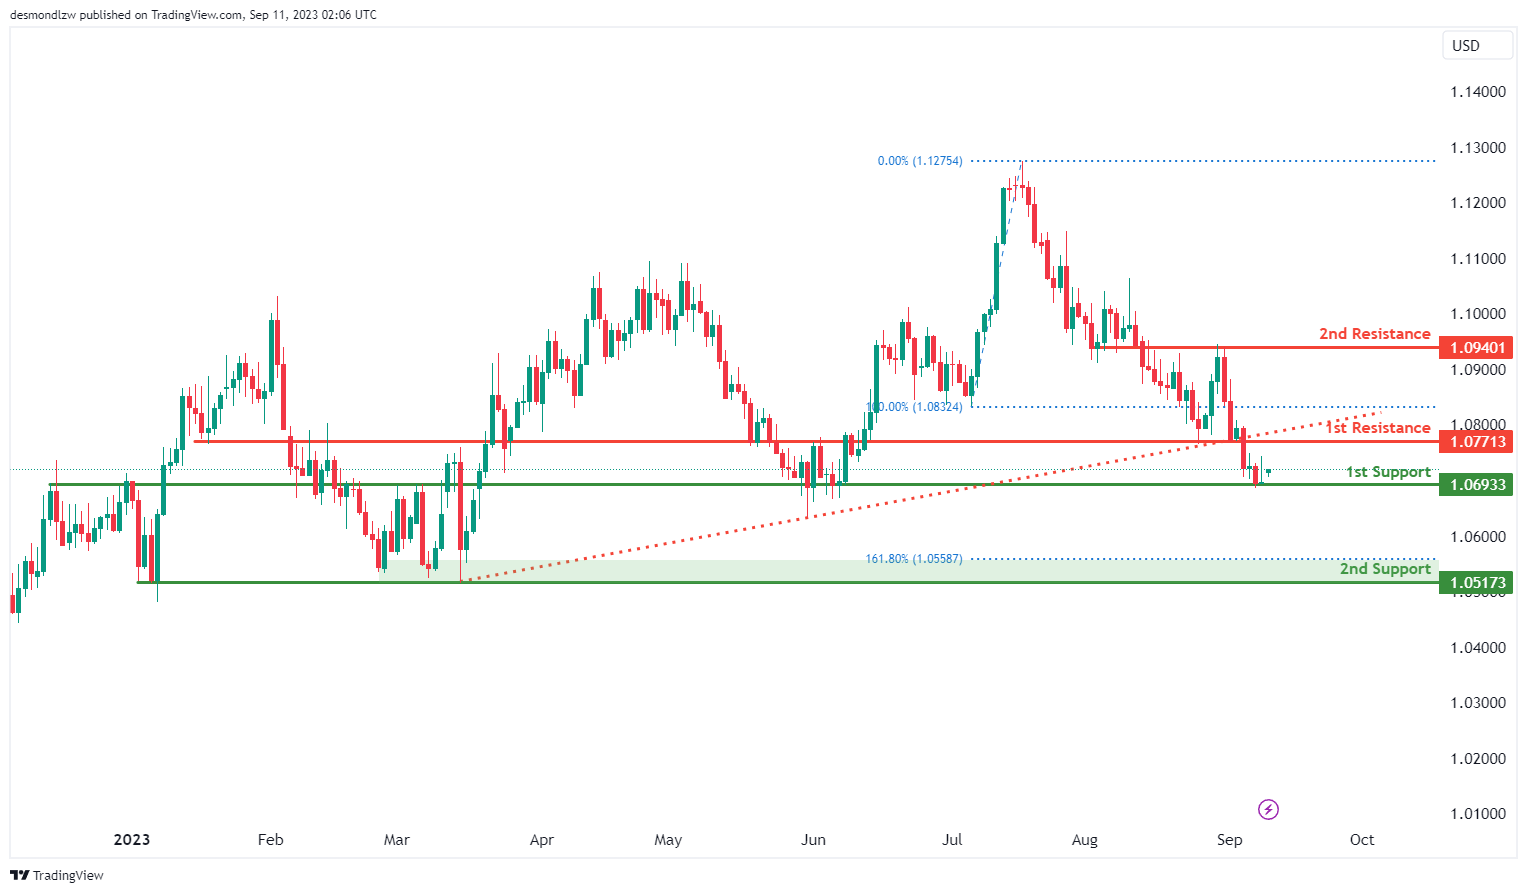
The EUR/USD chart is currently characterized by bearish momentum, with price positioned below a major descending trend line, indicating a potential for continued bearish movement.
There’s a possibility of a short-term rise in price towards the 1st resistance level at 1.0771 before a potential reversal and a drop towards the 1st support level.
The 1st support at 1.0693 is identified as an overlap support, providing a historical level of price support.
Additionally, the 2nd support at 1.0517 is significant as it represents multi-swing low support and aligns with the 161.80% Fibonacci Extension, further reinforcing its importance as a potential support zone.
On the resistance side, the 1st resistance at 1.0771 is considered significant as it acts as a pullback resistance.
Furthermore, the 2nd resistance at 1.0940 is marked as an overlap resistance, suggesting potential selling pressure in this area.
EUR/JPY:
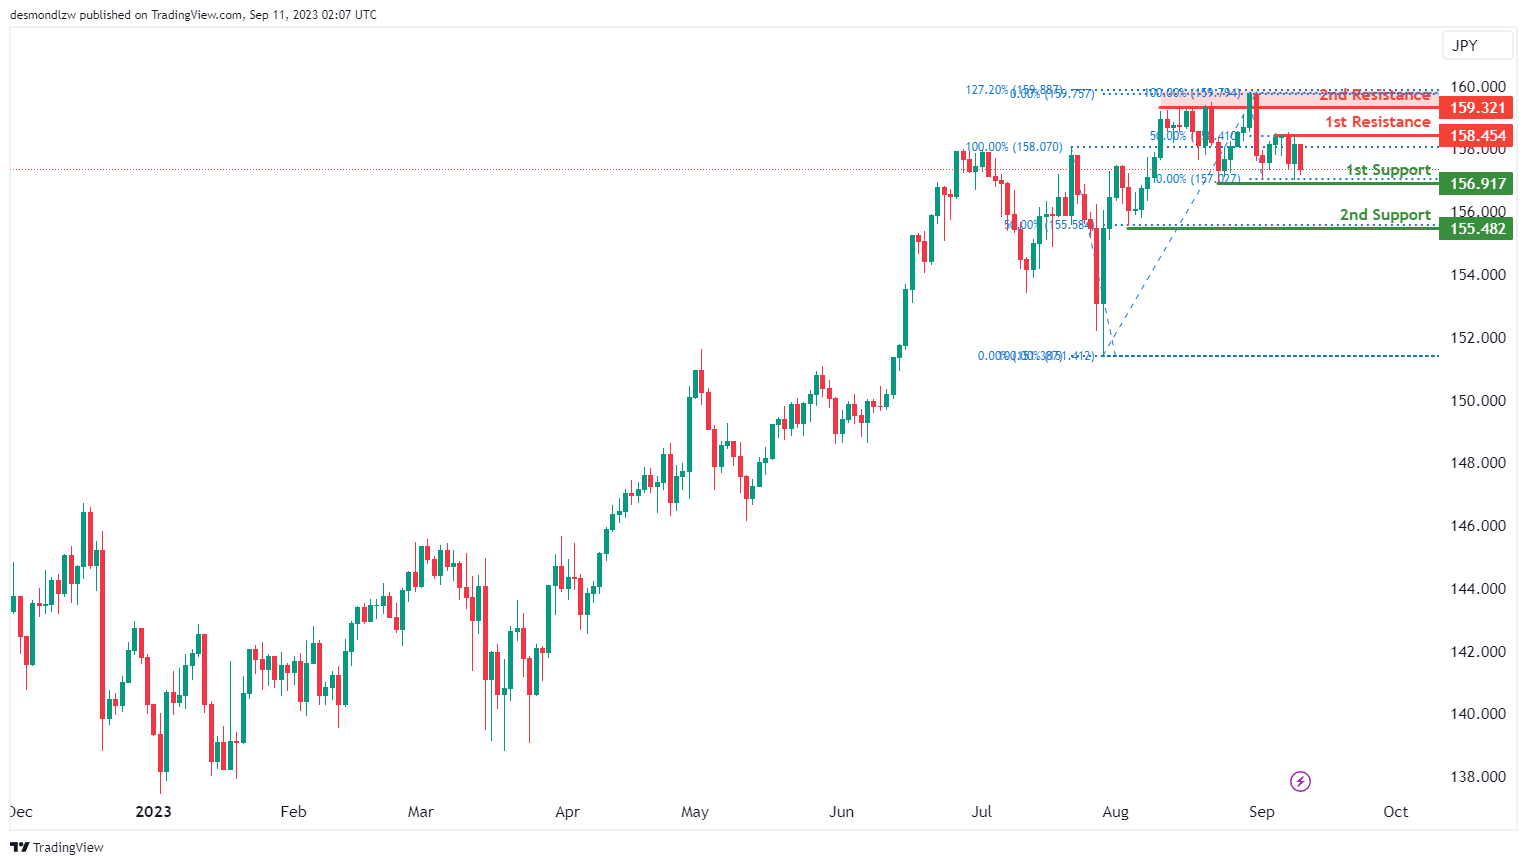
For EUR/JPY, the overall momentum of the chart is currently bearish, indicating a downward trend.
There is a potential for the price to continue its bearish movement towards the 1st support level at 156.91. The 1st support at 156.91 is considered significant because it represents multi-swing low support, suggesting potential stability at this level.
In the event of a more substantial decline, the 2nd support at 155.48 is also noteworthy. This support level is characterized as a swing low support and aligns with the 50% Fibonacci Retracement level, adding further significance to it.
On the other hand, if there’s a reversal in the price, it may encounter resistance at the 1st resistance level of 158.45, which is identified as a swing high resistance and is supported by a 50% Fibonacci Retracement.
Further upward movement could face resistance at the 2nd resistance level of 159.32, which is characterized as a pullback resistance and is aligned with the 127.20% Fibonacci Extension, potentially acting as a barrier to the bullish momentum.
EUR/GBP:
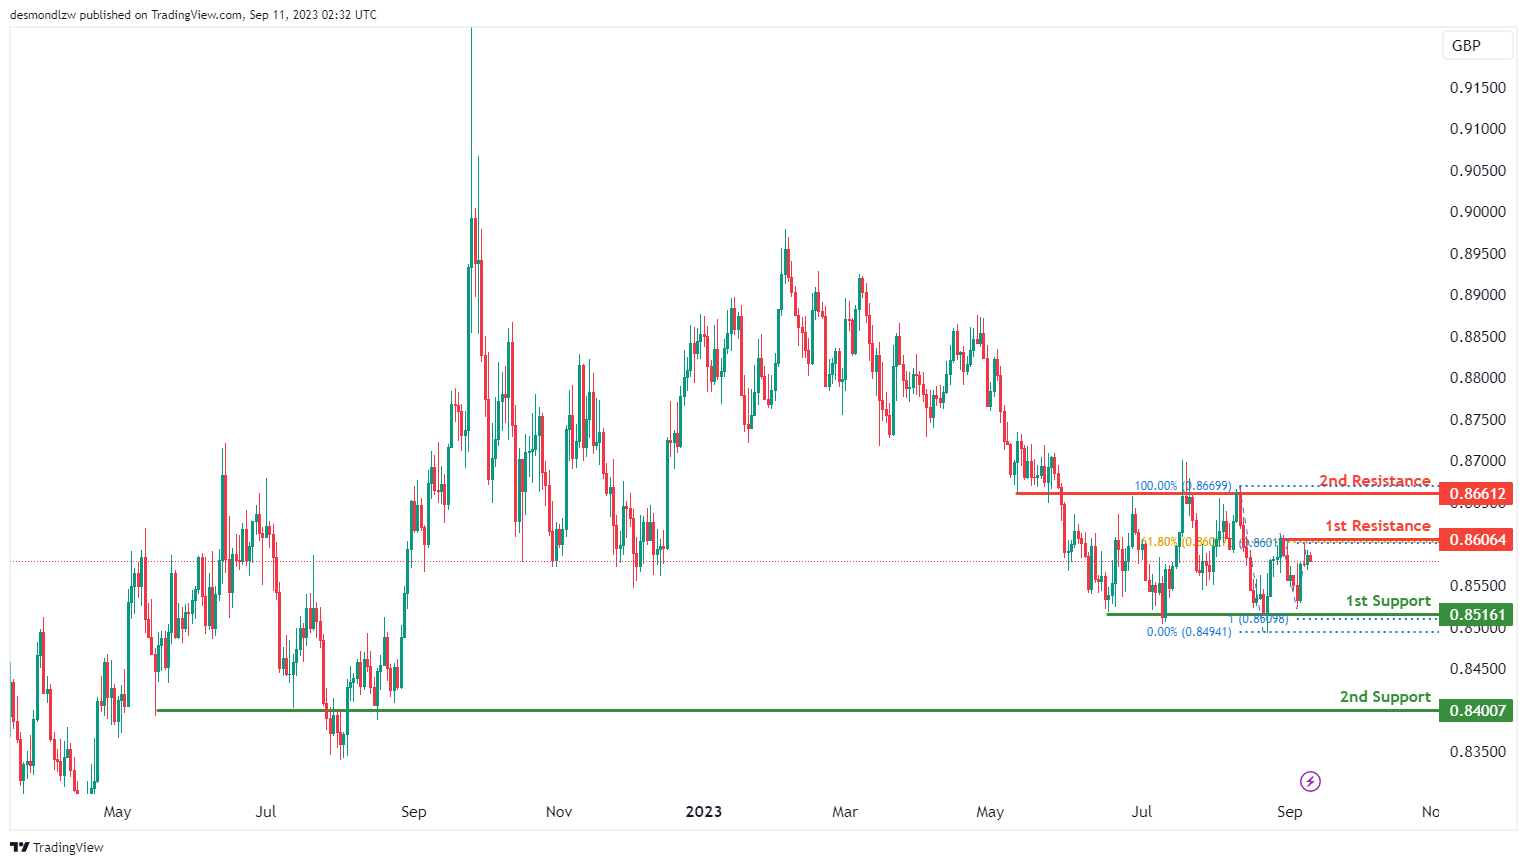
For EUR/GBP, the overall momentum of the chart is currently bearish, indicating a downward trend.
There is potential for the price to continue its bearish movement towards the 1st support level at 0.8516. This 1st support is considered significant because it represents multi-swing low support and aligns with the 100% Fibonacci Projection, suggesting a strong potential for support at this level.
In case of a more substantial decline, the 2nd support level at 0.8400 is also noteworthy as it acts as an overlap support.
On the upper side, if there’s a reversal in the price, it may face resistance at the 1st resistance level of 0.8606. This 1st resistance is considered important due to its characteristics as a swing high resistance and its alignment with the 61.80% Fibonacci Retracement level.
Further upward movement could encounter resistance at the 2nd resistance level of 0.8661, characterized as an overlap resistance, which may act as a barrier to the bullish momentum within the observed range.
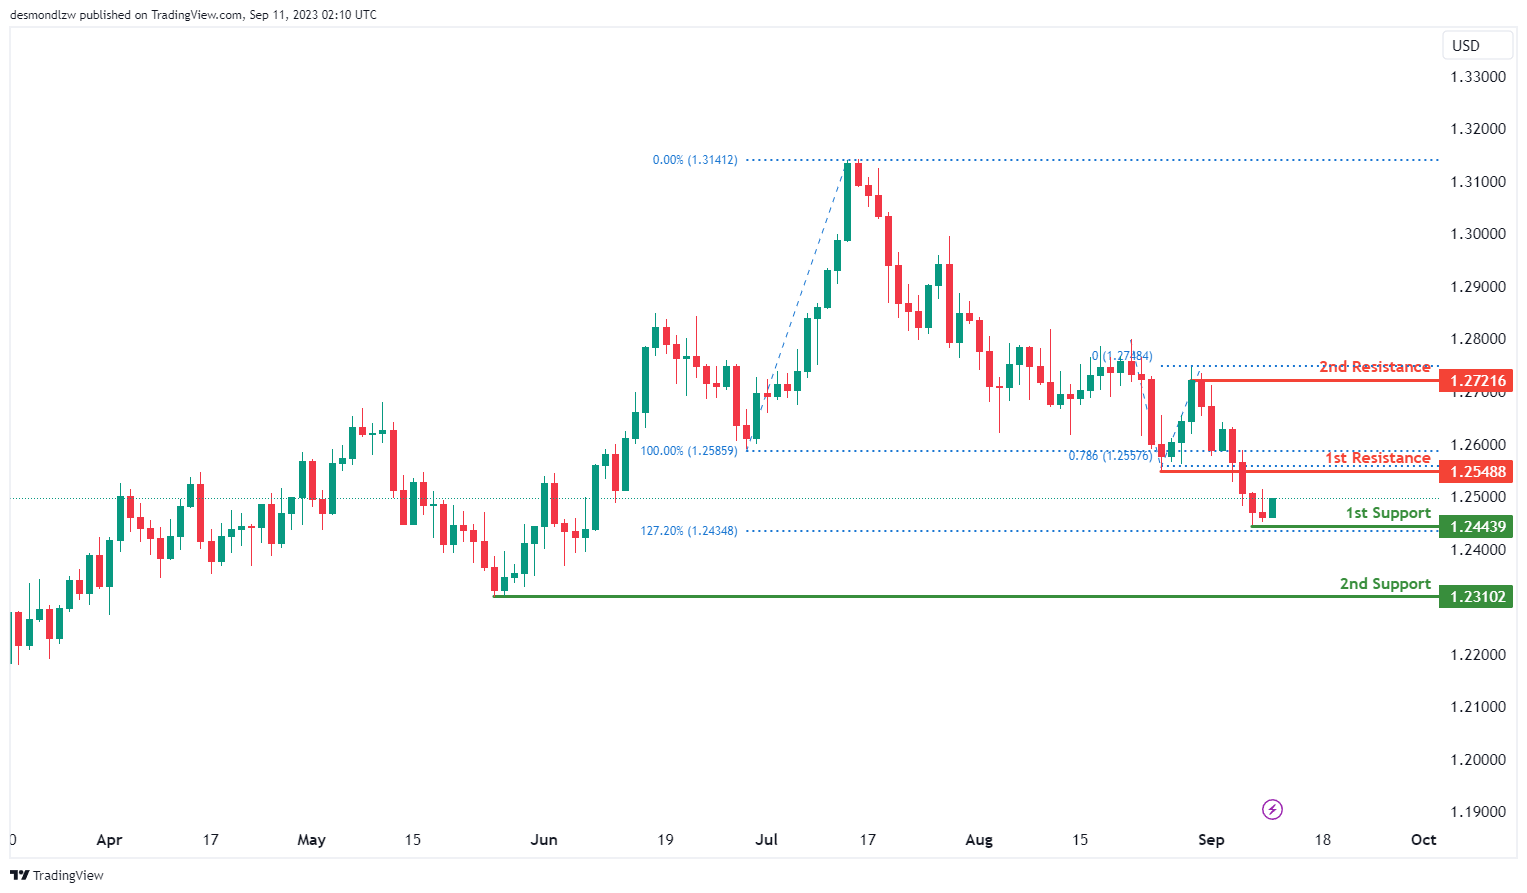
GBP/USD:
The GBP/USD chart currently demonstrates a bullish momentum, suggesting a potential upward trend in price movement.
There’s a likelihood of a bullish bounce off the 1st support level at 1.2443, which is supported by swing low characteristics and aligns with the 127.20% Fibonacci Expansion.
Additionally, another 1st support at 1.2310 is marked as a swing low support, further reinforcing its role as a potential area of price support.
Looking at resistance levels, the 1st resistance at 1.2548 is identified as a pullback resistance and is significant as it aligns with the 78.60% Fibonacci Projection.
Furthermore, the 2nd resistance at 1.2721 is notable as it represents swing high resistance.
GBP/JPY:
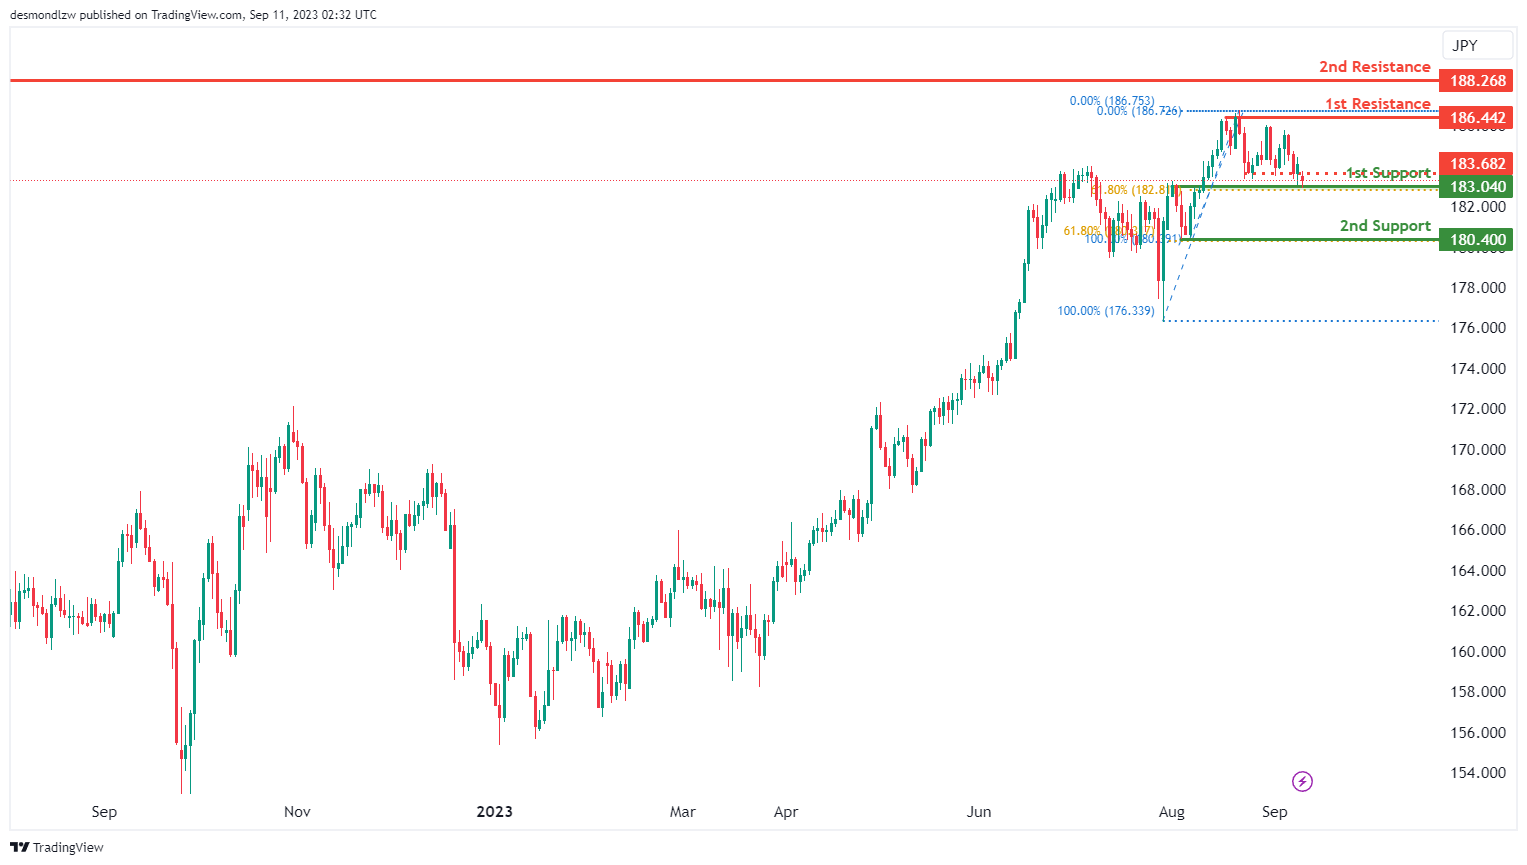
For GBP/JPY, the overall momentum of the chart is currently bullish, indicating an upward trend.
There is potential for the price to make a bullish move by bouncing off the 1st support level at 183.04 and heading towards the 1st resistance at 186.42.
The 1st support at 183.04 is considered significant because it represents an overlap support and aligns with the 61.80% Fibonacci Retracement level, suggesting potential stability and support at this level.
In the event of a more substantial retracement, the 2nd support level at 180.40 is also noteworthy as it acts as a swing low support and coincides with the 61.80% Fibonacci Retracement, offering additional reinforcement for the price.
On the upper side, the 1st resistance at 186.42 is considered important due to its characteristics as multi-swing high resistance, indicating potential resistance to upward movement.
Further upward movement may encounter resistance at the 2nd resistance level of 188.26, characterized as multi-swing high resistance, which could pose a significant barrier to the bullish momentum.
Additionally, there is an intermediate resistance level at 183.68, identified as pullback resistance, which may temporarily slow down the bullish momentum within the observed range.
USD/CHF:
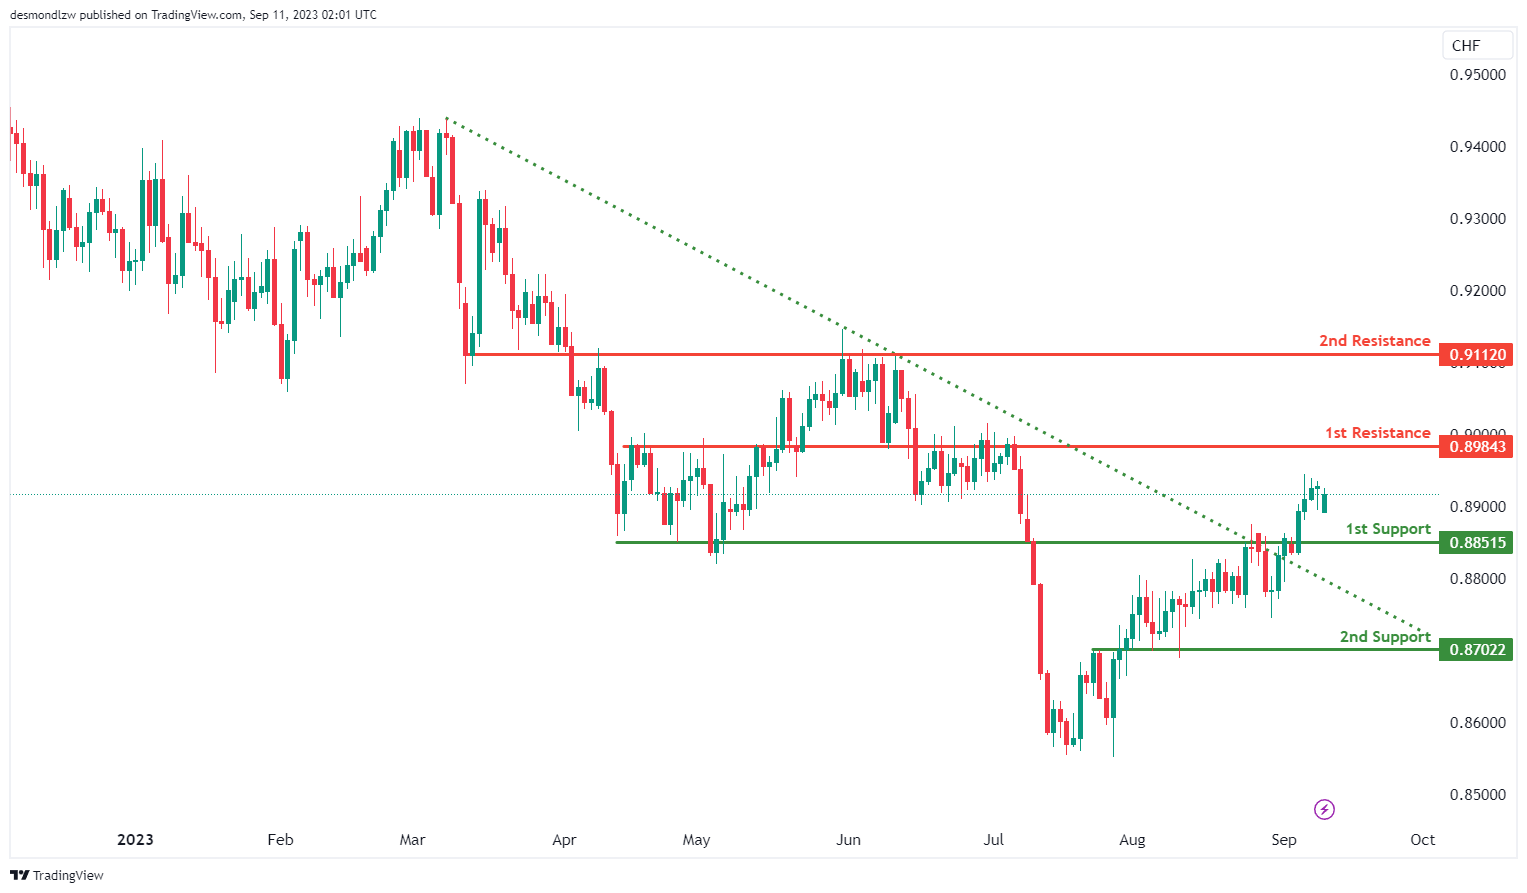
The USD/CHF chart currently displays a bullish momentum, primarily driven by the breakout above a descending resistance line, indicating the potential for an upward price movement.
There’s a likelihood of a bullish continuation towards the 1st resistance level at 0.8984, which is identified as an overlap resistance.
On the support side, the 1st support at 0.8851 is considered a pullback support, indicating its significance as a potential area of price support.
Additionally, the 2nd support at 0.8702 is marked as an overlap support, further reinforcing its potential role as a support level.
Furthermore, the 2nd resistance at 0.9112 is also noted as an overlap resistance, which could potentially act as a barrier to further bullish movements.
USD/JPY:
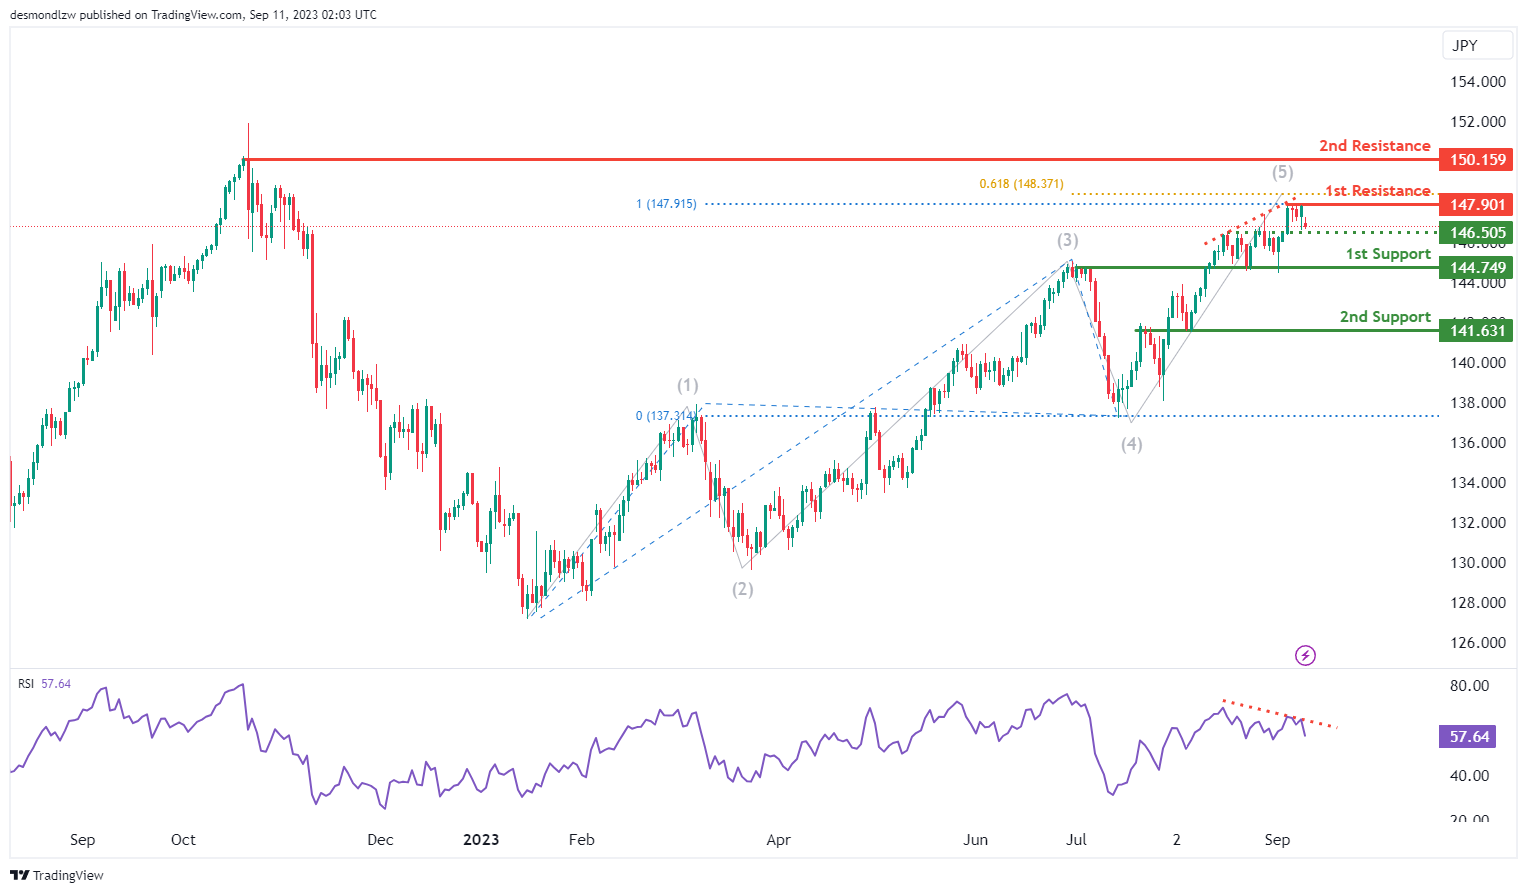
The USD/JPY chart currently exhibits a bearish momentum, suggesting a potential downward trend in price movement.
There’s a likelihood of a bearish continuation towards the 1st support level at 144.74, which is identified as an overlap support.
Additionally, the 2nd support at 141.63 is marked as an overlap support, further reinforcing its potential role as a support level.
On the resistance side, the 1st resistance at 147.90 is considered significant as it represents swing high resistance, potentially acting as a barrier to any bullish movements.
Furthermore, the 2nd resistance level at 150.15 is also noted as swing high resistance, further indicating potential resistance in this area.
Intermediate support is observed at 146.50, identified as an overlap support, adding to the potential significance of this level.
It’s important to note that RSI is displaying bearish divergence versus price, suggesting the likelihood of a rapid decline in price, aligning with the overall bearish momentum.
USD/CAD:
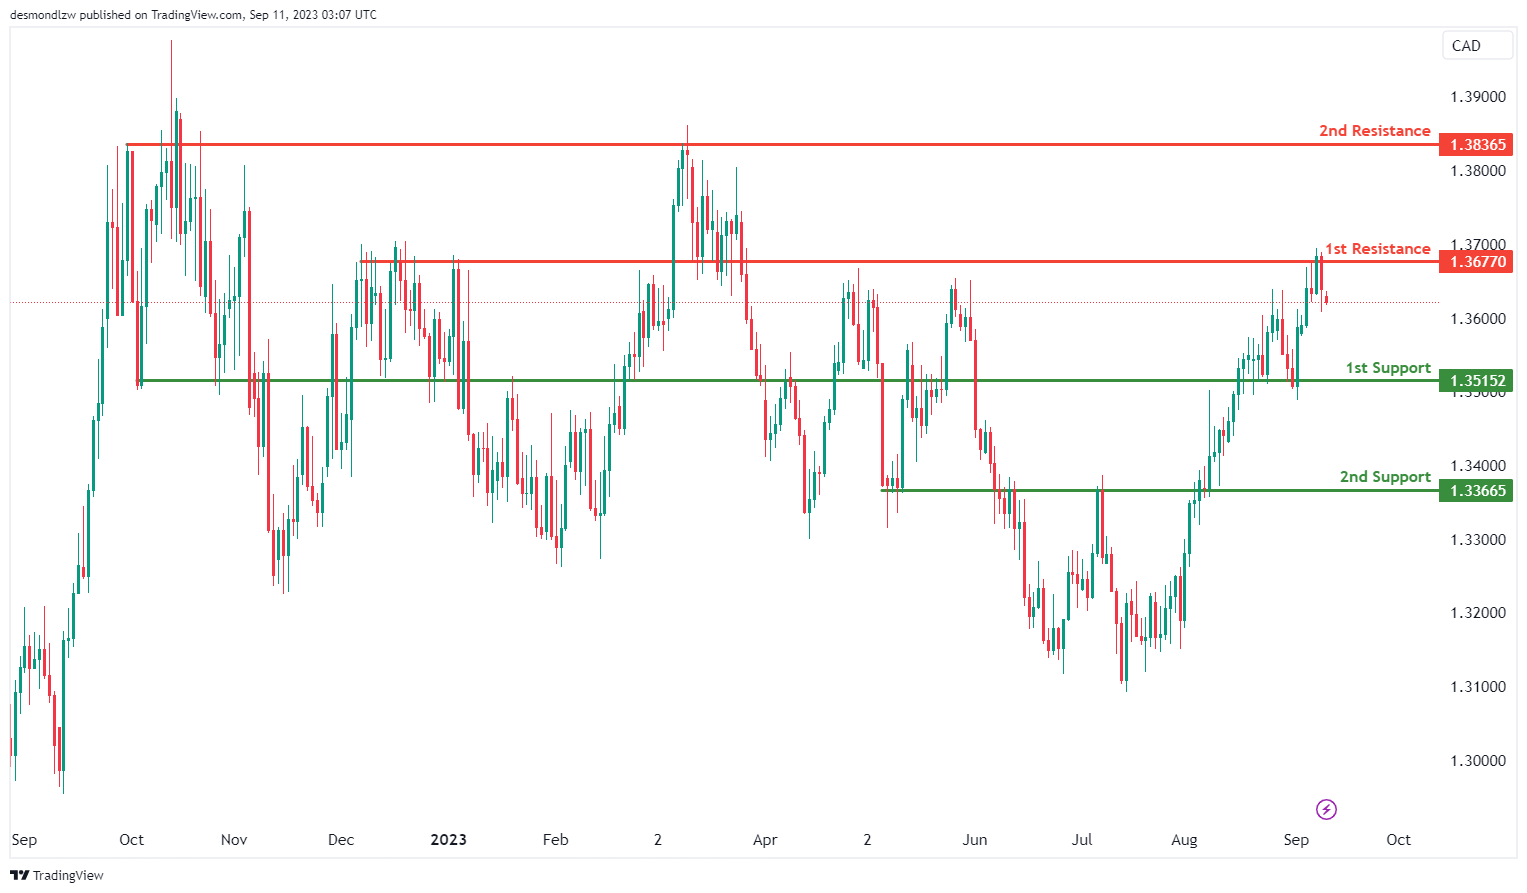
The USD/CAD chart currently indicates an overall bearish momentum, suggesting a potential downward trend in price movement.
There is a possibility of a bearish continuation towards the 1st support level at 1.3515, which is identified as an overlap support. Additionally, the 2nd support level at 1.3367 is also marked as an overlap support, further reinforcing its role as a potential support zone.
To the upside, the 1st resistance level at 1.3677 is identified as an overlap resistance while the 2nd resistance level at 1.3837 is also noted as an overlap resistance, reinforcing its potential as a resistance level.
AUD/USD:
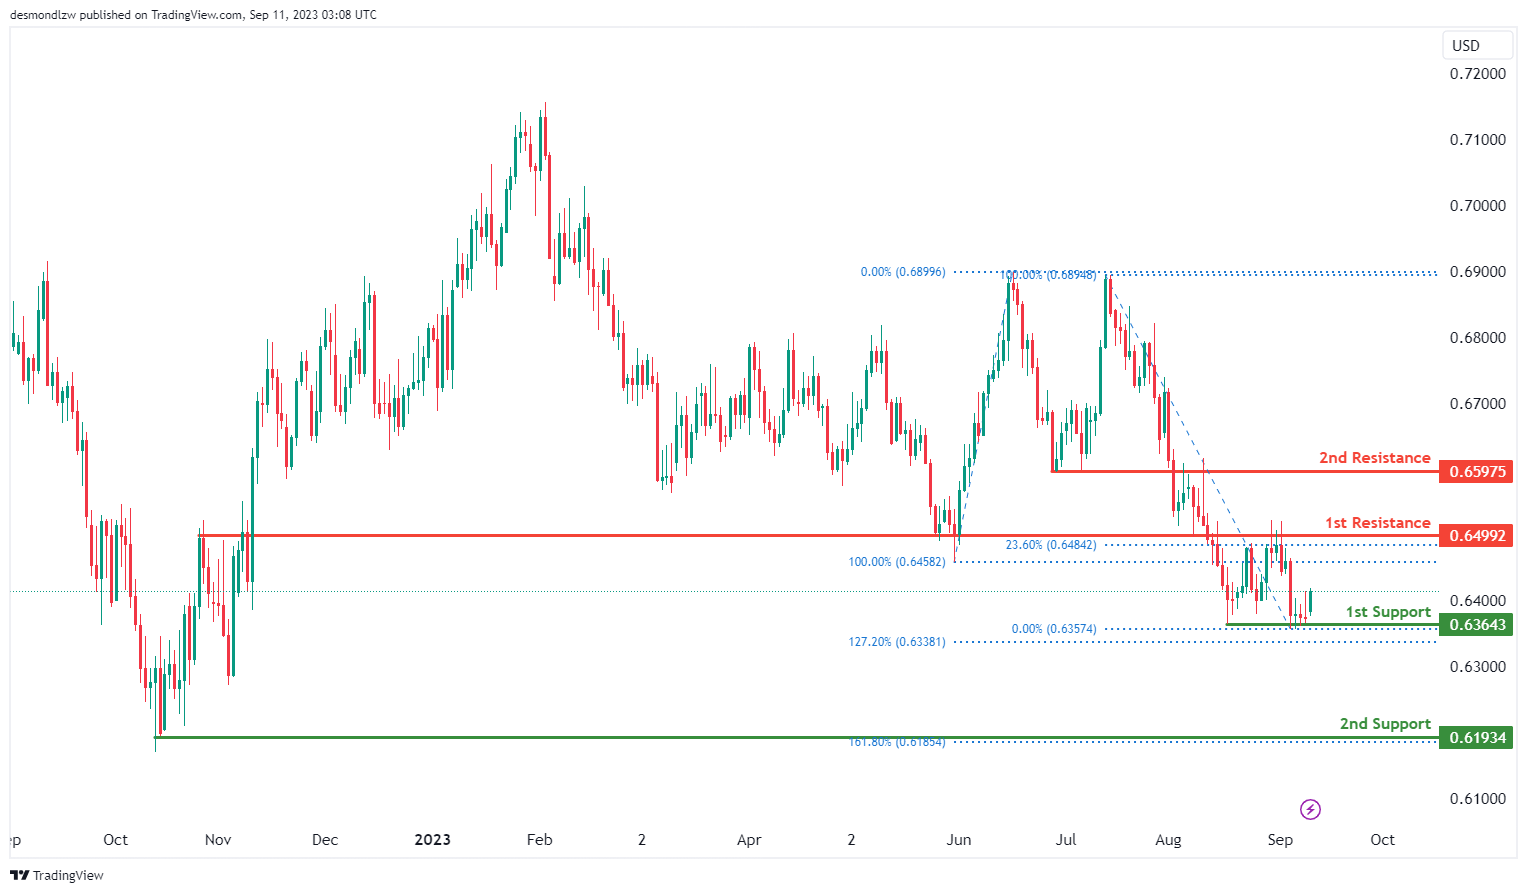
The AUD/USD chart currently exhibits an overall bullish momentum, indicating a potential upward trend in price movement.
There’s a likelihood of a bullish continuation towards the 1st resistance level at 0.6499 which is identified as an overlap resistance that aligns with the 23.60% Fibonacci retracement level. Furthermore, the 2nd resistance level at 0.6598 is also identified as an overlap resistance.
To the downside, the 1st support level at 0.6364 is identified as a pullback support that aligns with the 127.20% Fibonacci extension level while the 2nd support level at 0.6193 is also marked as a pullback support that aligns with the 161.80% Fibonacci extension level, further enhancing its role as a potential support zone.
NZD/USD
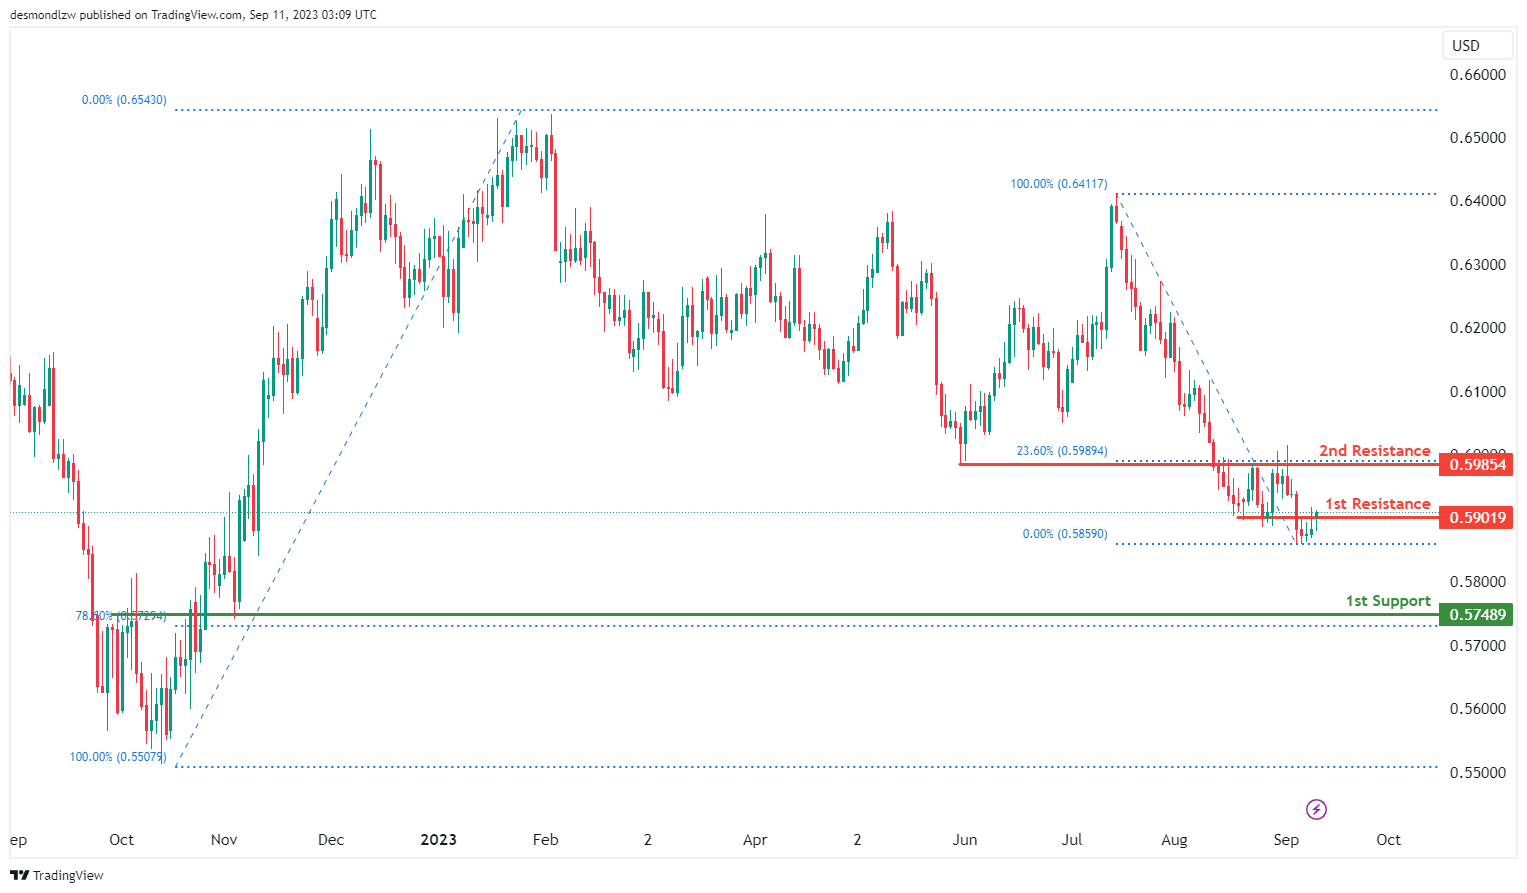
The NZD/USD chart currently demonstrates an overall bullish momentum, suggesting a potential upward trend in price movement.
There is a likelihood of a bullish breakout through the 1st resistance level at 0.5902 which is identified as an overlap resistance. Furthermore, a successful breakthrough of the 1st resistance level could lead to a further rise towards the 2nd resistance level at 0.5985. This level is also marked as an overlap resistance that aligns with the 23.60% Fibonacci retracement level.
To the downside, the 1st support level at 0.5749 is identified as an overlap support that aligns with the 78.60% Fibonacci retracement level, highlighting its significance as a potential area of price support.
DJ30:
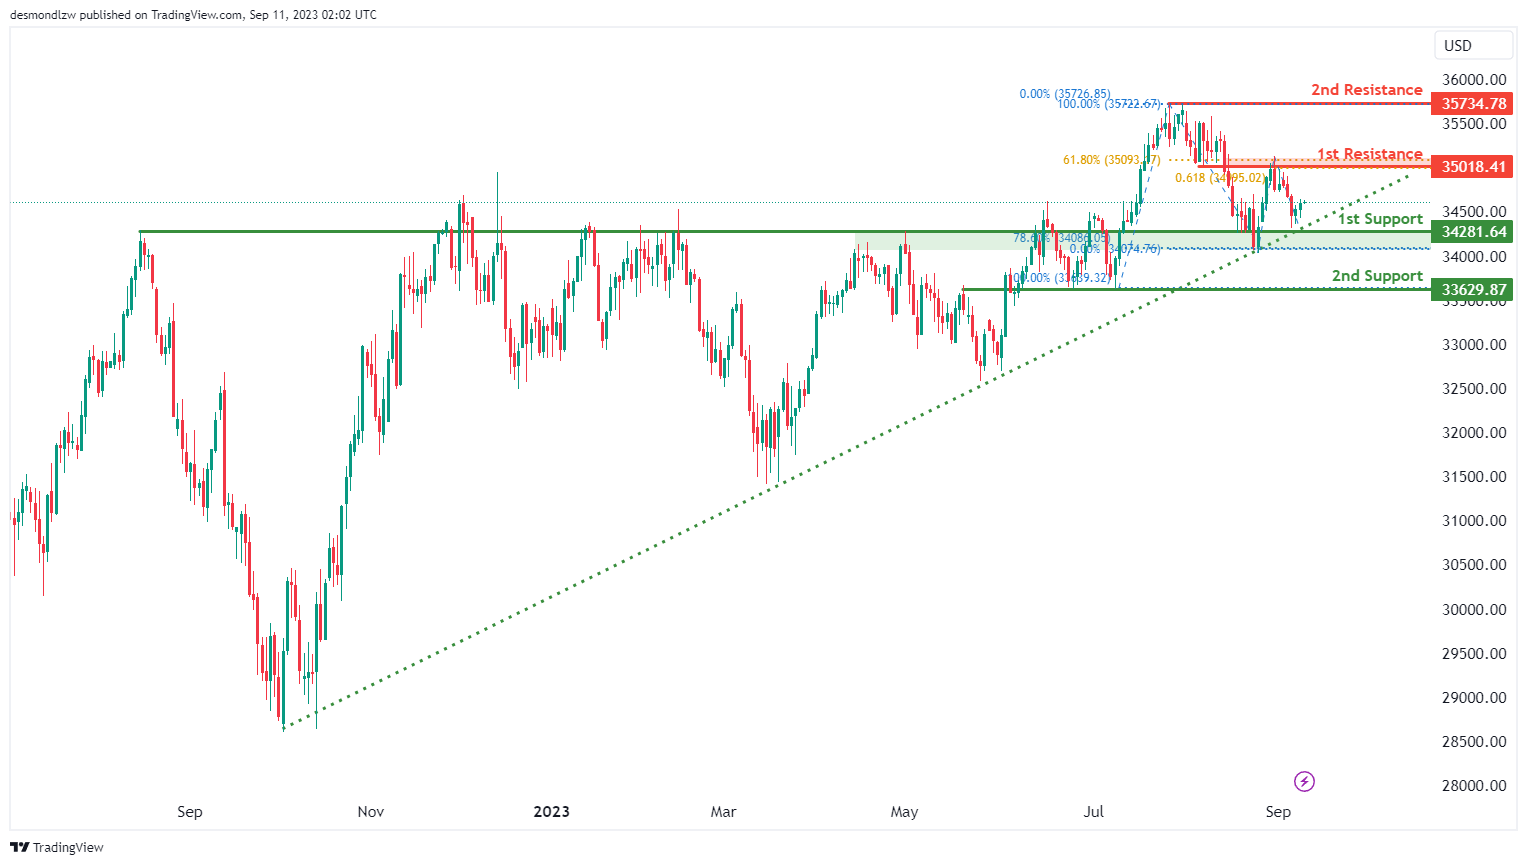
For DJ30, the overall chart momentum is currently bullish, and this bullish sentiment is reinforced by the fact that the price is positioned above a major ascending trend line, which suggests further bullish momentum in the future.
There’s potential for the price to continue its bullish movement towards the 1st resistance level at 35081.41. This 1st resistance is considered significant because it represents an overlap resistance and is supported by both a 61.80% Fibonacci Retracement and a 61.80% Fibonacci Projection, indicating Fibonacci confluence.
In case of a retracement, the 1st support level at 34281.64 is notable due to its characteristics as an overlap support and its alignment with the 78.60% Fibonacci Retracement level. Additionally, the 2nd support at 33629.87 also acts as an overlap support.
If the price continues to rise, it might encounter the 2nd resistance at 35734.78, which is identified as a swing high resistance. This level could pose as a significant obstacle to further upward movement.
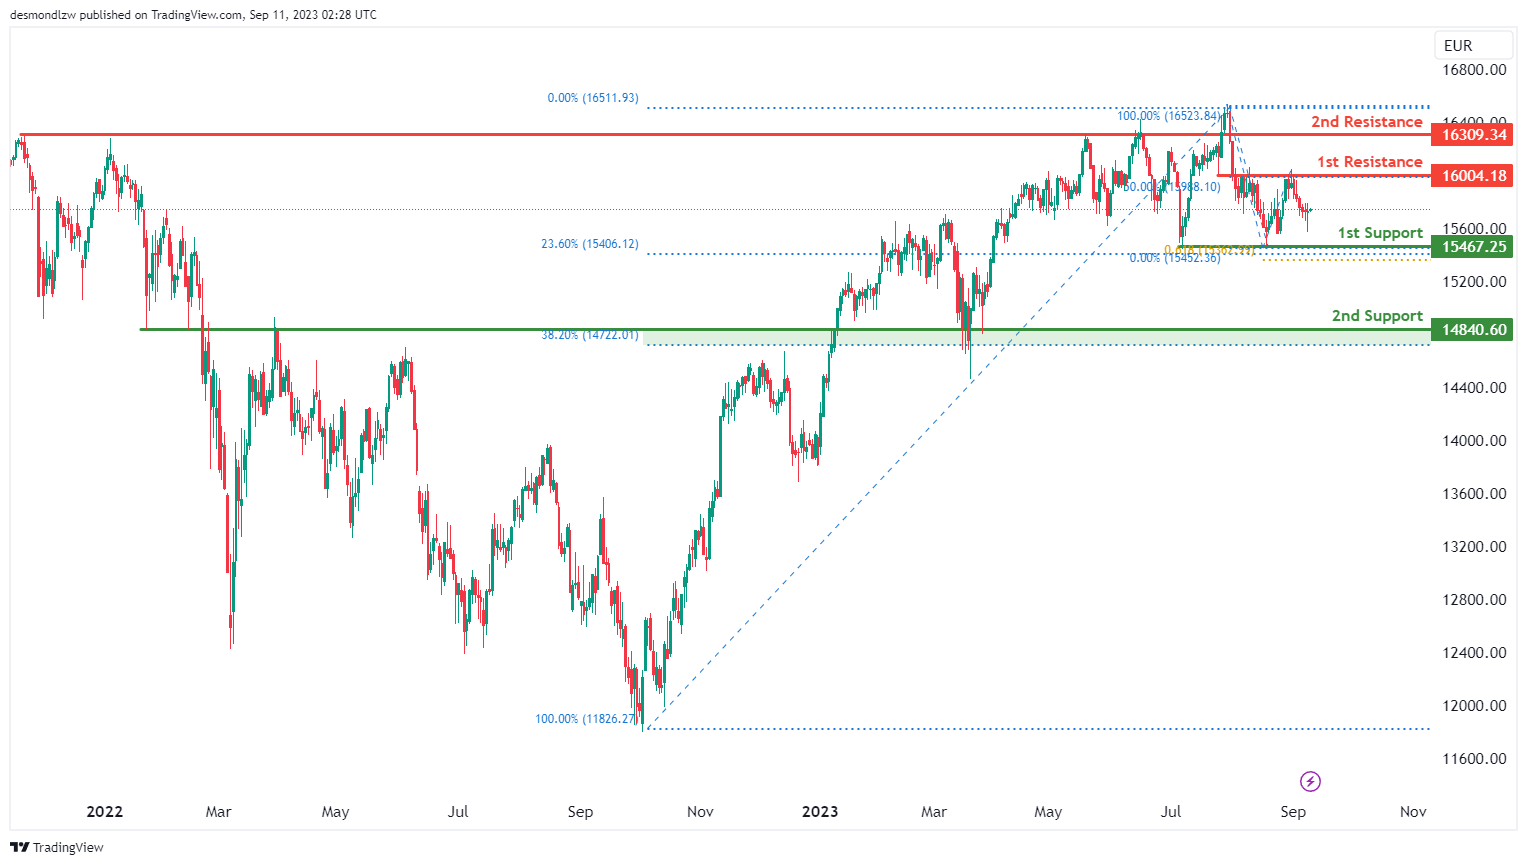
GER30:
For GER30, the overall momentum of the chart is currently bearish, indicating a downward trend.
There is potential for the price to continue its bearish movement towards the 1st support level at 15467.25. This 1st support level is considered significant because it represents multi-swing low support and aligns with both the 23.60% Fibonacci Retracement and the 61.80% Fibonacci Projection. This indicates a Fibonacci confluence, suggesting strong potential support at this level.
In case of a more significant decline, the 2nd support level at 14840.60 is also noteworthy. This support level is characterized as an overlap support and aligns with the 38.20% Fibonacci Retracement, adding further significance to it.
On the upper side, if there’s a reversal in the price, it may face resistance at the 1st resistance level of 16026.10. This 1st resistance is considered significant due to its properties as an overlap resistance and its alignment with the 50% Fibonacci Retracement level.
Further upward movement could encounter resistance at the 2nd resistance level of 16309.34, characterized as a pullback resistance, which may act as a barrier to the bullish momentum within the observed range.
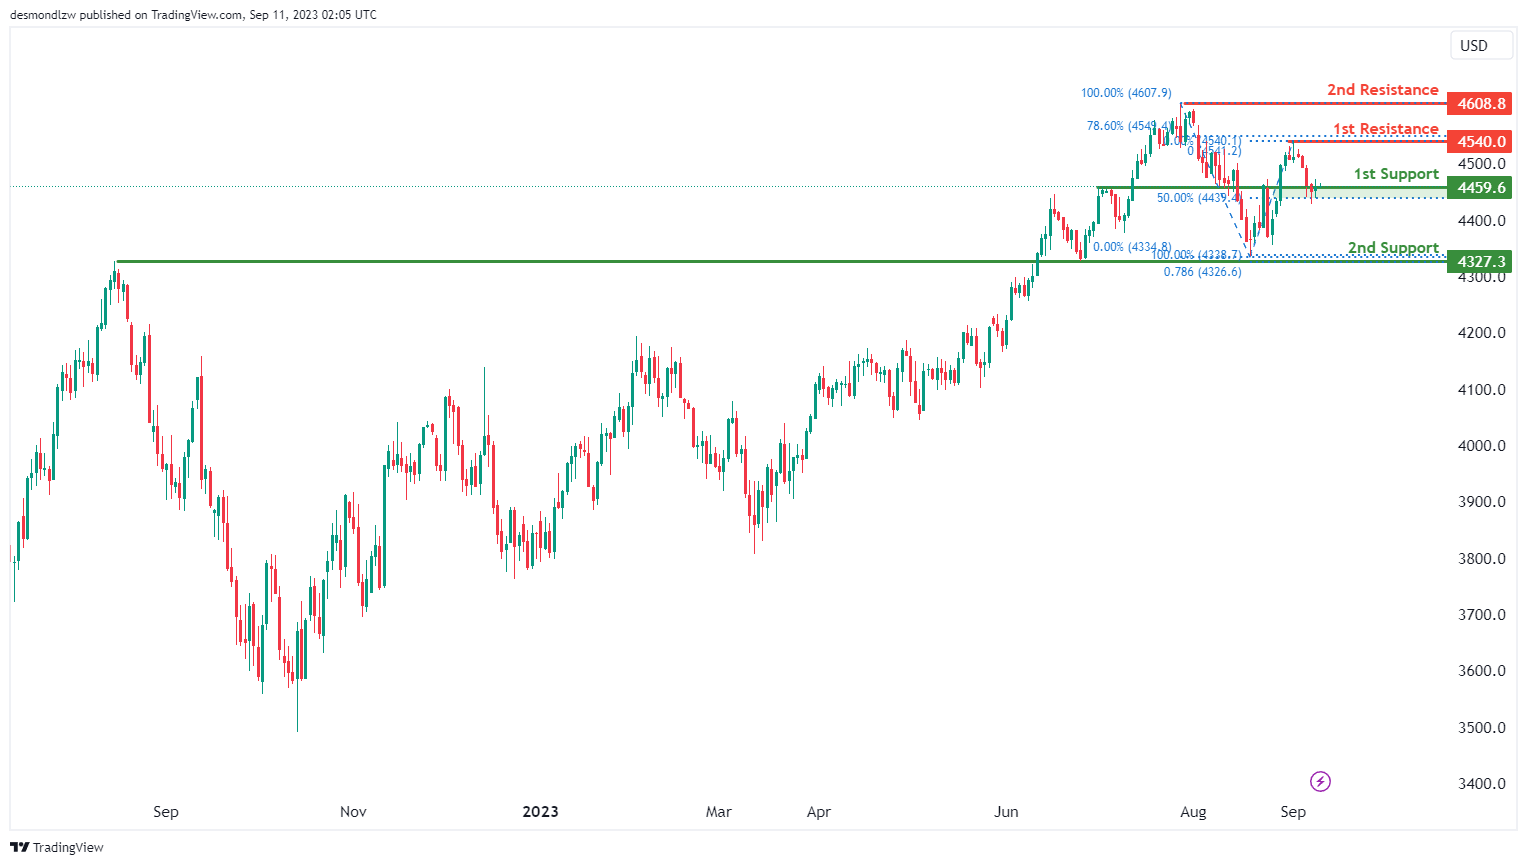
US500
For US500, the overall momentum of the chart is currently bearish, indicating a downward trend.
There is a potential for the price to make a bearish move by breaking below the 1st support level at 4459.6 and then dropping towards the 2nd support at 4327.3. The 1st support at 4459.6 is considered significant because it represents an overlap support and aligns with the 50% Fibonacci Retracement level.
If the bearish momentum continues, the 2nd support at 4327.3 is also noteworthy as it acts as an overlap support and aligns with the 78.60% Fibonacci Projection, providing additional support for this level.
On the other hand, if there’s a reversal in the price, it may face resistance at the 1st resistance level of 4540.0, which is identified as a swing high resistance and is supported by a 38.20% Fibonacci Retracement.
Further upward movement could encounter the 2nd resistance level at 4608.8, which is also characterized as a swing high resistance, potentially acting as a barrier to the bullish momentum.
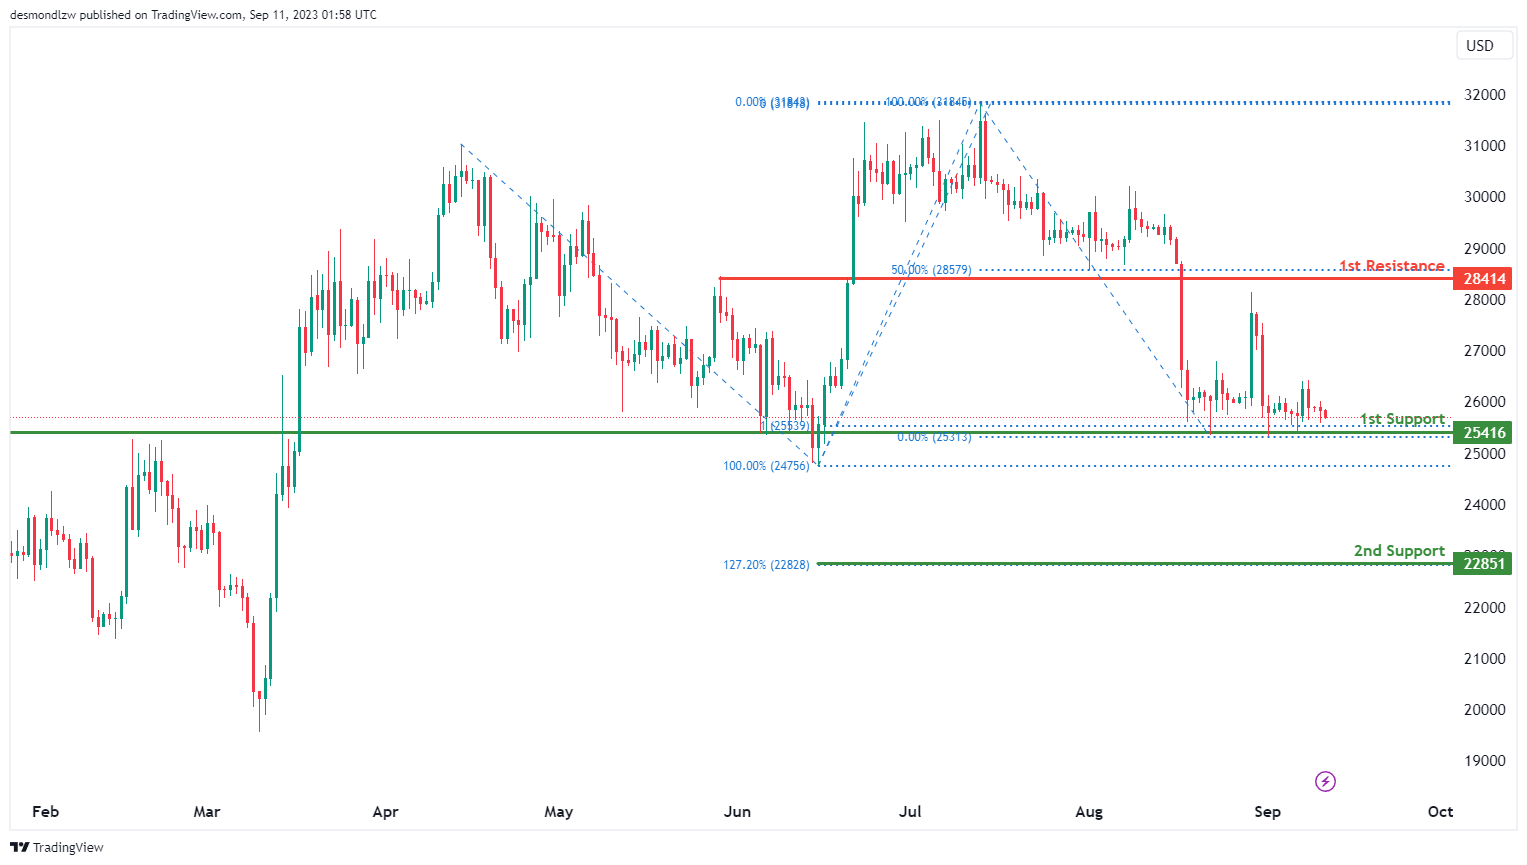
BTC/USD:
For BTC/USD, the overall momentum of the chart is currently bullish, indicating an upward trend.
There is potential for the price to make a bullish move by bouncing off the 1st support level at 25416 and heading towards the 1st resistance at 28414.
The 1st support at 25416 is considered significant because it represents an overlap support and aligns with the 100% Fibonacci Projection, suggesting potential stability at this level.
In case of a more substantial retracement, the 2nd support at 22851 is also noteworthy as it is identified as a 127.20% Fibonacci Extension, which can provide additional support for the price.
On the upper side, the 1st resistance at 28414 is considered important as it represents pullback resistance and aligns with the 50% Fibonacci Retracement, indicating potential resistance to further upward movement.
If the bullish momentum continues, it might face resistance at the 2nd resistance level of 27302, which is characterized as an overlap resistance and may pose a barrier to the bullish trend.
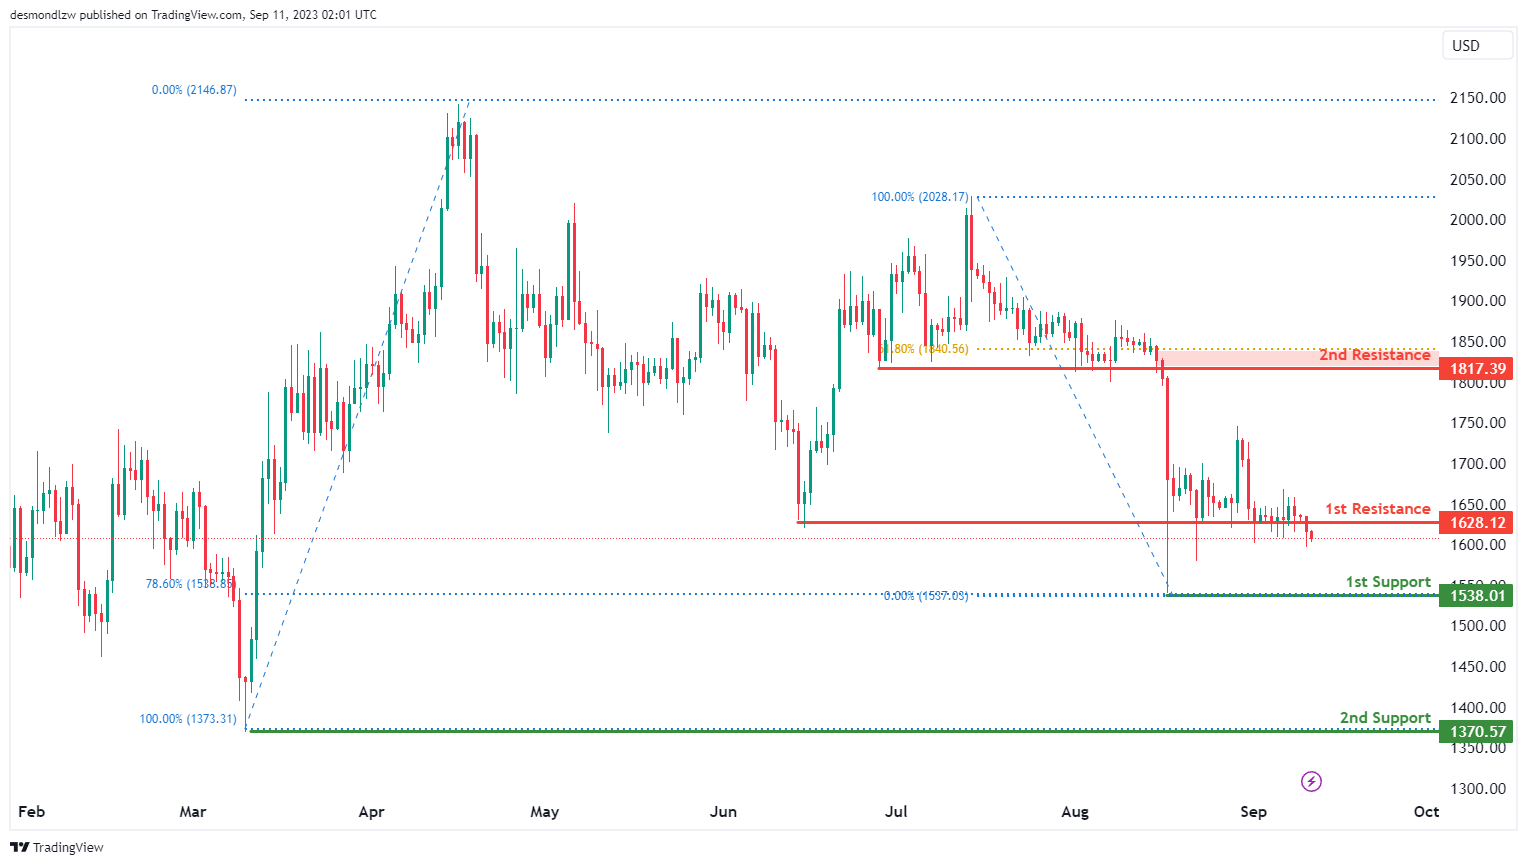
ETH/USD:
For ETH/USD, the overall momentum of the chart is currently bearish, indicating a downward trend.
There is potential for the price to continue in a bearish direction towards the 1st support level at 1538.01. This 1st support is considered significant because it represents a swing low support and aligns with the 78.60% Fibonacci Retracement level, suggesting potential stability at this point.
In case of a more substantial decline, the 2nd support level at 1370.57 is also noteworthy as it acts as a swing low support, offering potential additional support to the price.
On the other hand, if there’s a reversal in the price, it may face resistance at the 1st resistance level of 1628.12, identified as pullback resistance.
Further upward movement could encounter resistance at the 2nd resistance level of 1817.39, characterized as a pullback resistance and coinciding with the 61.80% Fibonacci Retracement level, potentially acting as a barrier to the bullish momentum.
WTI/USD:
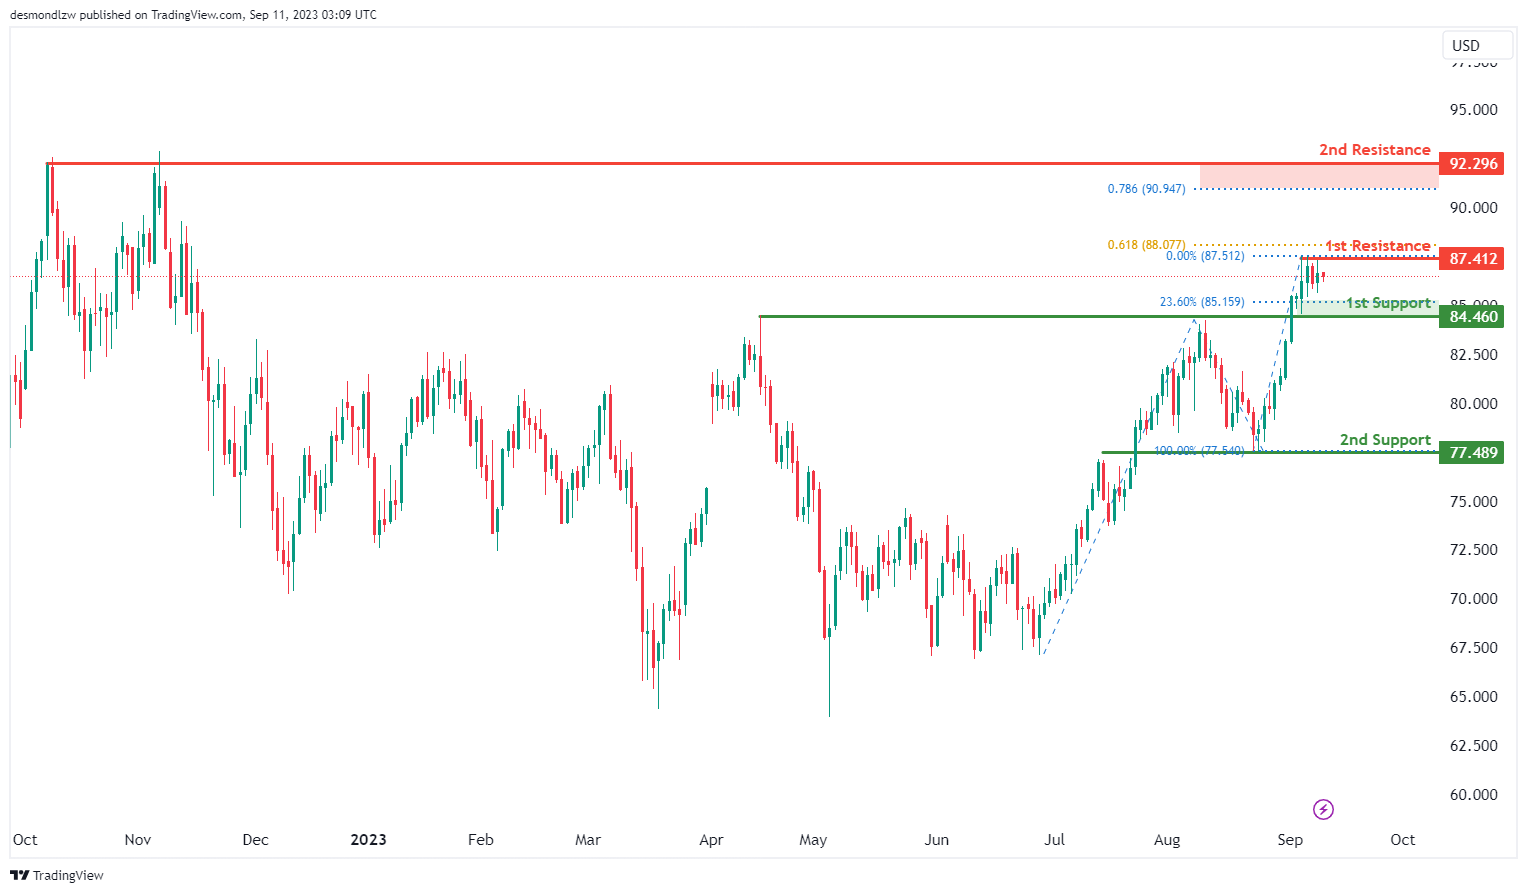
The WTI (West Texas Intermediate) chart currently exhibits a neutral overall momentum, indicating a lack of a clear bullish or bearish trend. Given this neutral momentum, there is a possibility that price could fluctuate between the 1st support and 1st resistance levels.
The 1st support level at 84.46 is identified as a pullback support that aligns with the 23.60% Fibonacci retracement level while the 2nd support level at 77.49 is marked as an overlap support, suggesting historical instances of price finding support around this level.
To the upside, the 1st resistance at 87.41 is identified as a swing-high resistance that aligns with the 61.80% Fibonacci projection level. In addition, the 2nd resistance level at 92.29 is noted as a multiple swing-high resistance that aligns with the 78.60% Fibonacci projection level, further enhancing its potential as a resistance level.
XAU/USD (GOLD):
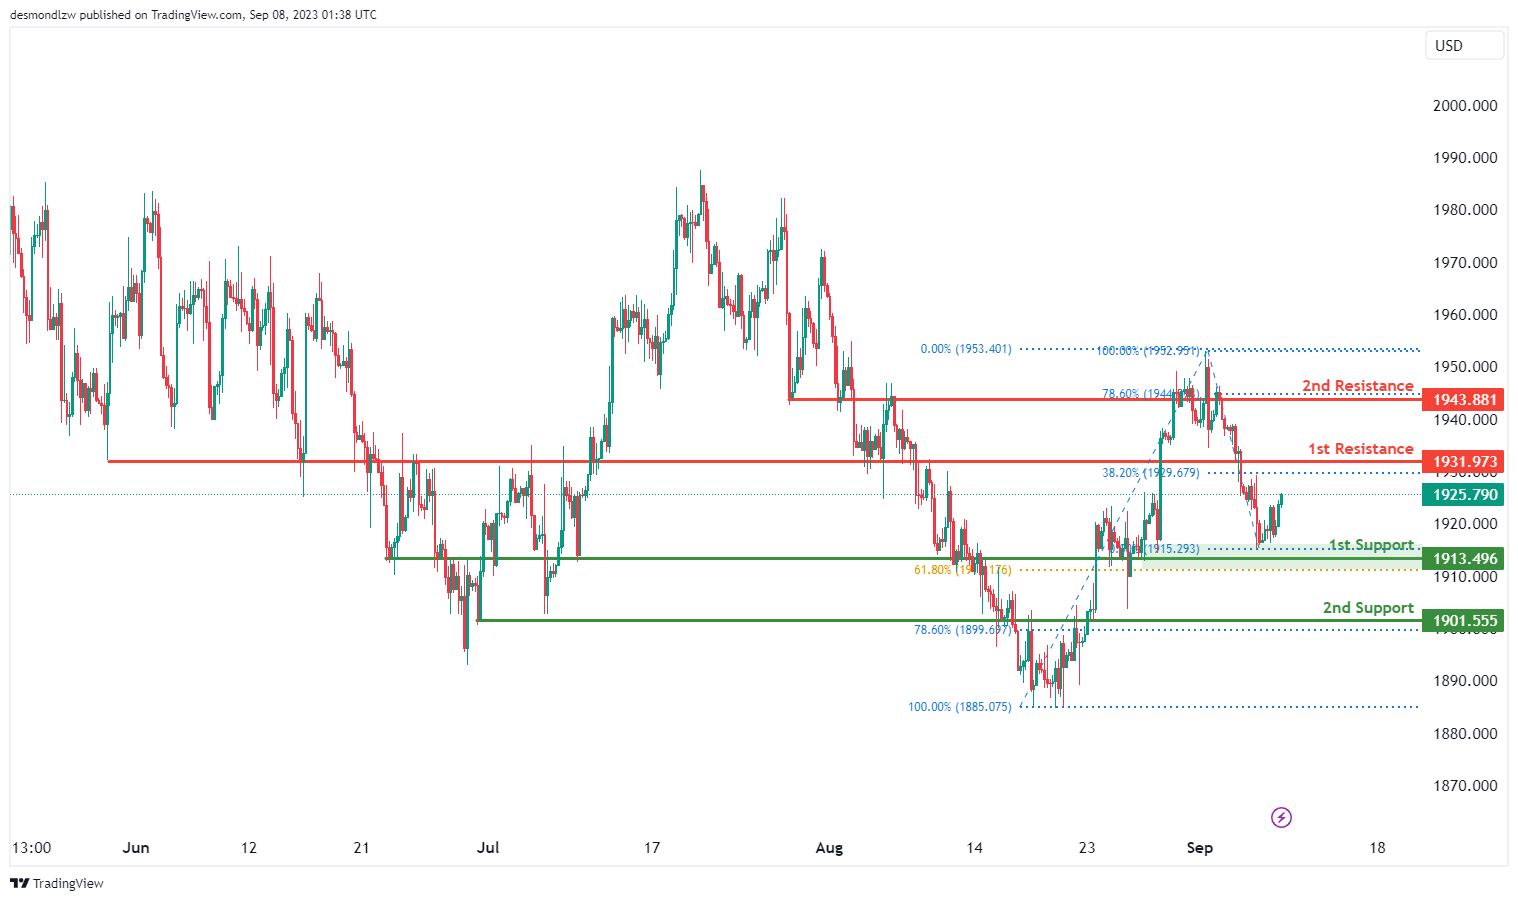
The XAU/USD chart currently exhibits a bearish overall momentum, indicating a potential downward trend in price movement. This is supported by the fact that the price is below a major descending trend line, reinforcing the notion of bearish momentum.
There’s a possibility of a short-term rise in price towards the 1st resistance level at 1945.31 before a potential reversal and a drop towards the 1st support.
The 1st support level at 1906.85 is considered significant as it represents an overlap support and aligns with the 61.80% Fibonacci Retracement level, indicating a strong potential support zone.
Additionally, the 2nd support at 1888.80 is also marked as an overlap support and aligns with the 78.60% Fibonacci Retracement, further reinforcing its potential role as a support level.
On the resistance side, the 1st resistance at 1945.31 is identified as an overlap resistance, potentially acting as a barrier to any bullish movements.
Furthermore, the 2nd resistance level at 1981.69 is noted as an overlap resistance, indicating potential resistance in this area.
EUR/USD Signals Bearish Breakdown, 1.0620 Presents Support
Key Highlights
- EUR/USD started a fresh decline below the 1.0750 support.
- A connecting bearish trend line is forming with resistance near 1.0730 on the 4-hour chart.
- GBP/USD dropped below the key 1.2500 support zone.
- USD/JPY is aiming for a move toward the 148.80 resistance.
EUR/USD Technical Analysis
The Euro faced rejection above the 1.0900 level against the US Dollar. As a result, EUR/USD started a fresh decline below the 1.0850 and 1.0780 levels.
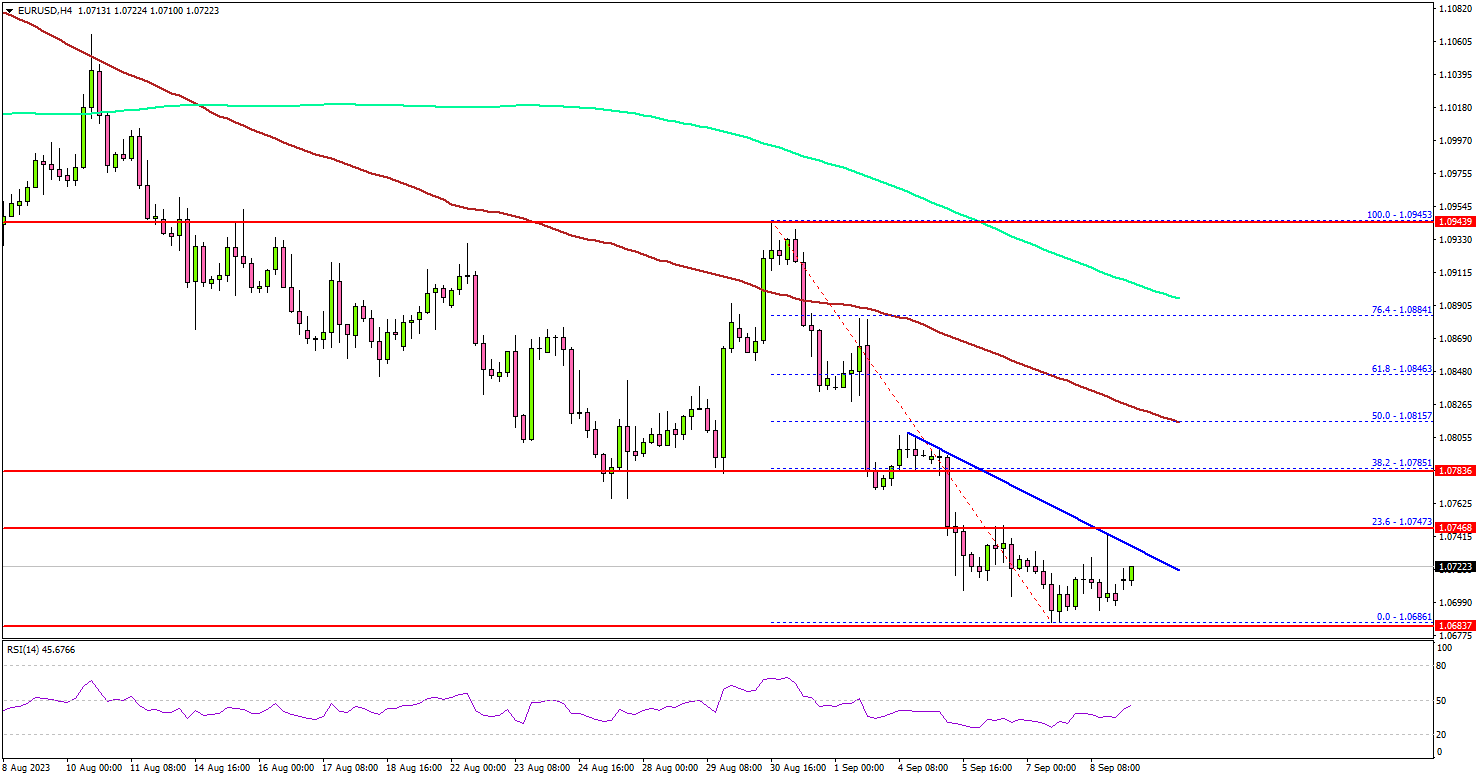
Looking at the 4-hour chart, the pair settled below the 1.0750 support, the 100 simple moving average (red, 4 hours), and the 200 simple moving average (green, 4 hours).
The pair even traded below 1.0700 before the bulls appeared. The pair is now consolidating losses and remains at risk of more downsides. On the downside, immediate support is near 1.0675. The next key support is seen near the 1.0650 level.
The first major support is near 1.0620. If there is a move below 1.0620, the pair could dive toward 1.0550. Any more losses might send the pair toward the 1.0500 level.
On the upside, an initial resistance is near the 1.0725 level. There is also a connecting bearish trend line forming with resistance near 1.0730 on the same chart. The next major resistance is near the 1.0785 level. A close above 1.0785 could start another decent increase.
In the stated case, the pair could rise toward the 1.0850 level. Any more gains could send the pair toward the 1.0950 pivot zone.
Looking at GBP/USD, the pair remained in a bearish zone and there was an extended decline below the 1.2500 support.
Economic Releases
- BoE's Mann speech.