Sample Category Title
AUD/USD Weekly Report
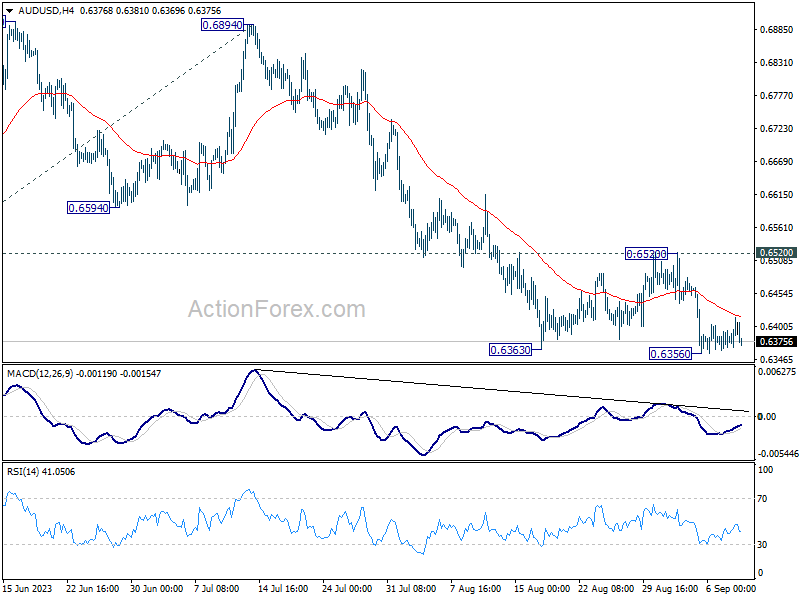
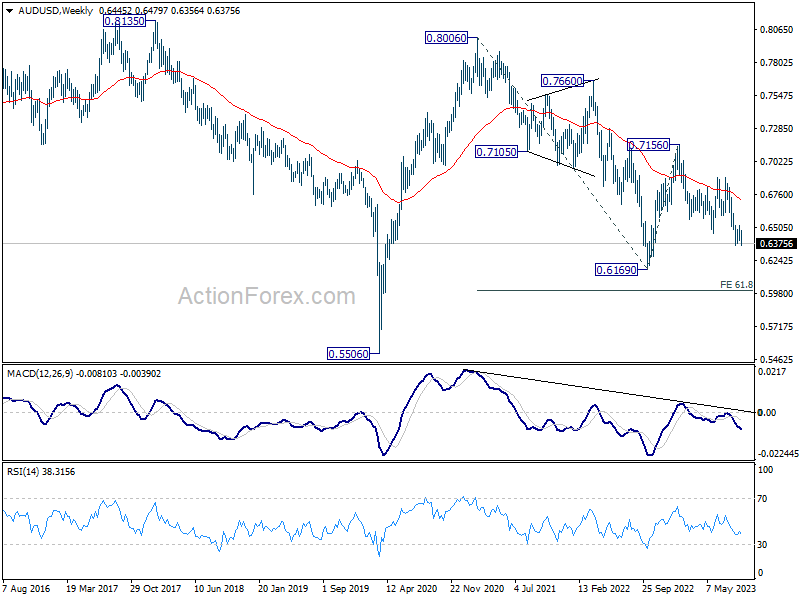
AUD/USD edged lower to 0.6356 last week but turned sideway since then. Initial bias remains neutral this week and some consolidations could still be seen. But recovery should be limited by 0.6520 resistance. Break of 0.6356 will resume larger decline to 100% projection of 0.7156 to 0.6457 from 0.6894 at 0.6195.
In the bigger picture, current development argues that the down trend from 0.8006 (2021 high) is still in progress. Decisive break of 0.6169 will target 61.8% projection of 0.8006 to 0.6169 to 0.7156 at 0.6021. This will now remain the favored case as long as 0.6894, in case of strong rebound.
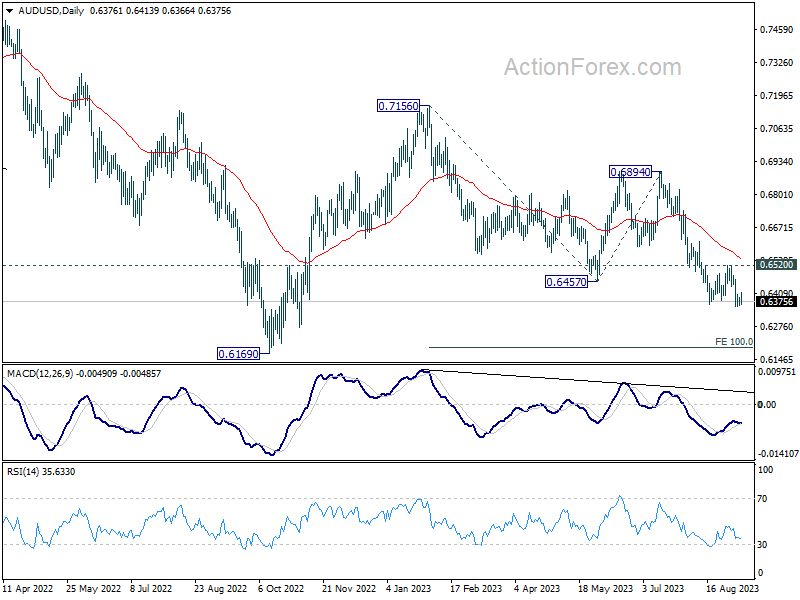
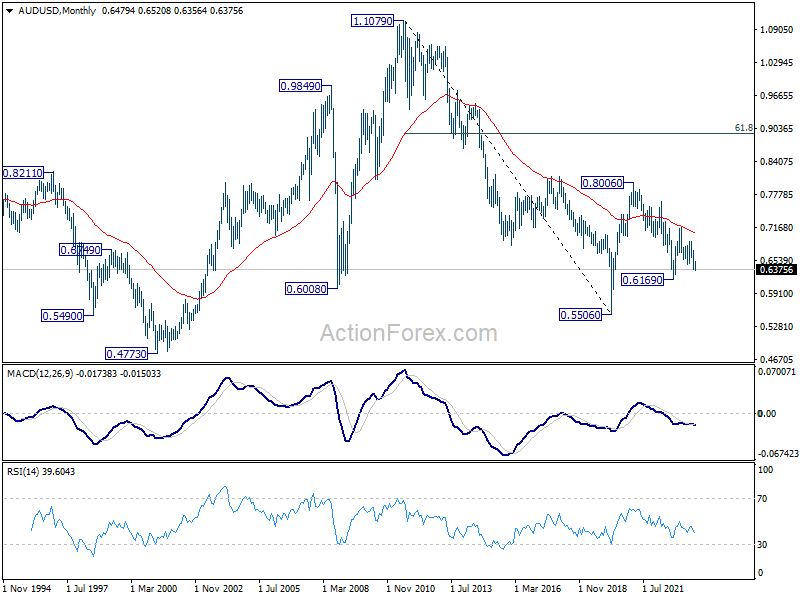
In the long term picture, while fall from 0.8006 might extend lower, the structure argues that it's merely a correction to rise from 0.5506 (2020 low). In case of downside extension, strong support should emerge above 0.5506 to bring reversal. But still, momentum of the next move will be monitored to adjust the assessment.
USD/CAD Weekly Outlook
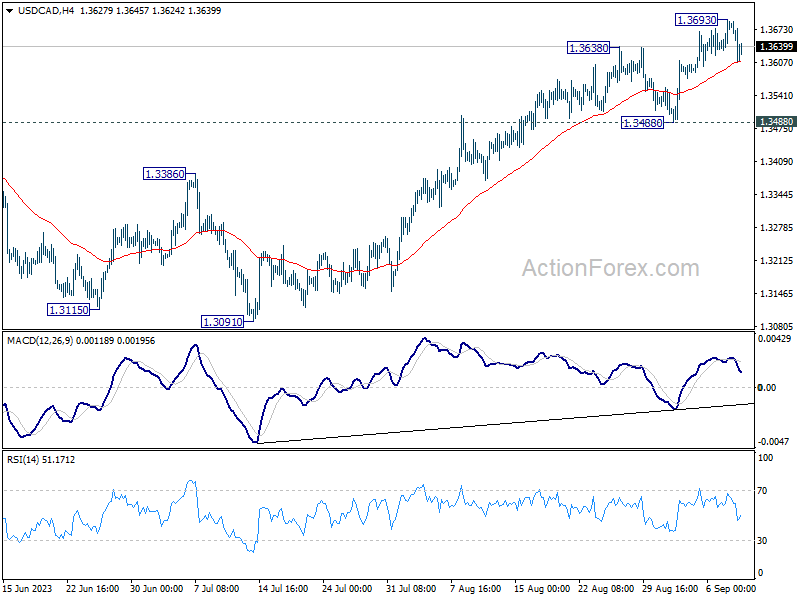
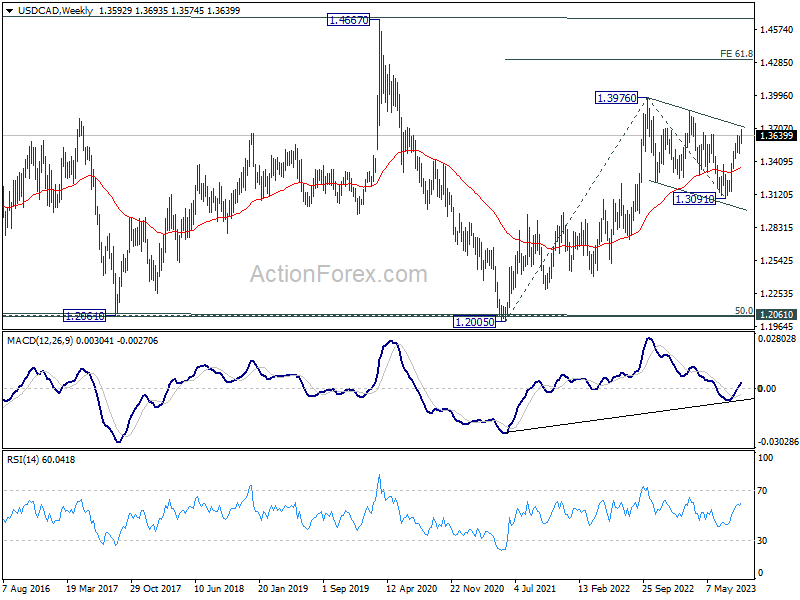
USD/CAD's rally from 1.3091 resumed last week but retreated after hitting 1.3693. Initial bias remains neutral this week for some consolidations first. Outlook is unchanged that correction from 1.3976 has completed at 1.3091. Further rally is expected as long as 1.3488 support holds. Above 1.3693 will resume the rally from 1.3091 to 1.3860 resistance, and then 1.3976 high.
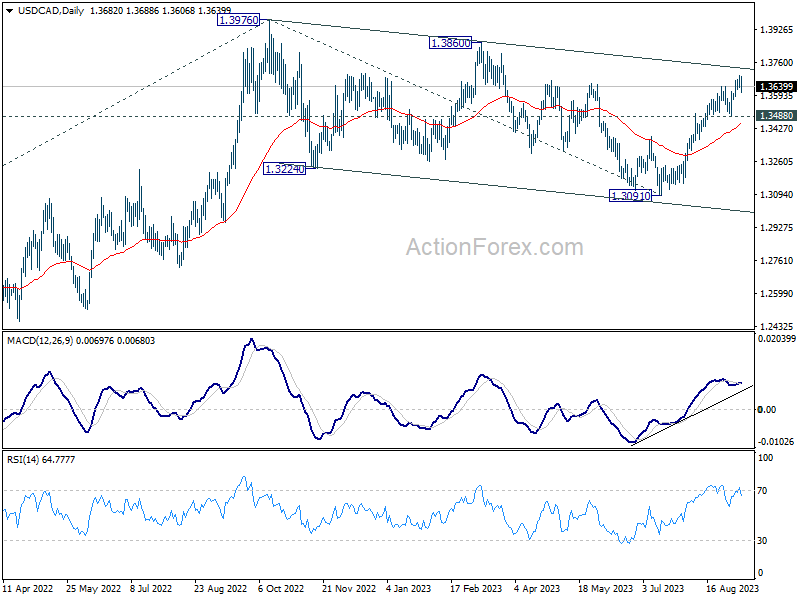
In the bigger picture, price actions from 1.3976 are viewed as a corrective pattern only. Upon completion, rise from 1.2005 (2021 low) would resume through 1.3976. Next target is 61.8% projection of 1.2005 to 1.3976 from 1.3091 at 1.4309. For now, this will remain the favored case as long as 55 D EMA (now at 1.3445) holds.
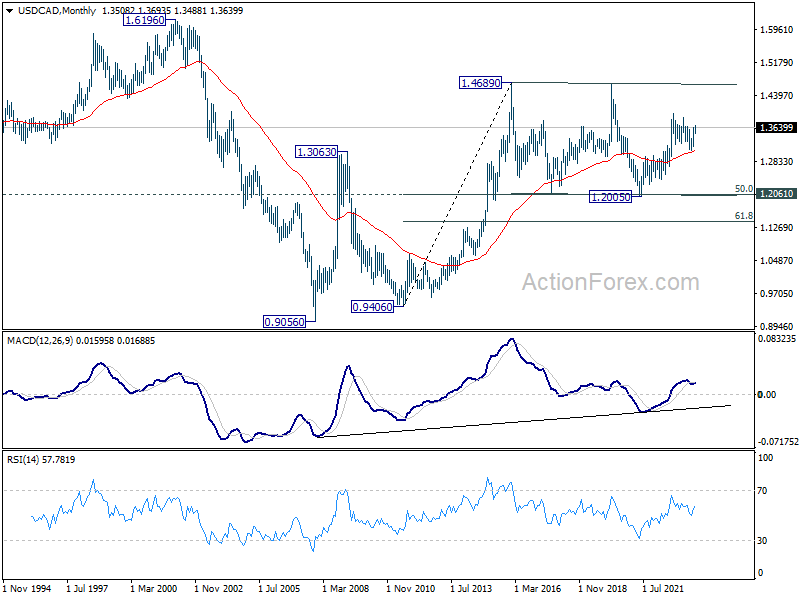
In the longer term picture, price actions from 1.4689 (2016 high) are seen as a consolidation pattern only, which might have completed at 1.2005. That is, up trend from 0.9506 (2007 low) is expected to resume at a later stage. This will remain the favored case as 55 M EMA (now at 1.3082) holds.
GBP/JPY Weekly Outlook
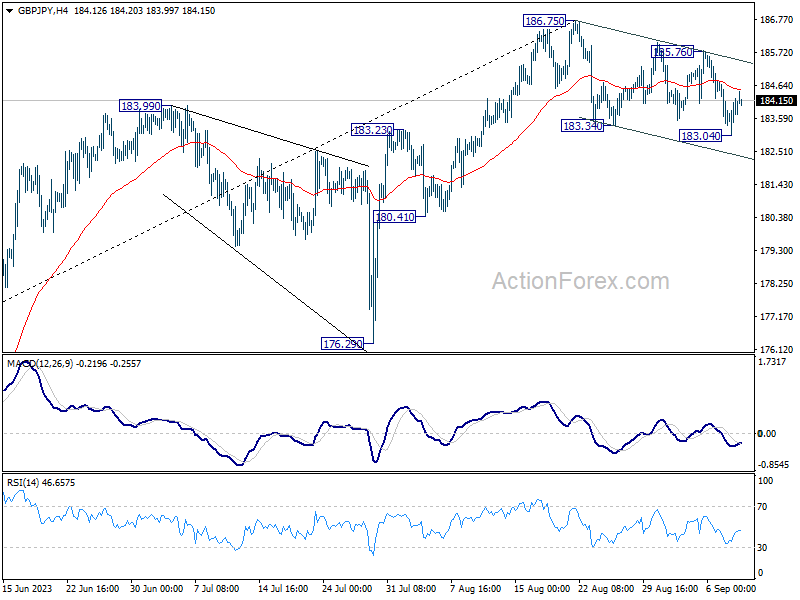
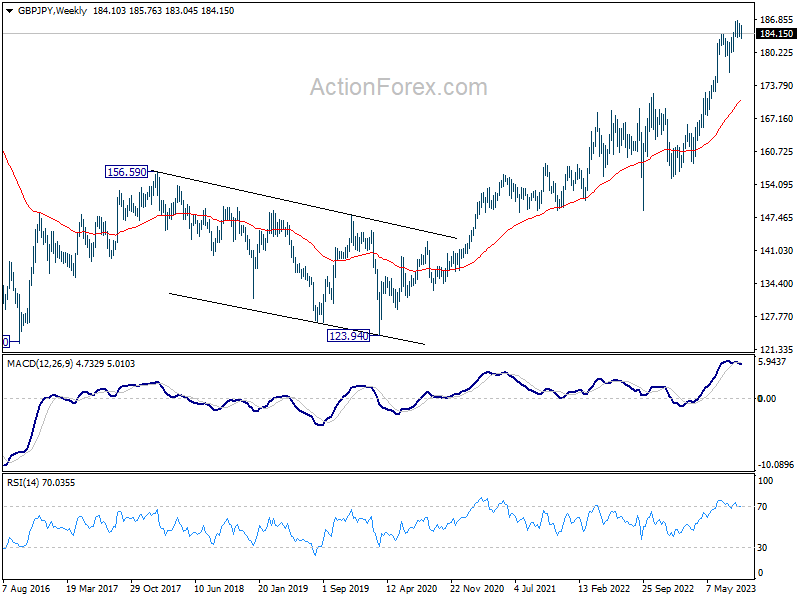
GBP/JPY dipped through 183.34 to 183.04 last week, but quickly recovered. Initial bias is neutral this week first. On the upside, break of 185.67 resistance will argue that the pull back from 186.75 has completed. Further rise should then be seen through 186.75 to resume larger up trend. However, break of 183.04 will resume the decline and target 55 D EMA (now at 182.23).
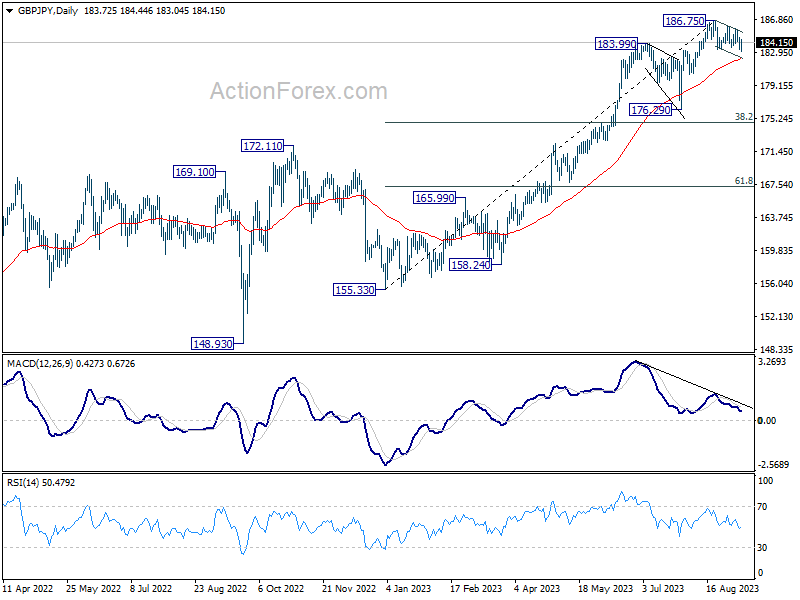
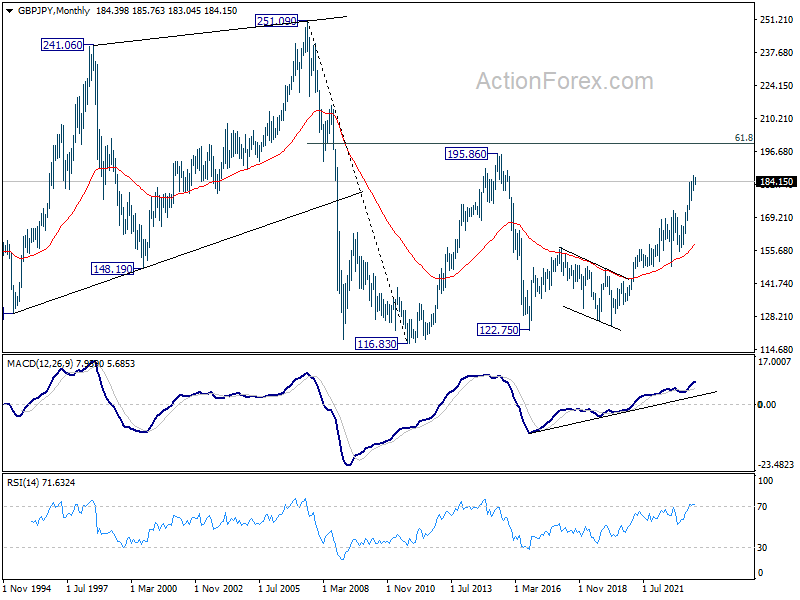
In the bigger picture, up trend from 123.94 (2020 low) is in progress. Next target is 195.86 (2015 high). This will remain the favored case as long as 176.29 support holds, even in case of deeper pull back.
In the longer term picture, rise from 122.75 (2016 low) in still in progress to retest 195.86 (2015 high). Based on current momentum, break of 195.86 is in favor. But strong resistance could still be seen from 61.8% retracement of 251.09 (2007 high) to 116.83 (2011 low) at 199.80 to limit upside on first attempt.
EUR/JPY Weekly Outlook
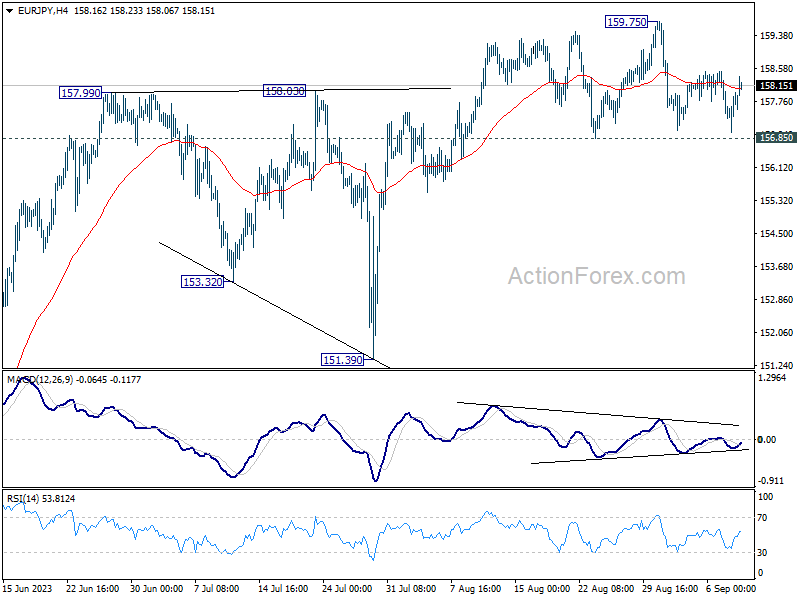
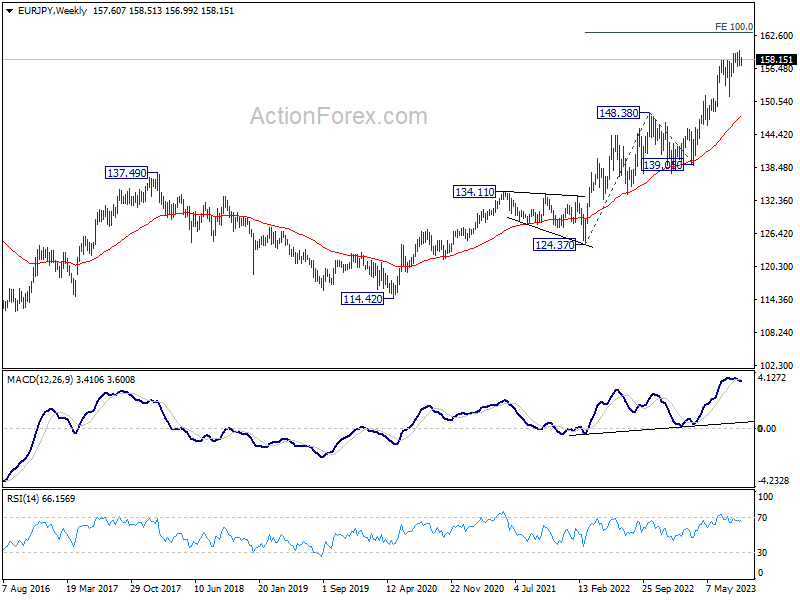
EUR/JPY's pull back was contained by 156.85 support last week. Initial bias stays neutral this week first, and more sideway trading could be seen. On the upside, break of 159.75 will resume larger up trend to 163.06 projection target. However, break of 156.85, and sustained trading below 55 D EMA (now at 156.47) will argue that it's already in a larger scale correction. Deeper fall would then be seen towards 151.39 key support.
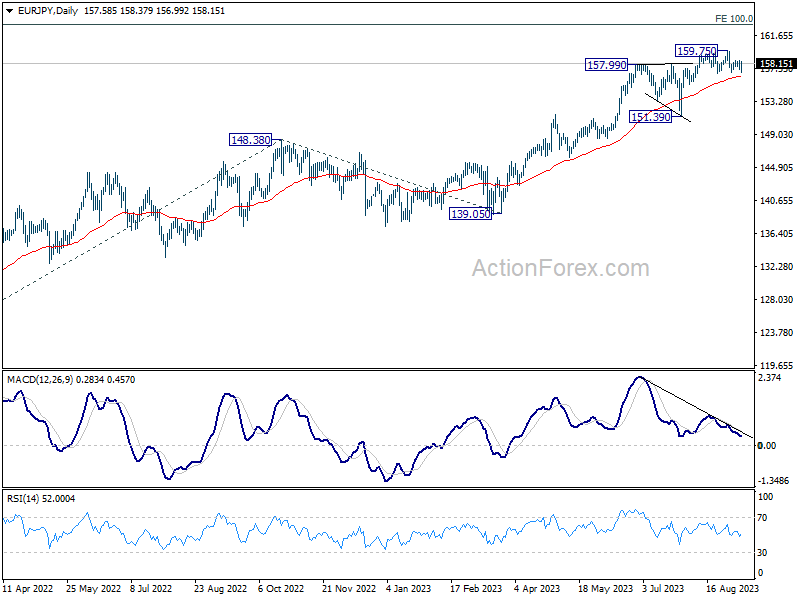
In the bigger picture, rise from 114.42 (2020 low) is in progress. Next target is 100% projection of 124.37 to 148.38 from 139.05 at 163.06. Sustained break there will pave the way to retest long term resistance at 169.96. This will remain the favored case as long as 151.39 support holds, even in case of deep pull back.
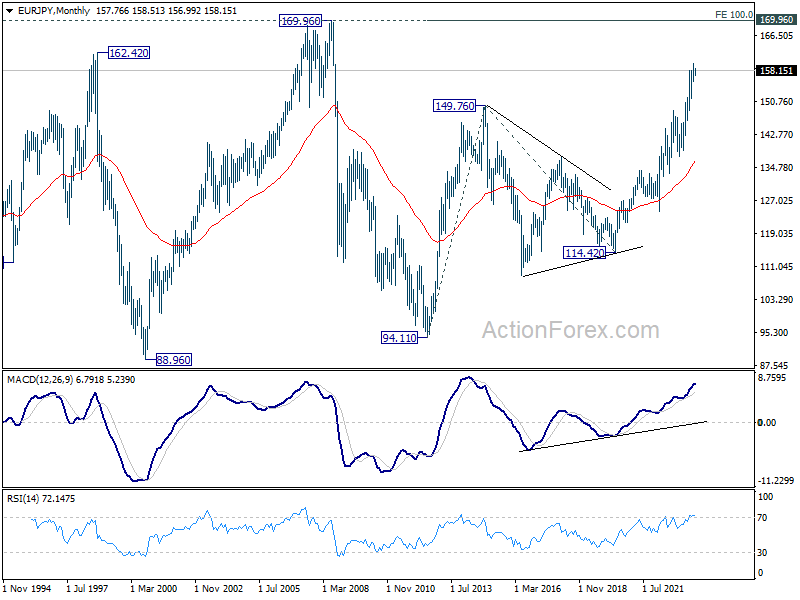
In the long term picture, rise from 109.03 (2016 low) is seen as the third leg of the whole up trend from 94.11 (2012 low). Next target is 100% projection of 94.11 to 149.76 from 114.42 at 170.07 which is close to 169.96 (2008 high).
EUR/GBP Weekly Outlook
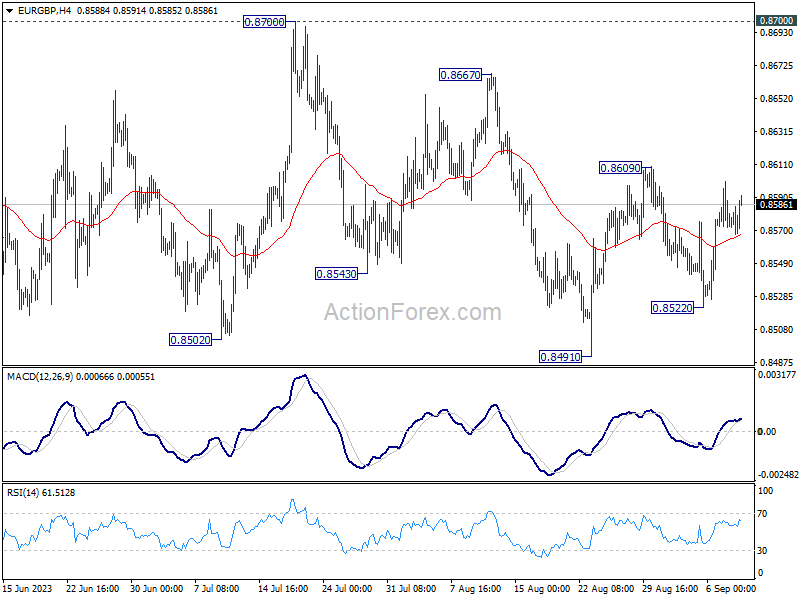
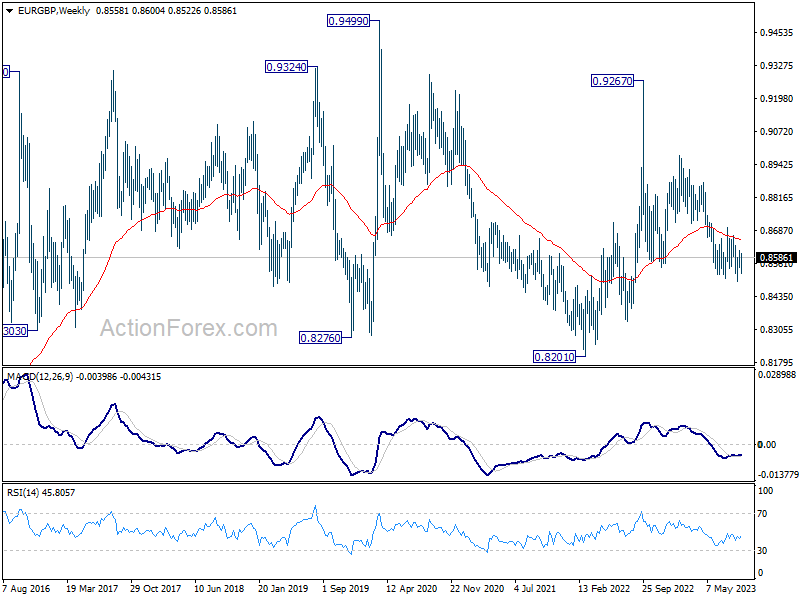
EUR/GBP extended near term range trading last week, and initial bias stays neutral this week first. Recent development argues that rise from 0.8491 could be the third leg of the corrective pattern from 0.8502. On the upside, above 0.8609 would resume the rebound and target 0.8667 resistance, possibly further to 0.8700. On the downside, however, break of 0.8522 will bring retest of 0.8491 low.
In the bigger picture, the down trend from 0.9267 (2022 high) is seen as part of the long term range pattern from 0.9499 (2020 high). Fall from 0.8977 is seen as the third leg. As long as 0.8700 resistance holds, further decline is still expected. Break of 0.8491 will resume the fall towards 0.8201 (2022 low). Nevertheless, firm break of 0.8700 will now be a sign of bullish reversal.
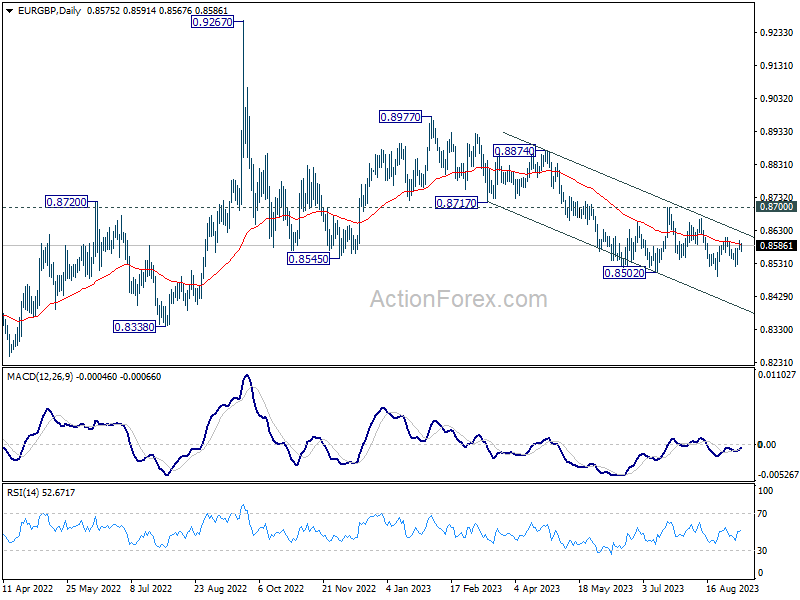
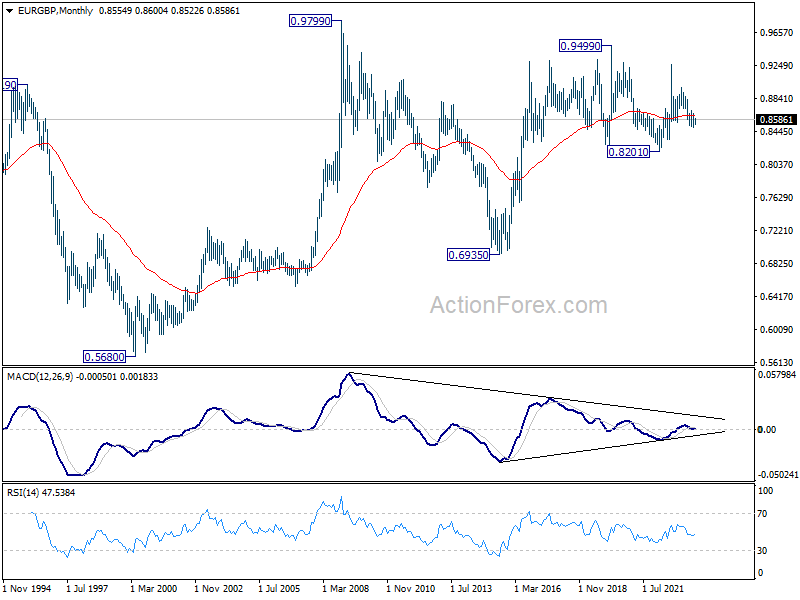
In the long term picture, long term range pattern is extending. But rise from 0.6935 (2015 low) is expected to resume at a later stage, to 0.9799 (2009 high).
EUR/AUD Weekly Outlook
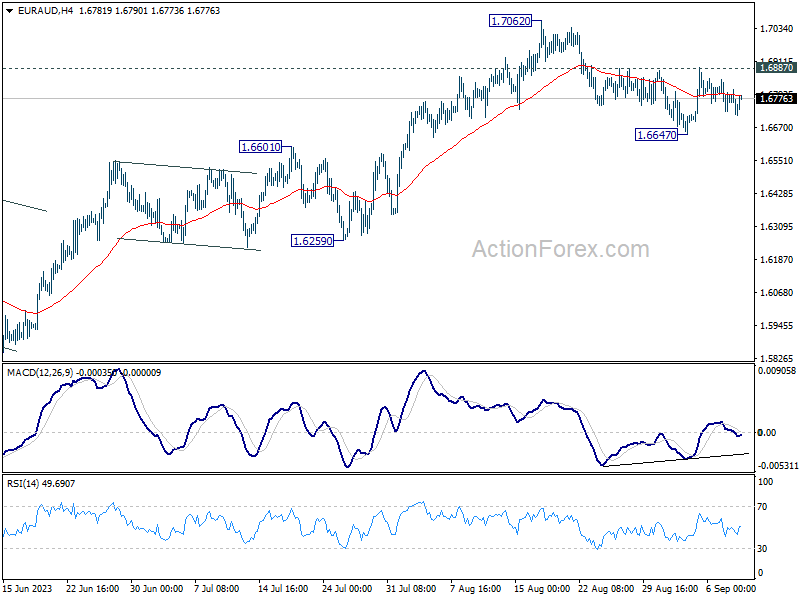
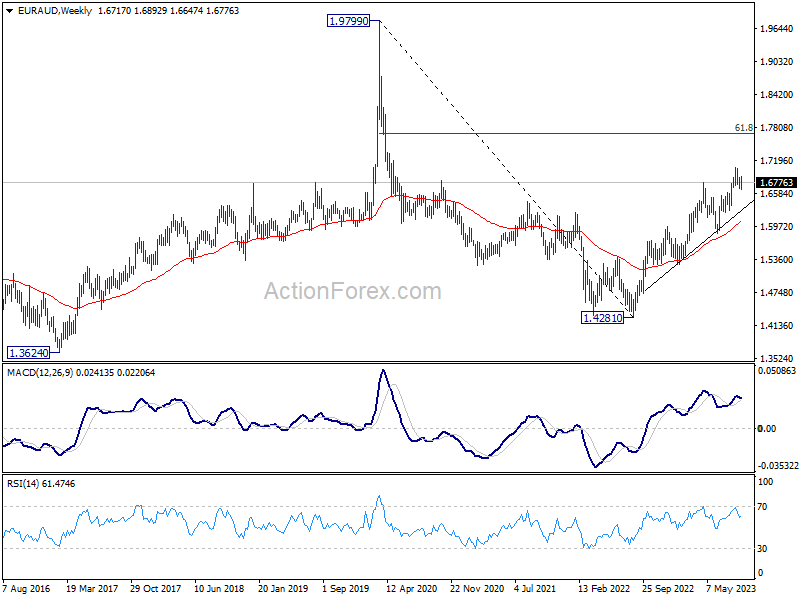
EUR/AUD recovered after dipping to 1.6647 last week, but upside was capped by 1.6887 resistance. Initial bias remains neutral this week first. On the downside, break of 1.6647 will extend the corrective fall from 1.7062 to 1.6259/6601 support zone. On the upside, firm break of 1.6887 resistance should confirm that correction from 1.7062 has completed at 1.6647. Further rally should be seen through 1.7062 to 1.7377 projection level.
In the bigger picture, the rise from 1.4281 (2022 low) is in progress. Next target is 100% projection of 1.5254 to 1.6785 from 1.5846 at 1.7377. For now, outlook will stay bullish as long as 1.5846 support holds, even in case of deep pull back.
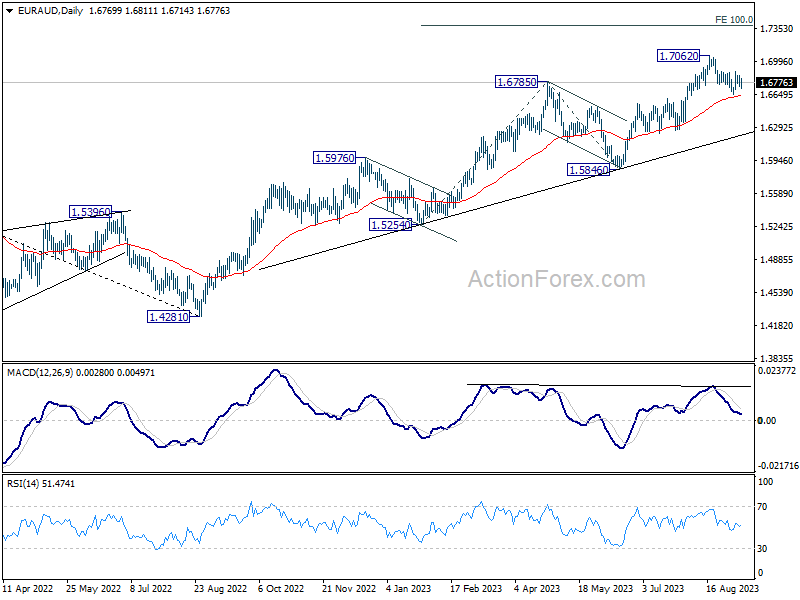
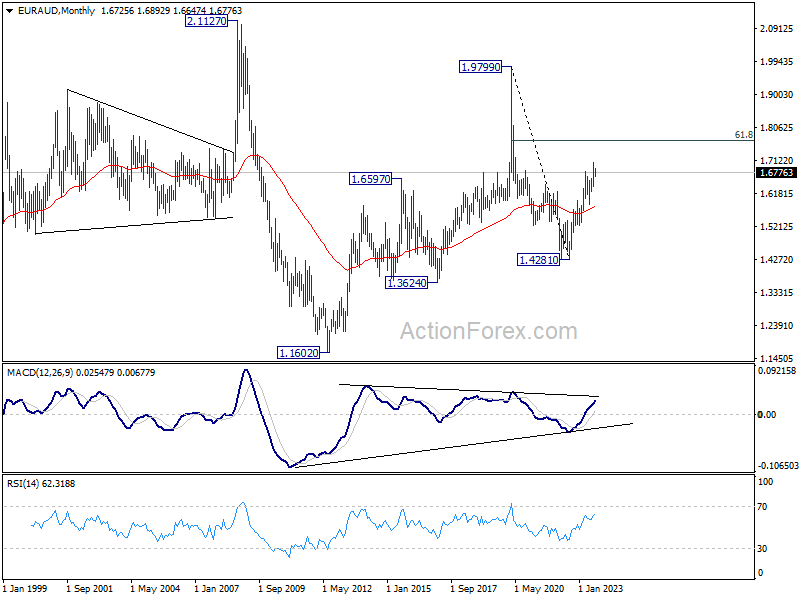
In the longer term picture, it's still early to decide if rise from 1.4281 is resuming whole up trend from 1.1602 (2012 low). But in either case, further rally is in favor as long as 1.5846 support holds. Next target is 61.8% retracement of 1.9799 to 1.4281 at 1.7691.
EUR/CHF Weekly Outlook
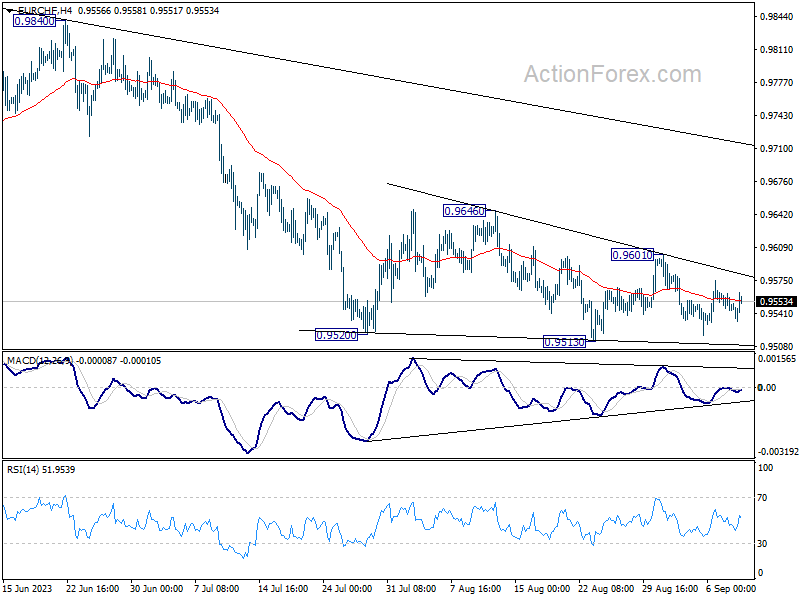
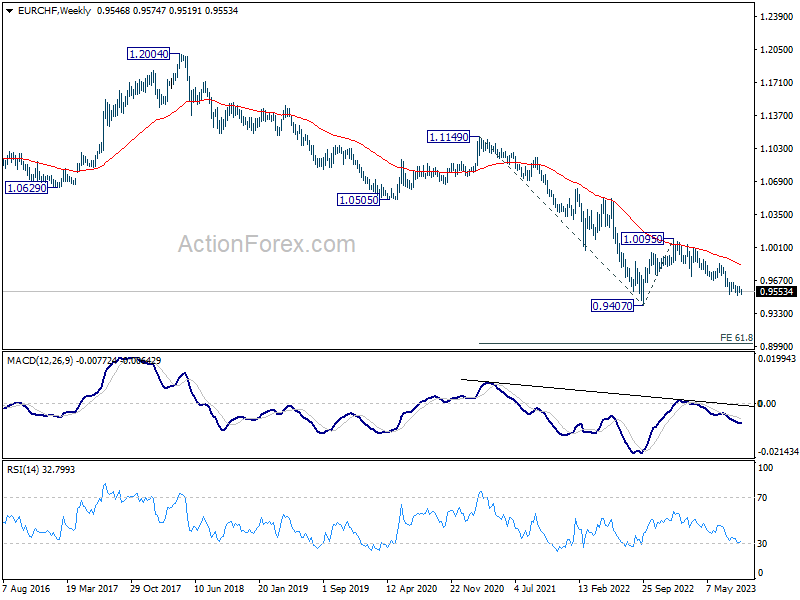
EUR/CHF's sideway trading continued last week and outlook is unchanged. Initial bias remains neutral this week first, and larger down trend is still in favor to continue. On the downside, decisive break of 0.9513 will resume the decline from 1.0095, towards 0.9407 low. However, break of 0.9601 resistance will turn bias back to the upside for stronger rebound to 0.9646 resistance and above.
In the bigger picture, medium term outlook is staying bearish as the cross is capped well below falling 55 W EMA (now at 0.9818). Down trend from 1.2004 (2018 high) is in favor to continue. Sustained break of 0.9407 will target 61.8% projection of 1.1149 to 0.9407 from 1.0095 at 0.9018. For now, this will remain the favored case as long as 0.9670 support turned resistance holds, in case of strong rebound.
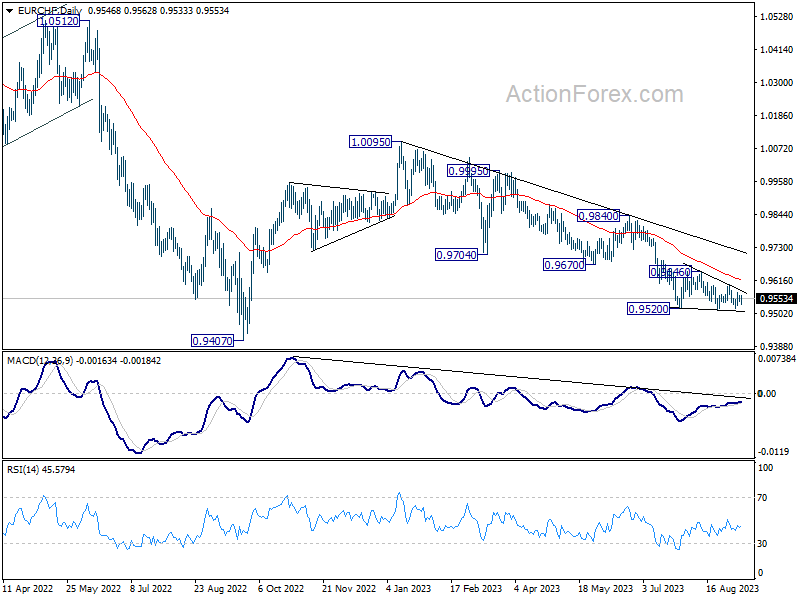
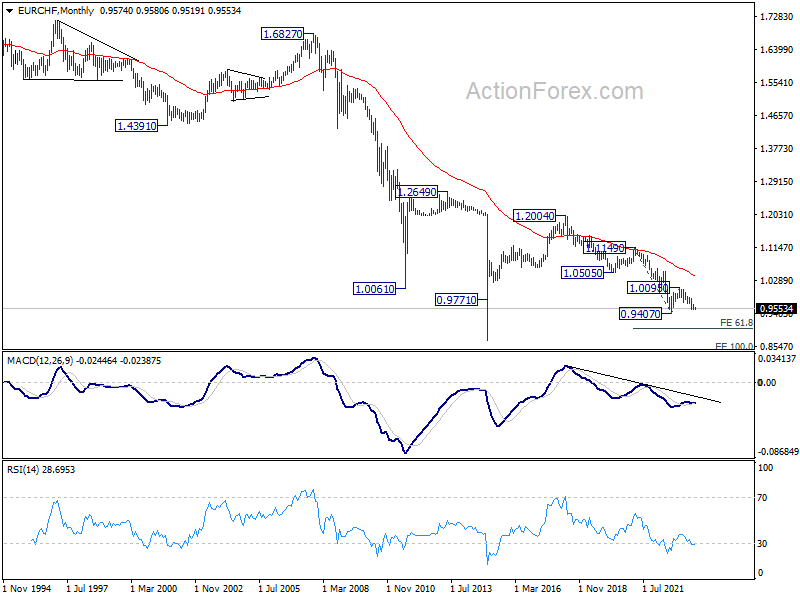
In the long term picture, outlook remains bearish as it's staying well below 55 M EMA (now at 1.0391). Break of 1.00095 resistance is needed to be the first sign of bottoming, or the multi-decade down trend is expected to continue.
Weekly Economic & Financial Commentary: China’s Economic Free Fall Continues
Summary
United States: Service Sector Continues to Support Growth
- During August, the ISM Services Index bested consensus expectations and rose to 54.5, hitting the highest reading since February. The monthly upturn highlights ongoing strength in the service sector and overall resilience of U.S. economic growth despite higher interest rates. An uptick in the prices paid component of ISM services index as well as this week's leg-up in oil prices are reminders of the obstacles ahead to fully tamp down inflation.
- Next week: CPI (Wed), Retail Sales (Thu), Industrial Production (Fri)
International: China's Economic Free Fall Continues
- This week, new data revealed China's economic slowdown is still in effect and a bottom has yet to be reached. China's August Caixin PMI indices showed a more robust deceleration in the services sector than expected. Service sector problems reflect Chinese households' unwillingness to spend and a preference to save, which not even the lifting of Zero-COVID policies has been able to alter.
- Next week: Brazil CPI (Tue), Argentina CPI (Thu), ECB Decision (Thu)
Interest Rate Watch: If the Fed Is Done, How Long Will We Be on Hold?
- Comments this week from N.Y. Fed President Williams suggested monetary policy is in a "good place" and Chicago Fed President Goolsbee said the Fed was "rapidly approaching the time when our argument is not going to be about how high should the rates go." These remarks are tacitly signaling the end of the tightening cycle. If that is indeed the case, we explore how the length of time the Fed stays on hold could be consequential.
Credit Market Insights: Fed's Beige Book Reveals Continued Uncertainty on the Outlook
- This week, the Federal Reserve released its September Beige Book, covering economic conditions across the country for the months of July and August. For the most part, economic growth was steady and generally unchanged from the previous period.
Topic of the Week: US Open Highlights Consumers' Hunger for Experiences
- Tennis fans have been converging on Queens, New York to catch the U.S. Open. Resale prices for tickets are higher than ever, but consumers appear more willing to pay up to witness this event.
The Weekly Bottom Line: Higher for Longer Seems Surer
U.S. Highlights
- Hard economic data was thin on the ground over the Labor Day shortened week, with survey indicators and Fed speakers grabbing attention.
- A slew of Federal Reserve speakers hint that the central bank may skip a rate hike at the next meeting, as the Beige Book (the Fed’s survey of economic conditions) suggests that the economy closed out the summer on a modest note.
- Oil markets were also on the move, after Saudi & Russian supply cuts were extended. Higher energy prices are a challenge to the needed cooling in inflation.
Canadian Highlights
- As widely anticipated, the BoC remained on hold, keeping the overnight lending rate at 5% while keeping the door open for another hike.
- The labour market moved towards greater balance in August with job gains not keeping pace with population growth, although wage growth remains too strong.
- The Bank of Canada needs to see more softness in the labour market to put a permanent end to this tightening cycle. We expect this to manifest more clearly by the October decision.
U.S. – Higher for Longer Seems Surer
Hard economic data was thin on the ground over the Labor Day shortened week, with survey indicators and Fed speakers the main highlights on the calendar. Crude oil markets were also a bit livelier after Saudi Arabia and Russia both announced extensions to their supply cuts through to the end of the year.
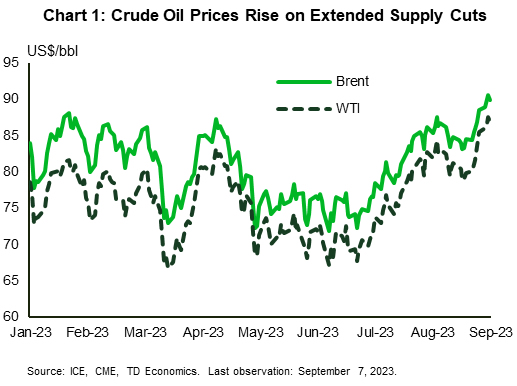
Since July, Saudi Arabia has voluntary removed 1 million barrels per day (b/d) of crude from global oil markets. While the measure was cited to be temporary, it was already extended to September, with this week’s announcement extending it once again. Russia added their own export reduction of 300,000 b/d. On the day of the announcement, Brent crude, the international benchmark, rose 1.2% to close at $90.04 – exceeding $90 a barrel for the first time this year (Chart 1). Prices have since given back some of the gain, but the general move higher in oil prices over the past few weeks is likely to threaten efforts to tame inflation.
On that front, this week featured a full roster of Fed speakers. Governor Waller was also in the news making more dovish than usual statements. He noted that data showing a cooling job market meant the Fed should “proceed carefully”, and does not necessitate an imminent rate hike. Bostic echoed these sentiments. Logan noted that it could be appropriate’ to skip an interest-rate increase in September. Williams left whether the Fed would hike again as an open question, while Goolsbee, hinting at a higher for longer stance, sees a “golden opportunity” for the Fed to tame inflation without triggering a recession. All speakers emphasized that the Fed will be paying close attention to the data.
The Fed’s latest survey of economic conditions, the Beige Book, noted that the U.S. economy grew at a modest pace during July and August, relative to slight growth in the previous report. This was bolstered by a final bout of pent-up demand for leisure activities. Outside of leisure travel and a rise in auto sales due to better inventory, nonessential retail sales slowed. Job growth was generally subdued nationwide with wage growth elevated but expected to moderate in the months ahead. Prices for consumer goods fell faster than in many other categories. Demand for manufactured goods waned while the supply constrained single-family housing market continued to be challenged by higher financing costs and rising insurance premiums.
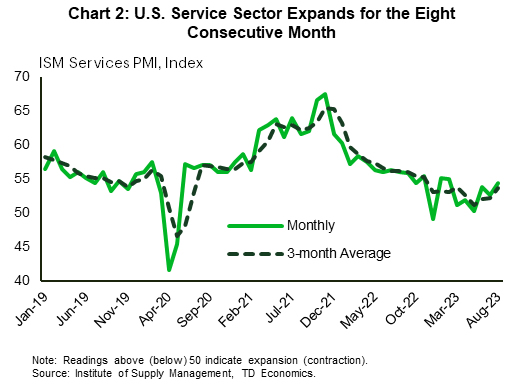
The ISM services index surprised to the upside this week, reaching a six-month high of 54.5 in August (Chart 2). The survey continued to highlight a service sector that is still in expansion mode, with survey respondents expressing positive sentiments about business and economic conditions. Beneath the headline, the positive details were an increase in business activity (+0.2 pts), new orders (+2.5 pts), and employment (+4.0 pts).
The tone of the economic news this week is likely to keep policymakers in a wait and see mode. Consumers are keeping the service sector humming along, even as the labor market cools. All good news for the Fed, but higher energy prices remain a wildcard that will require close monitoring so as not to undo the progress on inflation thus far.
Canada – Finding a Balance
There was no surprise in the Bank of Canada's announcement this Wednesday. As widely anticipated, the benchmark overnight lending rate remained at 5%. In the wake of the decision, the market implied policy rate moved lower by roughly 10 basis points over the week. This shift put more pressure on Canadian dollar. When measured in U.S. currency, the loonie got cheaper by almost one cent. The loonie is down nearly three cents since the BoC's July interest rate announcement.
This was the second pause in this tightening cycle, but this time, the BoC did not characterize it as such. The tone of the message remained hawkish, with Governor Macklem reiterating his loud promise "to take further action", if needed. Indeed, the first time the Bank went on hold earlier in the year markets resolved that rate cuts won't be too long in coming. This helped ease financial conditions enough to reinvigorate the housing market and consumer spending in the first quarter.
Fifty basis points of hikes later, the risk of overtightening is higher as weakness in economic activity is more convincing. Recent readings of GDP, retail trade and home sales provide compelling evidence that demand is moderating. Nonetheless, the labour market continues to give mixed signals. August's headline employment gain at 40K new jobs was twice as high as expected by the consensus, but the pace of employment growth is lower than population growth, leading to a slight rise in the unemployment rate – at least at the second decimal place.
Meanwhile, headline wage growth eased slightly in August (on a year-on -year basis). The three-month annualized average change in wages did pick up, but still points to a cooler pace of wage gains in the months ahead (Chart 1). Overall, the pace remains too strong for broad inflation to move to its target. Additionally, when coupled with a decline in productivity, high wage growth means unit labour costs are rising for businesses. In a strong demand environment, businesses may pass this onto consumers, keeping inflation up, or they may cut costs by reducing investment or shedding workers.
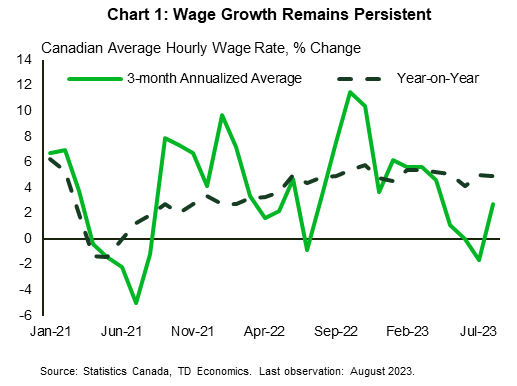
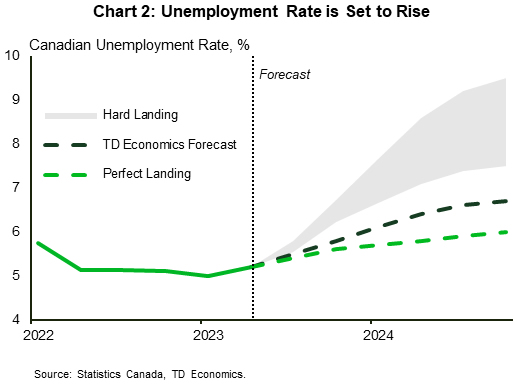
Persistent wage pressure remains the most unfading signal of an unbalanced labour market. Still, we expect it to move to a lower trajectory as employees' ability to negotiate a pay raise diminishes as job vacancies become scant. As outlined in our recent report, the job market has reached an inflection point, setting a path for the unemployment rate to rise to 6.7% over the next year, slightly overshooting the level required to balance the market (Chart 2).
All told, while the market odds of another rate hike are lower, the Bank of Canada will need to see more softness the labour market and continued slowing in economic momentum through the rest of this year to remain on the sidelines. Until the Bank meets again on October 25th, we will have several economic releases, including two more inflation reports. By then, we expect the progress in rebalancing demand and supply in the economy will manifest more clearly, putting a permanent end to the tightening cycle.
U.S. Inflation Expected to Rise in August on Soaring Gasoline Prices
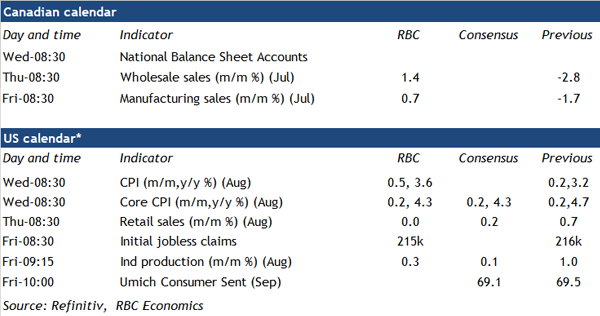
The U.S. Federal Reserve will be on the lookout for signs that broader inflation trends continued to slow down in August—even as energy prices spiked. We expect headline CPI to tick up to 3.6% year-over-year in August, up from 3.2% in July. This increase is almost entirely explained by higher global energy prices. Gasoline prices rose more than 10% month-over-month (on a seasonally adjusted basis) between July in August. And energy prices as a whole likely reported their steepest month-over-month growth since mid-2022.
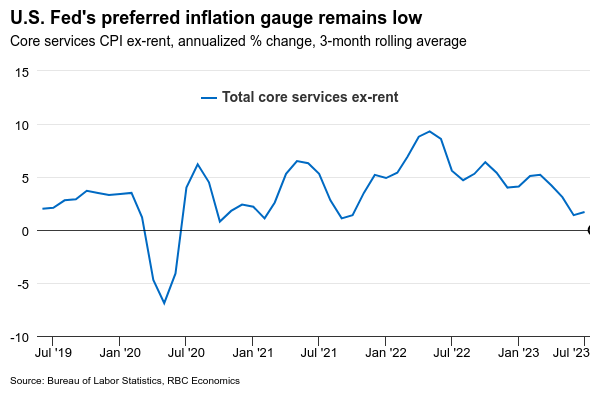
Aside from energy, U.S. price pressures have eased substantially in recent months. Food price growth has moderated sharply and we look for ‘core’ (ex-food & energy) price growth to slow to 4.3% year-over-year in August from 4.7% the month before. That will drop the measure further below a 6.6% peak in September last year. Month-over-month increases in the Fed’s preferred “supercore” measure (CPI services excluding rent) have been running below a 2% annualized rate for the last four months. But inflation pressures won’t stay that low if surging economic growth data and firm labour markets don’t show further signs of softness. But the economic backdrop abroad is slowing, job openings and quit rates continue to decline, and ‘excess’ savings that cushioned households from the blow of higher prices and interest rates are now largely depleted. We continue to look for U.S. economic growth to soften in the coming months—preventing a re-acceleration of broader inflation pressures.
- According to StatCan’s advance estimates for July, “core” wholesale sales rose by 1.4%, higher motor vehicle and parts sales (+5.8%) contributed to this, offsetting lower sales in machinery, equipment and supplies.
- Manufacturing sales ticked up 0.7% in July according to the flash estimate, primarily driven by petroleum and coal product, food, and primary metal subsectors. Industrial prices in the manufacturing sector rose more than that (seasonally adjusted) in July, suggesting that sales declined excluding price impacts.
- U.S. retail sales likely remain unchanged in August, following a 0.7% uptick in the prior month. This expected slowdown in growth is mainly due to a 4.5% decline in unit auto sales in August. Excluding autos, we expect sales edged up by 0.3% although largely due to a price-related increase in sales at gas stations.
- We expect that U.S. industrial production inched up 0.3% in August, decelerating from a 1% increase in July. Most of this growth was drive by the manufacturing sector, where hours worked rose.
- Canadian household net wealth likely rose in Q2 with an increase in house prices and stronger equity markets pushing asset values up more than debt levels. A surge in household disposable incomes in Q2 likely pushed the debt-to-income ratio lower and left the debt servicing ratio little-changed despite further increases in debt payments. Signs that labour markets softened into Q3 mean that positive income boost is unlikely to be repeated in the near-term.