Sample Category Title
AUD/USD and NZD/USD Could Start Fresh Increase
AUD/USD declined 0.6400 before the bulls appeared. NZD/USD is now attempting a fresh increase from the 0.5860 support zone.
Important Takeaways for AUD/USD and NZD/USD Analysis Today
- The Aussie Dollar started a fresh decline from well above the 0.6440 level against the US Dollar.
- There is a key contracting triangle forming with resistance near 0.6400 on the hourly chart of AUD/USD at FXOpen.
- NZD/USD declined heavily from the 0.6000 resistance zone.
- Recently, there was a break above a connecting bearish trend line with resistance near 0.5880 on the hourly chart of NZD/USD at FXOpen.
AUD/USD Technical Analysis
On the hourly chart of AUD/USD at FXOpen, the pair struggled to clear the 0.6520 zone. The Aussie Dollar started a fresh decline below the 0.6440 support against the US Dollar.
The pair even settled below 0.6400 and the 50-hour simple moving average. Finally, the bulls appeared near the 0.6360 zone. A low was formed near 0.6357 and the pair is now consolidating losses. It is slowly moving higher above the 50-hour simple moving average.
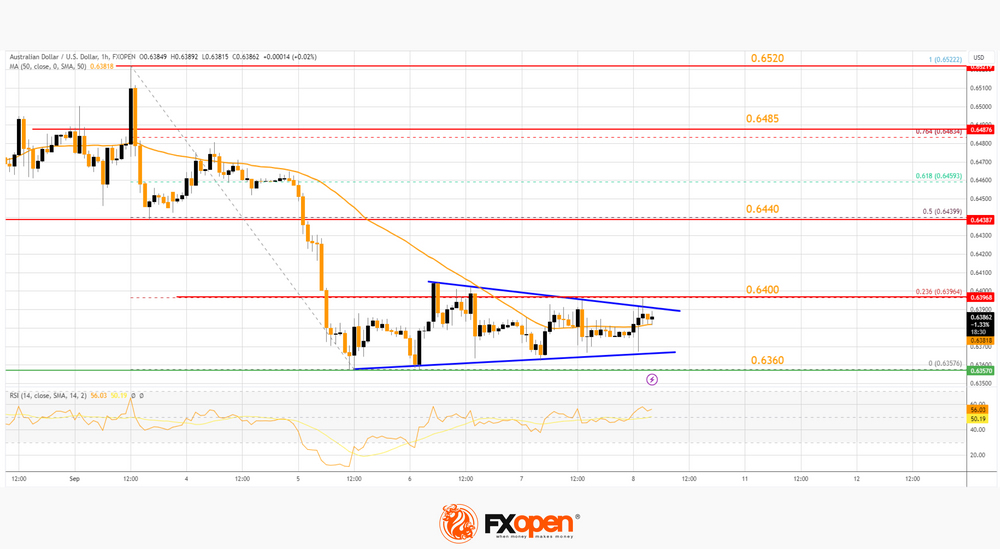
On the upside, an immediate resistance is near a key contracting triangle at 0.6400. It is close to the 23.6% Fib retracement level of the downward move from the 0.6522 swing high to the 0.6357 low.
A clear upside break above 0.6400 could send the pair toward the 50% Fib retracement level of the downward move from the 0.6522 swing high to the 0.6357 low at 0.6440. The next major resistance is near 0.6485, above which the price could rise toward 0.6520. Any more gains might send the pair toward 0.6550.
A close above the 0.6550 level could start another steady increase in the near term. The next major resistance on the AUD/USD chart could be 0.6600.
On the downside, initial support is near the 50-hour simple moving average at 0.6385. The next support could be the 0.6360. Any more losses might send the pair toward the 0.6320 support.
NZD/USD Technical Analysis
On the hourly chart of NZD/USD on FXOpen, the pair also followed a similar pattern and declined from the 0.6000 zone. The New Zealand Dollar gained bearish momentum and traded below 0.5935 against the US Dollar.
The pair even spiked below the 50-hour simple moving average and tested 0.5860. A low was formed near 0.5859 and the pair is now attempting a fresh increase. It is back above the 0.5880 level and the 50-hour simple moving average.
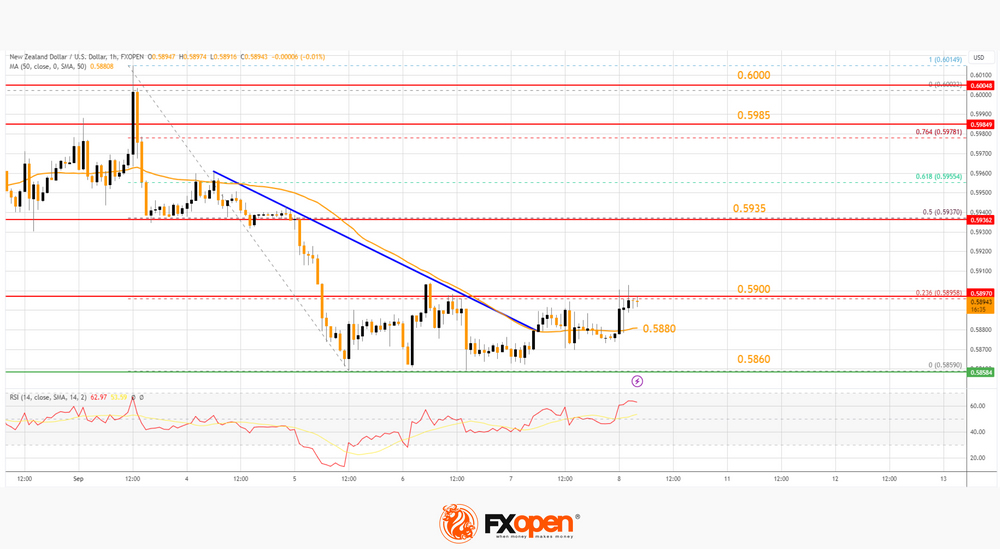
It is now struggling to clear the 23.6% Fib retracement level of the downward move from the 0.6014 swing high to the 0.5859 low at 0.5900. If there is a move above 0.5900, the pair could rise toward the 0.5935 resistance.
The 50% Fib retracement level of the downward move from the 0.6014 swing high to the 0.5859 low is also at 0.5935, above which the pair could rise toward 0.5985. Any more gains might open the doors for a move toward the 0.6000 resistance zone.
On the downside, immediate support on the NZD/USD chart is near the 50-hour simple moving average at 0.5880. The next major support is near the 0.5860 zone. If there is a downside break below 0.5860, the pair could extend its decline toward the 0.5820 level. The next key support is near 0.5800.
This article represents the opinion of the Companies operating under the FXOpen brand only. It is not to be construed as an offer, solicitation, or recommendation with respect to products and services provided by the Companies operating under the FXOpen brand, nor is it to be considered financial advice.
Bitcoin Sets September High
The price of the main cryptocurrency rose above the level of 26k US dollars. This was fueled by the news that Ark Invest and 21Shares filed applications with the US Securities and Exchange Commission (SEC) for a spot ETF on Ethereum.
Some say recent verdicts in favor of cryptocurrency firms Grayscale and Ripple Labs in lawsuits against the SEC increase the chances that ETF applications for Ethereum will be approved. We also note that applications for bitcoin ETFs from BlackRock and other funds are being reviewed by the SEC, but the deadlines for these applications, originally set for early September, have been postponed to a later date.
Meanwhile, Barrons writes that the NASDAQ exchange is preparing infrastructure for cryptocurrency trading, which is causing bullish sentiment among cryptocurrency enthusiasts. But the BTC/USD chart gives reason to doubt.
Bearish arguments:
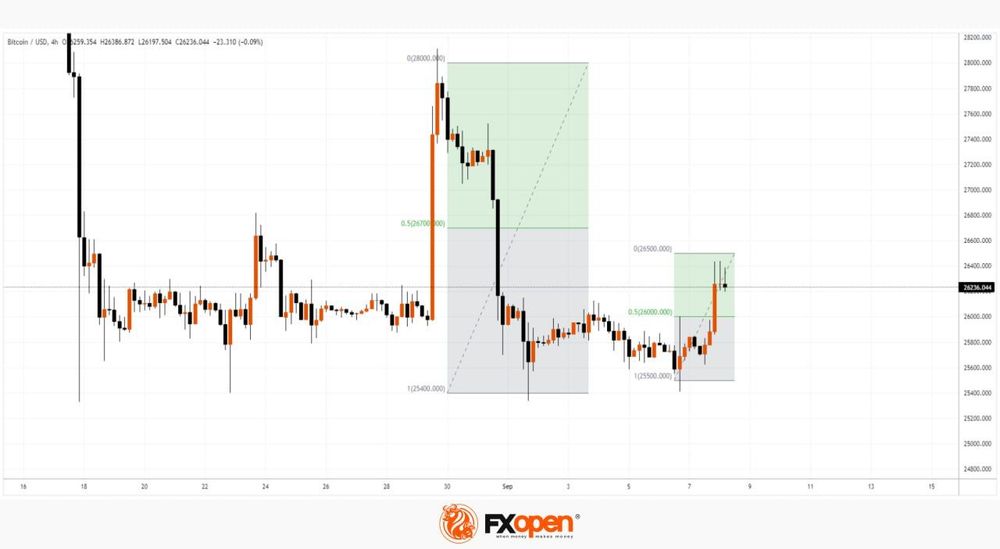
→ The price of bitcoin did not exceed 50% of the sharp decline in late August and early September.
→ The price of bitcoin has not reached the target, which is built after the breakout based on the height of the previous consolidation zone (on the chart it is 25,500-26,000).
→ Long upper shadows have formed on the last candles, indicating the strength of offers above the 26k level.
It is reasonable to assume that future bid approvals will generate strong bullish momentum. The rally could also be caused by the hype around the halving and the easing of the Fed’s policy in 2024. But so far there are no strong drivers for growth, and, according to Coindesk data, the volume of spot cryptocurrency trading in August set a minimum for more than 4.5 years.
This article represents the opinion of the Companies operating under the FXOpen brand only. It is not to be construed as an offer, solicitation, or recommendation with respect to products and services provided by the Companies operating under the FXOpen brand, nor is it to be considered financial advice.
Canadian Dollar Steady Ahead of Jobs Report
- Canada expected to have shed 6,400 jobs
- BoC’s Macklem says rate increases may be needed to lower inflation
The Canadian dollar is steady on Friday in what should be a busy day. In the European session, USD/CAD is trading at 1.3670, down 0.12%. Canada releases the August job report later today, with the markets braced for a decrease of 6,400 in employment.
The US dollar has been on a tear against the major currencies since mid-July. The Canadian dollar has slumped, losing about 450 basis points during that span. The Canadian economy hasn’t been able to keep pace with its southern neighbor, and that was made painfully clear as GDP contracted by 0.2% in the second quarter, below expectations.
The deterioration in economic growth is a result of a weak global economy as well as the Bank of Canada’s steep tightening cycle. After back-t0-back increases, the BoC opted to pause at this week’s meeting and held the benchmark cash rate at 5.0%. Governor Macklem likes to use the term “conditional pause”, which means that a break from rate hikes will depend on economic growth and inflation levels.
At this week’s meeting, the BoC’s rate statement was hawkish, warning that inflation was too high and not falling fast enough. This was a signal that the door remained open to interest rate increases. Macklem was more explicit on Thursday, stating that further rate hikes might be needed to lower inflation and warning that persistently high inflation would be worse than high borrowing costs.
The markets are more dovish about the BoC’s rate path, given that the economy is cooling and the central bank will be wary about too much tightening which could tip the economy into a recession. The markets have priced in a 14% probability of a rate hike at the October meeting.
USD/CAD Technical
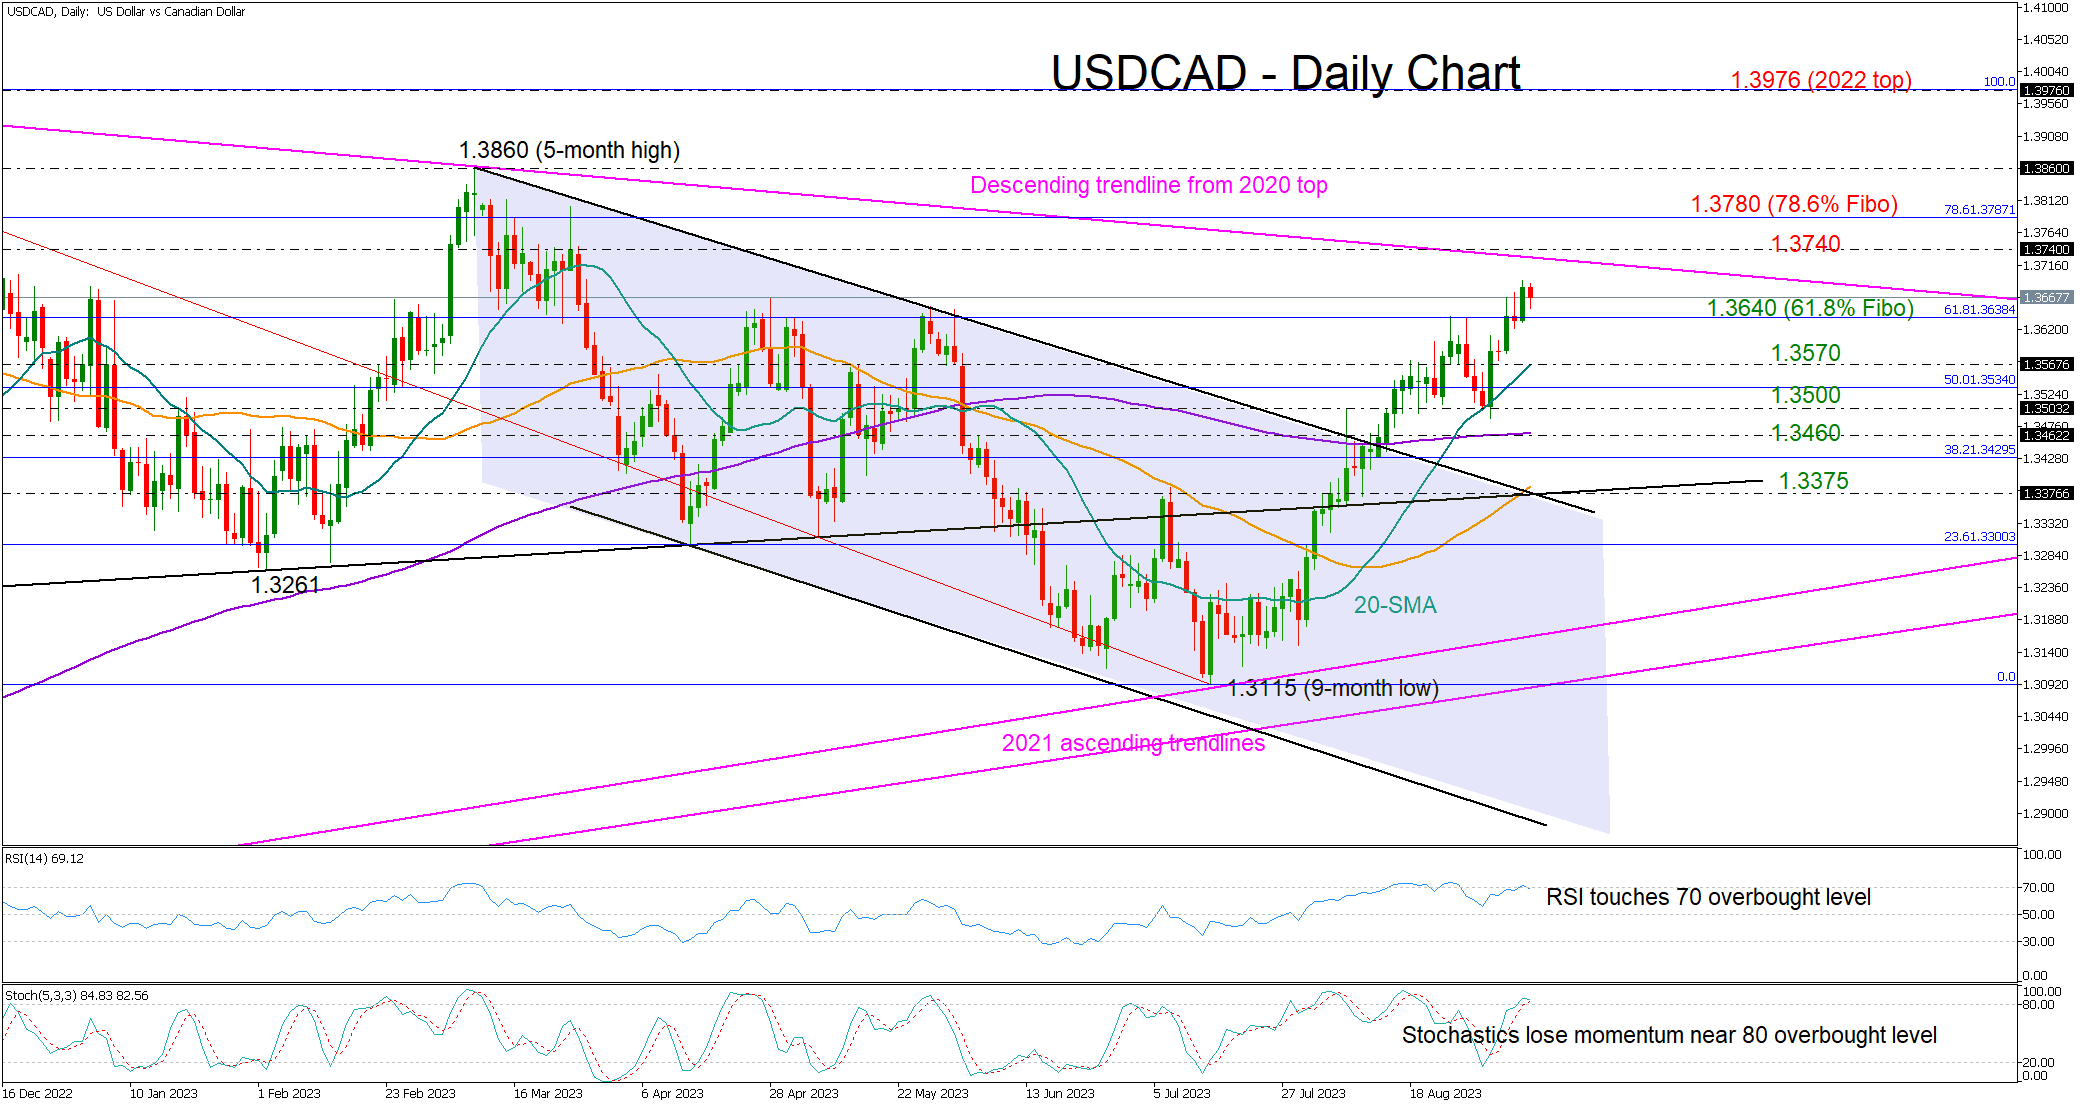
- USD/CAD is testing resistance at 1.3657. The next resistance line is 1.3721
- 1.3573 and 1.3509 are providing support
USDCAD Rally Approaches Caution Area
USDCAD bulls have been in charge for eight weeks in a row, currently aiming to push past the resistance trendline from 2020 that caused a bearish trend reversal in October 2022 and March 2023.
Given the overbought signals coming from the RSI and the stochastic oscillator, it’s uncertain whether the pair will manage to extend its uptrend above the tough trendline and the 1.3740 bar. The 78.6% Fibonacci mark of the 1.3976-1.3115 downtrend is nearby at 1.3780 and may attract some interest before all eyes turn to the 2023 peak of 1.3860. If the rally continues from there, the next target could be the 2022 top of 1.3976.
Should the bears take over below the 61.8% Fibonacci of 1.3640, the price could head for the 20-day simple moving average (SMA) at 1.3570. Slightly lower, the 1.3500 area might also provide some footing ahead of the flattening 200-day SMA at 1.3460.
In brief, USDCAD is maintaining a clear uptrend, but the risk of a downside reversal is increasing as the price is quickly approaching a critical resistance area.
Germany poised for mild economic contraction in 2023, DIW reports
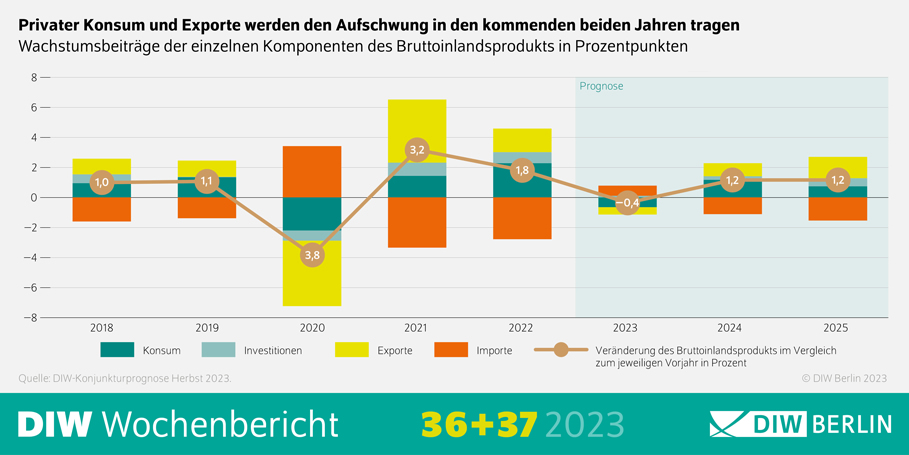
Germany stands on the brink of being the only major economy to register a contraction in 2023, with German economic research institute, DIW, projecting a -0.4% dip in the nation's economic output for the year. This downturn is primarily attributed to sluggish domestic consumption and a falter in export dynamics, exacerbated by a slowed Chinese economy.
Looking forward, however, the institute holds a more positive outlook, forecasting a steady 1.2% growth in both 2024 and 2025. Geraldine Dany-Knedlik, the co-head of forecasting and economic policy at DIW, envisages that a pronounced increase in wages and salaries would spur household expenditure, kickstarting a recovery phase.
Timm Bönke, also a co-head at the DIW's forecasting department, anticipates a notable improvement in the consumer sentiment owing to a substantial dip in inflation rates in the forthcoming period. Households will be encouraged to enhance their spending, propelled by improved financial conditions and a potentially steadier inflation environment.
Chinese Yuan Falls to Year’s Low
Why is the yuan falling?
→ Strong US dollar. Yesterday it became known that the number of applications for unemployment benefits in the US amounted to 216k for the week — below the forecast of 232k applications. This is the lowest level since February.
→ Worsening problems in the Chinese economy. Yesterday's data from the General Administration of Customs of the People's Republic of China showed that the volume of exports in August decreased by 8.8% in annual terms — the decline in exports is recorded for the fourth month in a row.
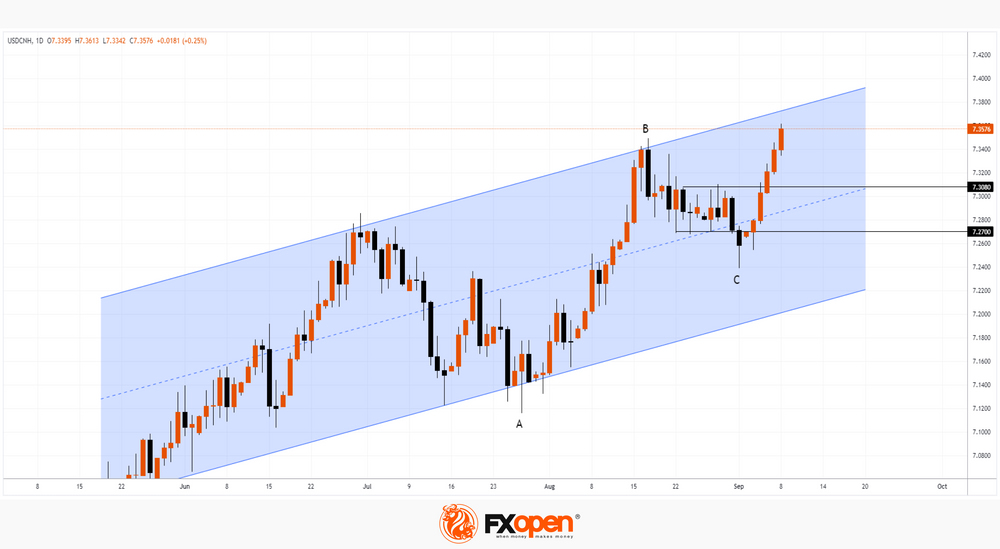
As the chart shows, the USD/CNH rate reached 7.36 today. According to some sources, this is not only the minimum for the yuan for 2023, but also the minimum for 16 years (it depends on whether the 2022 low is considered broken).
Bullish arguments:
→ The price is within the ascending channel. The dynamics develop in its upper part, which indicates the strength of the trend.
→ The price fell below 7.27 only for 1 day, forming a candle with a long lower shadow. The recovery occurred quickly, indicating the strength of demand.
→ The size of the B-C retracement corresponds to the size of 50% of the A-B impulse. This is the proportion for a normal correction within a stable trend.
→ 3 candles on September 5-7 can be classified as a bullish 3 White Soldiers pattern. Statistically, after the formation of the pattern, we should expect continued growth.
Bearish arguments:
→ If the trend continues, the rate may reach the upper boundary of the upper channel. There, the bulls can take profits, which will weaken the trend.
→ The FT reports the words of Ken Cheng, chief FX strategist for Asia at Mizuho Bank: “there is a growing likelihood that the People's Bank of China will adjust the currency band.” That is, as in the case of the yen, one should be prepared for government intervention in order to protect the currency.
This article represents the opinion of the Companies operating under the FXOpen brand only. It is not to be construed as an offer, solicitation, or recommendation with respect to products and services provided by the Companies operating under the FXOpen brand, nor is it to be considered financial advice.
EUR/USD: Bears to Resume After Limited Consolidation
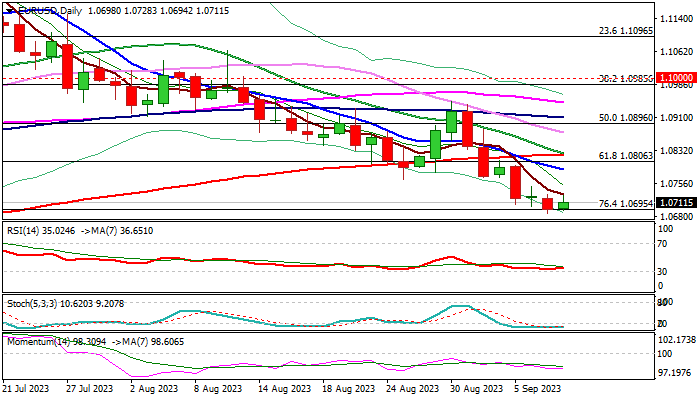
EURUSD is consolidating just above pivotal Fibo support at 1.0695 (76.4% of 1.0516/1.1275) in early Friday, as larger bears found temporary footstep here.
The pair is on track for the eight consecutive weekly close in red which reinforces overall bearish structure.
Daily chart shows 14-d momentum deeply in negative territory and moving averages in full bearish setup (double death cross of 5/200 and 10/200DMA have been formed), though oversold stochastic warns that bears may take a breather.
Partial profit-taking at the end of the week may also contribute to expected near-term scenario.
Persisting strong downside pressure suggests that consolidation should be limited and offer better selling opportunities.
Upticks should be capped under 1.0800 zone (falling 10DMA / broken Fibo 61.8%) to keep bears intact and offer better opportunities to re-enter bearish market.
Firm break of 1.0700/ 1.0695 (psychological/Fibo) to generate fresh bearish signal for extension towards 1.0635/11 (May 31 low/Fibo 38.2% of entire Sep 22/July 23 rally from 1.0935 to 1.1275).
Res: 1.0766; 1.0789; 1.0806; 1.0822.
Sup: 1.0695; 1.0667; 1.0635; 1.0611.
EUR/CHF Daily Outlook
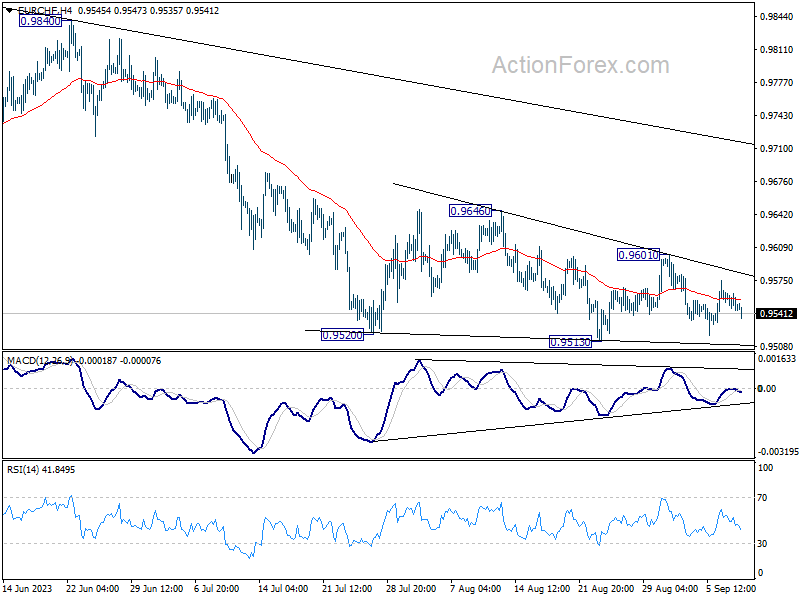
Daily Pivots: (S1) 0.9540; (P) 0.9555; (R1) 0.9563; More...
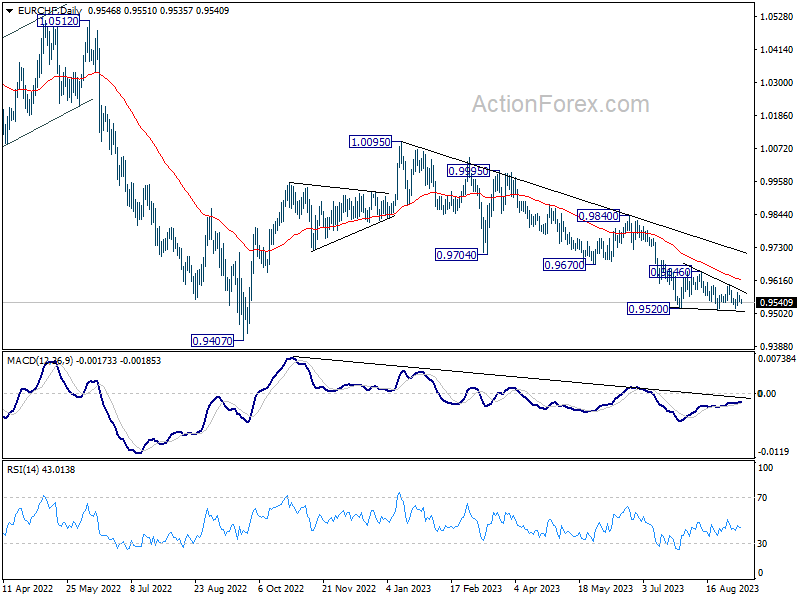
Intraday bias in EUR/CHF stays neutral at this point. With 0.9601 resistance intact, larger down trend is still in favor to continue. On the downside, break of 0.9513 support will confirm this bearish case and target 0.9407 low. Nevertheless, break of 0.9601 resistance will turn bias back to the upside for stronger rebound to 0.9646 resistance and above.
In the bigger picture, medium term outlook is staying bearish as the pair is capped well below falling 55 W EMA (now at 0.9839). Down trend from 1.2004 (2018 high) is in favor to continue. Sustained break of 0.9407 will target 61.8% projection of 1.1149 to 0.9407 from 1.0095 at 0.9018. For now, this will remain the favored case as long as 0.9670 support turned resistance holds, in case of strong rebound.
EUR/GBP Daily Outlook
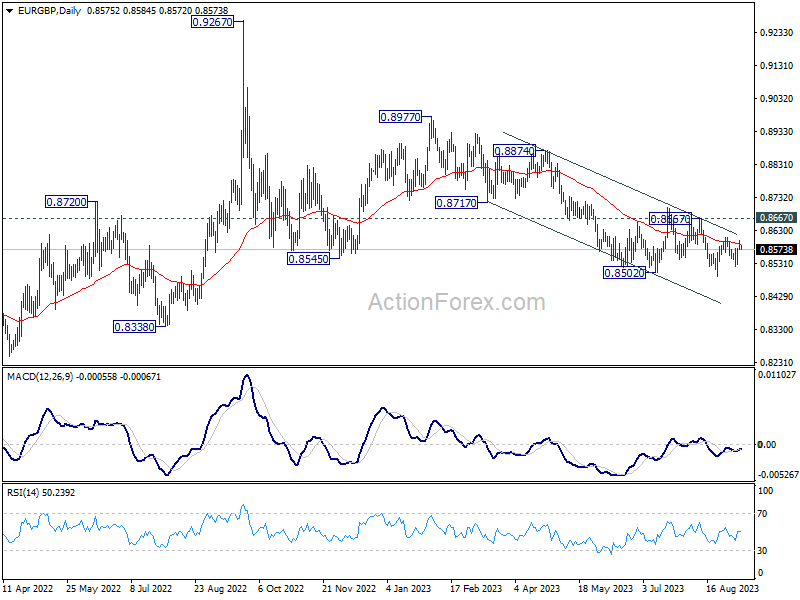
Daily Pivots: (S1) 0.8565; (P) 0.8583; (R1) 0.8595; More...
Intraday bias in EUR/GBP stays neutral for the moment. On the upside, above 0.8609 will resume the rebound from 0.8491. But near term outlook will stay bearish as long as 0.8667 resistance holds. On the downside, below 0.8522 will bring retest of 0.8491 low.
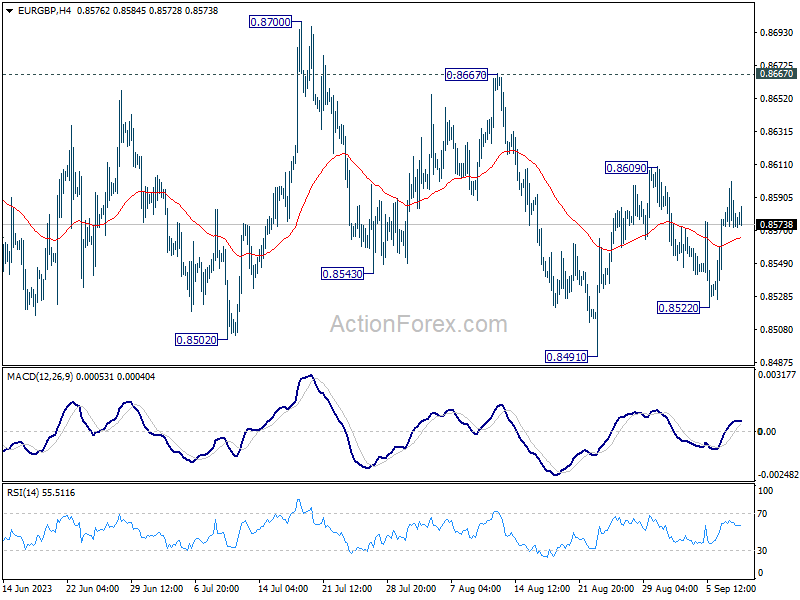
In the bigger picture, the down trend from 0.9267 (2022 high) is seen as part of the long term range pattern from 0.9499 (2020 high). Further decline is in favor as long as 0.8667 resistance holds. Break of 0.8491 will resume the fall towards 0.8201 (2022 low).
EUR/AUD Daily Outlook
Daily Pivots: (S1) 1.6721; (P) 1.6786; (R1) 1.6840; More...
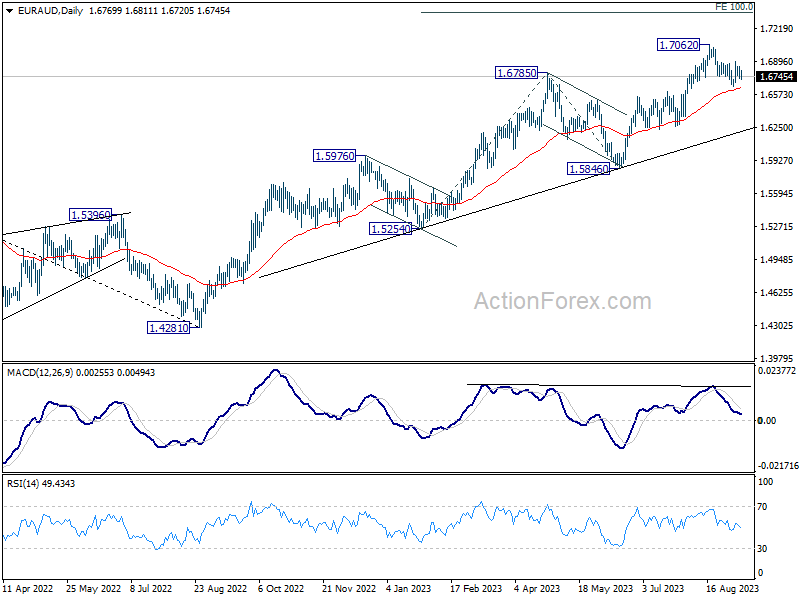
Range trading continues in EUR/AUD and intraday bias stays neutral for the moment. On the upside, firm break of 1.6887 resistance should confirm that correction from 1.7062 has completed at 1.6647. Further rally should be seen through 1.7062 to 1.7377 projection level. On the downside, break of 1.6647 will extend the correction lower instead.
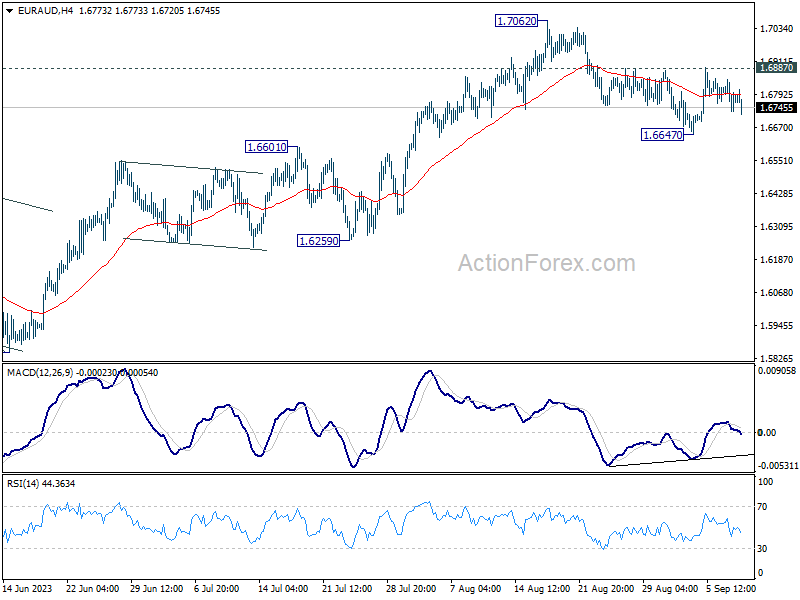
In the bigger picture, the rise from 1.4281 (2022 low) is in progress. Next target is 100% projection of 1.5254 to 1.6785 from 1.5846 at 1.7377. For now, outlook will stay bullish as long as 1.5846 support holds, even in case of deep pull back.