Sample Category Title
Dollar’s Dominant Rally Highlights Resilient US Economy as Global Growth Wanes
Dollar is making a powerful rally today, breaking through near-term resistance levels against all its major counterparts. This surge is anchored by recent economic data, which paints a picture of a US economy that is cooling but not cracking. This robustness stands in stark contrast to the weakening growth conditions seen in other major economies, as evidenced by today's disappointing services PMI data from China, Eurozone, and UK. Given the relative strength of the US economy, Fed might eventually find itself being the last among major central banks to initiate interest rate cuts. This scenario becomes increasingly likely if the US continues to demonstrate economic resilience while its global peers falter.
The greenback's strength today is not just noteworthy but dominant. It reached a new year-high against Yen, while Euro and Sterling plummeted to their lowest levels since mid-June. Australian Dollar, often seen as a proxy for China risk, was the hardest hit, dropping to its lowest point since last November. New Zealand Dollar didn't fare much better, coming in as the day's second-worst performer. In a curious twist, Canadian Dollar displayed a bit of resiliency, standing as the second strongest for the day. Among European currencies, Sterling appeared to be the better performer, albeit in a losing game.
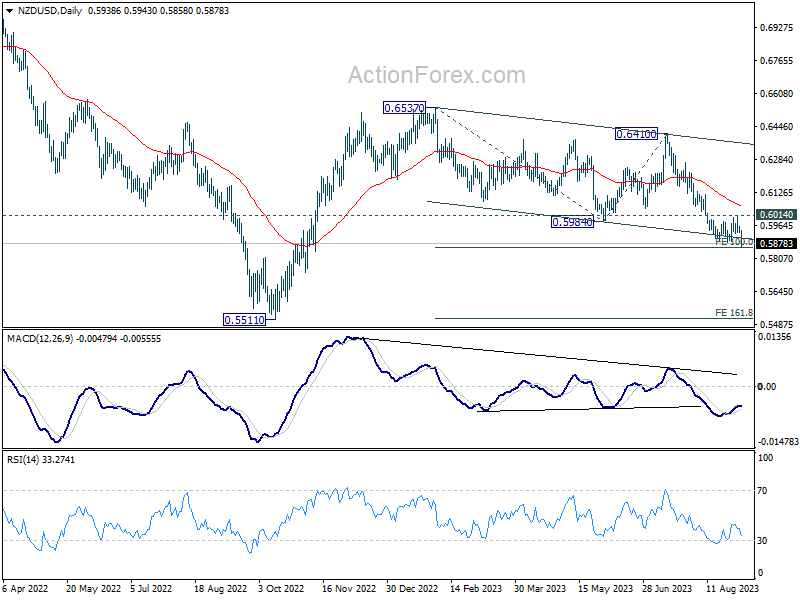
Technically, NZD/USD resumes the fall from 0.6410 today by breaking through 0.5885 support. Immediate attention is now on 100% projection of 0.6537 to 0.5984 from 0.6410 at 0.5857. Decisive break there, together with sustained trading below medium term channel support, could prompt downside acceleration to 161.8% projection at 0.5515, which is close to 0.5511 (2022) low). Even in the event of a strong recovery, the pair's outlook remains bearish as long as 0.6014 resistance holds.
In Europe, at the time of writing, FTSE is up 0.12%. DAX is down -0.07%. CAC is down -0.08%. Germany 10-yaer yield is up 0.0082 at 2.590. Earlier in Asia, Nikkei rose 0.30%. Hong Kong HSI dropped -2.06%. China Shanghai SSE dropped -0.71%. Singapore Strait Times dropped -0.37%. Japan 10-year JGB yield rose 0.0112 to 0.658.
ECB Lane emphasizes need for timely return to 2% inflation
In an interview with The Currency, ECB Chief Economist Philip Lane offered some guarded optimism about the inflationary environment in Eurozone, despite acknowledging that the current inflation rate is a lofty 5.3%. Lane was keen to highlight a "welcome development" in the latest data, pointing to a slight easing in both goods and services inflation as potentially indicative of changing momentum.
Lane emphasized ECB's ongoing challenge of steering inflation rate back to its 2% target. "What is a timely manner?" Lane posed, elaborating that the goal is to return to 2% "sufficiently quickly that everyone understands that the current inflation episode is time-limited."
He underscored the importance of convincing the public that this is a "temporary inflation episode," and that they should not alter their longer-term behavior in anticipation of persistently high inflation rates. The key objective here is to prevent inflation expectations from becoming unanchored.
ECB consumer survey sees rising 3-yr inflation expectations, more pessimistic growth outlook
ECB has just released its Consumer Expectations Survey for July 2023, offering an inside look into how consumers are viewing the economic outlook.
Most notably, median expectations for inflation over the next year remained static at 3.4%. Even more telling is that forecast for inflation three years out saw a marginal uptick, moving to 2.4% from 2.3% recorded.
On the other hand, mean economic growth expectations for the next 12 months turned a bit more pessimistic, registering at -0.7% as compared to -0.6% in June.
In terms of employment, expectations for unemployment rate a year from now remained stable at 11.0%. Consumers perceive the current unemployment rate to be 10.8%, suggesting an expectation of a broadly stable labor market.
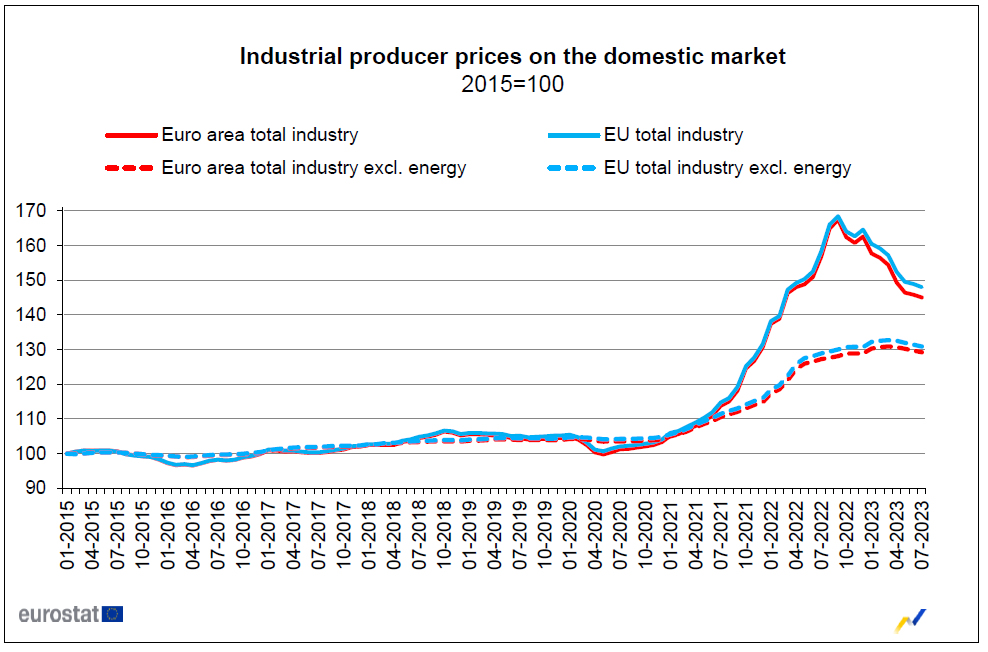
Eurozone PPI down -0.5% mom, -7.6% yoy in Jul
Eurozone PPI fell -0.5% mom -7.6% yoy in July, versus expectation of -0.6% mom, -7.6% yoy. For the month, Industrial producer prices decreased by -1.2% mom for intermediate goods and by -0.9% mom in the energy sector, while prices increased by 0.1% mom for non-durable consumer goods and by 0.2% mom for both capital goods and durable consumer goods. Prices in total industry excluding energy decreased by -0.4% mom.
EU PPI was down -0.6% mom, -6.6% yoy. The largest monthly decreases in industrial producer prices were recorded in Ireland (-8.1%), the Netherlands (-2.6%) and Sweden (-1.8%), while the highest increases were observed in Latvia (+2.2%), Slovakia (+1.7%) and Croatia (+1.3%).
Eurozone PMI services finalized at 47.9, Q3 GDP to contract -0.1%
Eurozone is grappling with weakening economic indicators, as PMI Services for August (final) slipped to a 30-month low of 47.9, down from July's reading of 50.9. Composite PMI, which combines services and manufacturing data, also sank to a 33-month low of 46.7, down from July's 48.6.
The fall in PMI scores was particularly evident in Germany (44.6) and France (46.0), which reported 39-month and 33-month lows, respectively. On the other hand, Ireland managed to score a 4-month high of 52.6, showing some resilience amid the general downturn.
Cyrus de la Rubia, Chief Economist at Hamburg Commercial Bank, provided a sobering analysis. "The disappointing numbers contributed to a downward revision of our GDP nowcast, which stands now at -0.1% for the third quarter," he said. According to de la Rubia, the services sector, a stabilizer for Eurozone economy, has turned into a "drag".
Furthermore, he noted that input price increases have surprisingly accelerated, questioning the outlook for rapidly decreasing inflation. Employers are also becoming cautious about expanding their workforces, hinting that job cuts could be on the horizon.
UK PMI services finalized at 49.5, faltering growth and sticky inflation
UK PMI Services was finalized at 49.5 in August, down from July's 51.5, and represents the lowest level since January. Furthermore, PMI Composite was finalized at 48.6, down from 50.8 in July, indicating the first contraction since the start of the year.
Tim Moore, Economics Director at S&P Global Market Intelligence, elaborated on the concerning developments. He noted that service sector businesses are "clearly feeling the impact of rising interest rates on client demand"
"Worries about the broader business climate also dampened spending in August," Moore said, adding that "faltering UK economic growth and sticky inflation" are contributing to more cautious outlook.
A key takeaway from the survey is the pace at which backlogs of work are decreasing—reported as the fastest in over three years. This suggests that businesses are scaling back their operations, perhaps in anticipation of tougher times ahead. The survey also highlighted cooling job market within service sector, as job creation dipped to its lowest point since March.
The report pointed out that competitive pressures may have started to curb inflation within the service economy. The latest round of price hikes was the slowest seen in two years, offering a glimmer of hope that inflation may stabilize or even decline in the near term.
RBA holds rates steady at 4.10%, maintains hawkish bias
RBA held its cash rate target unchanged at 4.10% in a widely expected move, offering additional time to evaluate impact of previous interest rate hikes and evolving economic outlook. Although the central bank maintained hawkish bias, it emphasized that future decisions would be highly data-dependent, particularly scrutinizing global economic trends, household spending, and conditions in labor and inflation.
In its accompanying statement, the RBA noted, "Some further tightening of monetary policy may be required to ensure that inflation returns to target in a reasonable timeframe."
RBA stated that the Australian economy is undergoing a period of "below-trend growth," a situation expected to persist. Unemployment rate is anticipated to rise gradually to around 4.5% by the end of next year. Recent data suggests that inflation will likely re-enter the 2-3% target range over the forecast horizon.
However, it cautioned that uncertainties abound, including the persistent nature of services price inflation observed overseas, which could manifest similarly in Australia. Other uncertainties revolve around the lag effects of monetary policy, labor market's response to slower economic growth, and behavior of firms in their pricing and wage-setting decisions.
It also expressed concerns about the household sector. Global uncertainties, particularly those related to the Chinese economy, were noted as an additional risk, given the ongoing stresses in China's property market.
China's Caixin PMI services fell to 51.8, waning economic momentum
China Caixin PMI Services for August fell to 51.8, down from 54.1 in July and below market expectations of 53.6. This marks the lowest reading in eight months. According to Caixin, the softer performance was due to a slower increase in business activity and new orders. While employment continued to rise, input cost inflation reached a six-month low.
Composite Output Index, which includes both manufacturing and services sectors, slightly decreased from 51.9 to 51.7. Though it still indicates expansion, the rate of growth was the slowest since January this year. A milder expansion in services sector was partially offset by a modest uptick in factory production.
Wang Zhe, Senior Economist at Caixin Insight Group, attributed the lackluster performance to seasonal fluctuations, extreme weather conditions like high temperatures and flooding, and a complicated global economic environment. These factors are further exacerbated by weak domestic demand.
Wang also warned of the long-term challenges facing the Chinese economy, stating, "Looking ahead, seasonal impacts will gradually subside, but the problems of insufficient domestic demand and weak expectations may form a vicious cycle for a protracted period of time." He added that given the uncertainty in external demand, downward pressure on the economy may continue to intensify.
EUR/USD Mid-Day Outlook
Daily Pivots: (S1) 1.0776; (P) 1.0793; (R1) 1.0813; More...
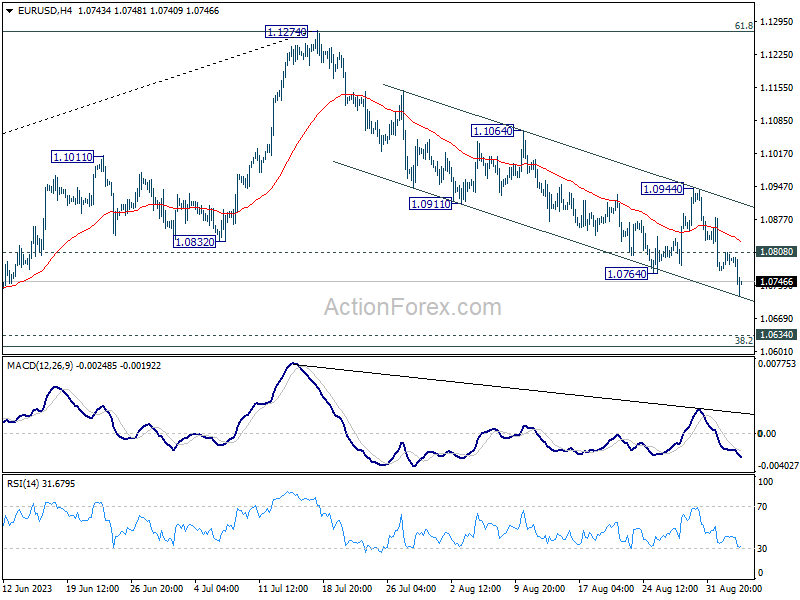
EUR/USD's break of 1.0764 support confirms resumption of whole decline from 1.1274. Intraday bias is back on the downside for 1.0609/34 cluster support next. On the upside, above 1.0808 minor resistance will turn intraday bias neutral first. But risk will stay on the downside as long as 1.0944 resistance holds, in case of recovery.
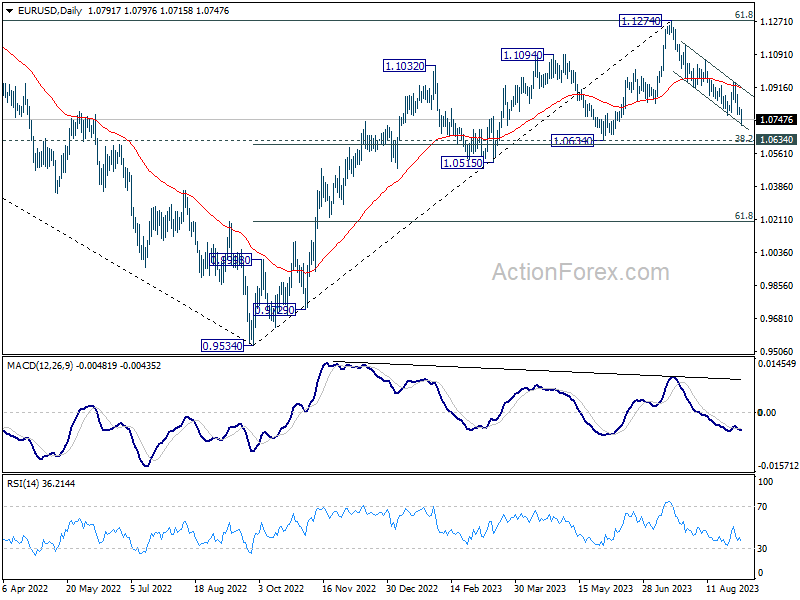
In the bigger picture, fall from 1.1274 medium term top is seen as a correction to up trend from 0.9534 (2022 low). Deeper decline would be seen to 1.0634 cluster support (38.2% retracement of 0.9534 to 1.1274 at 1.0609). Strong support could be seen there, at least on first attempt, to bring rebound. Yet, medium term outlook will be neutral for now, as long as 1.1274 resistance holds. However, sustained break of 1.0609/34 will raise the chance of bearish trend reversal, and target 61.8% retracement at 1.0199.
Economic Indicators Update
| GMT | Ccy | Events | Actual | Forecast | Previous | Revised |
|---|---|---|---|---|---|---|
| 23:01 | GBP | BRC Like-For-Like Retail Sales Y/Y Aug | 4.30% | 2.20% | 1.80% | |
| 01:30 | AUD | Current Account Balance (AUD) Q2 | 7.7B | 8.1B | 12.3B | 12.5B |
| 01:45 | CNY | Caixin Services PMI Aug | 51.8 | 53.6 | 54.1 | |
| 04:30 | AUD | RBA Interest Rate Decision | 4.10% | 4.10% | 4.10% | |
| 07:45 | EUR | Italy Services PMI Aug | 49.8 | 50.2 | 51.5 | |
| 07:50 | EUR | France Services PMI Aug F | 46 | 46.7 | 46.7 | |
| 07:55 | EUR | Germany Services PMI Aug F | 47.3 | 47.3 | 47.3 | |
| 08:00 | EUR | Eurozone Services PMI Aug F | 47.9 | 48.3 | 48.3 | |
| 08:30 | GBP | Services PMI Aug F | 49.5 | 48.7 | 48.7 | |
| 09:00 | EUR | Eurozone PPI M/M Jul | -0.50% | -0.60% | -0.40% | |
| 09:00 | EUR | Eurozone PPI Y/Y Jul | -7.60% | -7.60% | -3.40% | |
| 14:00 | USD | Factory Orders M/M Jul | -2.50% | 2.30% |
European and Chinese Economies Drag Markets Down
Economic data from China and the eurozone sent markets back into sell-off mode.
China’s services PMI fell from 54.1 to 51.8, the smallest growth rate since last December. That’s a sharper slowdown than the 53.6 expected. The momentum of the recovery from lifting COVID restrictions is quickly fading, and the stimulus measures announced so far have proved unable to reverse the trend.
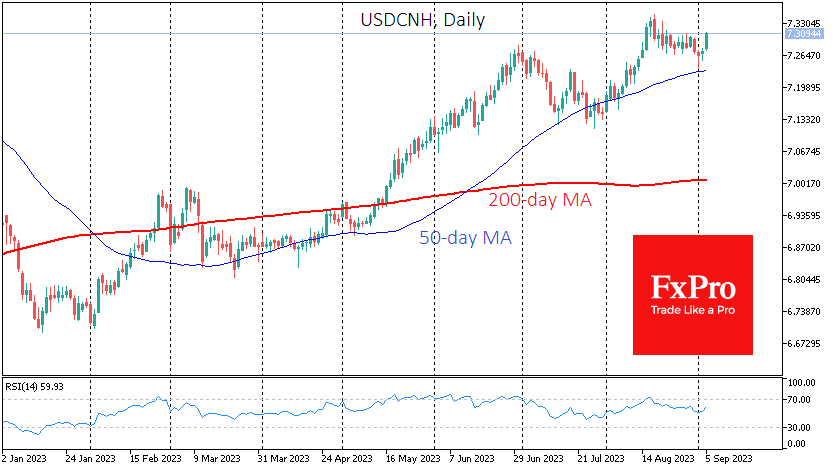
Sellers have taken control after a two-week rally in Chinese indices. The dollar is once again approaching 7.31 yuan, back in the range of the multi-year highs reached in August. And that’s bad news for global equities, too, given the size of the Chinese economy and its links to others, especially Europe.
Meanwhile, Europe is, unfortunately, one step ahead of China in this economic cycle. The latest composite PMI estimates for the eurozone marked a contraction in business activity at the fastest pace since November 2020. The index peaked at 54.1 in April and has declined every month since, falling to 46.7 in August.
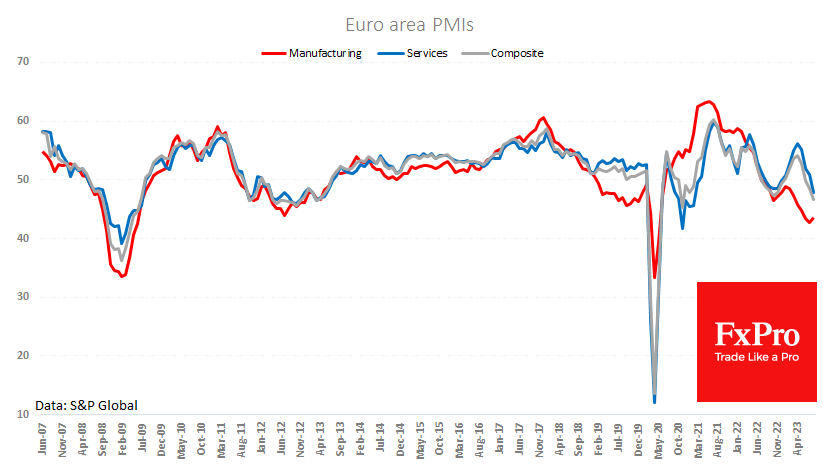
Lower gas prices and full storage facilities could not overcome the factor of high interest rates and weaker demand from China.
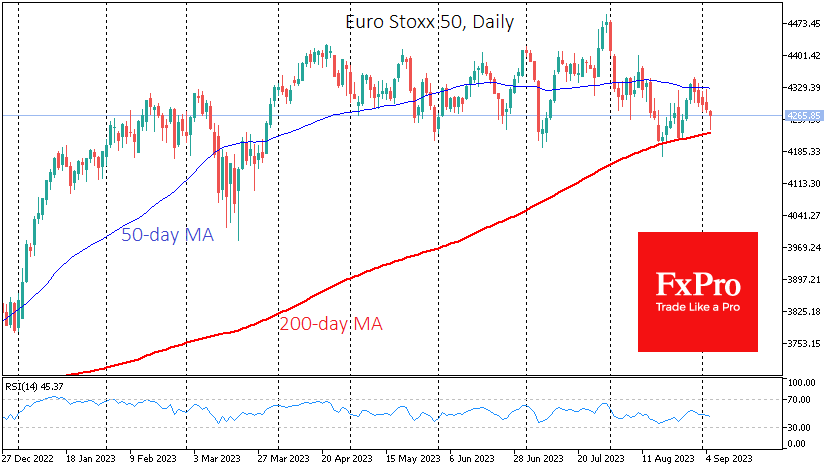
Since the middle of last month, the EuroStoxx50 has regularly tested its 200-day moving average and found support on the way down to 4220. It is fair to say that the European market is now clinging to hopes of ending the ECB’s policy tightening and that the economy is adjusting to higher rates.
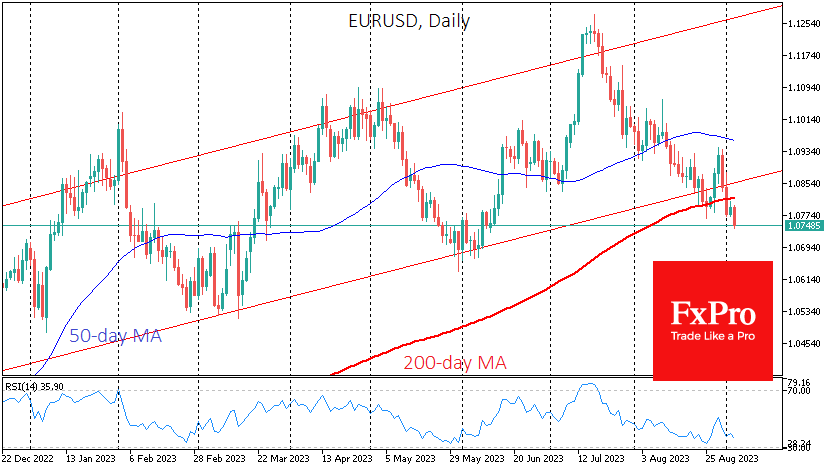
The second major factor is the 4% weakening of the euro over the past seven weeks. The EURUSD fell to 1.0750, its lowest level since June. Last Friday, it fell below its 200-day moving average, which signals a change in the long-term trend and could drag the pair down to the 1.0500 area.
The currency market is often one step ahead of the stock market, and in periods of strong trends, the correlation between stocks and the euro is often direct rather than inverse, as in the US or Japan. Therefore, if EURUSD continues to fall into a bear market, euro zone blue chips are also at risk of an intensified sell-off towards 4000.
AUD/USD: Aussie Dollar Loses Ground as RBA Stays Pat for the Third Month
Australian dollar was sharply lower on Tuesday (down nearly 1.3% in Asian / European session), after the Reserve Bank of Australia kept interest rates unchanged at 4.1% for the third consecutive month.
The RBA argued its decision by brighter outlook for pushing the inflation towards the central bank’s target, as they have a firmer grip on prices which adding to speculations that tightening cycle was over.
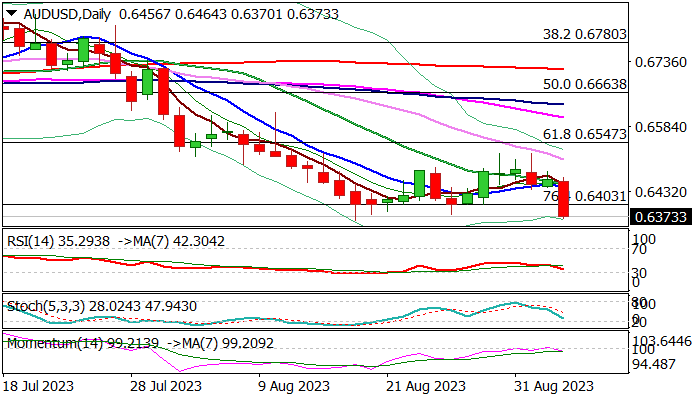
Aussie dollar was sold in immediate reaction and hit three-week low, pressuring key near-term support at 0.6364 (2023 low, posted on Aug 17).
Fresh bears look for eventual close below cracked Fibo support at 0.6403 (76.4% retracement of 0.6170/0.7157) after three consecutive attacks failed here.
Technical picture on daily chart is firmly bearish, with close below 0.6403 and break of recent spike low at 0.6364, to add to bearish signal and unmask 0.6170 target.
Res: 0.6403; 0.6445; 0.6488; 0.6521.
Sup: 0.6364; 0.6304; 0.6267; 0.6244.
Swiss Franc Hits Two-Month Low after Weak GDP
- Swiss GDP stagnates in Q2
- Manufacturing, exports decline
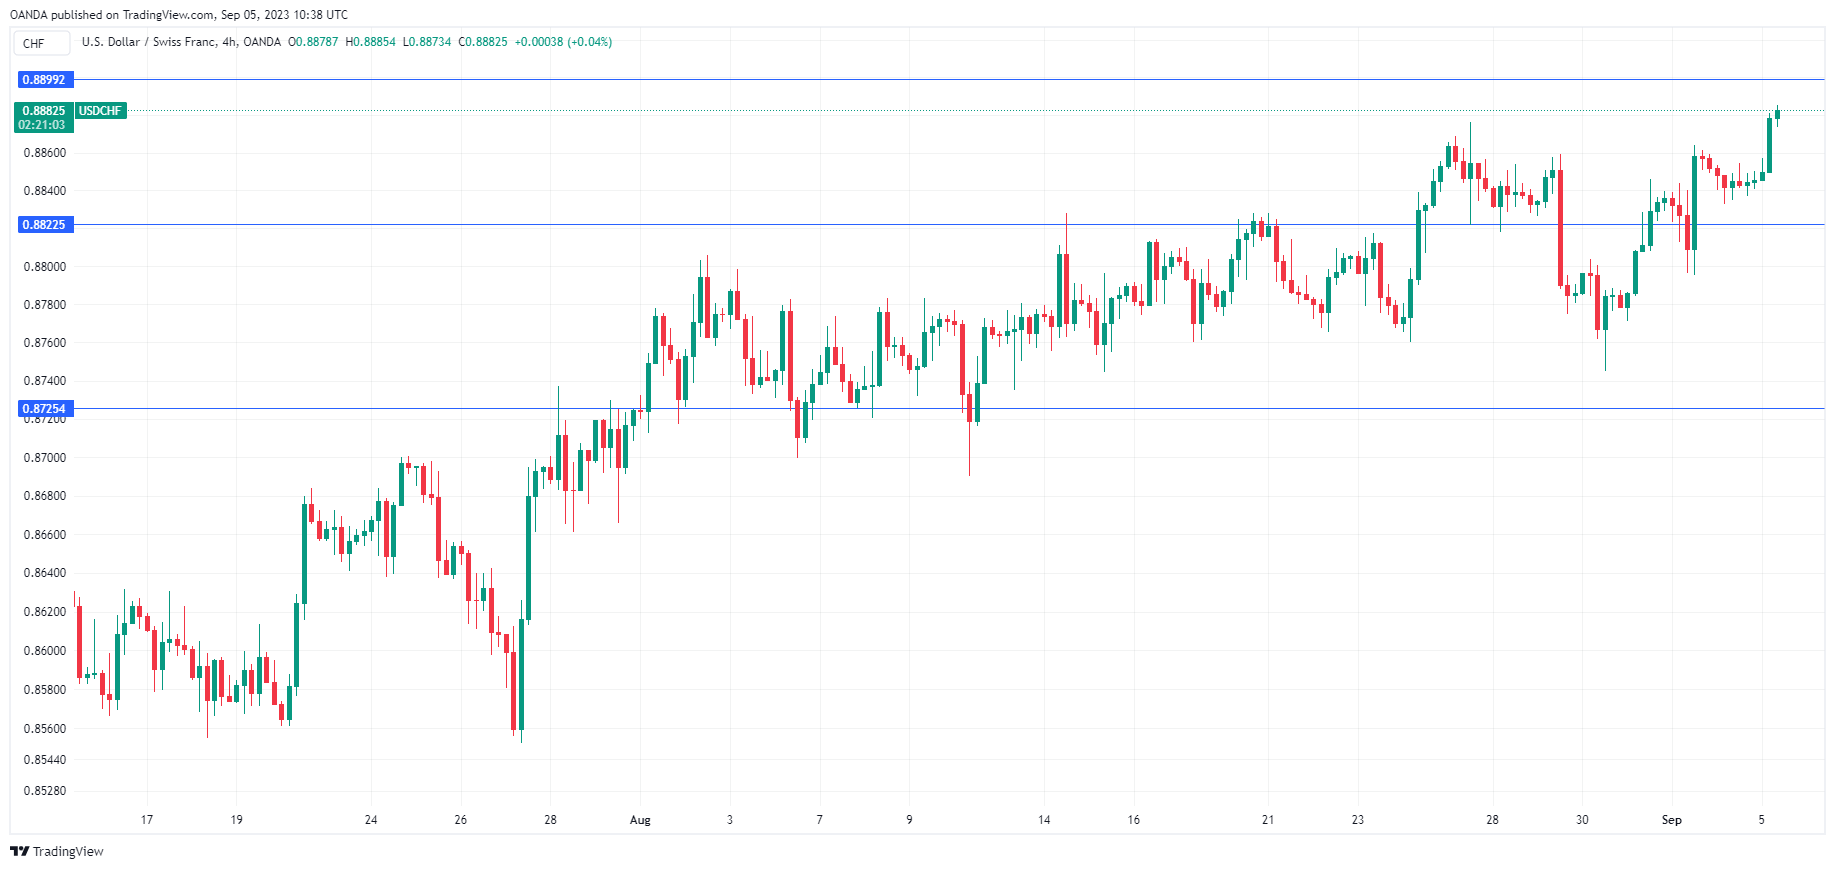
The Swiss franc is in negative territory on Tuesday. In the European session, USD/CHF is trading at 0.8884, up 0.44%. The Swissie has lost over 1% since Wednesday and is trading at its lowest level seen mid-July.
The driver behind today’s losses was a disappointing Swiss GDP release for the second quarter. The economy flatlined in Q2, compared to a robust 0.9% gain q/q in the first quarter (adjusted for sporting events). Most of the GDP components pointed to a grim picture. Manufacturing fell 2.9% q/q, capital goods investment declined by 3.7% q/q and exports of goods slipped by 1.2% q/q.
Switzerland’s economy, which ran like a Swiss watch for decades, has fallen victim to weak global demand and high interest rates. Manufacturing is struggling and business and consumer confidence remain weak. ING is projecting growth of just 0.7% in 2023 and 0.6% in 2024, compared to 2.7% in 2022.
Despite these pressing problems, Switzerland has kept inflation at very low levels. August inflation was unchanged at 1.6%, within the Swiss National Bank’s target range of 0%-2%. The SNB hasn’t been shy about intervening in the foreign exchange market to stabilize the exchange rate, which has helped to control external inflationary pressures.
The SNB has raised rates by 250 basis points in the current tightening cycle, with the cash rate currently at 1.75%. SNB Chair Thomas Jordan has backed up his hawkish rhetoric about containing inflation with five straight rate hikes (the central bank only meets on a quarterly basis). The SNB meets next on September 21st and is expected to raise rates by a quarter of a point.
USD/CHF Technical
- USD/CHF is putting pressure on resistance at 0.8899. Above, there is resistance at 0.8941
- 0.8822 and 0.8725 are providing support
AUD/USD Falls Sharply after the Decision of the Reserve Bank of Australia
The Reserve Bank of Australia (RBA) kept interest rates at 4.10% for the third month today, fueling rumors that the tightening cycle is over. Although according to Reuters, the majority of economists polled by the agency expect another increase by the end of the year after the release of the inflation report for the third quarter.
In the words of RBA chief Philip Lowe today:
→ data indicate that inflation could return to the 2-3% target range at the end of 2025;
→ the labor market remains strong and the economy operates at a high level of capacity utilization, although its development has slowed down;
→ further tightening is still acceptable if inflation is to be suppressed, which stands at 4.9% in July (at an 18-month low).
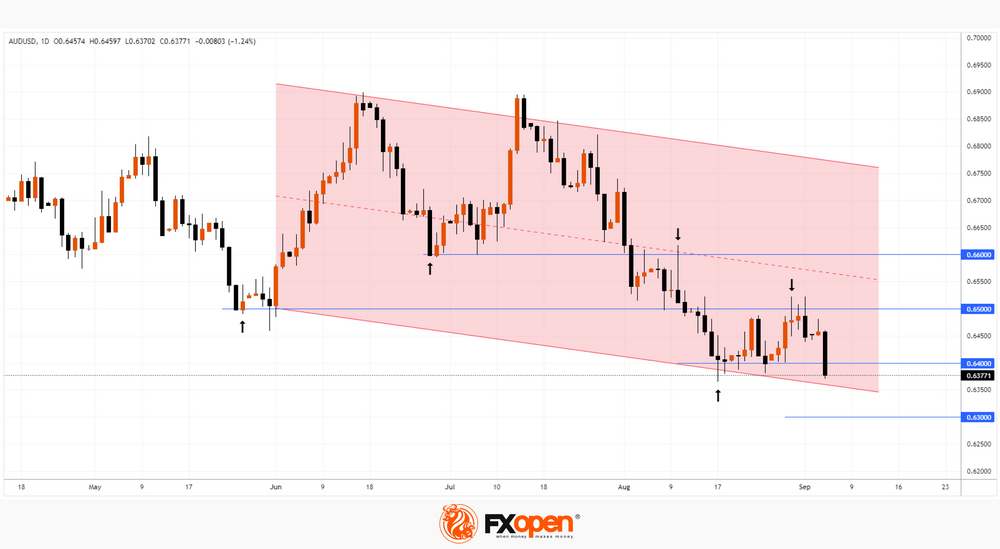
Reacting to the results of the RBA meeting, the AUD/USD rate fell to the lows of the year, to the level of 0.637.
The bullish argument is that the market may find support for the lower boundary of the descending channel. However, the price fell below the 0.64 level. It is possible that now it will work as a resistance on the principle of mirror levels — the chart shows that this was the case with the levels of 0.66 and 0.65. Following this sequence, the next bearish target is 0.63.
This article represents the opinion of the Companies operating under the FXOpen brand only. It is not to be construed as an offer, solicitation, or recommendation with respect to products and services provided by the Companies operating under the FXOpen brand, nor is it to be considered financial advice.
Australian Dollar Sinks after RBA Pause, GDP Next
- RBA holds rates for third straight time
- AUD/USD slides 1.3%
- Australian GDP expected to slow in second quarter
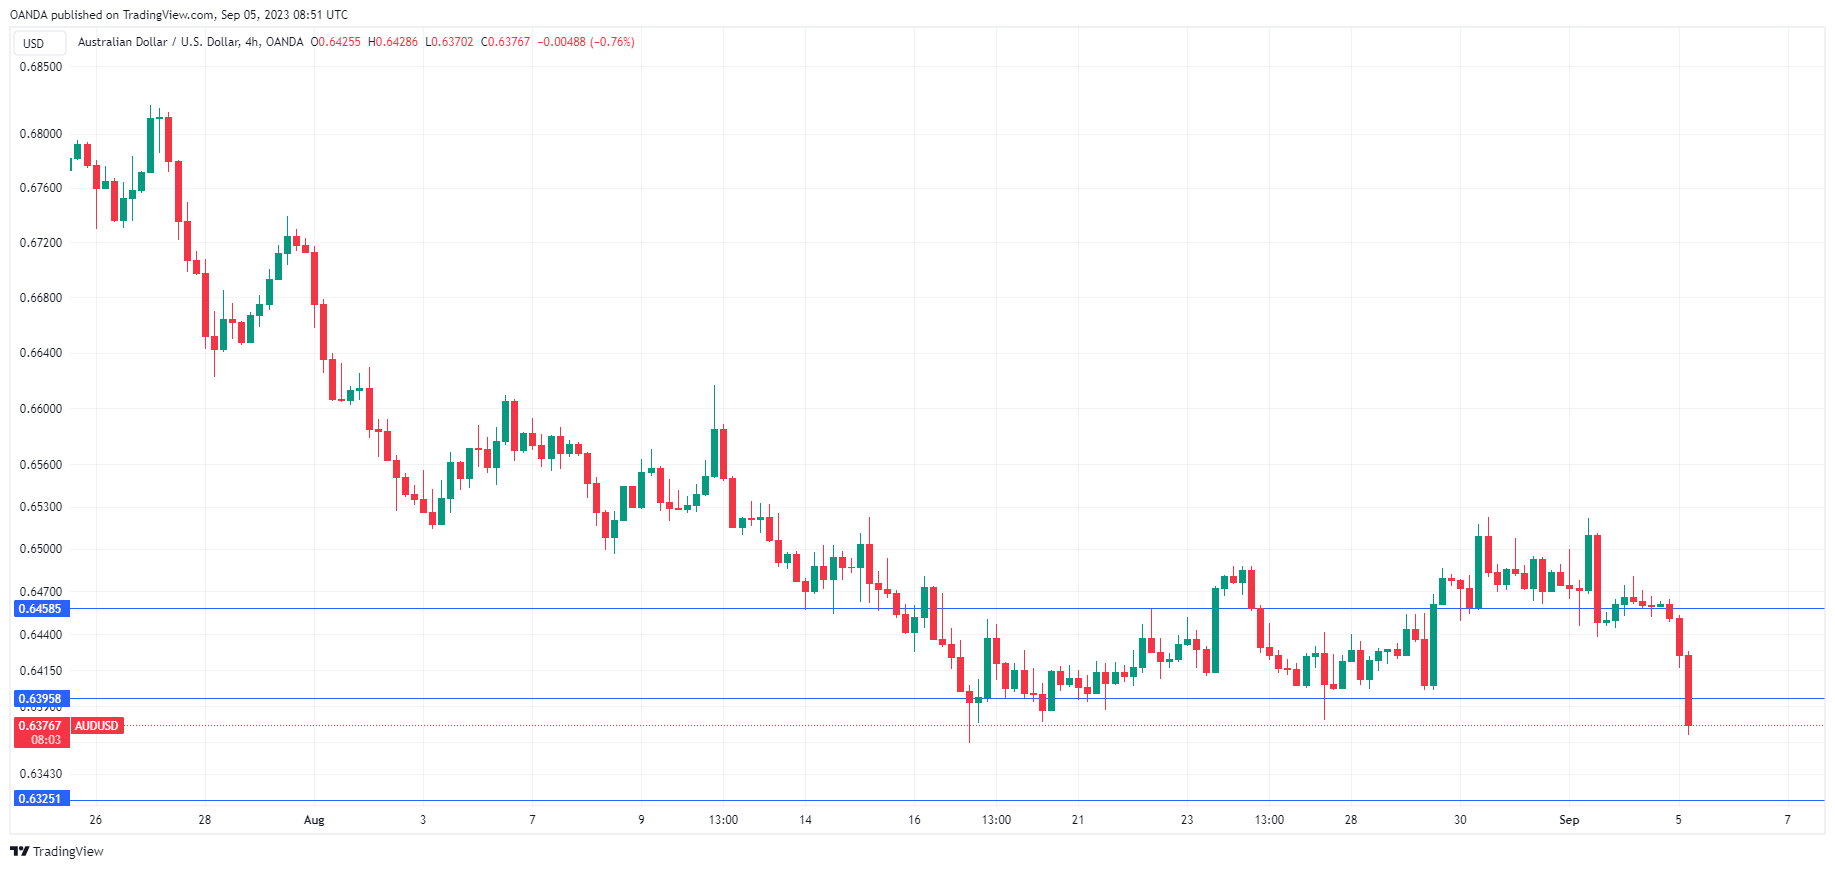
The Australian dollar has plunged on Tuesday after the Reserve Bank of Australia held rates at today’s policy meeting. In the European session, AUD/USD is trading at 0.6373, down 1.36%.
RBA holds rates, as expected
The RBA held interest rates at today’s meeting for a third straight time, maintaining the official cash rate at 4.10%. This was the final meeting chaired by Governor Philip Lowe, with some calling the pause a parting gift for mortgage owners.
The decision was widely expected, and Lowe’s rate statement was a repeat of what we’ve heard before. Lowe stated that inflation had “passed its peak” but was “still too high and will remain so for some time yet”. Lowe again kept open the possibility of further tightening, depending on the data. In a nutshell, inflation is headed in the right direction but more work lies ahead in order to bring inflation back down to the 1%-3% target range.
There were no surprises from the RBA, but that didn’t prevent the Aussie from taking a huge tumble, with the Australian dollar currently very close to an 11-month low against the US dollar. The fact that the central bank has extended its pause for a third straight time boosts the view that the RBA is done with rate hikes, barring some catastrophic economic data, has made the Australian dollar a less attractive investment. The markets will now be looking for clues about possible rate cuts, which could come sometime in 2024.
Investors will now shift their attention from the RBA hold to the GDP report for the second quarter. The economy grew by a respectable 2.3% in Q1 but is expected to slow to 1.8% in the second quarter. A reading below 1.8% will likely put further downward pressure on the shaky Australian dollar.
AUD/USD Technical
- AUD/USD pushed below support at 0.6458 and is testing support at 0.6395. Below, there is support at 0.6325
- There is resistance at 0.6458 and 0.6525
GBPUSD Downtrend Could Stay in Play
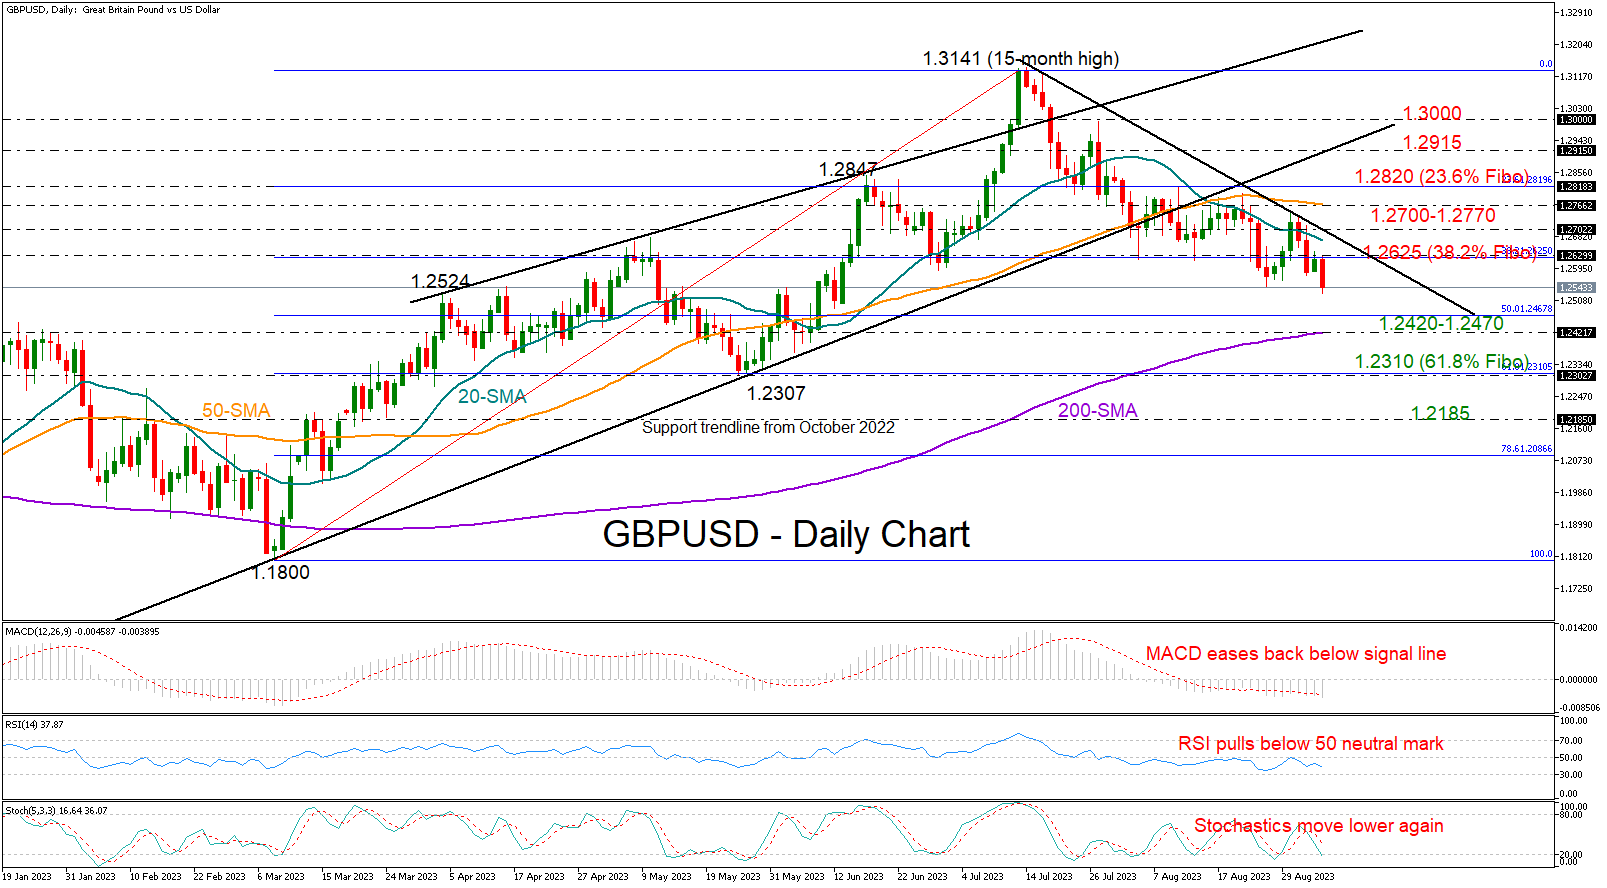
GBPUSD returned to the red zone on Tuesday, plunging to a new two-and-a-half-month low of 1.2527 after Monday’s bullish efforts evaporated immediately near the 1.2625 constraining area.
The trend has been negative since July and the bearish crossing of the 20- and 50-day SMAs is causing concern for the near future. Moreover, the technical indicators are pointing to a continuous decline as the RSI has reversed course back to the downside below its 50 neutral mark, and the MACD has plunged below its red signal line.
Selling forces could take a breather somewhere between the 50% Fibonacci mark of the 1.1800-1.3141 uptrend at 1.2470 and the 200-day SMA at 1.2420. If the bears breach that border, the downtrend could gain another leg to 1.2300, where the 61.8% Fibonacci is located. Running lower, the pair may next test the 1.2185 barrier.
On the upside, the 38.2% Fibonacci number of 1.2625 and the 20-day SMA could cap any potential increases. The bulls will have to drive above the 1.2700 round level too in order to reach the 50-day SMA at 1.2770. Then, the 23.6% Fibonacci of 1.2820 could prevent an extension towards the broken support trendline from October 2022.
In short, GBPUSD remains attractive to sellers as the pair keeps trading within a bearish environment. The next stop could be within the 1.2420-1.2470 region.
EUR/USD: Signals of Bearish Continuation After Limited Recovery
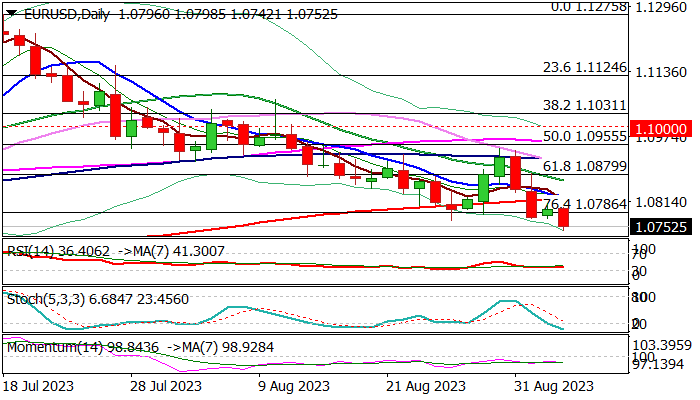
The Euro lost traction on Tuesday and fell to 2 ½ month low, after Monday’s recovery attempts proved to be just a mild consolidation.
Renewed risk aversion and series of weaker than expected Aug services PMI data from Eurozone member countries, soured the sentiment and add fresh pressure on euro.
Negative momentum is strengthening on daily chart, MA’s remain in bearish setup (diverging 10/200DMA’s on track to for a death cross) and repeated close below Fibo support at 1.0786 (76.4% of 1.0635/1.1275 rally) contribute to negative near-term outlook.
Bears eye psychological support at 1.0700, violation of which will risk extension towards key support at 1.0635 (May 31 low).
However, bears may face increased headwinds from oversold conditions, with upticks to be capped by 200DMA (1.0817) to keep bears intact and offer better selling opportunities.
Only return above 1.0880 (broken 61.8%) would question bears.
Res: 1.0786; 1.0817; 1.0880; 1.0917.
Sup: 1.0733; 1.0700; 1.0667; 1.0635.
Crypto Slipping Down
Market picture
The crypto market capitalisation declined by 0.66% to $1.038 trillion, showing several waves of decline with increasingly lower local lows. This is a sure sign that the bears are in control, and the pressure seems to be coming from the stock market, as the institutional favourites that are losing the most so far are Bitcoin (-1.1%), Ethereum (-0.9%) and XRP (-0.7%).
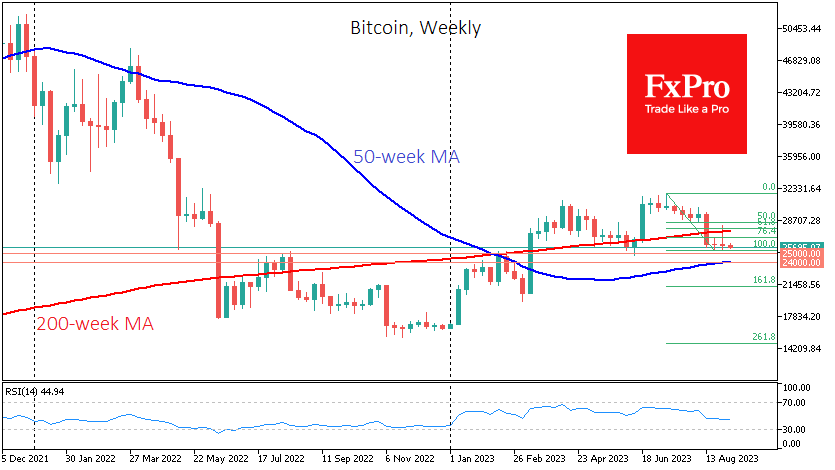
The first cryptocurrency is settling increasingly firmly in the territory below $26K. Since March, Bitcoin has been repeatedly bought on dips to this level, but it seems the support doesn’t look as strong now. A failure under $25.4K would signal the end of the corrective rebound to $28K and open the way to $21.5K. However, potentially strong support could come as early as $24K, where the 50-week moving average passes.
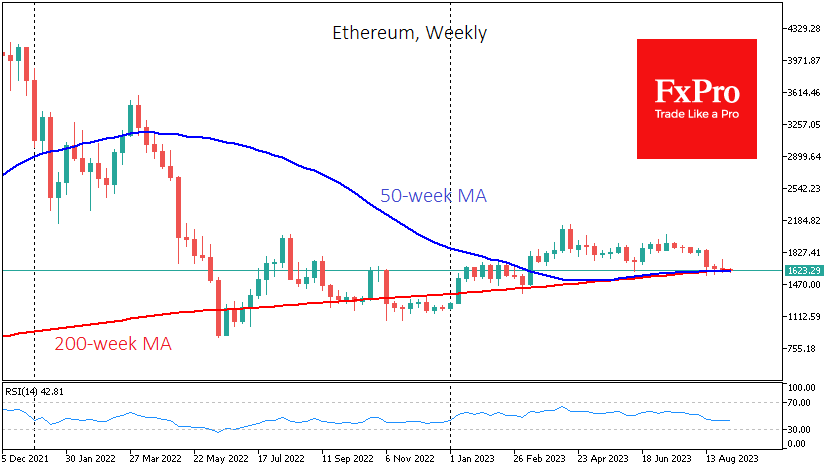
Ethereum has already intertwined the 50 and 200-week MAs and has regularly received support on dips under them over the past four weeks. It’s an open question how durable that support will be. It’s worth being prepared that a consolidation under $1600 would trigger a deeper sell-off.
News background
According to CoinShares, investment in crypto funds fell by $11 million last week; outflows have been down for 6 of the previous seven weeks. At the same time, trading volumes were 90% above average since the beginning of the year.
According to IntoTheBlock, crypto whales have invested more than $1.5bn in Bitcoin in the past two weeks, with purchases following BTC’s sharp drop in mid-August.
After the court ruling in the Grayscale case, the SEC has no choice but to approve applications to launch spot bitcoin-ETFs, JP Morgan believes. At the same time, the regulator may approve several applications at once. But that takes time to prepare, so the SEC postponed its decision until October.
The activity of a wallet linked to the bankrupt FTX exchange has raised fears of a potential cryptocurrency sell-off in the making. On 24 August, FTX announced plans to “sell, stack and hedge” $3 billion worth of its cryptocurrencies.
Eurozone PPI down -0.5% mom, -7.6% yoy in Jul
Eurozone PPI fell -0.5% mom -7.6% yoy in July, versus expectation of -0.6% mom, -7.6% yoy. For the month, Industrial producer prices decreased by -1.2% mom for intermediate goods and by -0.9% mom in the energy sector, while prices increased by 0.1% mom for non-durable consumer goods and by 0.2% mom for both capital goods and durable consumer goods. Prices in total industry excluding energy decreased by -0.4% mom.
EU PPI was down -0.6% mom, -6.6% yoy. The largest monthly decreases in industrial producer prices were recorded in Ireland (-8.1%), the Netherlands (-2.6%) and Sweden (-1.8%), while the highest increases were observed in Latvia (+2.2%), Slovakia (+1.7%) and Croatia (+1.3%).