

Sample Category Title
Canada: Retail Sales Eke Out Another Gain in June Finishing Second Quarter on a Weaker Note
Retail sales rose 0.1% month-on-month (m/m) in June, coming in a tad stronger than the flat reading reported in Statistics Canada's advance estimate. May's print was revised down to 0.1% m/m from 0.2% reported originally.
Adjusting for inflation, the volume of retail sales was 0.1% lower on the month.
Defying expectations, sales at motor vehicle and parts dealers accelerated, gaining 2.5% m/m on the back of strong demand for new cars and following an upwardly revised reading of 1.1% m/m in May (vs. 0.8% reported earlier). This category accounts for all of today's headline growth.
Receipts at gasoline stations and fuel vendors were 0.3% higher on the month but bearing a small weight they had little impact on the headline number
Excluding sales at car dealerships and gas stations, core retail sales were down 0.9% in June, below the consensus estimate of a 0.3% m/m increase. The only two categories that reported gains were miscellaneous store retailers (+1.1% m/m) and sales at furniture and home furnishings stores (+ 0.1% m/m).
The rest of the categories were in the red, with the deepest declines reported by electronics and appliance stores (-3.4% m/m) and building materials and garden equipment dealers (-1.4% m/m), general merchandise stores (-1.4% m/m), and food and beverage stores (-0.9% m/m)
E-commerce sales, which are not included in the headline tally, grew 1.1% m/m in June after an upwardly revise growth of 2.3% in May. We expect that July's reading will be supported by generous incentives of Canada's Amazon Prime days.
Statistics Canada's advanced estimate points to a solid reading of 0.4% in July.
Key Implications
Following a soft reading in May, today's marginal gains gets the second quarter's to -0.1% annualized – a notable step down from a 2.6% pace in Q1. This puts personal consumption expenditures on track for 1% annualized growth in Q2. Looking ahead, spending might still regain its footing with the help of government's grocery rebates. These were aimed at supporting lower-income households that typically have a higher propensity to consume. Like Stats Canada's advance estimate, our internal data points to a rebound in monthly spending in July.
However, by demonstrating more resilience they'll pay the price of higher cost of future borrowing (and spending). The cumulative effect of 475 basis points on interest rate hikes is only starting to have real impact on households' budgets. As more mortgages roll over at higher rates, homeowners will divert more of their income towards debt servicing. This means that retail sales could be the next in line to roll over.
USD/CAD Mid-Day Outlook
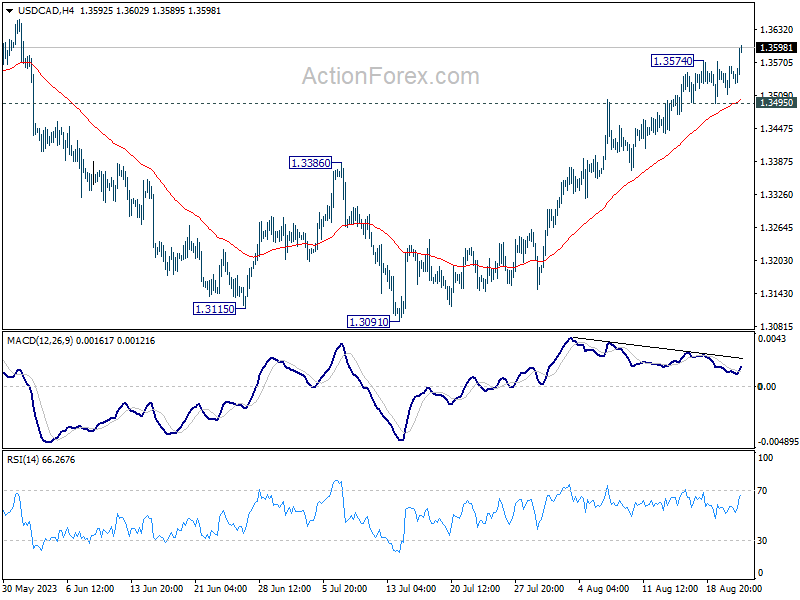
Daily Pivots: (S1) 1.3521; (P) 1.3543; (R1) 1.3573; More....
USD/CAD's rally resumed after brief consolidations and intraday bias is back on the upside for 1.3653 resistance first. Decisive break there will confirm that correction from 1.3976 has completed, a target a test on this high. On the downside, break of 1.3495 support is needed to indicate short term topping. Otherwise, outlook will remain cautiously bullish in case of retreat.
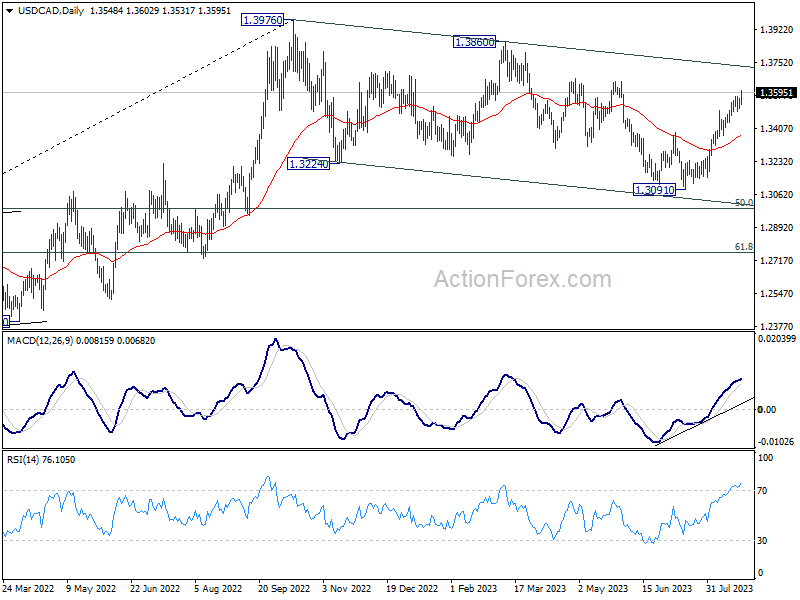
In the bigger picture, price actions from 1.3976 are viewed as a corrective fall only. Upon completion, rise from 1.2005 (2021 low) would resume through 1.3976. Next target is 61.8% projection of 1.2005 to 1.3976 from 1.3091 at 1.4309. In case of another fall, downside should be contained by 61.8% retracement of 1.2005 to 1.3976 at 1.2758.
USD/JPY Mid-Day Outlook
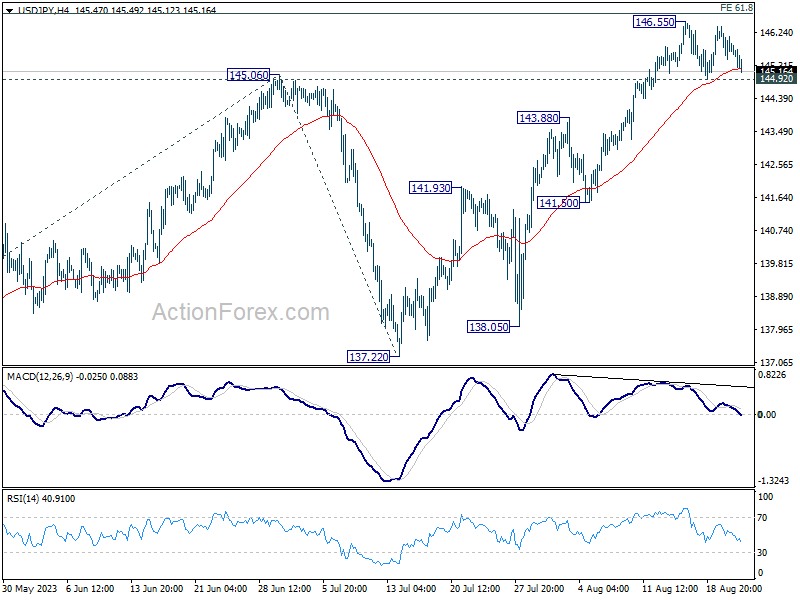
Daily Pivots: (S1) 145.46; (P) 145.93; (R1) 146.36; More...
Intraday bias in USD/JPY remains neutral as it's still bounded in sideway trading. On the upside, sustained break of 61.8% projection of 129.62 to 145.06 from 137.22 at 146.76 will pave the way to retest 151.93 high. However, considering bearish divergence condition in 4H MACD, firm break of 44.92 support will be a sign of reversal, and turn bias back to the downside for 55 D EMA (now at 142.09).
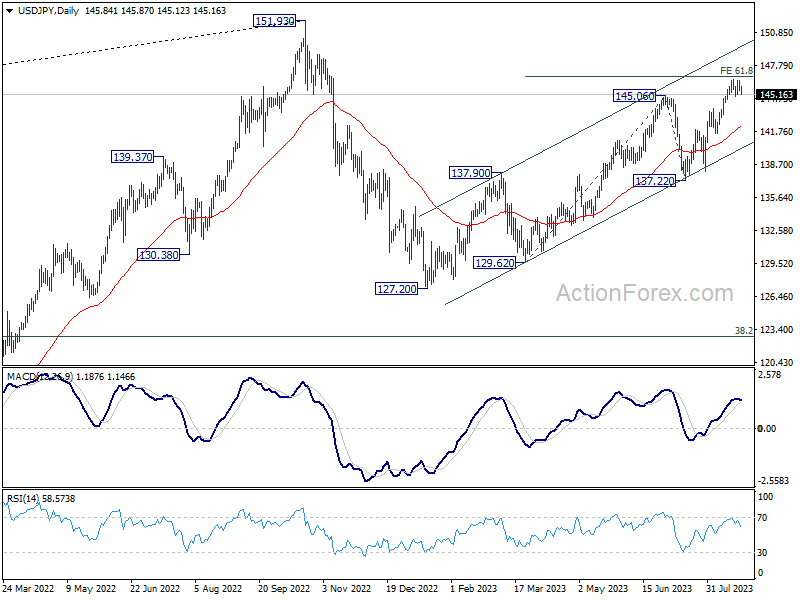
In the bigger picture, overall price actions from 151.93 (2022 high) are views as a corrective pattern. Rise from 127.20 is seen as the second leg of the pattern and could still be in progress. But even in case of extended rise, strong resistance should be seen from 151.93 to limit upside. Meanwhile, break of 137.22 support should confirm the start of the third leg to 127.20 (2023 low) and below.
USD/CHF Mid-Day Outlook
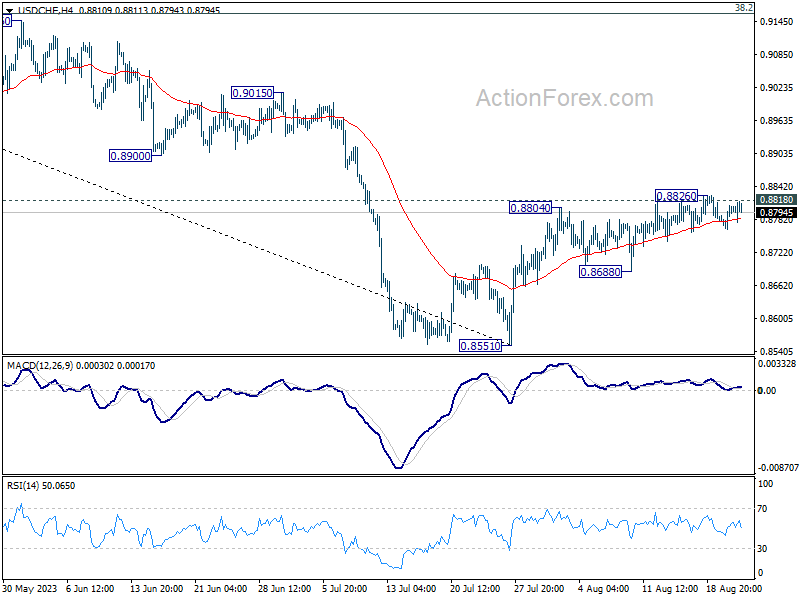
Daily Pivots: (S1) 0.8777; (P) 0.8794; (R1) 0.8821; More....
No change in USD/CHF's outlook as range trading continues. Intraday bias remains neutral for the moment. On the upside, decisive break of 0.8818 support turned resistance will carry larger bullish implication, and target 0.9146 cluster resistance next. However, break of 0.8688 support will indicate rejection by 0.8818, and turn bias back to the downside for retesting 0.8551 low.
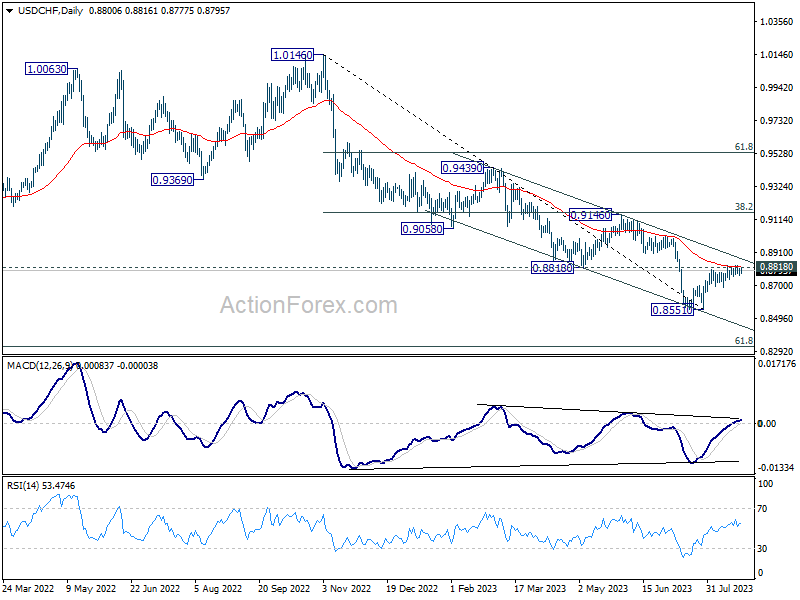
In the bigger picture, a medium term bottom could be in place at 0.8551 already, on bullish convergence condition in D MACD. Sustained trading above 0.8818 support turned resistance will bring further rise to 0.9146 cluster resistance (38.2% retracement of 1.0146 to 0.8551 at 0.9160), even as a correction. Nevertheless, break of 0.8851 will resume the down trend from 1.0146 instead.
GBP/USD Mid-Day Outlook
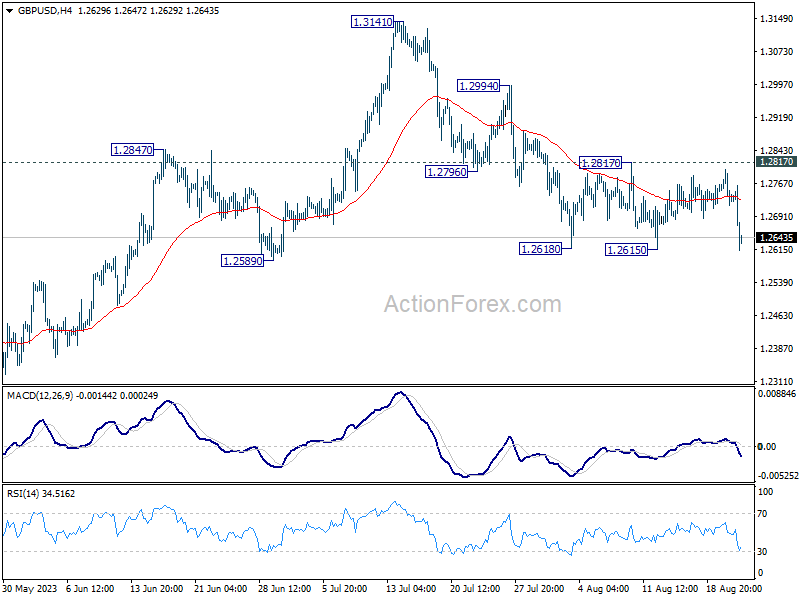
Daily Pivots: (S1) 1.2701; (P) 1.2750; (R1) 1.2782; More...
Immediate focus is now on 1.2615 support in GBP/USD with today's steep fall. Decisive break there, and sustained trading below 1.2678 resistance turned support will argue that it's already in a larger correction. Deeper decline would then be seen to 1.2306 support next. Nevertheless, break of 1.2817 minor resistance will indicate that the pull back from 1.3141 has completed, and turn bias back to the upside for stronger rebound.
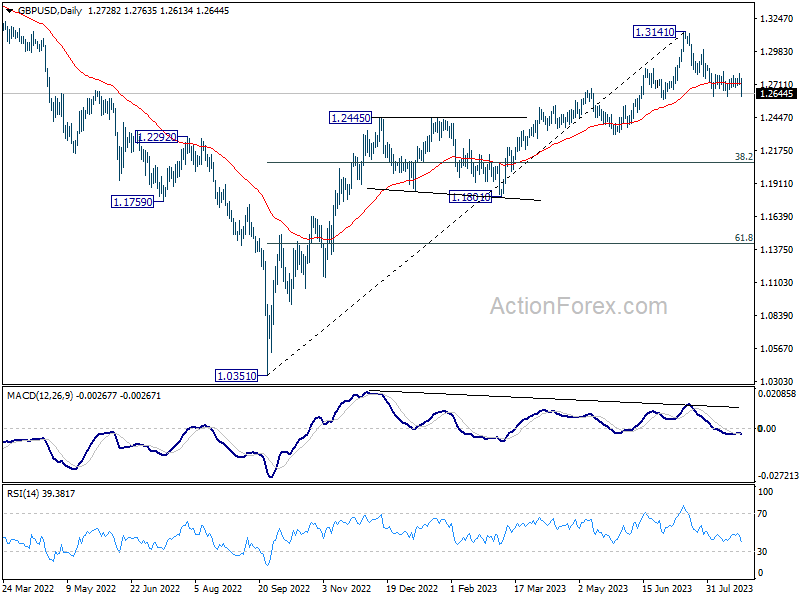
In the bigger picture, a medium term top could be in place at 1.3141 already, on bearish divergence condition in D MACD. Sustained trading below 55 D EMA (now at 1.2723) should confirm this case, and bring deeper fall to 38.2% retracement of 1.0351 to 1.3141 at 1.2075, as a correction to up trend from 1.0351 (2022 low). For now, rise will stay mildly on the downside as long as 1.3141 resistance holds, in case of strong rebound.
EUR/USD Mid-Day Outlook
Daily Pivots: (S1) 1.0809; (P) 1.0870; (R1) 1.0907; More...
EUR/USD's fall from 1.1274 resumes today by breaking 1.0832 support. Intraday bias is back on the downside for 1.0609/34 cluster support next. For now, break of 1.0929 resistance is needed to indicate short term bottoming. Otherwise, outlook will stay mildly bearish in case of recovery.
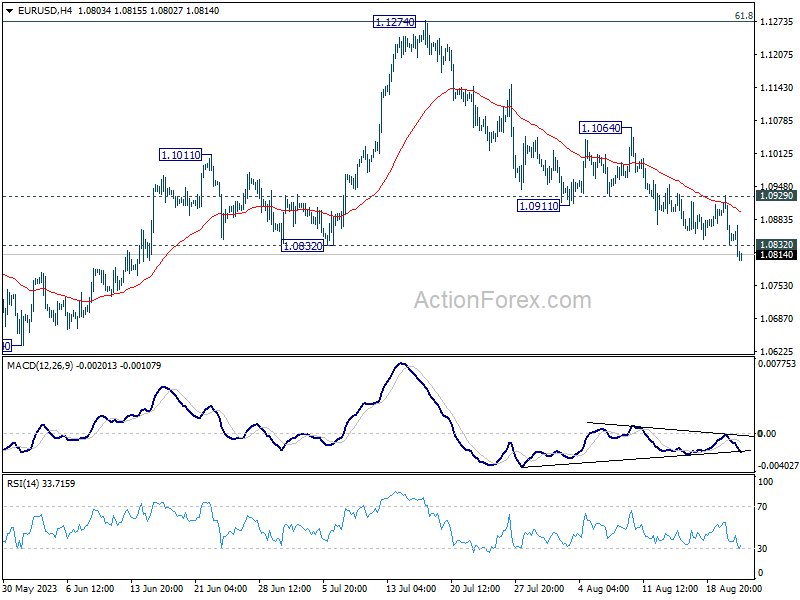
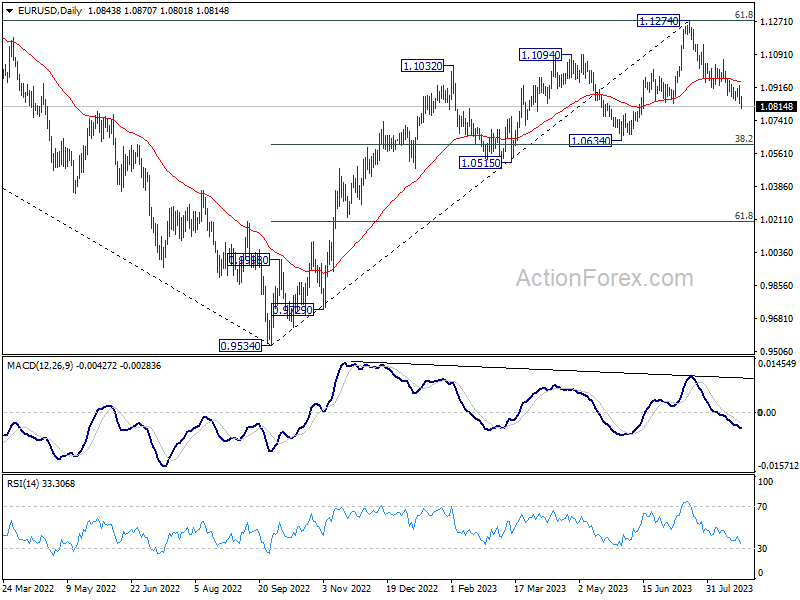
In the bigger picture, a medium term top should be formed at 1.1274, after failing to break through 61.8% retracement of 1.2348 (2021 high) to 0.9534 at 1.1273 decisively, on bearish divergence condition in D MACD. Fall from there is seen as a correction to the uptrend from 0.9534 (2022 low). Deeper decline would be seen to 1.0634 cluster support (38.2% retracement of 0.9534 to 1.1274 at 1.0609). Strong support could be seen there, at least on first attempt, to set the range for consolidation. Yet, medium term outlook will be neutral for now, as long as 1.1274 resistance holds.
PMI Woes Shoot Euro and Sterling Down; Yen and Dollar Seize the Opportunity
Sterling and Euro faced a sharp drop today after alarming PMI readings unveiled an unanticipated rapid decline in the service sectors of both the UK and Eurozone. The days of service-driven economic growth seem to be in the rearview mirror, with signs indicating probable contractions in the third quarter for both regions. Canadian Dollar also felt the weight, taking a hit after core retail sales showed a larger-than-expected contraction, making it the day's third weakest currency.
In a turn of events, Yen emerged as the day's star performer, capitalizing on the notable drops in German and UK benchmark yields. Dollar, riding on the coat-tails of Yen's performance, positioned itself as the second strongest, followed by Swiss Franc. This shift suggests a growing trend towards risk-averse sentiment in the market. Meanwhile, both Aussie and Kiwi present a mixed bag, but display vulnerability against their Dollar and Yen counterparts.
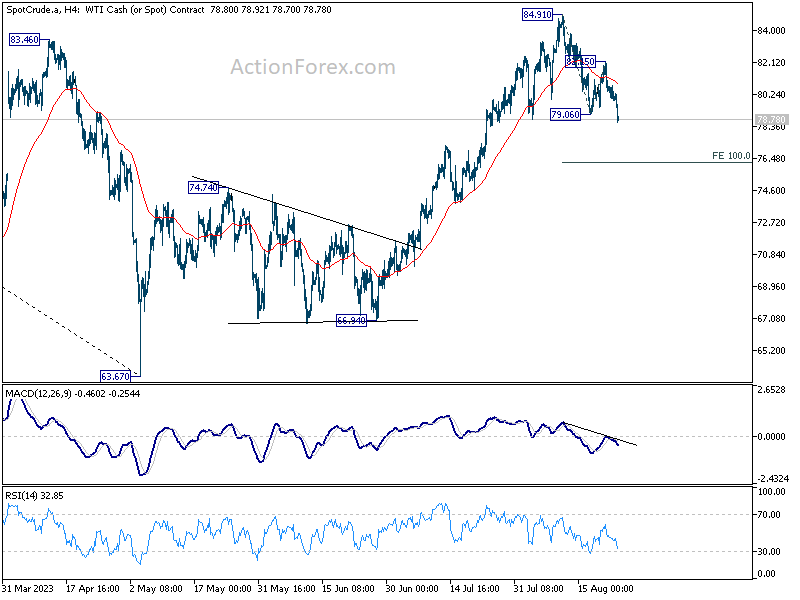
Technically, WTI crude oil's break of 79.06 support today suggests that fall from 84.91 has resumed. Deeper decline is now expected as long as 82.15 resistance holds, to 100% projection of 84.91 to 79.06 from 82.15 at 76.30. Decisive break there will bolster that case that whole rebound from 63.67 has finished too, and target74.74 resistance turned support next. Any downside acceleration in WTI might further strain the already-pressured Canadian Dollar.
In Europe, at the time of writing, FTSE is up 0.67%. DAX is down -0.09%. CAC is down -0.06%. Germany 10-year yield is down -0.0748 at 2.570. Earlier in Asia, Nikkei rose 0.48%. Hong Kong HSI rose 0.31%. China Shanghai SSE dropped -1.34%. Singapore Strait Times rose 0.45%. Japan 10-year JGB yield is up 0.0058 at 0.677.
Canada retail sales up 0.1% mom in Jun
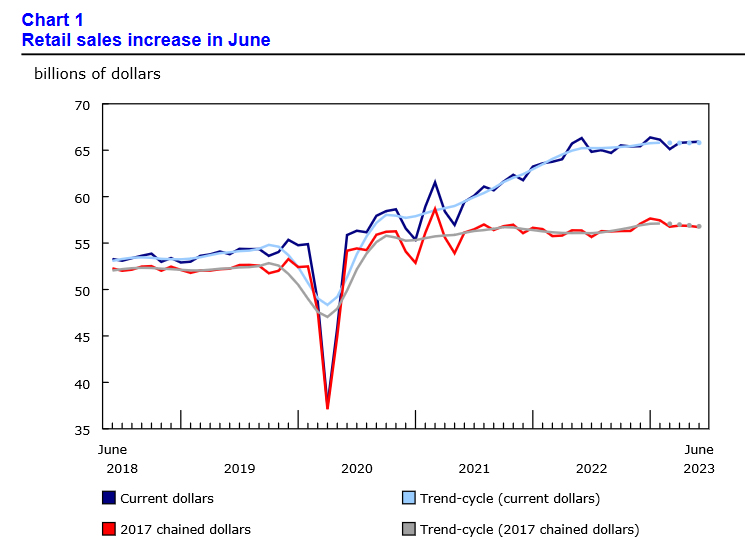
Canada retail sales rose 0.1% mom to CAD 65.9B in June, above expectation of 0.0% mom. Excluding gasoline stations and fuel, motor vehicle and parts dealers, sales were down -0.9% mom. In volume terms, retail sales dropped -0.2% mom.
For Q2 as a whole, sales were unchanged in value terms, and down -0.8% qoq in volume terms.
Advance estimate suggests that sales rose 0.4% mom in July.
UK PMI composite fell to 31-mth low, inflation fight carries a heavy cost
UK PMI Manufacturing fell from 45.3 to 41.5 in August, a 39-month low, and missed expectation of 45.1. PMI Services fell from 51.5 to 48.7, a 7-month low, below expectation of 50.8. PMI Composite fell from 50.8 to 47.9, a 31-month low, and first contraction since January.
Chris Williamson, S&P Global Market Intelligence's Chief Business Economist, commented on the data's implications: "The early PMI survey for August suggests that inflation should moderate further in the months ahead, but also indicates that the fight against inflation is carrying a heavy cost in terms of heightened recession risks.
The numbers tell a story of a stalling economy. The service sector's earlier signs of rejuvenation are waning, and the manufacturing sector's decline is becoming more pronounced. Williamson added that the data suggests a -0.2% contraction in GDP for Q3."
He also alluded to the broader monetary implications, noting, "While a further hike in interest rates in September looks to be on the cards, the August PMI data will add to speculation that rates could soon peak."
Eurozone PMI composite fell to 33-mth low, services downturn mirroring manufacturing
Eurozone PMI Manufacturing rose from 42.7 to 43.7 in August, above expectation of 42.8. However, the services sector took a hit, with its PMI descending to a 30-month low of 48.3 – the first contraction witnessed since December, and missed expectation of 50.5. Consequently, the Composite PMI declined to 47.0, its lowest in 33 months, and, excluding pandemic months, since April 2013.
Cyrus de la Rubia, Chief Economist at Hamburg Commercial Bank, weighed in that services downturn is now mirroring the lackluster performance of manufacturing. He anticipates a -0.2% contraction in the Eurozone's Q3 based on current indicators.
August's data echoes ECB President Christine Lagarde's warning about rising wages and declining productivity potentially boosting inflation. "as a result, the ECB may be more reluctant to pause the hiking cycle in September," de la Rubia commented.
Despite the broader decline, there's a semblance of hope for manufacturing. The sector's PMI showed minor improvement, hinting at a potential gradual recovery by early next year.
A notable contributor to the downturn was Germany's swift service sector contraction which fuels the discussion of "Germany being the sick man of Europe."
Germany PMI Manufacturing ticked up from 38.8 to 39.1 in August. PMI Manufacturing Output fell from 41.0 to 39.7, a 39-month low. PMI Services tumbled sharply from 52.3 to 47.3, a 9-month low. PMI Composite dropped from 48.5 to 44.7, a 39-month low.
France's Manufacturing PMI rose to 46.4 in August, up from 45.1. However, Services sector presented concerns, declining to a 30-month low at 46.7, with the Composite PMI holding steady at 46.6.
Japan PMI manufacturing ticked up to 49.7, services rose to 54.3
In August, Japan's Service PMI climbed from 53.8 to 54.3, while the Manufacturing PMI saw a slight increase from 49.6 to 49.7, just above anticipated figures. The Composite PMI also edged up from 52.2 to 52.6.
Andrew Harker, from S&P Global Market Intelligence, pointed out the robust performance of the service sector, driven by consistent new order growth. In contrast, manufacturing only marginally rebounded but remained below the growth threshold.
Despite the overall rise in new orders, manufacturing employment remained flat, ending its 28-month growth streak. Additionally, heightened oil prices impacted both sectors, causing the steepest rise in input costs in four months. Notably, business confidence dwindled in both domains due to longer-term economic uncertainties.
Australian PMI hits 19-month low, but concerns on inflation and strong employment rise
Australia's August PMI data showed a concerning decline across sectors. The Manufacturing PMI slightly decreased from 49.6 to 49.4, while Services PMI dropped to a 19-month low of 46.7. Composite PMI, reflecting both sectors, also declined to a 19-month low of 47.1.
Warren Hogan, Chief Economic Advisor at Judo Bank, drew attention to the employment sector's resilience. He noted, "Despite weakening PMI figures, the employment index remains positive, indicating robust labour demand across both manufacturing and services."
With businesses maintaining optimism, they might resist workforce reductions even amidst economic slowdowns. "As aggregate demand is supported by ongoing employment growth... it might mean a further substantial lift in interest rates could be required at some stage in the next 6-12 months," he added.
Inflation remains a key concern. After 2022 disinflation trend, 2023 has shown a halt in the falling price indexes. The current data suggests an inflation rate of about 4%, overshooting the RBA's 2-3% target range.
Hogan also noted wage growth concerns. Even with modest official growth figures, he cautioned that wage pressures might exceed RBA's forecasted 4% annual growth for 2023. "This may mean firm tightening bias to the RBA's policy deliberations for the rest of the year."
NZ retail sales volume down -1.0% qoq in Q2, value down -0.2% qoq
New Zealand's retail sales volume for Q2 plummeted by -1.0% qoq, settling at NZD 25B. This decline starkly contrasts with market forecasts which had anticipated a milder contraction of just -0.2% qoq. A broad-based slump was evident, as 11 out of 15 industries reported reduced seasonally adjusted sales volumes.
Highlighting the sectors that bore the brunt of this downturn, food and beverage services saw a sharp decline of -4.4%. Hardware, building, and garden supplies trailed closely, recording a -4.8% drop. These sectors emerged as the primary drags on the overall sales volume for the quarter.
While sales volume took a hit, retail sales value also showed signs of weakness, contracting -0.2% qoq to land at NZD 30B. Once again showcasing the breadth of the downturn, seven out of 15 industries registered a fall.
EUR/USD Mid-Day Outlook
Daily Pivots: (S1) 1.0809; (P) 1.0870; (R1) 1.0907; More...
EUR/USD's fall from 1.1274 resumes today by breaking 1.0832 support. Intraday bias is back on the downside for 1.0609/34 cluster support next. For now, break of 1.0929 resistance is needed to indicate short term bottoming. Otherwise, outlook will stay mildly bearish in case of recovery.
In the bigger picture, a medium term top should be formed at 1.1274, after failing to break through 61.8% retracement of 1.2348 (2021 high) to 0.9534 at 1.1273 decisively, on bearish divergence condition in D MACD. Fall from there is seen as a correction to the uptrend from 0.9534 (2022 low). Deeper decline would be seen to 1.0634 cluster support (38.2% retracement of 0.9534 to 1.1274 at 1.0609). Strong support could be seen there, at least on first attempt, to set the range for consolidation. Yet, medium term outlook will be neutral for now, as long as 1.1274 resistance holds.
Economic Indicators Update
| GMT | Ccy | Events | Actual | Forecast | Previous | Revised |
|---|---|---|---|---|---|---|
| 22:45 | NZD | Retail Sales Q/Q Q2 | -1.00% | -0.20% | -1.40% | -1.60% |
| 22:45 | NZD | Retail Sales ex Autos Q/Q Q2 | -1.80% | -0.10% | -1.10% | -1.60% |
| 23:00 | AUD | Manufacturing PMI Aug P | 49.4 | 49.6 | ||
| 23:00 | AUD | Services PMI Aug P | 46.7 | 47.9 | ||
| 00:30 | JPY | Manufacturing PMI Aug P | 49.7 | 49.6 | 49.6 | |
| 07:15 | EUR | France Manufacturing PMI Aug P | 46.4 | 45.2 | 45.1 | |
| 07:15 | EUR | France Services PMI Aug P | 46.7 | 47.3 | 47.1 | |
| 07:30 | EUR | Germany Manufacturing PMI Aug P | 39.1 | 38.7 | 38.8 | |
| 07:30 | EUR | Germany Services PMI Aug P | 47.3 | 51.5 | 52.3 | |
| 08:00 | EUR | Eurozone Manufacturing PMI Aug P | 43.7 | 42.8 | 42.7 | |
| 08:00 | EUR | Eurozone Services PMI Aug P | 48.3 | 50.5 | 50.9 | |
| 08:30 | GBP | Manufacturing PMI Aug P | 42.5 | 45.1 | 45.3 | |
| 08:30 | GBP | Services PMI Aug P | 48.7 | 50.8 | 51.5 | |
| 12:30 | CAD | Retail Sales M/M Jun | 0.10% | 0.00% | 0.20% | 0.10% |
| 12:30 | CAD | Retail Sales ex Autos M/M Jun | -0.80% | 0.30% | 0.00% | -0.30% |
| 13:45 | USD | Manufacturing PMI Aug P | 48.9 | 49 | ||
| 13:45 | USD | Services PMI Aug P | 52.4 | 52.3 | ||
| 14:00 | USD | New Home Sales Jul | 708K | 697K | ||
| 14:00 | EUR | Eurozone Consumer Confidence Aug P | -14 | -15 | ||
| 14:30 | USD | Crude Oil Inventories | -2.9M | -6.0M |
Canada retail sales up 0.1% mom in Jun
Canada retail sales rose 0.1% mom to CAD 65.9B in June, above expectation of 0.0% mom. Excluding gasoline stations and fuel, motor vehicle and parts dealers, sales were down -0.9% mom. In volume terms, retail sales dropped -0.2% mom.
For Q2 as a whole, sales were unchanged in value terms, and down -0.8% qoq in volume terms.
Advance estimate suggests that sales rose 0.4% mom in July.
Australian Dollar Steady After Lackluster PMIs
- Australia’s manufacturing and services PMIs ease in August
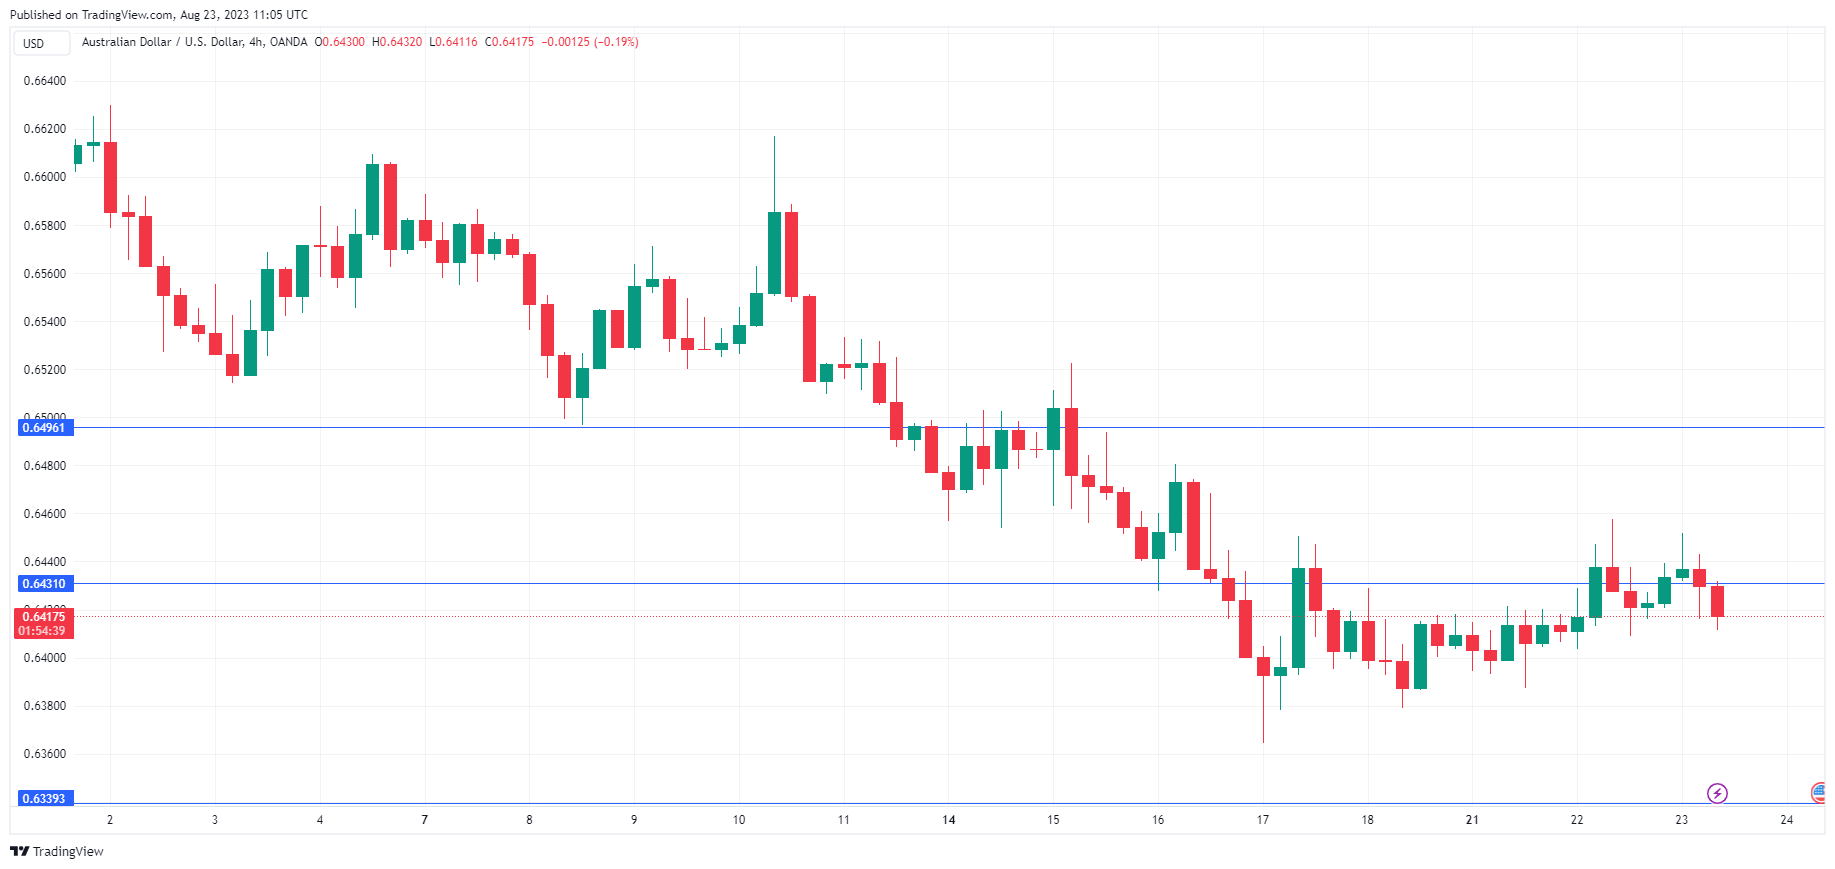
The Australian dollar is slightly lower on Wednesday. In the European session, AUD/USD is trading at 0.6416, down 0.07%. For a second straight day, the Australian dollar made some headway but then retreated.
There are no tier-1 events out of Australia this week, and not surprisingly, AUD/USD is having a sleepy week. On Wednesday, Australia released the August PMI reports which pointed to a contraction in manufacturing and services (the 50.0 line separates contraction from expansion).
Australia’s manufacturing sector continues to sputter and has declined for six consecutive months. The manufacturing PMI eased to 49.4 in August, down marginally from 49.6 in July. New orders are down which has led to less output, and there’s little room for optimism as there are no signs of global demand picking up. China, Australia’s largest trading partner, is experiencing deflation and a deteriorating economy, which will add to the manufacturing sector’s woes.
The services sector has also been struggling, although Services PMI reeled off three straight months of growth earlier in the year. In August, the PMI fell from 47.9 to 46.7 points. This marks the lowest level in 19 months. The PMI data is further proof of a slowdown in the Australian economy, which will lend support to the Reserve Bank of Australia easing up on interest rate hikes. The tricky task for the central bank is to follow a rate path that will cool the economy and guide it to a soft landing without causing a recession. The RBA took a pause in August and the futures markets are widely expecting a second pause at the September meeting.
AUD/USD Technical
- AUD/USD tested resistance at 0.6431 earlier. Next, there is resistance at 0.6496
- There is support at 0.6339 and 0.6274
EUR/USD Eyes Recovery While USD/JPY Corrects Lower
EUR/USD started a fresh decline from 1.0930. USD/JPY is correcting gains and might test the 144.90 support in the near term.
Important Takeaways for EUR/USD and USD/JPY Analysis Today
- The Euro started a fresh decline below the 1.0880 support.
- There was a break below a key bullish trend line with support at 1.0890 on the hourly chart of EUR/USD at FXOpen.
- USD/JPY struggled near 146.40 and recently started a downside correction.
- There is a major bearish trend line forming with resistance near 145.85 on the hourly chart at FXOpen.
EUR/USD Technical Analysis
On the hourly chart of EUR/USD at FXOpen, the pair started a fresh decline from the 1.0930 zone. The Euro declined below the 1.0910 support zone to enter a bearish zone against the US Dollar as mentioned in the previous analysis.
There was a break below a key bullish trend line with support at 1.0890. The pair even settled below the 1.0880 zone and the 50-hour simple moving average. A low is formed near 1.0832 and the pair is now correcting losses above the 23.6% Fib retracement level of the recent decline from the 1.0930 swing high to the 1.0832 low.
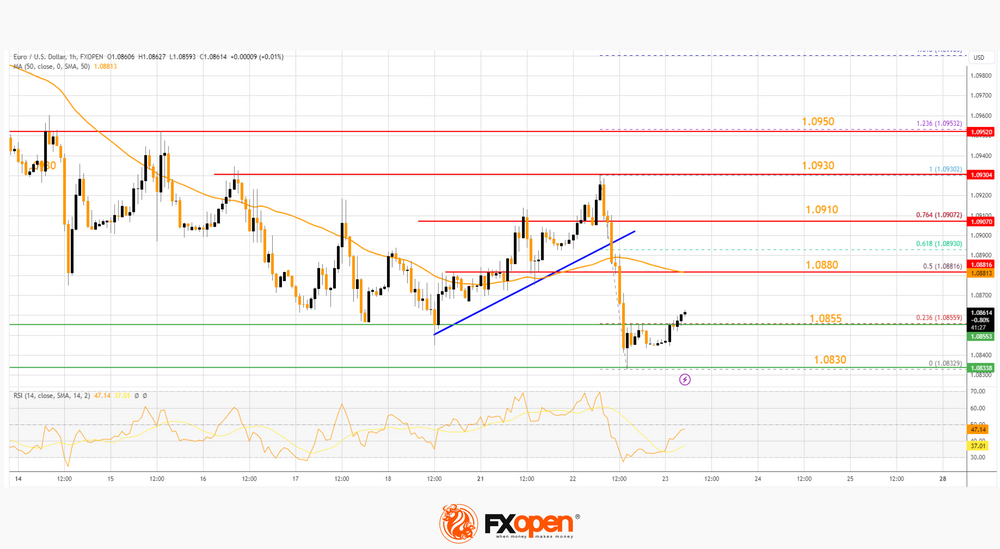
On the upside, the pair is now facing resistance near the 50-hour simple moving average at 1.0880. It is close to the 50% Fib retracement level of the recent decline from the 1.0930 swing high to the 1.0832 low.
The next major resistance is near 1.0910. The main resistance is still near 1.0930. An upside break above 1.0930 could set the pace for another increase. In the stated case, the pair might rise toward 1.1000.
If not, the pair might resume its decline. The first major support on the EUR/USD chart is near 1.0830. The next key support is near 1.0800. If there is a downside break below 1.0800, the pair could drop toward 1.0765. The next support is near 1.0750, below which the pair could start a major decline.
USD/JPY Technical Analysis
On the hourly chart of USD/JPY at FXOpen, the pair started a decent increase from the 145.00 zone. The US Dollar gained bullish momentum above 145.50 against the Japanese Yen.
The pair even climbed above 146.00 before the bears appeared near 146.40. As a result, the pair started a downside correction below the 50-hour simple moving average and 143.00. There was a move below the 50% Fib retracement level of the upward move from the 144.92 swing low to the 146.40 high.
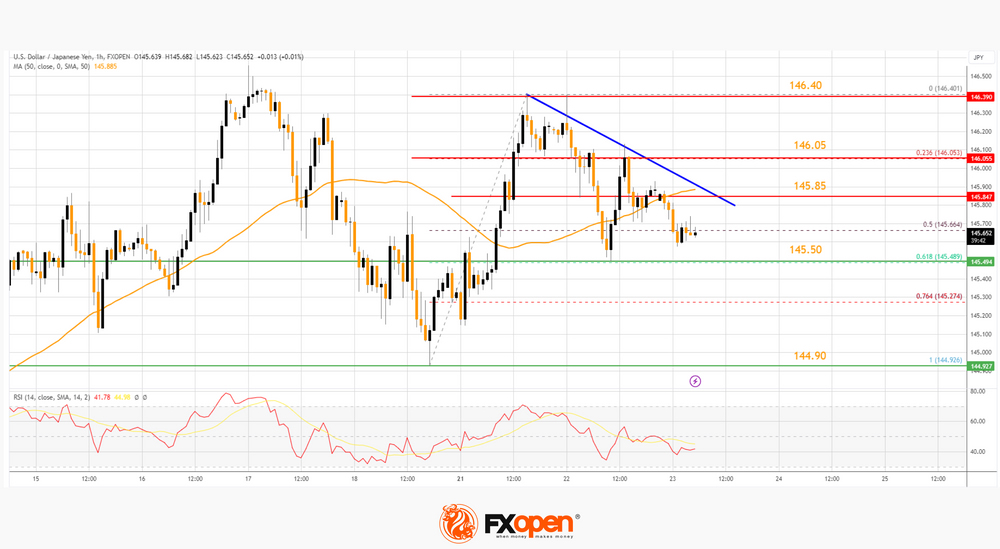
Besides, there is a major bearish trend line forming with resistance near 145.85. On the downside, the first major support is near the 61.8% Fib retracement level of the upward move from the 144.92 swing low to the 146.40 high at 145.50.
A downside break below the 145.50 support might spark strong bearish moves. The next major support is near 144.90. If there is a close below 144.90, the pair could decline steadily.
In the stated case, the pair might drop toward 144.20. The next stop for the bears may perhaps be near the 143.50 zone. Immediate resistance on the USD/JPY chart is near the 50-hour simple moving average and the trend line at 145.85.
If there is a close above the 145.85 level and RSI moves above 50, the pair could rise toward 146.05. The next major resistance is near 146.40, above which the pair could test 148.00 in the coming days.
This article represents the opinion of the Companies operating under the FXOpen brand only. It is not to be construed as an offer, solicitation, or recommendation with respect to products and services provided by the Companies operating under the FXOpen brand, nor is it to be considered financial advice.