Sample Category Title
USD/JPY Daily Outlook
Daily Pivots: (S1) 144.29; (P) 145.10; (R1) 145.65; More...
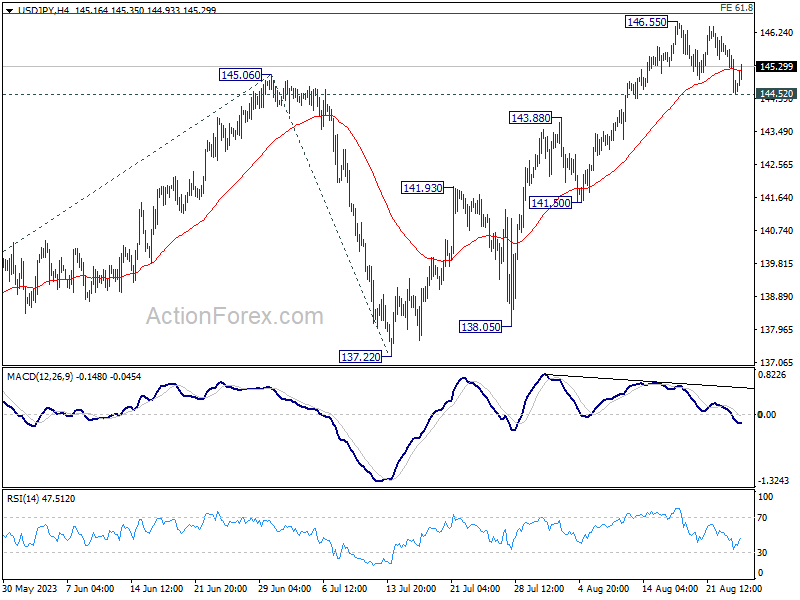
USD/JPY quickly recovered after dipping to 144.52 and intraday bias stays neutral first. On the upside, sustained break of 61.8% projection of 129.62 to 145.06 from 137.22 at 146.76 will pave the way to retest 151.93 high. However, considering bearish divergence condition in 4H MACD, firm break of 144.52 support will be a sign of reversal, and turn bias back to the downside for 55 D EMA (now at 142.30).
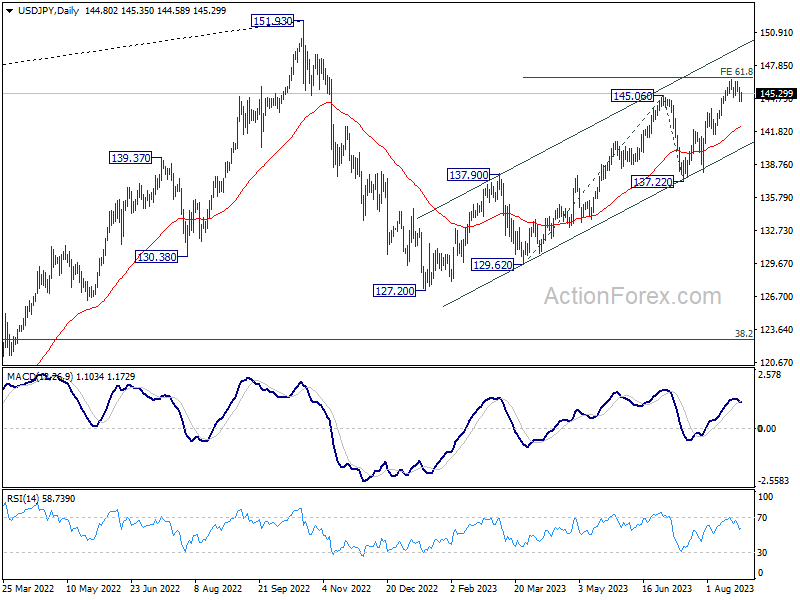
In the bigger picture, overall price actions from 151.93 (2022 high) are views as a corrective pattern. Rise from 127.20 is seen as the second leg of the pattern and could still be in progress. But even in case of extended rise, strong resistance should be seen from 151.93 to limit upside. Meanwhile, break of 137.22 support should confirm the start of the third leg to 127.20 (2023 low) and below.
USD/CHF Daily Outlook
Daily Pivots: (S1) 0.8763; (P) 0.8790; (R1) 0.8806; More....
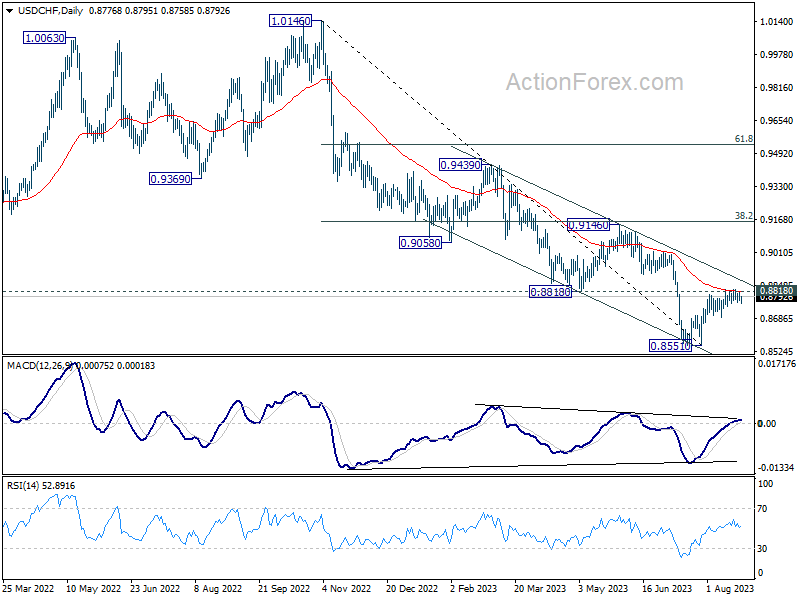
USD/CHF is still extending sideway trading and intraday bias stays neutral. On the upside, decisive break of 0.8818 support turned resistance will carry larger bullish implication, and target 0.9146 cluster resistance next. However, break of 0.8688 support will indicate rejection by 0.8818, and turn bias back to the downside for retesting 0.8551 low.
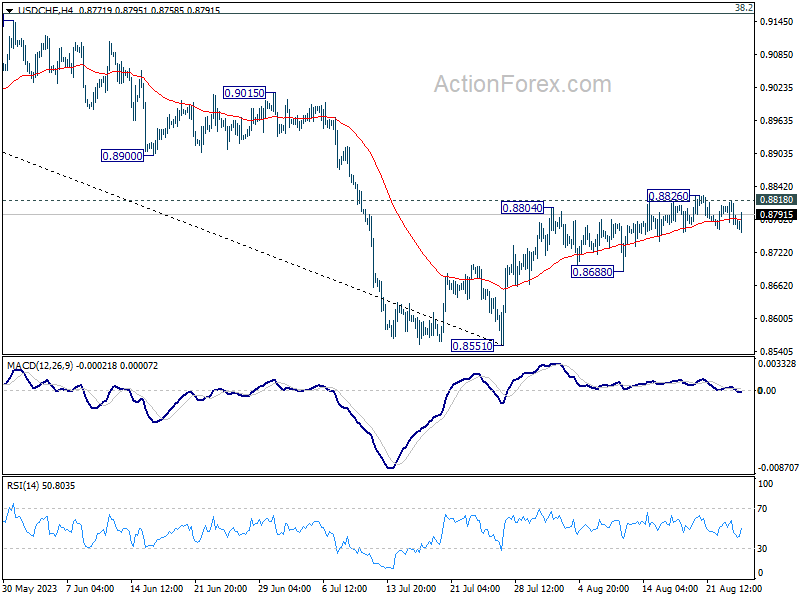
In the bigger picture, a medium term bottom could be in place at 0.8551 already, on bullish convergence condition in D MACD. Sustained trading above 0.8818 support turned resistance will bring further rise to 0.9146 cluster resistance (38.2% retracement of 1.0146 to 0.8551 at 0.9160), even as a correction. Nevertheless, break of 0.8851 will resume the down trend from 1.0146 instead.
EUR/USD Daily Outlook
Daily Pivots: (S1) 1.0820; (P) 1.0846; (R1) 1.0888; More...
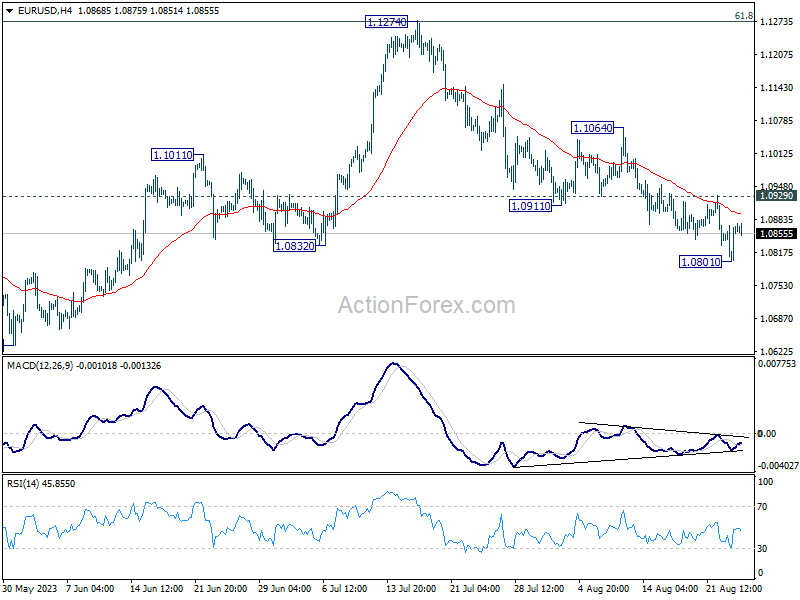
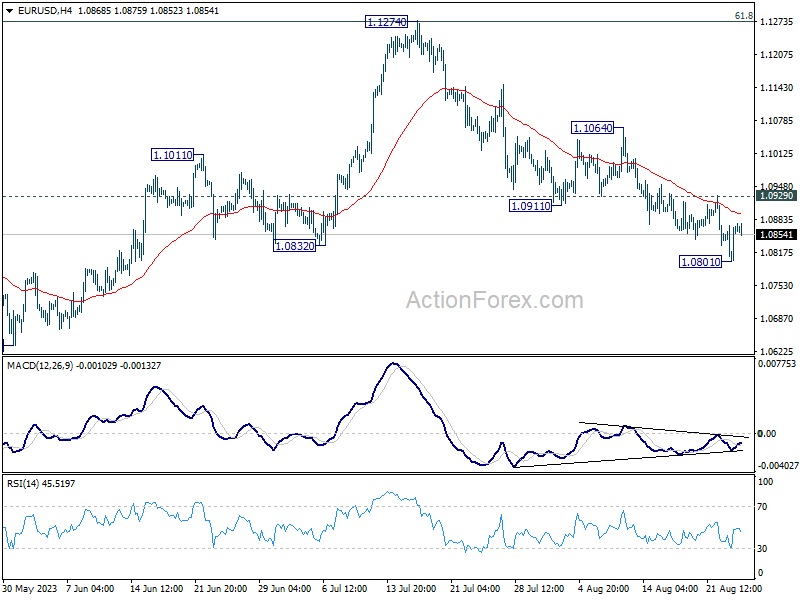
Intraday bias in EUR/USD is turned neutral again as it recovered quickly after dipping to 1.0801. Further fall is expected as long as 1.0929 resistance holds. Below 1.0801 will resume the decline from 1.1274 to 1.0609/34 cluster support next. Nevertheless, break of 1.0929 will turn bias back to the upside for stronger rebound instead.
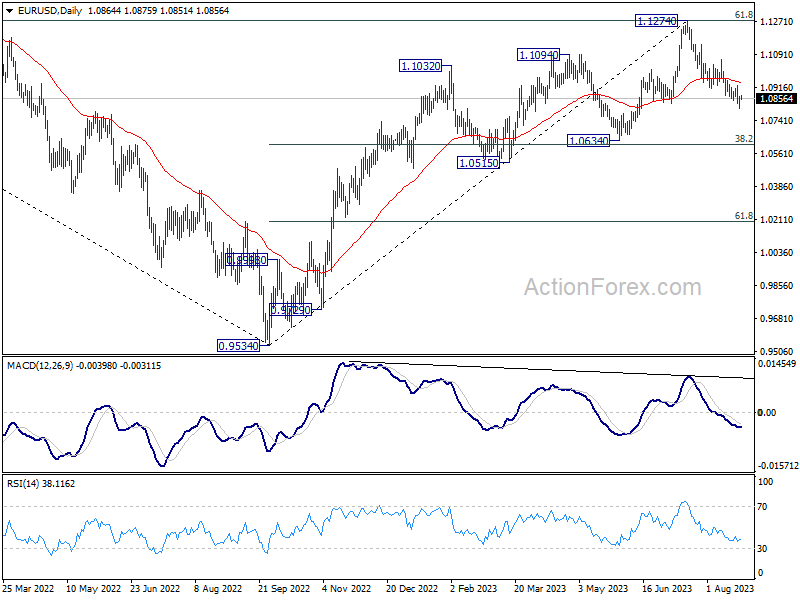
In the bigger picture, a medium term top should be formed at 1.1274, after failing to break through 61.8% retracement of 1.2348 (2021 high) to 0.9534 at 1.1273 decisively, on bearish divergence condition in D MACD. Fall from there is seen as a correction to the uptrend from 0.9534 (2022 low). Deeper decline would be seen to 1.0634 cluster support (38.2% retracement of 0.9534 to 1.1274 at 1.0609). Strong support could be seen there, at least on first attempt, to set the range for consolidation. Yet, medium term outlook will be neutral for now, as long as 1.1274 resistance holds.
AUDUSD Steps on the 2020 Support Trendline
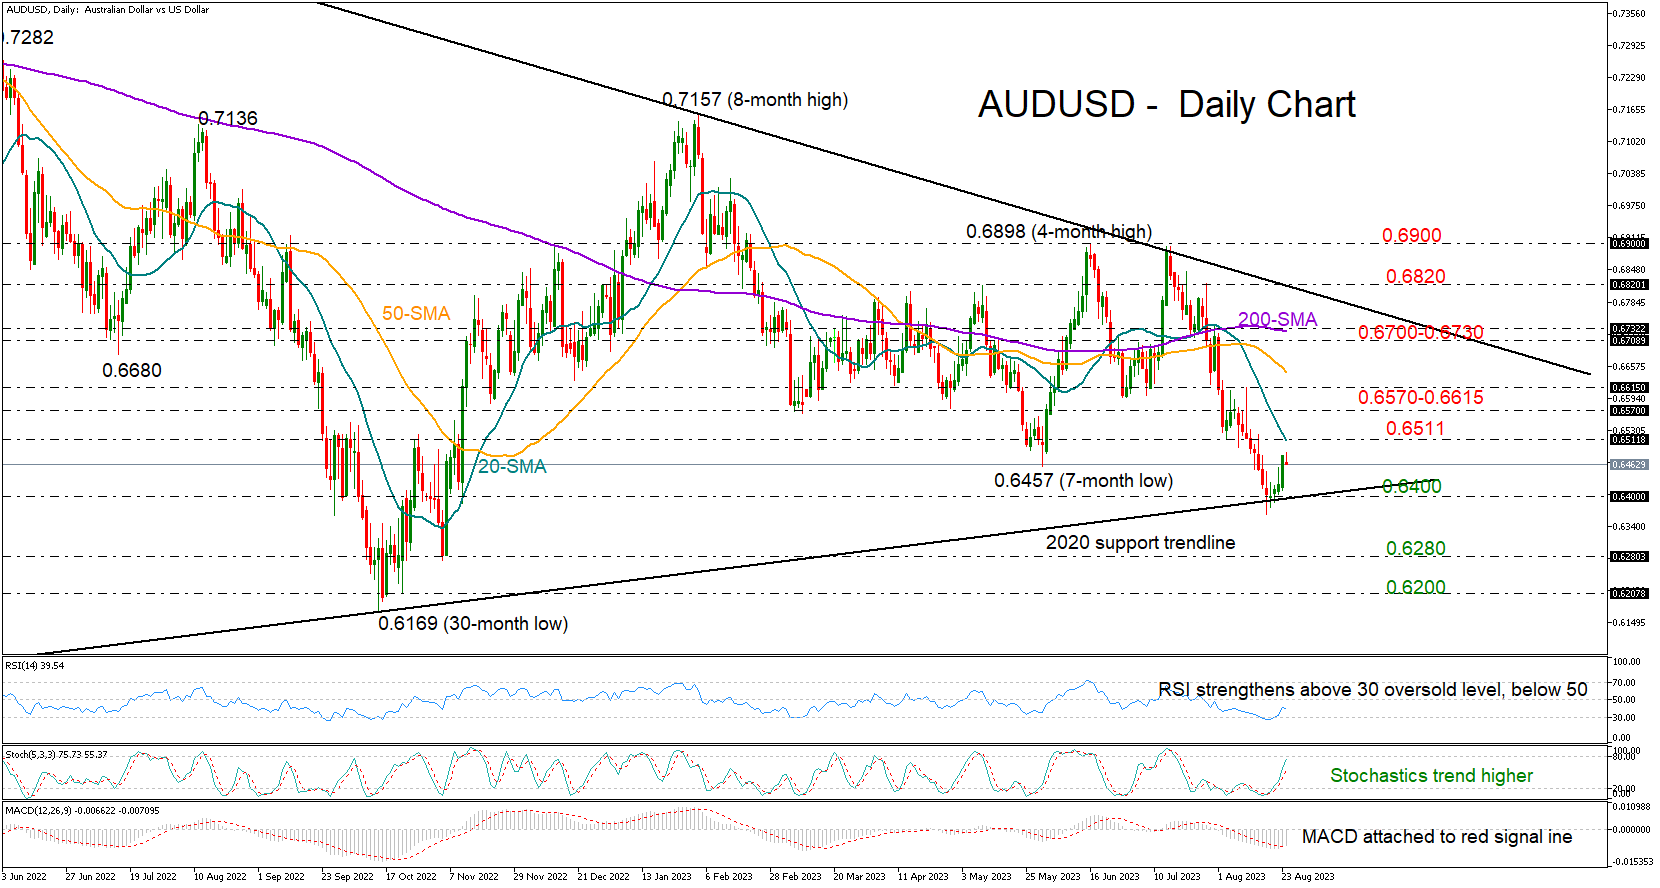
AUDUSD stayed above the 2020 support trendline after testing it for the third time since the pandemic fallout. This happened after a bearish five-week streak that caused the price to drop to a nine-month low of 0.6363.
The pair is set to post its first weekly gain in five weeks as the price picks up positive momentum towards its 20-day simple moving average (SMA) at 0.6511. The upside reversal in the RSI and the Stochastic oscillator are promoting the upturn in the price, though the former is clearly below its 50 neutral mark, while the MACD is attached to its red signal line despite gradually improving, both preserving some skepticism about how sustainable the rebound in the price is.
If the bulls surpass the 20-day SMA, the next hurdle could occur nearby within the 0.6570-0.6615 constraining zone, where the price stalled a couple of times during the previous months. Above that, the recovery could stretch towards the 0.6700 round level and the restrictive 200-day SMA at 0.6730. Yet, the market's main objective is to break the resistance trendline from April 2022 at 0.6820 after two forceful rejections this year.
Should sellers retake control, the 2020 support trendline would come back under the spotlight near 0.6400. If that floor collapses this time, with the pair diving below the 0.6363 low too, the decline could power up towards the 0.6280 mark taken from October-November 2022. Even lower, the bears are expected to stage another battle within the 0.6169-0.6200 territory and near 30-month lows.
In a nutshell, AUDUSD has again set the foundation for its next bullish phase near the 2020 support trendline, though more efforts will be needed to achieve a bullish bias.
GBP/USD Daily Outlook
Daily Pivots: (S1) 1.2638; (P) 1.2702; (R1) 1.2788; More...
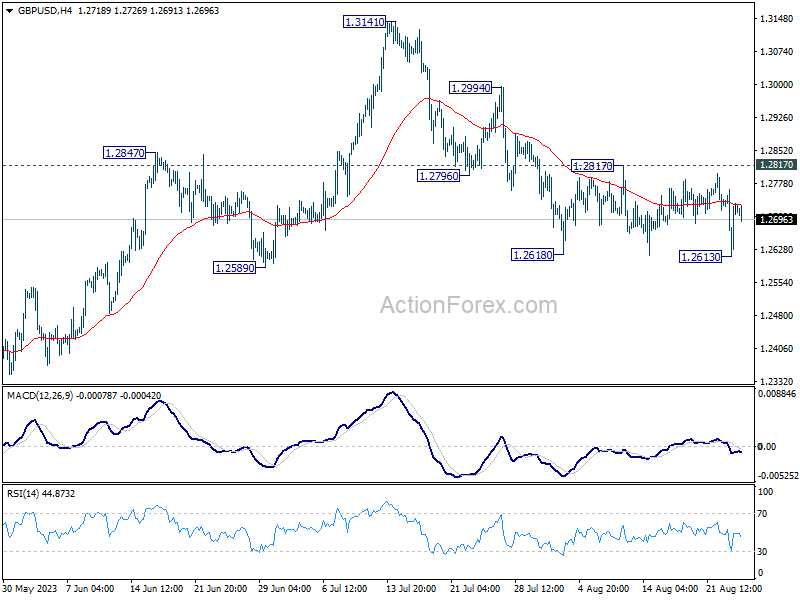
GBP/USD is still bounded in established sideway pattern from 1.2618, despite yesterday's volatility. On the downside, firm break of 1.2613 and sustained trading below 1.2678 resistance turned support will argue that it's already in a larger correction. Deeper decline would then be seen to 1.2306 support next. Nevertheless, break of 1.2817 minor resistance will indicate that the pull back from 1.3141 has completed, and turn bias back to the upside for stronger rebound.
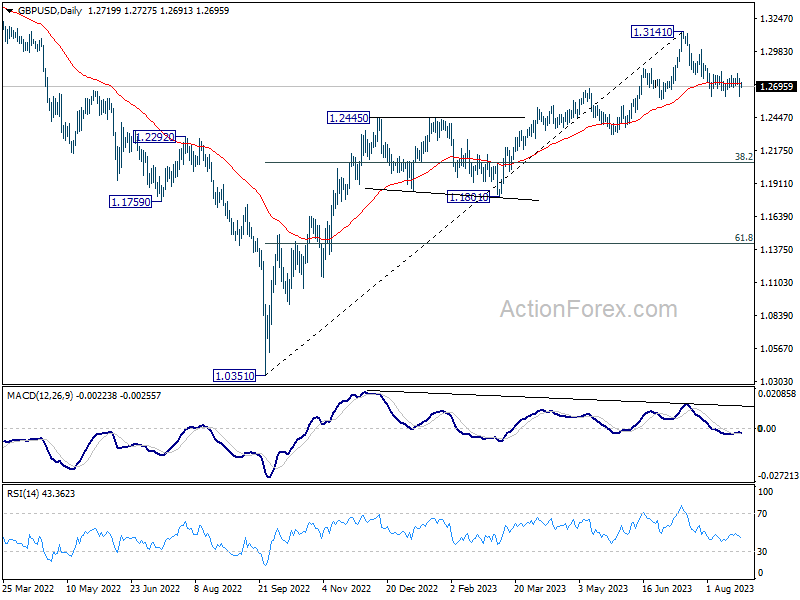
In the bigger picture, a medium term top could be in place at 1.3141 already, on bearish divergence condition in D MACD. Sustained trading below 55 D EMA (now at 1.2723) should confirm this case, and bring deeper fall to 38.2% retracement of 1.0351 to 1.3141 at 1.2075, as a correction to up trend from 1.0351 (2022 low). For now, rise will stay mildly on the downside as long as 1.3141 resistance holds, in case of strong rebound.
Forex Markets Await Jackson Hole Cues; Dollar’s Position Remains Uncertain
The foreign exchange are mostly stable today, with major currency pairs and crosses staying confined within the boundaries set yesterday. Both Sterling and Euro have had a lackluster week, emerging as the weakest performers. US Dollar, while subdued, still fares better, positioned ahead of Canadian Dollar as the third least impressive for the week.
In an unexpected turn, Australian Dollar has taken the lead as this week's strongest contender, with New Zealand Dollar following closely. Yen, meanwhile, is mixed amidst these shifts.
Today's economic docket is relatively thin, spotlighting only US jobless claims and durable goods orders. However, neither is anticipated to induce significant market ripples. Instead, all eyes are glued to the unfolding developments at the Jackson Hole Symposium.
On the technical front, the Dollar's momentary surge from yesterday lost momentum just as swiftly. Yet, the greenback hasn't witnessed any pressing sell-off. As long as 1.0929 minor resistance in EUR/USD and 1.2817 in GBP/USD hold, further rally is expected in the greenback. Break of 1.0861 and 1.2613 temporary lows will suggest Dollar buyers are back in.
In Asia, Nikkei closed up 0.87%. Hong Kong HSI is up 1.87%. China Shanghai SSE is up 0.18%. Singapore Strait Times is up 0.28%. Japan 10-year JGB yield is down -0.0158 at 0.662. Overnight, DOW rose 0.54%. S&P 500 rose 1.10%. NASDAQ rose 1.59%. 10-year yield dropped -0.13 to 4.198.
Eyes on NASDAQ's next move after Nvidia's earnings triumph boosts confidence
Investor sentiment is given a strong lift as Nvidia's earnings results demolish expectations, despite a high bar set for the AI darling. The strong performance was driven by its data center business, which includes the A100 and H100 AI chips that are needed to build and run artificial intelligence applications like ChatGPT. The company also said it expects fiscal third-quarter revenue of about USD 16B, suggests sales in the current quarter will grow 170% from the year-earlier period.
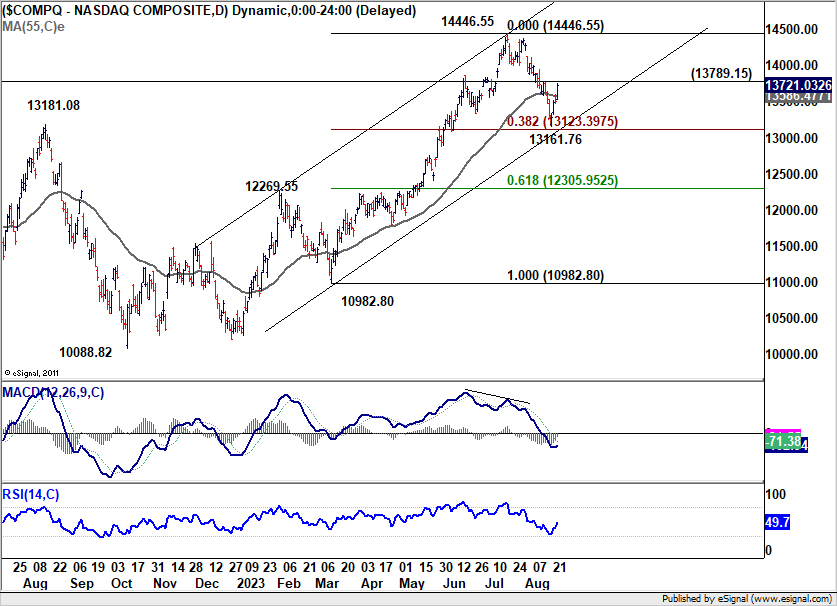
NASDAQ traders jumped the gun and pushed the index up 1.59% on close, before the Nvidia's earnings announcement. The development now argues that pull back from 14446.55 has completed at 13161.76, just ahead of the medium term channel support, as well as 38.2% retracement of 10982.80 to 14446.55 at 13123.39.
More importantly, if this turn out to be true, rise from 10088.82 should then remain intact for another high above 14446.55. The upside momentum for the rest of the week, in particular in reaction to Fed Chair Jerome Powell's Jackson Hole speech, would be watched to decide the odds of this bullish scenario.
Silver accelerates up, taking Gold higher
Silver's impressive rally intensified yesterday, pulling Gold upwards in its wake. This surge seems to be a direct response to the retracement of benchmark treasury yields in both the US and Europe, which were affected by less-than-stellar PMI figures. Market sentiment is now swaying towards the belief that major central banks might be quickly approaching the finale of their tightening cycle. All eyes are set on upcoming Jackson Hole Symposium. While the spotlight is certainly on the speech by Fed Chair Jerome Powell, insights and comments from other prominent central bankers are also poised to influence market directions.
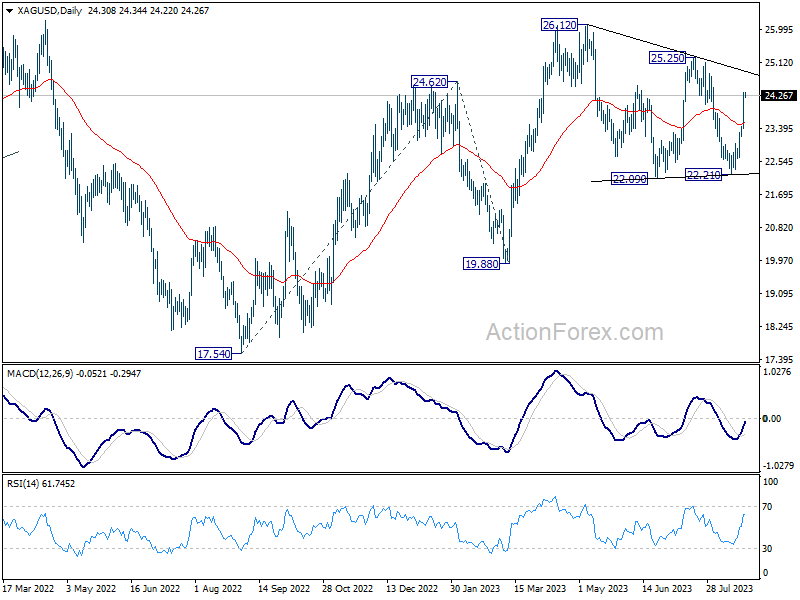
Technically, Silver's strong break of 55 D EMA affirms the case that consolidation pattern from 26.12 has completed with three waves to 22.21. Further rise is now expected as long as this 55 D EMA (now at 23.56) holds, to 25.25 resistance first. Decisive break there should confirm this bullish case, and should also resume whole up trend from 17.54 (2022 low). Next target would be 100% projection of 17.54 to 24.62 from 19.88 at 26.96.
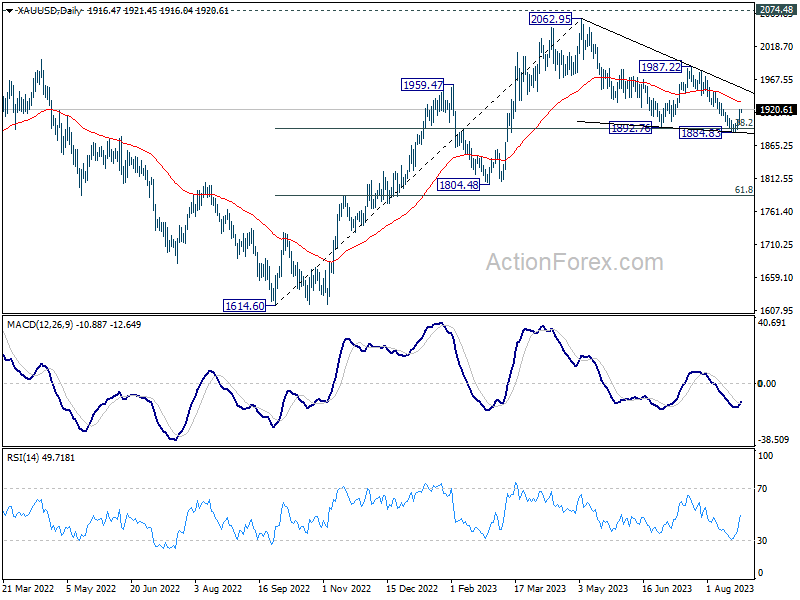
As for Gold, a short term bottom is in place at 1884.83, with D MACD crossed above signal line. Further rebound is now in favor to 55 D EMA (now at 1932.52). Sustained break there will argue that whole corrective pattern from 2062.95 has completed with three waves down to 1884.83, after defending 38.2% retracement of 1614.60 to 2062.95 at 1891.68. Stronger rally would then be seen to 1987.22 resistance to confirm this bullish scenario.
Looking ahead
US jobless claims and durable goods orders will be released today. But attention will definitely be on news flows out of Jackson Hole Symposium.
GBP/USD Daily Outlook
Daily Pivots: (S1) 1.2638; (P) 1.2702; (R1) 1.2788; More...
GBP/USD is still bounded in established sideway pattern from 1.2618, despite yesterday's volatility. On the downside, firm break of 1.2613 and sustained trading below 1.2678 resistance turned support will argue that it's already in a larger correction. Deeper decline would then be seen to 1.2306 support next. Nevertheless, break of 1.2817 minor resistance will indicate that the pull back from 1.3141 has completed, and turn bias back to the upside for stronger rebound.
In the bigger picture, a medium term top could be in place at 1.3141 already, on bearish divergence condition in D MACD. Sustained trading below 55 D EMA (now at 1.2723) should confirm this case, and bring deeper fall to 38.2% retracement of 1.0351 to 1.3141 at 1.2075, as a correction to up trend from 1.0351 (2022 low). For now, rise will stay mildly on the downside as long as 1.3141 resistance holds, in case of strong rebound.
Economic Indicators Update
| GMT | Ccy | Events | Actual | Forecast | Previous | Revised |
|---|---|---|---|---|---|---|
| 12:30 | USD | Initial Jobless Claims (Aug 18) | 241K | 239K | ||
| 12:30 | USD | Durable Goods Orders Jul | -4.00% | 4.60% | ||
| 12:30 | USD | Durable Goods Orders ex Transportation Jul | 0.20% | 0.50% | ||
| 14:30 | USD | Natural Gas Storage | 35B |
Today’s Eco Calendar Unlikely to Inspire Trading
Markets
Global PMI’s called off ongoing tests of key technical resistance levels (cycle highs) in core bond yields. Both the August EMU and UK composite gauges flashed the recession alarm, diving below the 50 boom/bust mark as the services sector joined the ongoing slump in manufacturing. Unfortunately for Europe, this is accompanied by sector input prices and wages increasing at an accelerated pace. As a result, the ECB may be more reluctant to pause the hiking cycle in September than the headline PMI figures suggest. The biggest drag came from a steep drop in the German services sector. The UK downward surprise was even bigger than the European one with July and August PMI’s suggesting a 0.2% Q/Q GDP decline in Q3 so far. Companies reported reduced orders and a further pull-back in hiring. Price pressures are moderating, but not at a sufficient pace to keep the BoE from hiking in September. Core bonds rallied (short squeeze) with German yields ending 9.5 bps (30-yr) to 13.5 bps (5-yr) lower. UK gilt yields tanked 13.9 bps (30-yr) to 19.2 bps (5-yr). The euro lost ground on first national releases with both EUR/USD and EUR/GBP losing first support levels at 1.0834 and 0.8504 respectively. The break in EUR/GBP was rapidly undone by the UK PMI, but also EUR/USD returned to opening levels to eventually close at 1.0863. The 200d moving average around 1.08 proved to tough to crack. European stock markets eventually closed near unchanged not knowing whether to cheer for the fallback in rates or to worry about weak PMI’s. The US PMI decreased as well, but both services and composite measures held above the 50-line. The release didn’t provoke much additional market reaction. In other economic news, the Bureau of Labour Statistics downwardly revised payroll growth in the year through March by 306k. That’s less than the 500k whisper number and doesn’t fundamentally change the underlying picture of a resilient and robust US labour market. US yields fell 7.7 bps (2-yr) to 13.2 bps (10-yr) yesterday. US equity markets rallied up to 1.1% for the S&P and 1.6% for Nasdaq, anticipating strong results by Nvidia. The latter even exceeded lofty expectations after US close, sending the share another 6% higher in after-market trading and lifting spirits in Asian trading this morning. Today’s eco calendar is unlikely to inspire trading with July durable goods orders and weekly jobless claims. Speeches by Philly Fed Harker and by Boston Fed Collins are wildcards. Overall market positioning is again more neutral after yesterday’s correction and going into tomorrow’s key Jackson Hole speeches. It lowers the probability to see high profile technical breaks in FI/FX and stock markets.
News and views
The Bank of Korea this morning unanimously decided to keep its policy rate unchanged at 3.5%. The BoK last raised its policy rate in January. In new forecasts, the central bank expects the economy to grow 1.4% this year (unchanged from May). Growth for next year was slightly downwardly revised from 2.3% to 2.2% reflecting the impact of slower growth in China. Consumer price inflation this year is still seen at 3.5%, but core was slightly upwardly revised to 3.4%. Next year, inflation is expected at 2.4%. At the news conference, Governor Rhee admitted that there might be arguments to give more weight to growth, but inflation remains the most important with financial stability also an important topic. The BoK is concerned over high levels of consumer debt. According the Rhee, six board members kept the door open for one more rate hike if necessary. The won recently lost against a strong dollar. It strengthened to USD/KRW 1321 this morning, to be compared with a ST low of 1343 last week.
In an interview with the newspaper Hospodarske Noviny, Czech central Bank Member Jan Kubicek indicated that sales of returns on the CNB’s foreign reserves will be done in a way that will affect the FX market as little as possible. The sales of returns shouldn’t have the effect of FX interventions. Sales are a way to manage the bank’s balance sheet. They are not a policy tool. Kubicek also indicated that the CNB sees the neutral long term nominal interest rate at a level of near 3%.
Weak PMI Data Set Tone for Markets
Market movers today
The data calendar is relatively light today, with US capital goods orders and weekly jobless claims as the most interesting.
Also, we will get a rate decision from the Central Bank of Turkey, where we are likely to see a hike from the current 17.5% as inflation is again accelerating. We have no guidance about the size of the hike, and analyst expectations range from 100bp to 250bp. We expect that hikes will continue and the rate eventually reach 25%.
The 60 second overview
Weak PMI for the US and euro area: PMI data disappointed yesterday in both the US and Euro area pushing bond yields lower while supporting equities as expectations for further hikes from the Fed and ECB were scaled back. In the US Composite PMI dropped to 50.4 in August from 52.0 in July with declines in both manufacturing and services. The European PMI figures also came out much weaker than expected with services showing renewed signs of slowing. The German Services PMI numbers stood out with a massive 5 index points decline, which has only happened three times before with the latest being in March 2020 during the Covid-19 lockdown.
Chinese markets calm down: In China financial stress has calmed somewhat for now as equities has rebounded around 3% from the low reached on Tuesday. It is supported by improving global risk sentiment and strong tech performance as tech companies deliver decent earnings and a stronger outlook, while having very low valuations after the past years' violent sell-off. With selling pressure easing bottom fishers have come back and drive the gains in stocks. However, the underlying problems in Chinese housing and the shadow banking system are still there and financial stress could come back if we get more bad news on this front. New home prices in July saw a bigger decline than in the past months and with the stress on China's developers the downward pressure on new home prices could intensify as they aim to sell more homes to raise cash.
Nvidia beat expectations: Speaking of tech, the leader of AI chips, Nvidia, crushed already high expectations with better-than-expected Q2 earnings and stronger guidance than seen by analysts. Earnings have quadrupled over the past year as the company is at the centre of the new AI drive.
Prigozhin reported dead in plane crash: Head of the Russian Wagner Group Yevgeny Prigozhin died in a plane crash yesterday together with other leaders of the Wagner Group, see Reuters. His fate was increasingly uncertain after he staged a mutiny earlier this year and his death leaves open what the future of the Wagner Group will be.
BRICS set to expand amid disagreements: BRICS leaders meeting in South Africa are struggling to finalise criteria for admitting new members into the club amid disagreements on how high the bar should be. While China seems to work on a wider expansion, India has supposedly in last minute suggested a GDP per capita criteria, which may exclude some potential members. The BRICS stated goal is to champion the interests of the Global South while several of the members have stressed it is not an organisation to oppose G7.
Equities: Global equities rose yesterday, and the non-top-down driven market ended. PMIs the triggered the lift to equities, not as one would expect in 19 out of 20 times because of strong PMIs but instead because of weak PMIs. The weak PMI's resulting in yields plummeting across the curve and across countries. Hence, the fear of too high inflation and central overtightening fell and triggered the equity rally. As expected, materials and energy underperforming in this this inflations-relief rally. In US +0.5%, S&P 500 +1.1%, Nasdaq +1.6% and Russell 2000 +1.0%. Asian market continuing higher this morning and the same is the case for European and US futures. Market optimism fuelled by the Nvidia earnings report out after the US close yesterday.
FI: European bonds rallied on yesterday's weak PMI data, with the 10Y German government bond yield declining by close to 13bp throughout the day and the EUR swap curve (2s10s) reinverting a few bps. The ECB pricing was much impacted by the weak signals. Markets are now pricing in a 3% probability of a 25bp hike at the September meeting (vs. 55% prior to the PMIs), while the peak deposit rate is trading 7bp lower at 3.90%. The 5y5y EUR inflation swap rate declined by 3bp to 2.60% during the session, which is, though, still close to the highest level recorded since 2009.
FX: EUR/USD seesawed through yesterday's session taking its cue from PMI figures from first the Euro Area and then the US. In the end, the cross closed slightly higher on the day. The GBP weakened on the back of signs of deteriorating growth momentum, and after a couple of weeks' strong GBP performance we decided yesterday to close our tactical short of GBP/CHF.
Credit: Credit indices continued to perform yesterday where iTraxx Xover tightened more than 10bp and Main 2.3bp. Primary market activity remains relatively low, but a few transactions were priced, including German auto parts manufacturer, Continental.
Nordic macro
This morning Statistics Sweden (SCB) releases Q2 construction data where the focus is mainly on dwellings starts, vendor Byggfakta's indicator suggest a bottoming out of starts in Q2. In addition, SCB releases the Q2 Savings Barometer which is a preliminary estimate of household savings and balance sheets later published in Financial Accounts.
Amazing Nvidia
Nvidia announced STUNNING results when it released its Q2 earnings yesterday after the bell. The company reported $13.5bn sales last quarter, well above its $11bn projection, and said that it expects $16bn sales for next quarter, up from $12.6bn forecast last quarter. And oh, earnings jumped to $2.70 per share, versus $2.09 expected by analysts, and the most-loved chipmaker of the year approved $25bn in share buybacks. There is nothing an investor could ask more. The market expectations were sky-high, the results went to the moon, the forecasts for this quarter are as stunning, and the company is expected to earn around $30bn in FY2024 because Nvidia is not and will not be concerned about the industry-wide slump in chips demand, thanks to a decent surge in demand for AI processors in data centers. Magic is happening for Nvidia. So, the stock price jumped 10% in the afterhours trading to flirt with $518 per share, and Nvidia news has a boosting effect on technology stocks, if nothing by confirming that all the talk around the AI-craze was not empty, after all. Nasdaq futures are up by around 1.23% this morning, the S&P500 futures are also in the positive, and further good news is that the yields are down from Europe to US, on meagre PMI numbers released yesterday. And that is the perfect combo for the tech stocks – which have, so far this year, been – unquestionably - the best place to be in the S&P500 this year.
PMI disappointment
The US 2-year yield slipped below 5% as both manufacturing and services PMI fell unexpectedly in August, adding a layer of complexity to US data, which strong enough to push Atlanta Fed’s GDP forecast for Q3 to 5.8% last week.
August PMI numbers in Europe printed even worse numbers than in the US. The manufacturing PMI was slightly better than expected but remained well below the 50 threshold – in the contraction zone. More disquietingly, the euro-area’s services PMI slipped below 50 – to the contraction zone for the first time since January. What’s even more worrying is that, the services PMI fell into the contraction for the busiest summer month for mass holidays.
As a result, traders now price around 40% chance for a 25bp hike in European Central Bank’s (ECB) next policy meeting, down from 55% before the release. The EURUSD tested the 200-DMA to the downside and remains under the pressure of rising dovish voices for the ECB. And the European bond markets rally: the German 10-year yield fell more than 5.5% yesterday. We see the same gloom across the Channel. All British PMI figures were below 50, and came in worse than expected, pushing Cable shortly below its 100-DMA, which stands near 1.2635. The EURGBP on the other hand fell to a fresh year low, as the continent is now expected to join the UK in its economic demise.
This being said, slow PMI numbers could eventually convince the ECB to slow down on its rate normalizing policy, but it won’t be enough to reverse the policy stance if inflation remains high. The ECB, as the Fed, won’t hesitate to push economies into further economic trouble if inflation doesn’t come down toward their 2% policy target.
The set of morose economic data kept the US crude below the $80pb level, even though the US inventories dived more than 6 mio barrels for the second consecutive week. Trend and momentum indicators remain comfortably negative, and the market conditions are far from the oversold territory, meaning that there is room for a deeper downside correction in oil prices. The key level to watch is the $78.40 level, the major 38.2% Fibonacci retracement on the latest rally and which should, if broken to the downside, call the end of the rally and encourage a bearish reversal, which would then pave the way for a further fall to the 200-DMA, which stands near $75.80pb.
Technical Outlook and Review
DXY:
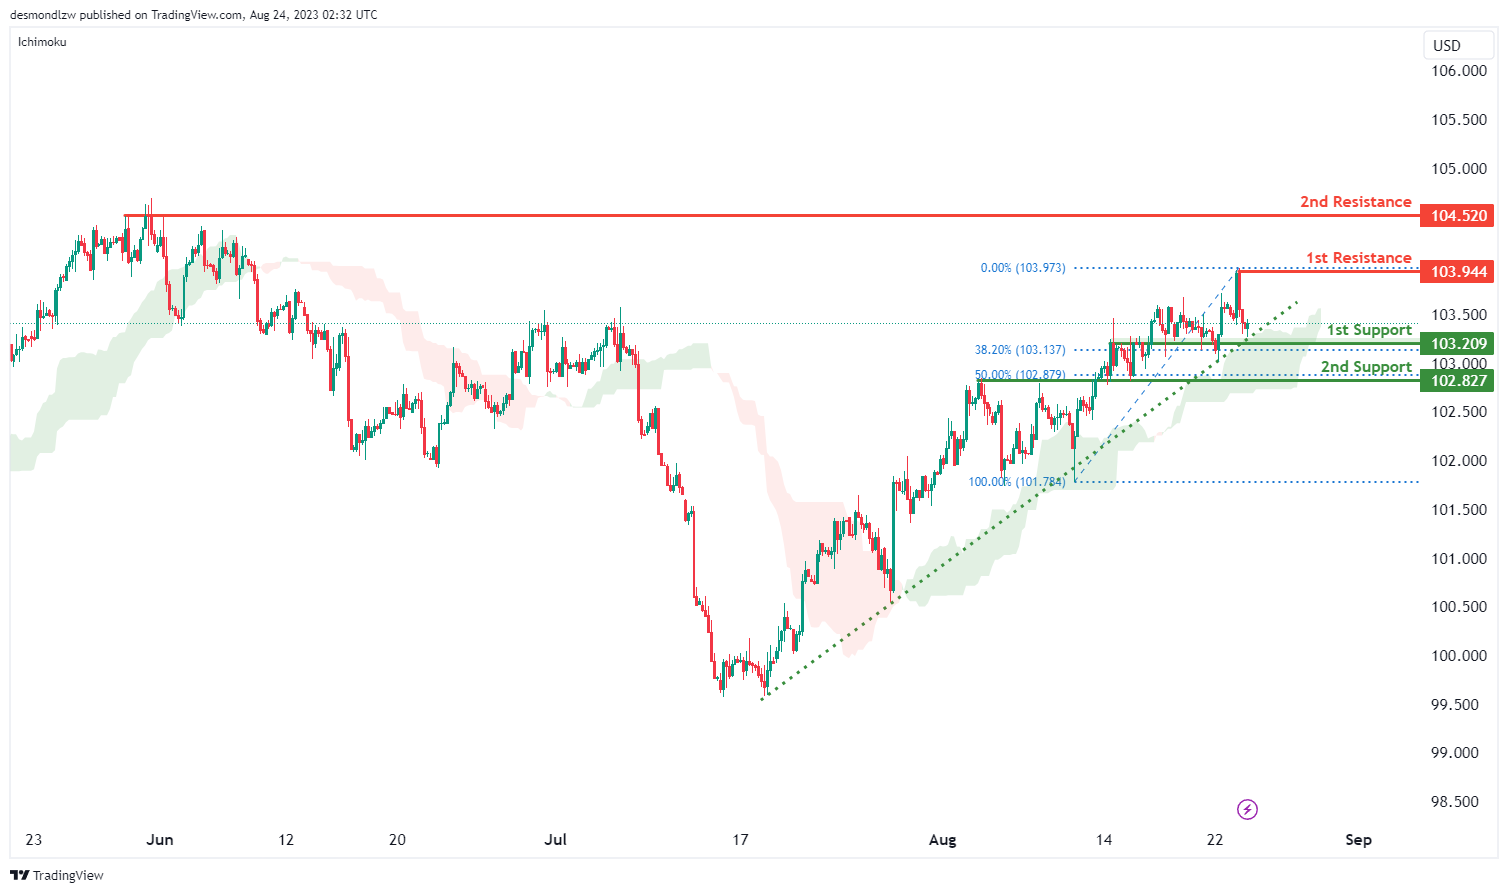
The DXY chart currently exhibits a bullish momentum, indicating a prevalent upward trend in the market.
This bullish momentum is supported by the fact that the price is above a major ascending trend line, signifying the potential for further upward movement. Additionally, the price remains above the bullish Ichimoku cloud, contributing to the overall positive momentum.
In this context, there’s a possibility that the price could experience a bullish rebound upon reaching the 1st support level at 103.20. This support level gains significance as an overlap support and aligns with the 23.60% Fibonacci Retracement level. Similarly, the 2nd support at 102.82 holds importance as an overlap support and corresponds to the 50% Fibonacci Retracement level.
On the resistance side, the 1st resistance level at 103.92 stands out as a swing high resistance, potentially posing a hurdle to further upward movement. Similarly, the 2nd resistance at 104.50 gains significance as a multi-swing high resistance.
EUR/USD:
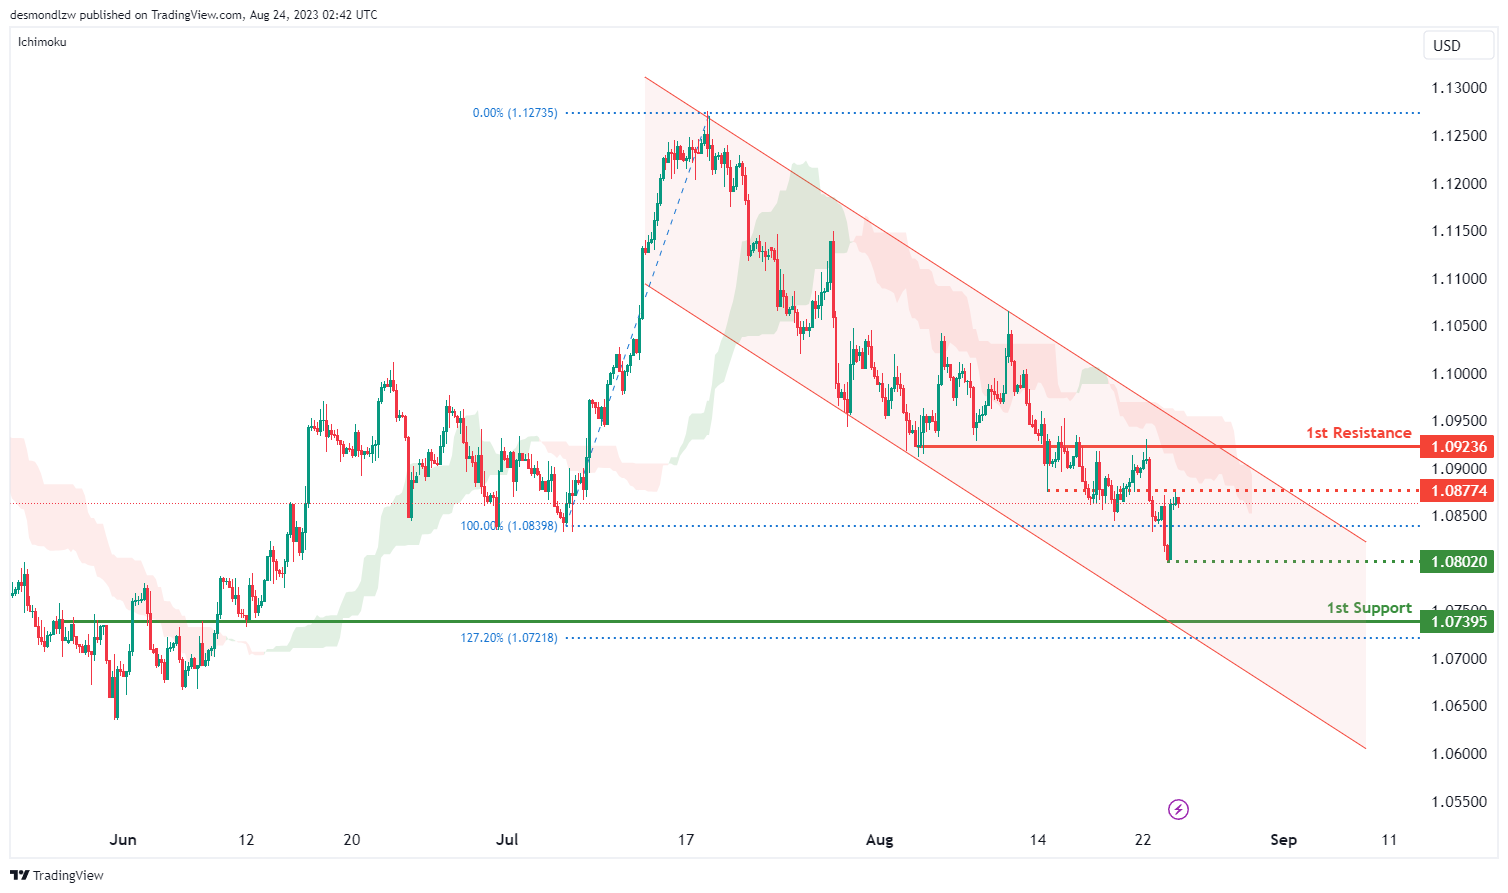
The EUR/USD chart currently demonstrates a bearish momentum, characterized by its position within a descending channel. This channel suggests a likelihood of continued downward movement due to the prevailing bearish momentum.
In this context, there’s a potential scenario where the price could undergo a bearish continuation towards the 1st support level at 1.0739. This support level is notable as an overlap support and is reinforced by the presence of the 127.20% Fibonacci Extension.
Additionally, an intermediate support level at 1.0802 holds significance due to its identification as a swing low support, potentially adding to the potential support structure.
On the resistance side, the 1st resistance at 1.0923 stands out as an overlap resistance, potentially acting as a barrier to upward price movement. Similarly, the intermediate resistance level at 1.0877 is significant as another overlap resistance.
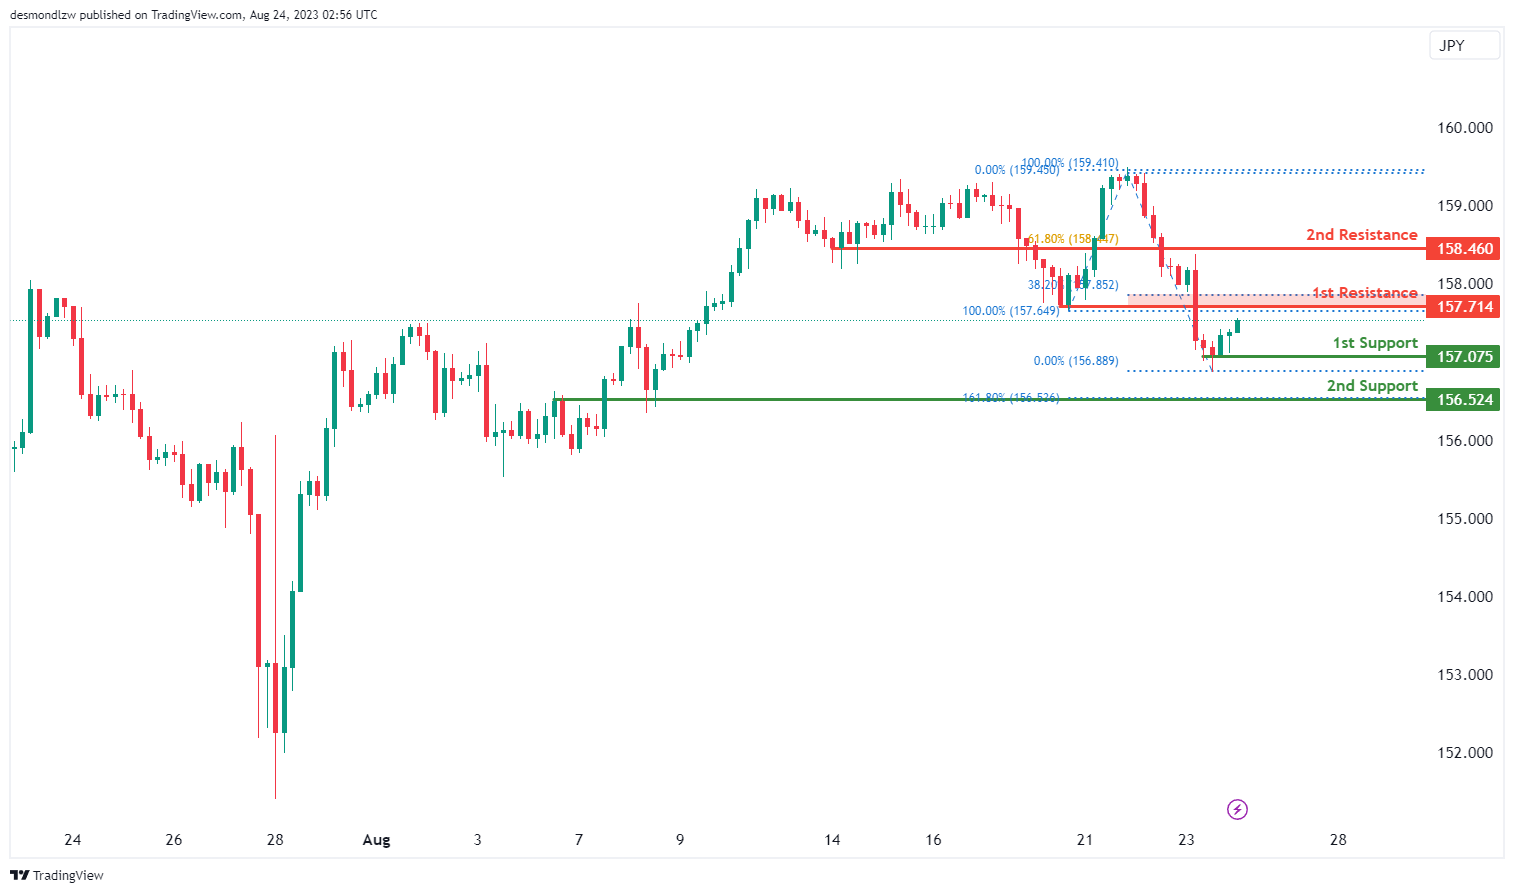
EUR/JPY:
The EUR/JPY chart’s momentum indicates a bearish trend, suggesting a tendency for downward movement.
In this context, there’s a potential scenario where the price could experience a bearish reaction off the 1st resistance at 157.71, leading to a potential drop towards the 1st support at 157.07.
The 1st support at 157.07 holds significance as a multi-swing low support, suggesting that it may act as a level where price could find stability or potentially rebound. The 2nd support at 156.52 is identified as an overlap support and also aligns with the 161.80% Fibonacci Extension level, which adds to its potential significance as a potential bounce point.
Conversely, the 1st resistance at 157.71 is classified as a pullback resistance, indicating that it might restrict upward movements. The 2nd resistance at 158.46 is recognized as a pullback resistance and is associated with the 61.80% Fibonacci Retracement level, reinforcing its potential as a barrier to upward price progress.
Additionally, the intermediate support at 159.20 is considered a pullback support, potentially influencing price reactions.
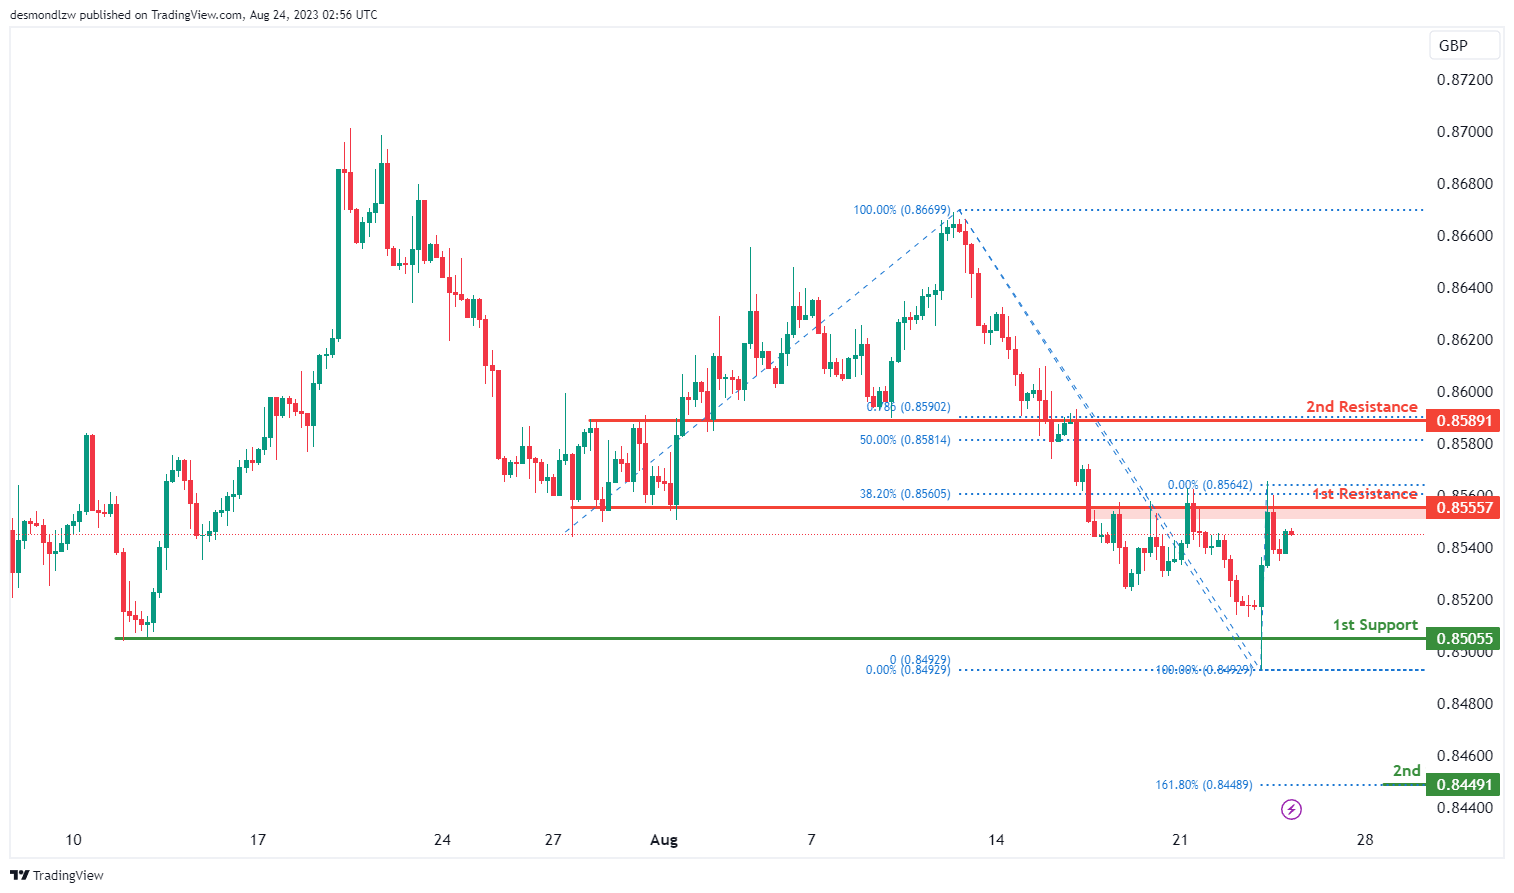
EUR/GBP:
The EUR/GBP chart’s momentum indicates a bearish trend, suggesting a tendency for downward movement.
In this context, there’s a potential scenario where the price could continue its bearish movement towards the 1st support at 0.8505.
The 1st support at 0.8505 is identified as a multi-swing low support, indicating that it may play a significant role in providing a potential level of price stabilization or even a rebound. The 2nd support at 0.8449 is recognized as a swing low support and aligns with the 161.80% Fibonacci Extension level, which adds to its potential significance as a potential bounce point.
On the resistance side, the 1st resistance at 0.8555 is classified as an overlap resistance, implying that it could restrict upward movements. The 2nd resistance at 0.8589 is a pullback resistance and aligns with the 50% Fibonacci Retracement level, suggesting its potential to hinder upward price progress.
GBP/USD:
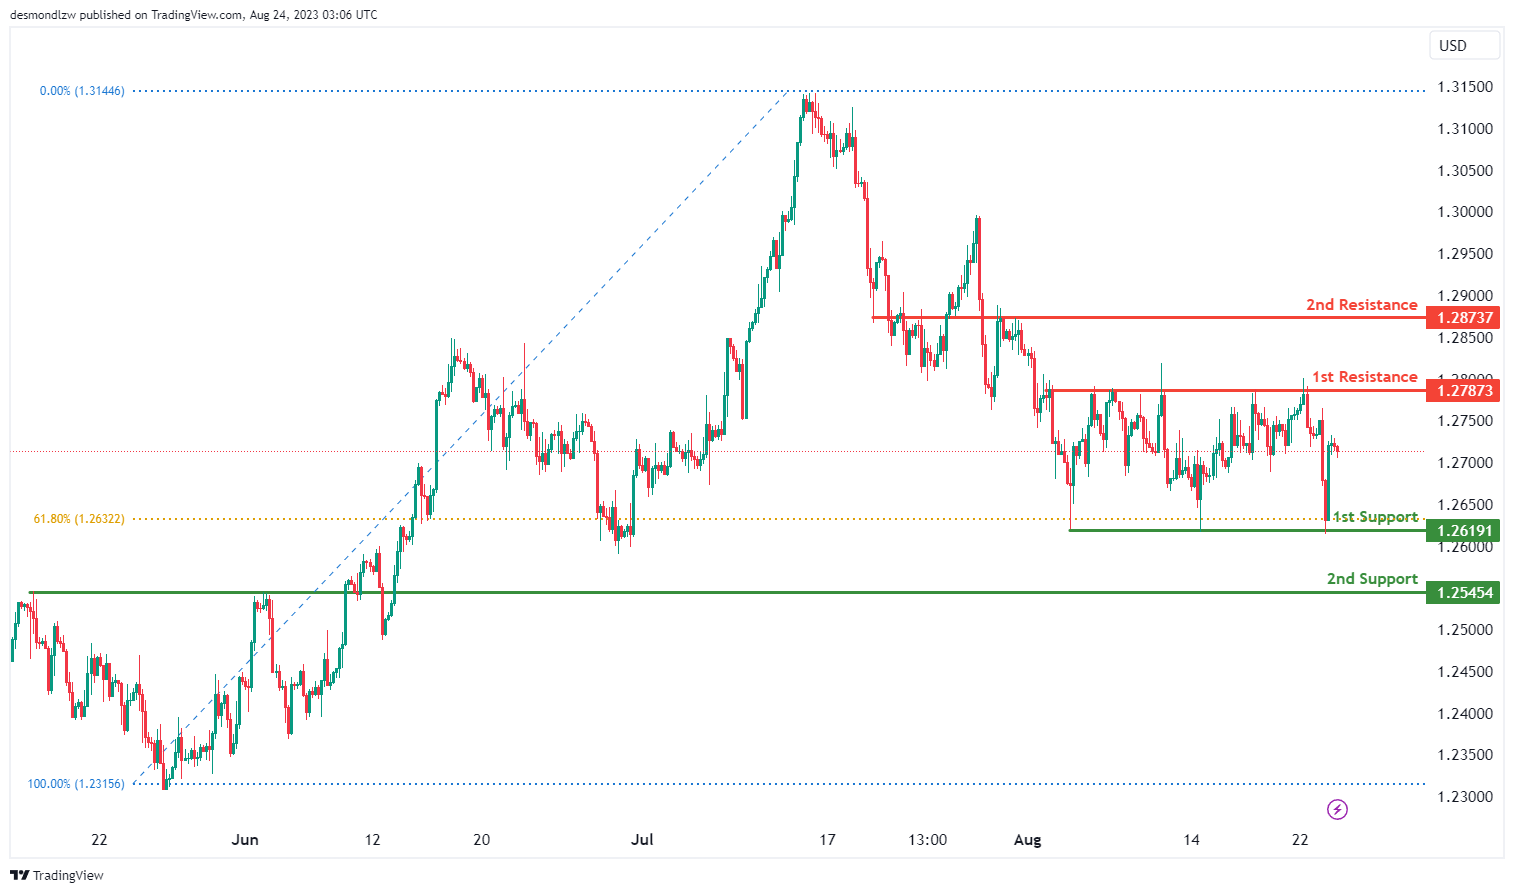
The GBP/USD chart currently reflects a neutral momentum, suggesting a lack of clear directional bias.
Within this context, there’s a potential scenario in which the price might exhibit fluctuations between the 1st support level at 1.2619 and the 1st resistance level at 1.2787.
The significance of the 1st support at 1.2619 is underlined by its identification as a multi-swing low support, with an additional reinforcement from the presence of the 61.80% Fibonacci Retracement.
On the other hand, the 2nd support at 1.2545 is noted as a pullback support, which could contribute to supporting the price during downward movements.
Regarding resistance, the 1st resistance at 1.2787 is considered a swing high resistance, which might act as a hurdle for upward price movement. Similarly, the 2nd resistance level at 1.2873 is significant due to its nature as an overlap resistance.
GBP/JPY:
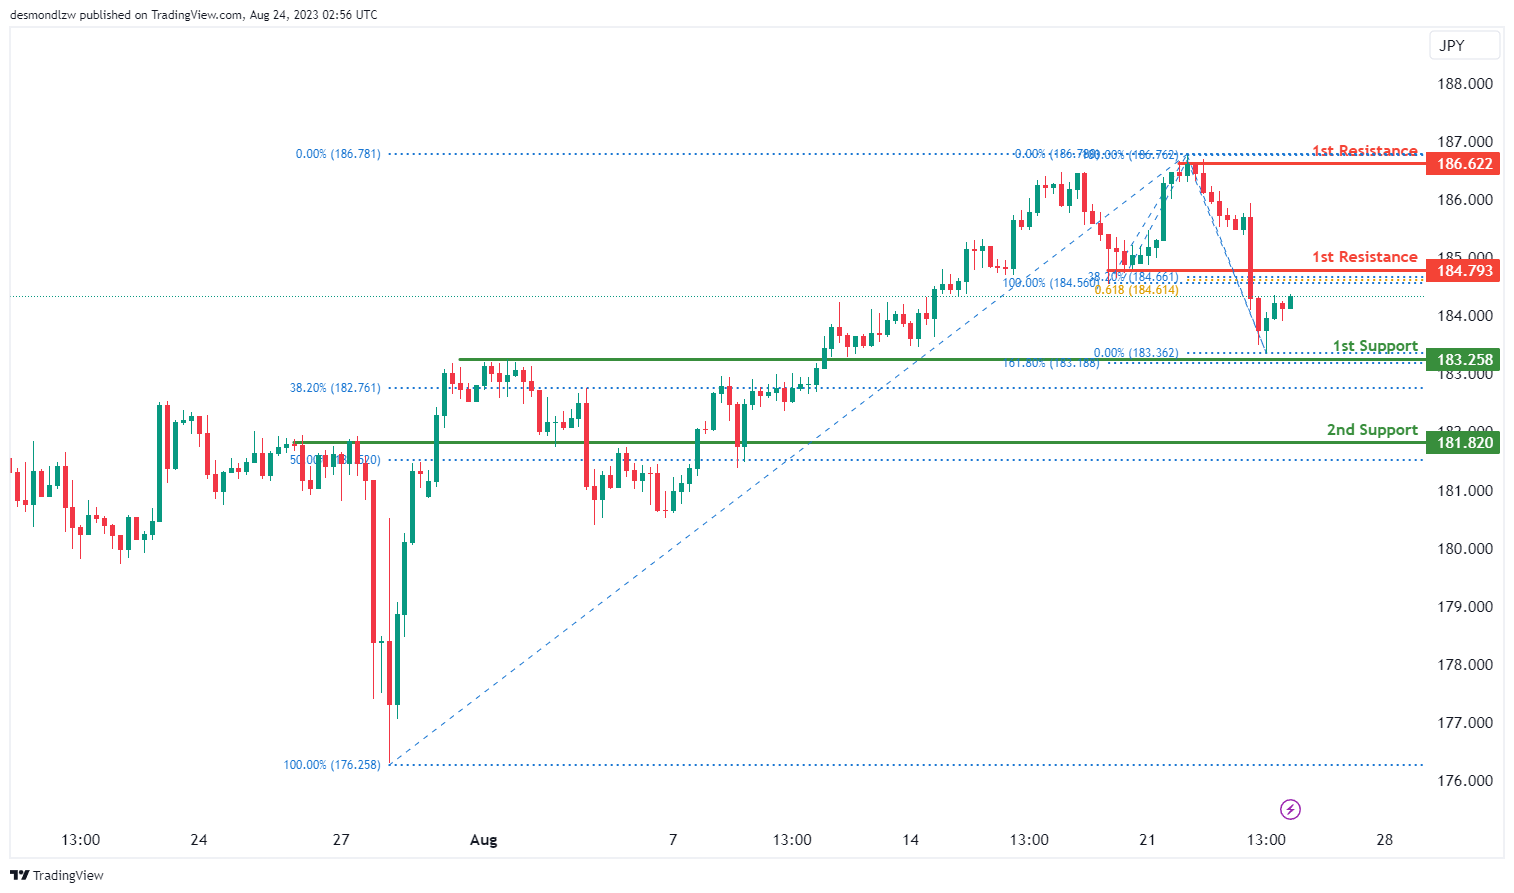
The GBP/JPY chart currently shows a bearish momentum, indicating a prevailing downward trend.
Within this context, there’s a potential scenario where the price might encounter resistance and experience a bearish pullback upon reaching the 1st resistance level at 184.79. This pullback could potentially lead to a drop towards the 1st support level at 183.25.
The significance of the 1st support at 183.25 lies in its identification as an overlap support, with added strength from the alignment with the 161.80% Fibonacci Extension.
Similarly, the 2nd support at 181.82 is also noted as an overlap support, further reinforcing its potential importance as a significant price level.
On the resistance side, the 1st resistance at 184.79 is noteworthy due to its designation as a pullback resistance. Moreover, its alignment with both the 38.20% Fibonacci Retracement and the 61.80% Fibonacci Projection indicates a convergence of Fibonacci levels, making it a key potential resistance zone. The 2nd resistance at 186.62 holds significance as a multi-swing high resistance, suggesting historical resistance strength.
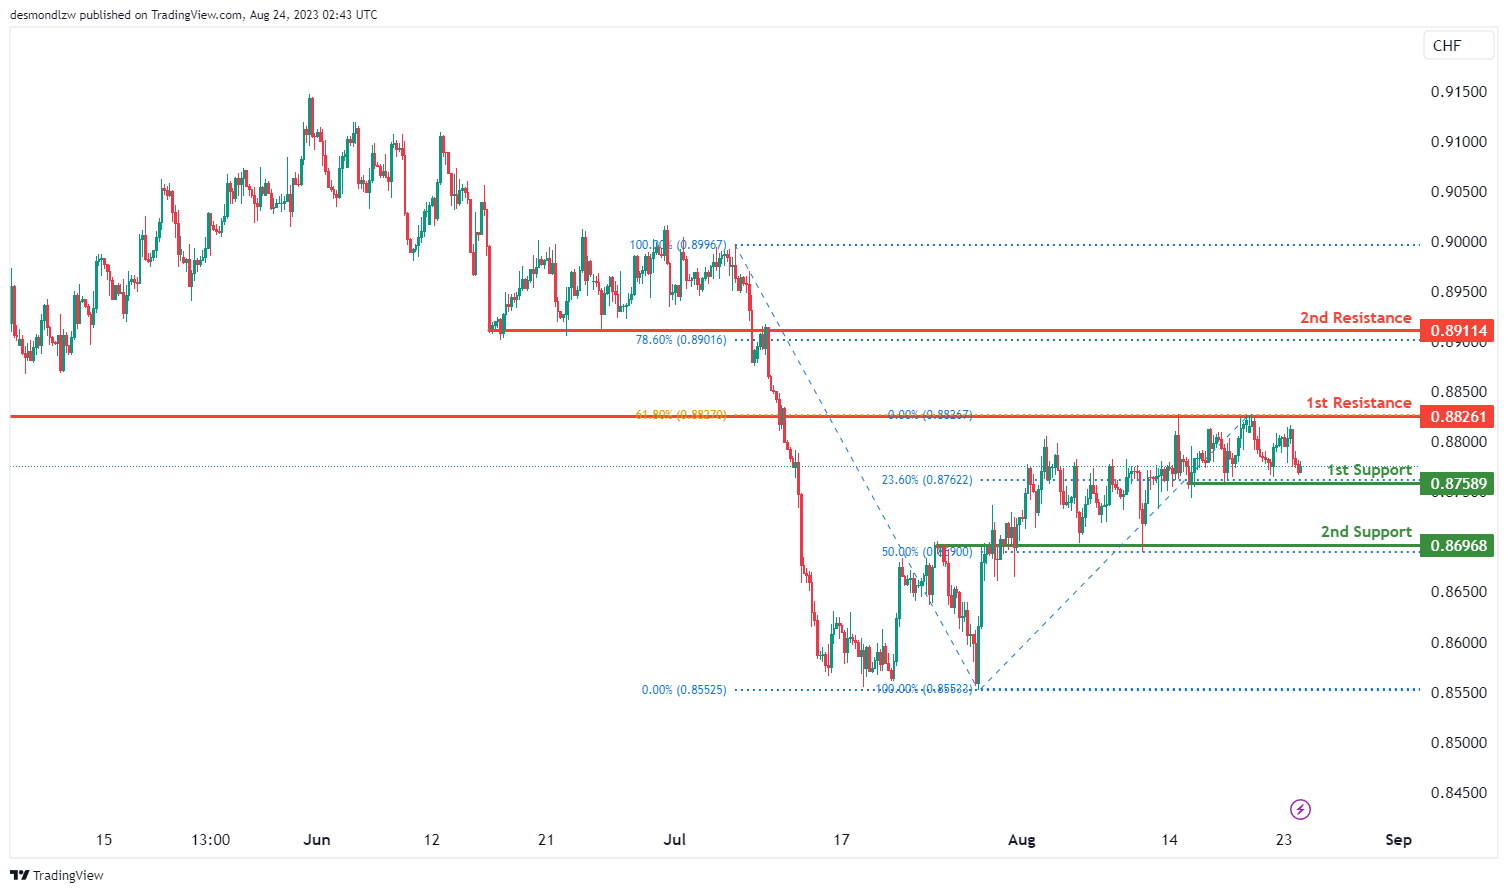
USD/CHF:
The USD/CHF chart is currently showing a neutral momentum, suggesting a lack of clear directional bias.
In this context, there’s a potential scenario where the price could exhibit fluctuations within a range defined by the 1st support level at 0.8758 and the 1st resistance level at 0.8826.
The 1st support at 0.8758 gains significance from its identification as a multi-swing low support, with an additional backing from the presence of the 23.60% Fibonacci Retracement.
Similarly, the 2nd support at 0.8696 is noted as an overlap support, reinforced by its alignment with the 50% Fibonacci Retracement, potentially acting as a key level during downward movements.
On the resistance side, the 1st resistance at 0.8826 is significant due to its nature as an overlap resistance and its alignment with the 61.80% Fibonacci Retracement, potentially impeding upward price movement. The 2nd resistance level at 0.8911 is also notable as a pullback resistance and coincides with the 78.60% Fibonacci Retracement.
USD/JPY:
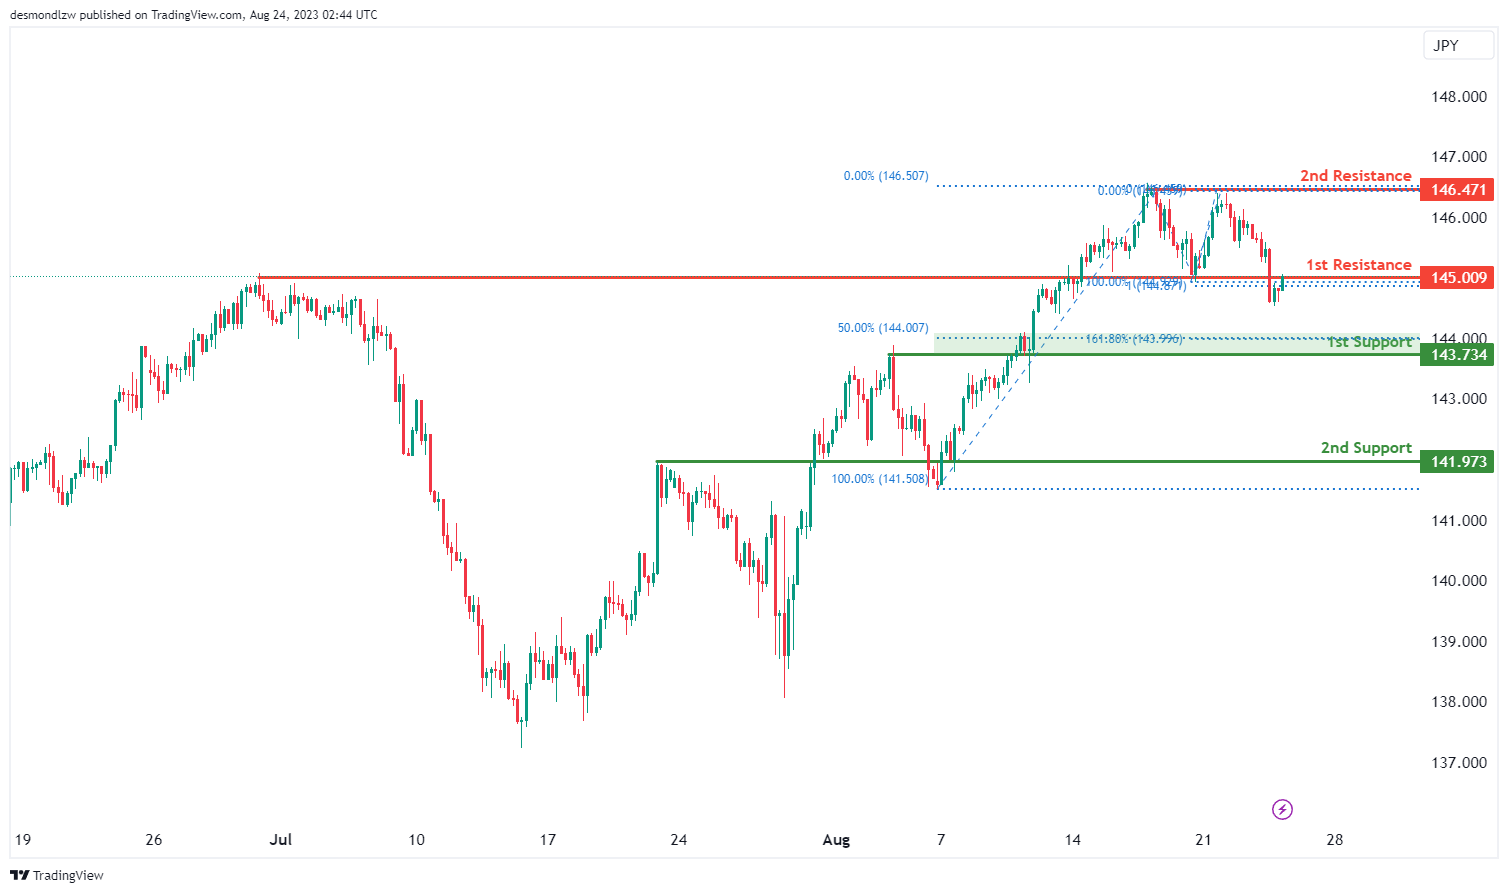
The USD/JPY chart currently indicates a bearish momentum, suggesting a prevailing downward trend.
Within this context, there’s a potential scenario where the price might experience a bearish pullback upon reaching the 1st resistance level at 145.00, potentially leading to a drop towards the 1st support level at 143.73.
The significance of the 1st support at 143.73 lies in its identification as a pullback support, further reinforced by its alignment with both the 50% Fibonacci Retracement and the 161.80% Fibonacci Extension, indicating a convergence of Fibonacci levels and potentially a stronger support zone.
Similarly, the 2nd support level at 141.97 is noted as an overlap support, providing additional reinforcement to its potential as a significant price level.
On the resistance side, the 1st resistance at 145.00 is notable due to its designation as a pullback resistance, which could potentially hinder upward price movement. The 2nd resistance at 146.47 gains importance as a multi-swing high resistance, indicating a strong historical level where selling interest might arise.
USD/CAD:
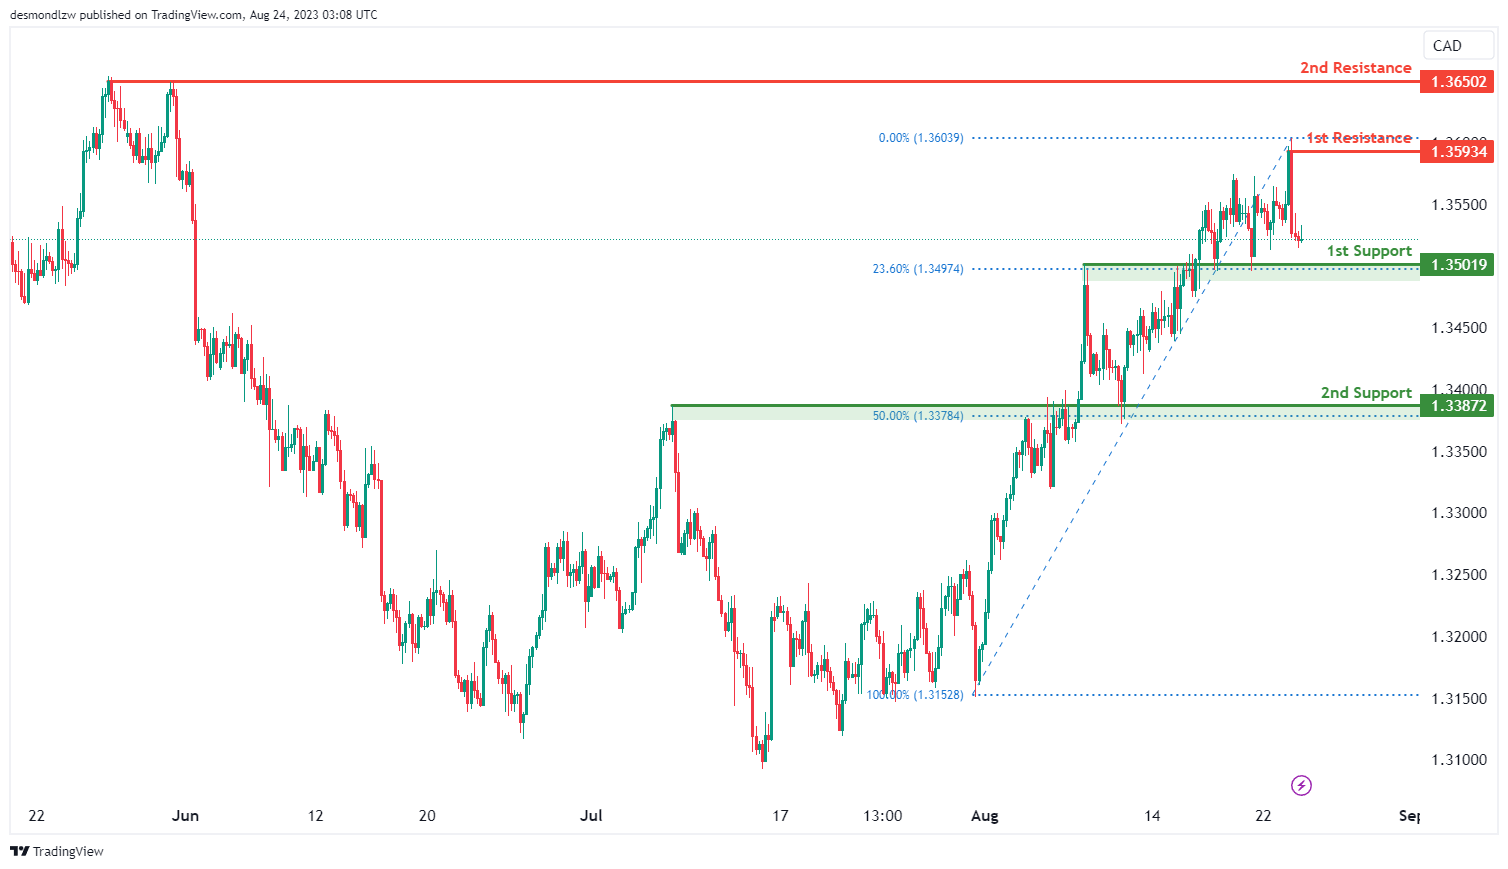
The USD/CAD chart’s momentum indicates a neutral stance, suggesting a lack of a clear directional trend.
Given this neutral momentum, there is a potential for price to fluctuate within a range defined by the 1st support level at 1.3502 and the 1st resistance level at 1.3593.
The significance of the 1st support level at 1.3502 is attributed to its identification as an overlap support that aligns with the 23.60% Fibonacci retracement level. In addition, the 2nd support level at 1.3387 is also identified as an overlap support that aligns with the 50.00% Fibonacci retracement level.
To the upside, the 1st resistance level at 1.3593 is identified as a swing-high resistance while the 2nd resistance level at 1.3650 is identified as a multiple swing-high resistance.
AUD/USD:
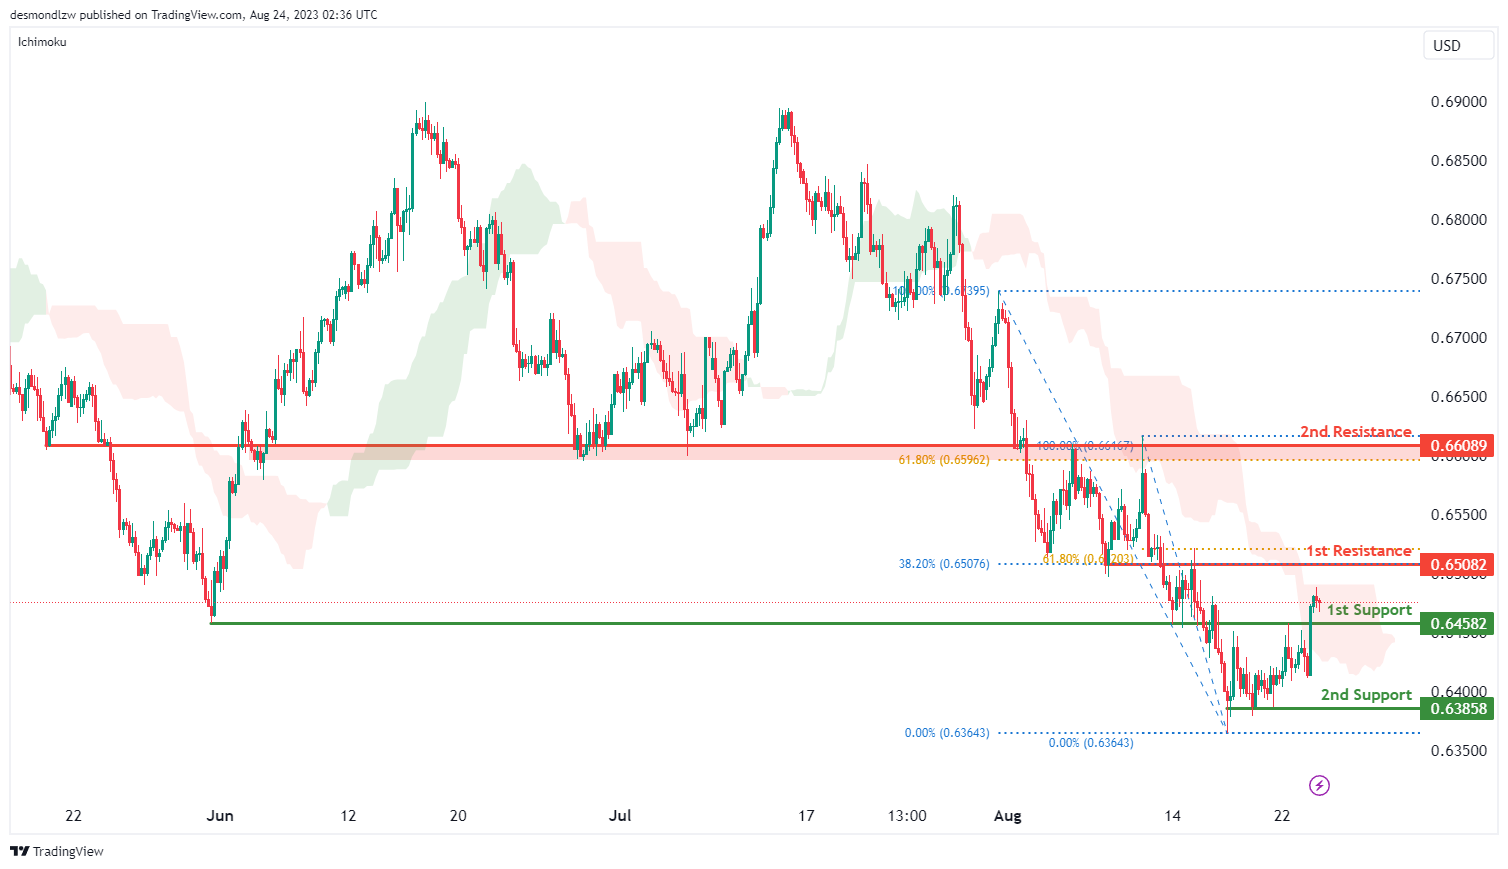
The AUD/USD chart currently indicates a weak bearish momentum, implying a prevalent downward trend in the market. There is a potential for price to pull back towards the 1st support level at 0.6458.
This 1st support level at 0.6458 is identified as an overlap support. Additionally, the 2nd support level at 0.6386 is identified as a multiple swing-low support, potentially acting as a strong barrier.
To the upside, the 1st resistance level at 0.6508 is identified as an overlap resistance that aligns with a confluence of Fibonacci levels i.e. the 38.20% and 61.80% retracement levels. Similarly, the 2nd resistance level at 0.6609 is also identified as an overlap resistance that aligns with the 61.80% Fibonacci retracement level.
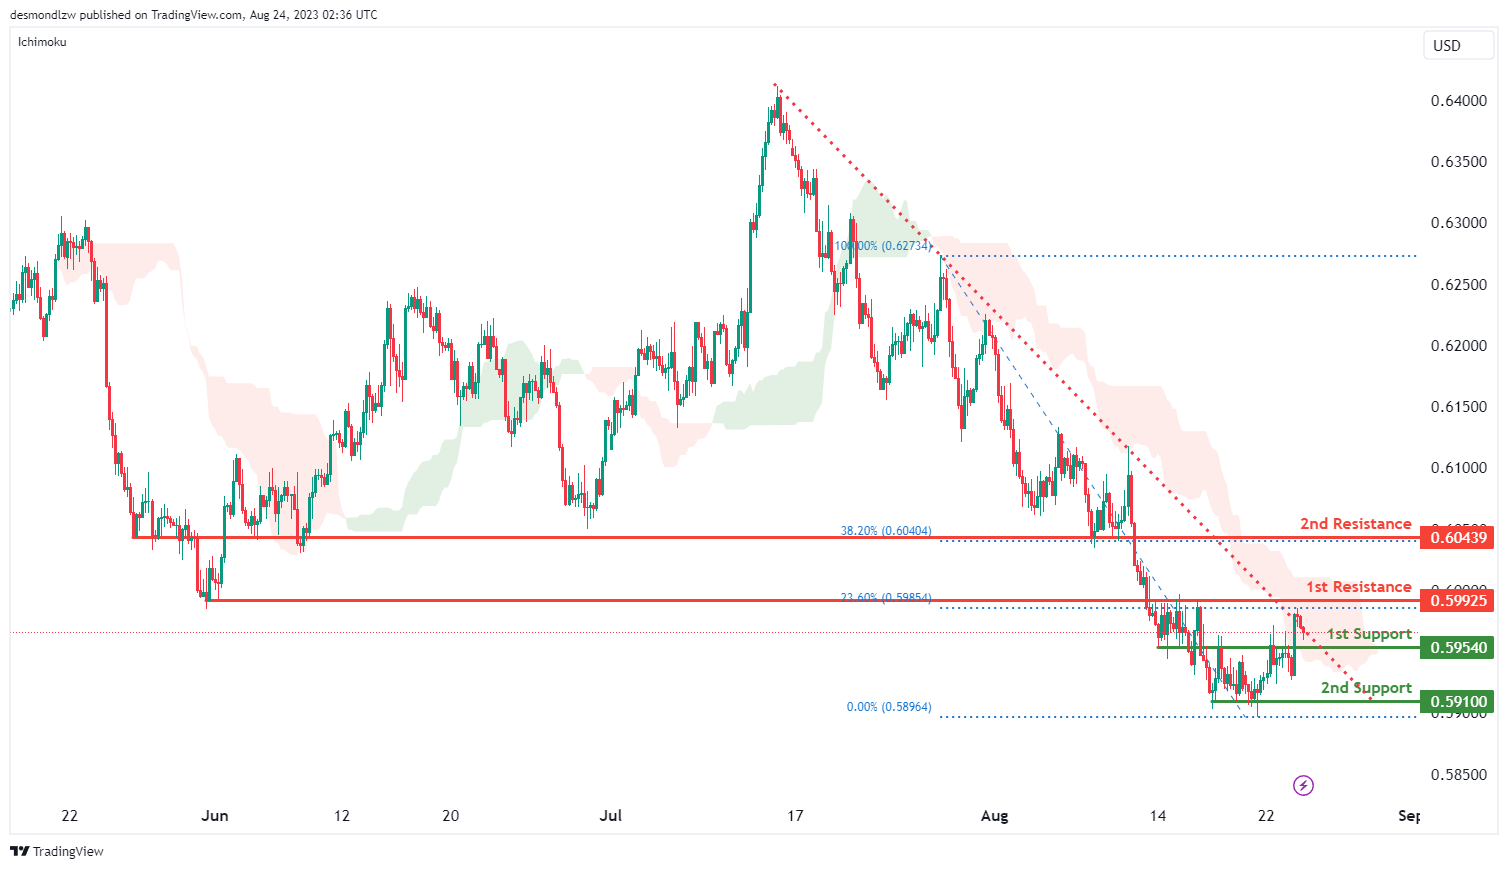
NZD/USD
The NZD/USD chart currently reflects a bearish momentum, suggesting a prevailing downward trend. Given this bearish momentum, it is possible that price could pull back towards the 1st support level at 0.5954.
This 1st support level at 0.5954 is identified as an overlap support. Additionally, the 2nd support level at 0.5910 is identified as a multiple swing-low support, potentially offering a robust level of support.
To the upside, the 1st resistance level at 0.5993 is identified as an overlap resistance that aligns with the 23.60% Fibonacci retracement level. Similarly, the 2nd resistance level at 0.6044 is also identified as an overlap resistance that aligns with the 38.20% Fibonacci retracement level.
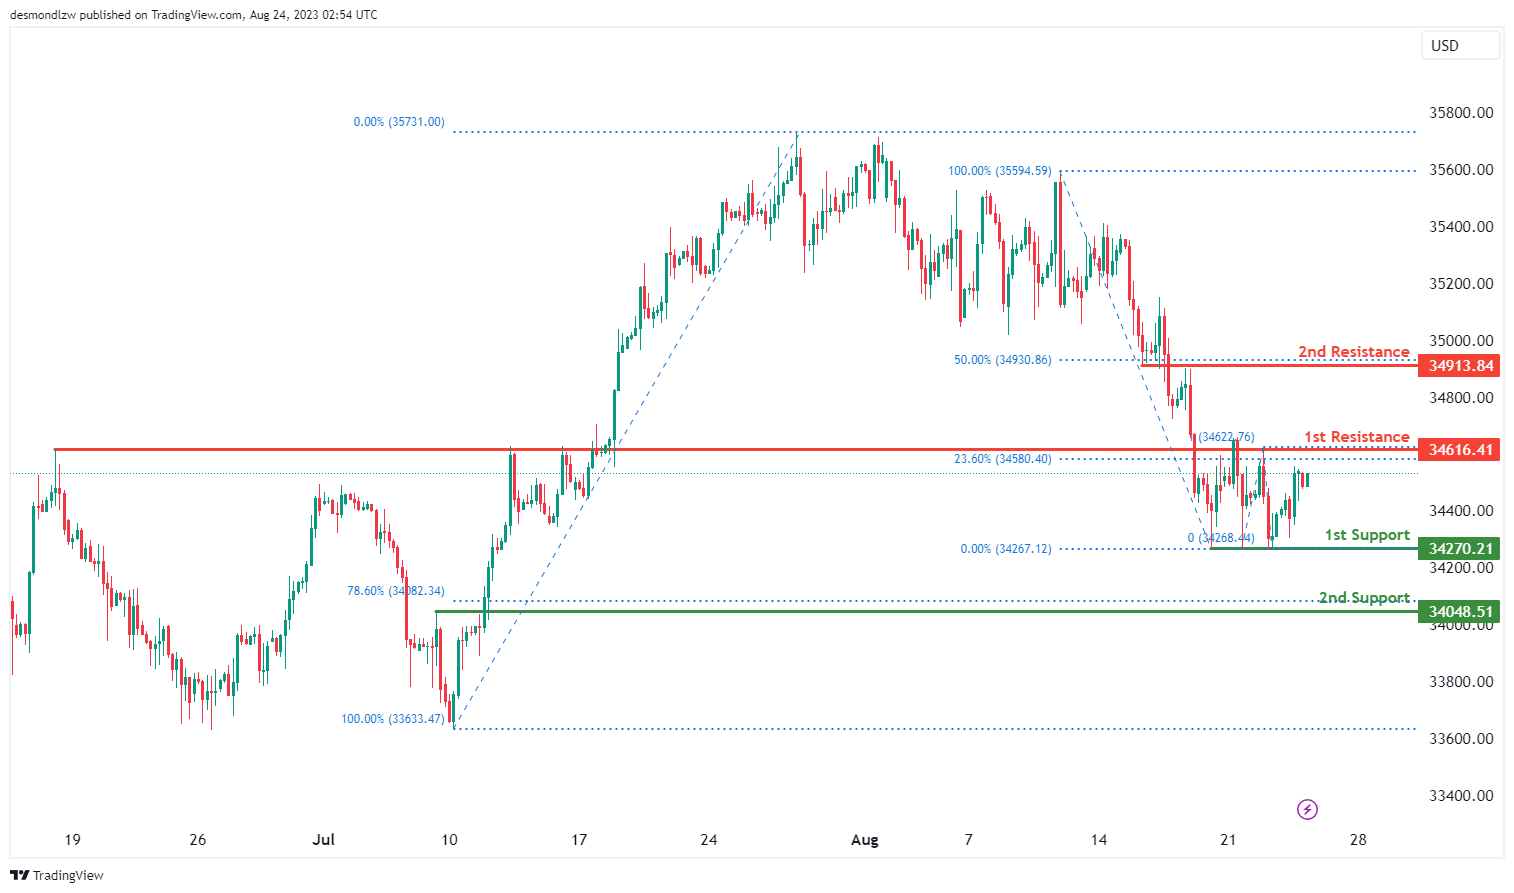
DJ30:
The DJ30 (Dow Jones Industrial Average) chart is currently displaying a neutral momentum, suggesting a lack of a clear trend direction.
Within this context, there’s a possibility that the price might exhibit a pattern of fluctuation between the 1st support level at 34,616.41 and the 1st resistance level at 34,616.41.
The 1st support at 34,616.41 is noted as an overlap support, indicating a historical price level where support has been observed. Additionally, the 2nd support at 34,048.51 gains significance due to its alignment with the 78.60% Fibonacci Retracement, potentially strengthening its role as a pullback support.
As for resistance levels, the 1st resistance at 34,616.41 is designated as an overlap resistance, indicating a historical level where resistance has been observed. The 2nd resistance at 34,913.84 holds importance as an overlap resistance and is aligned with the 50% Fibonacci Retracement, potentially reinforcing its significance.
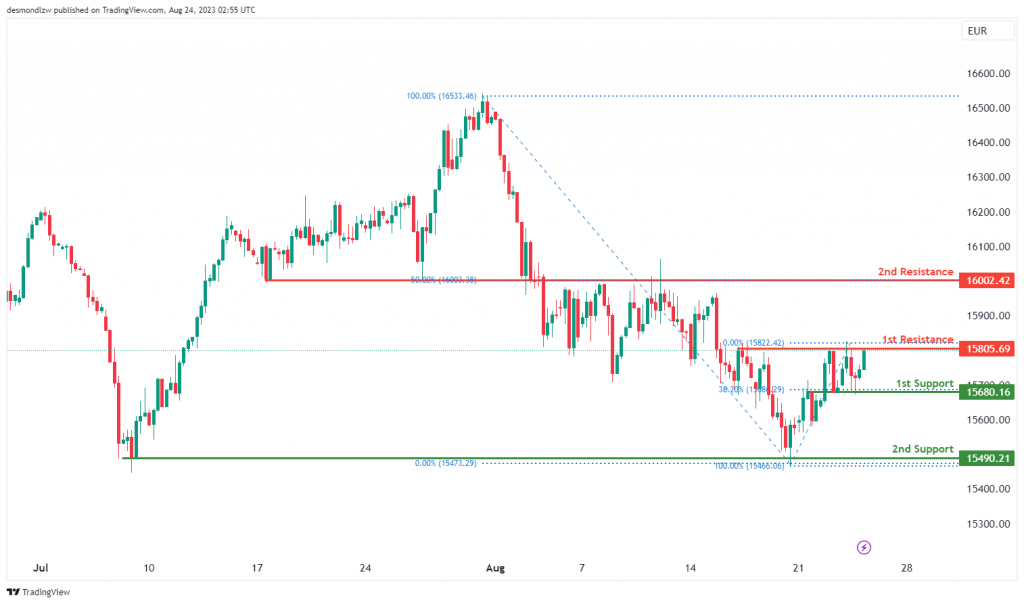
GER30:
The GER30 (DAX 30) chart is currently showing a neutral momentum, indicating a lack of a definitive trend direction.
Within this context, it’s possible that the price could exhibit a pattern of fluctuation between the 1st support level at 15,680.16 and the 1st resistance level at 15,805.69.
The 1st support at 15,680.16 is identified as an overlap support and is also aligned with the 38.20% Fibonacci Retracement, which adds to its significance. The 2nd support at 15,490.21 holds importance as a multi-swing low support, indicating historical levels where price has found support.
As for resistance levels, the 1st resistance at 15,805.69 is designated as a multi-swing high resistance, indicating historical resistance levels. The 2nd resistance at 16,002.42 gains significance as an overlap resistance and is also aligned with the 50% Fibonacci Retracement.
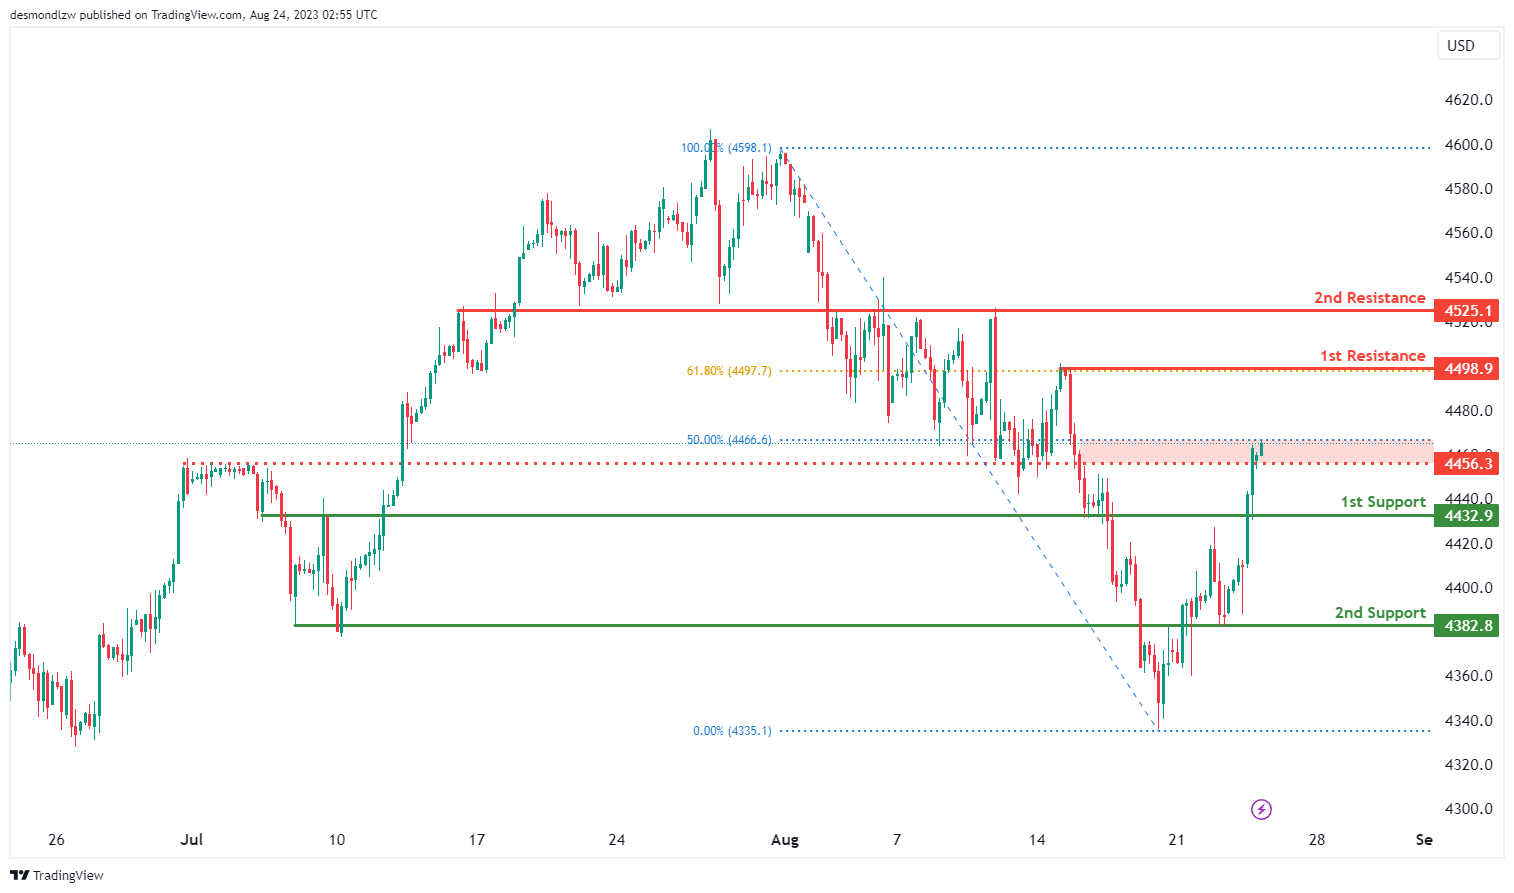
US500
The US500 (S&P 500) chart is currently displaying a bullish momentum, indicating a prevailing upward trend.
In this context, there’s a potential scenario where the price could continue its bullish movement towards the 1st resistance level at 4498.9.
For support levels, the 1st support at 4432.9 and the 2nd support at 4382.8 are both identified as overlap supports, reinforcing their significance.
The 1st resistance at 4498.9 is noted as a swing high resistance, and it gains further importance due to aligning with the 61.80% Fibonacci Retracement level. The 2nd resistance at 4525.1 is designated as an overlap resistance.
Additionally, an intermediate resistance level at 4456.3 is identified as a pullback resistance, and it’s aligned with the 50% Fibonacci Retracement level.
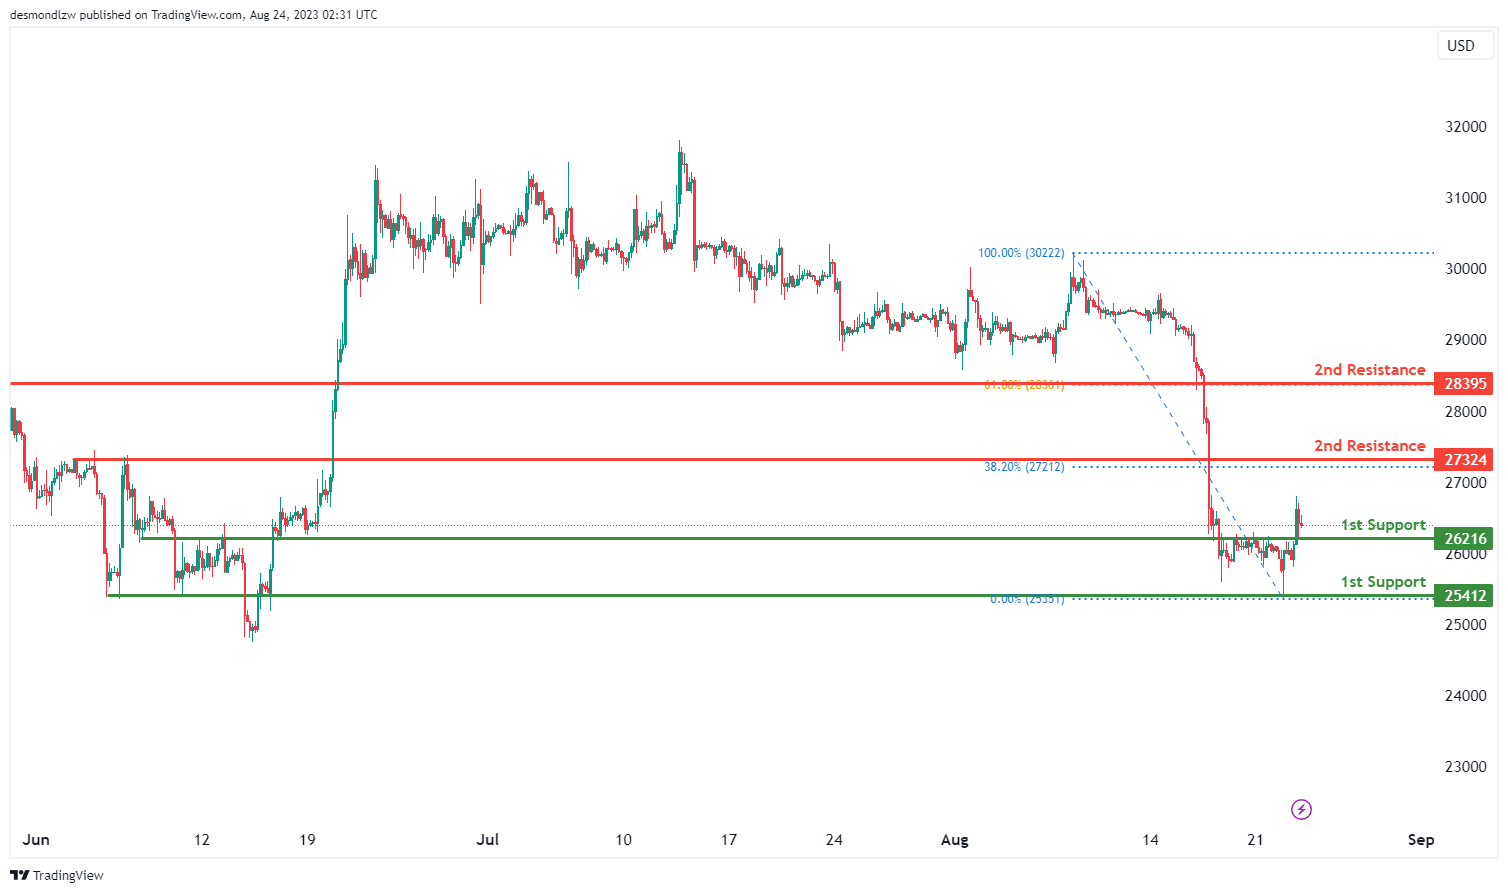
BTC/USD:
Instrument: BTC/USD (Bitcoin to US Dollar)
Overall momentum of the chart: Bullish
The BTC/USD (Bitcoin to US Dollar) chart is currently showing a bullish momentum, indicating a prevailing upward trend.
In this context, there’s a potential scenario where the price could continue its bullish movement towards the 1st resistance level at 27324.
For support levels, the 1st support at 26216 is identified as a pullback support, while the 2nd support at 25412 is designated as an overlap support, enhancing their significance.
The 1st resistance at 27324 gains importance due to its role as a pullback resistance and aligns with the 38.20% Fibonacci Retracement level. Similarly, the 2nd resistance at 28395 is noted as a pullback resistance and is associated with the 61.80% Fibonacci Retracement level.
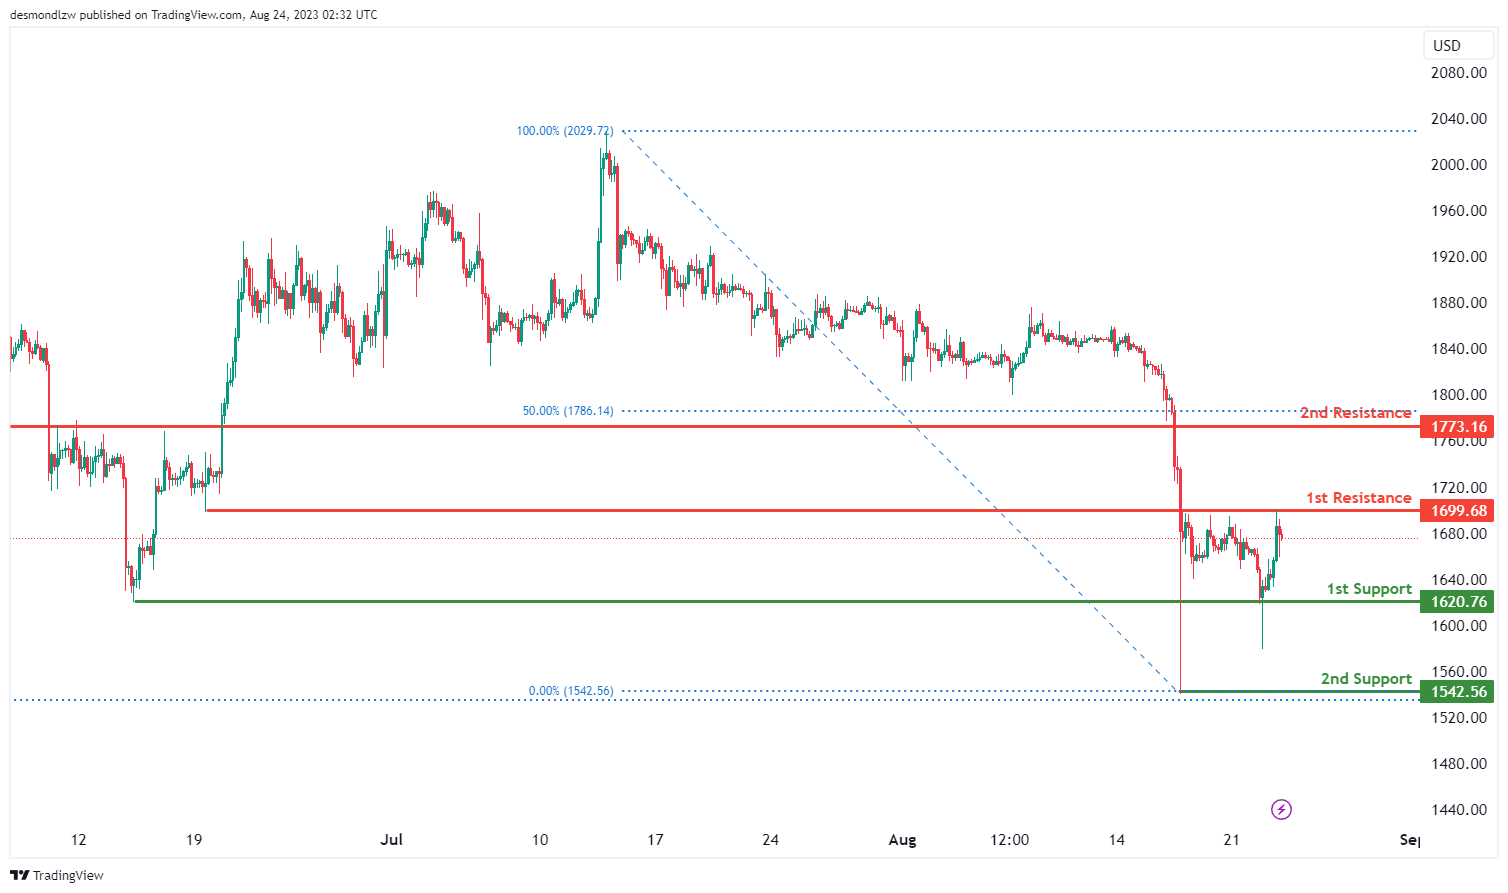
ETH/USD:
The ETH/USD (Ethereum to US Dollar) chart is currently exhibiting a neutral momentum, indicating a lack of strong directional bias.
In this context, there’s a potential scenario where the price could experience fluctuations within a range defined by the 1st support at 1620.76 and the 1st resistance at 1699.68.
The 1st support at 1620.76 is identified as a swing low support, emphasizing its potential significance in providing a foundation for price movements. Similarly, the 2nd support at 1542.56 is also categorized as a swing low support, further reinforcing its role in potential price reactions.
Conversely, the 1st resistance at 1699.68 is considered an overlap resistance, potentially acting as a barrier to upward movements. The 2nd resistance at 1773.16 holds importance as a pullback resistance and aligns with the 50% Fibonacci Retracement level, adding to its potential relevance.
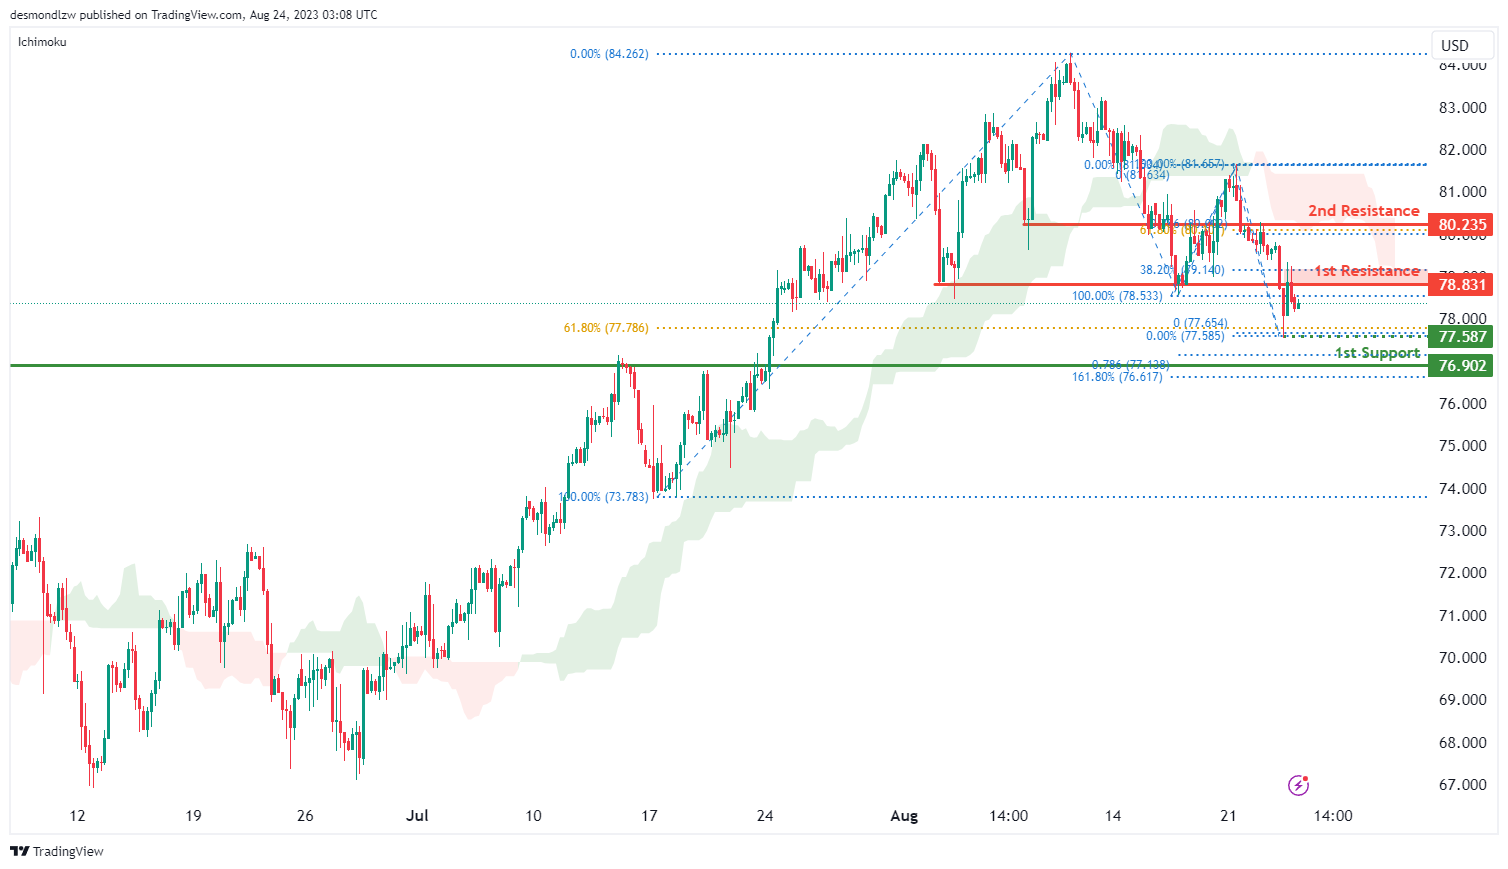
WTI/USD:
The WTI chart currently indicates a bearish momentum, suggesting a prevailing downward trend. There is potential for price to continue its downward movement towards the 1st support level at 76.90.
There is also an intermediate support level at 77.59 which is identified as a recent swing-low that aligns with the 61.80% Fibonacci retracement level. The 1st support level at 76.90 is identified as an overlap support that aligns with a confluence of Fibonacci levels i.e. the 161.80% extension and the 78.60% projection levels.
To the upside, the 1st resistance level at 78.83 is identified as an overlap resistance that aligns close to the 38.20% Fibonacci retracement level. The 2nd resistance level at 80.24 is also identified as an overlap resistance that aligns with the 61.80% Fibonacci retracement level.
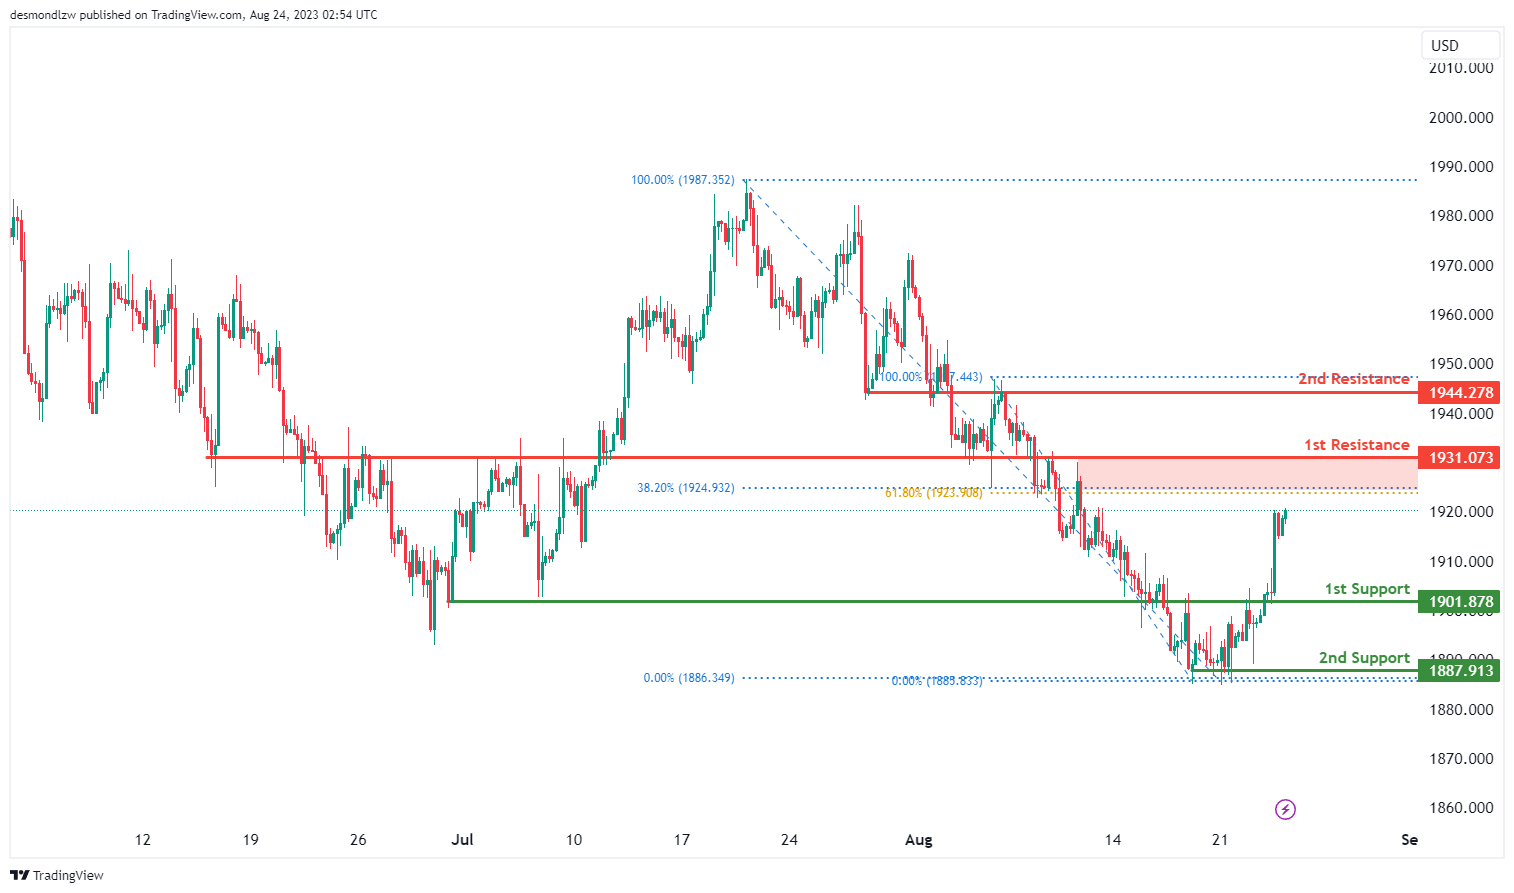
XAU/USD (GOLD):
The XAU/USD (Gold to US Dollar) chart is currently showing a bullish momentum, suggesting a tendency for upward movement.
In this context, there’s a potential scenario where the price could experience a bullish continuation towards the 1st resistance at 1931.07.
The 1st support at 1901.87 is considered an overlap support, indicating its significance as a potential level where price might find stability or rebound. Similarly, the 2nd support at 1887.91 is identified as a multi-swing low support, further strengthening its potential role in providing a foundation for price movements.
Conversely, the 1st resistance at 1931.07 is categorized as an overlap resistance, which could act as a barrier to further upward movements. The 2nd resistance at 1944.27 is also recognized as an overlap resistance, adding to its potential importance in limiting upward price progress.