

Sample Category Title
Silver accelerates up, taking Gold higher
Silver's impressive rally intensified yesterday, pulling Gold upwards in its wake. This surge seems to be a direct response to the retracement of benchmark treasury yields in both the US and Europe, which were affected by less-than-stellar PMI figures. Market sentiment is now swaying towards the belief that major central banks might be quickly approaching the finale of their tightening cycle. All eyes are set on upcoming Jackson Hole Symposium. While the spotlight is certainly on the speech by Fed Chair Jerome Powell, insights and comments from other prominent central bankers are also poised to influence market directions.
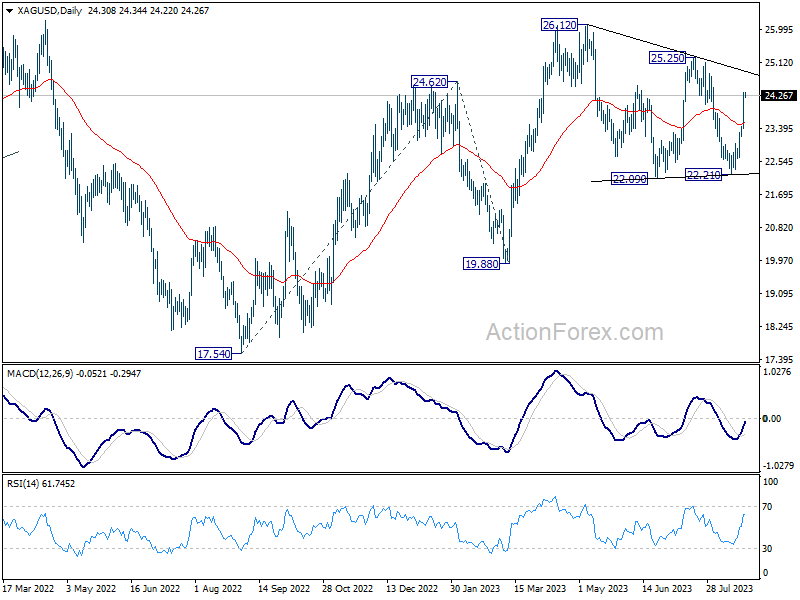
Technically, Silver's strong break of 55 D EMA affirms the case that consolidation pattern from 26.12 has completed with three waves to 22.21. Further rise is now expected as long as this 55 D EMA (now at 23.56) holds, to 25.25 resistance first. Decisive break there should confirm this bullish case, and should also resume whole up trend from 17.54 (2022 low). Next target would be 100% projection of 17.54 to 24.62 from 19.88 at 26.96.
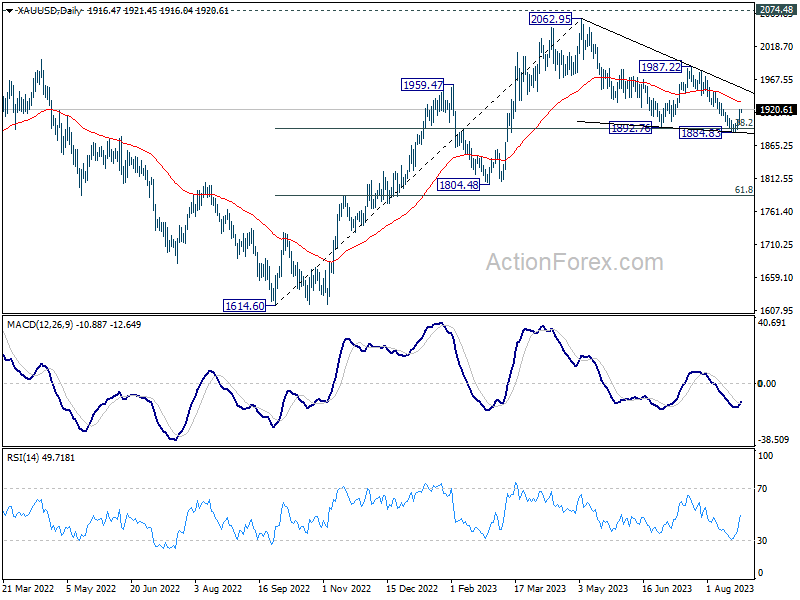
As for Gold, a short term bottom is in place at 1884.83, with D MACD crossed above signal line. Further rebound is now in favor to 55 D EMA (now at 1932.52). Sustained break there will argue that whole corrective pattern from 2062.95 has completed with three waves down to 1884.83, after defending 38.2% retracement of 1614.60 to 2062.95 at 1891.68. Stronger rally would then be seen to 1987.22 resistance to confirm this bullish scenario.
Crude Oil Price Drops Below $80 And Might Extend Losses
Key Highlights
- Crude oil price declined below the $81.50 and $80.00 support levels.
- It traded below a major bullish trend line with support near $79.90 on the 4-hour chart.
- Gold prices recovered above $1,915 but might struggle near $1,930.
- EUR/USD is moving lower toward the 1.0800 support.
Crude Oil Price Technical Analysis
Crude oil price started a fresh decline after it settled below $82.00 against the US Dollar. The price traded below the $80.50 support to move into a bearish zone.
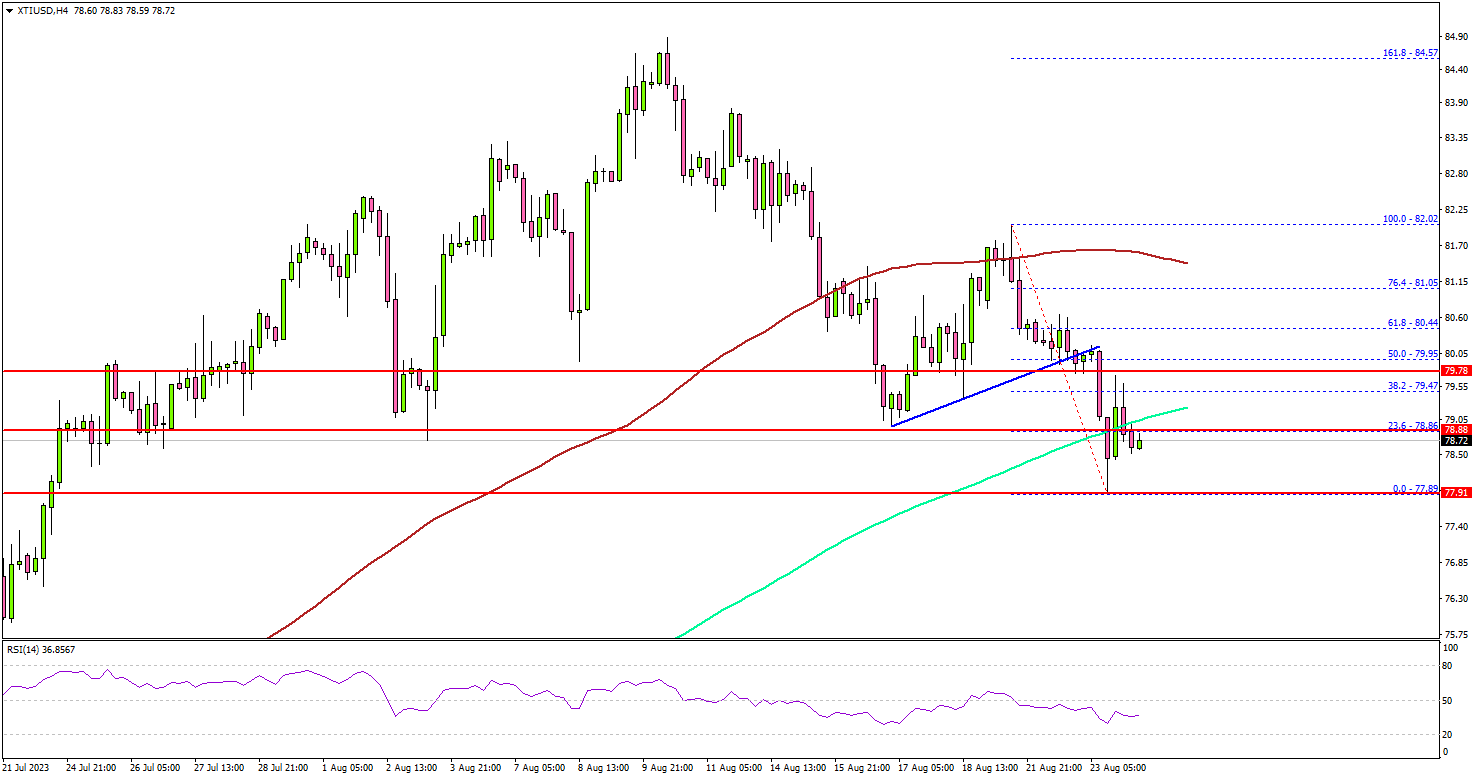
Looking at the 4-hour chart of XTI/USD, the price gained bearish momentum below the $80.00 support, the 100 simple moving average (red, 4-hour), and the 200 simple moving average (green, 4-hour).
It even tested the $77.80 zone. A low was formed near $77.89 before the price started a recovery wave. It retested the $79.00 resistance zone and the 23.6% Fib retracement level of the downward move from the $82.02 swing high to the $77.89 low.
The next major resistance is near the $80 level or the 50% Fib retracement level of the downward move from the $82.02 swing high to the $77.89 low, above which the price may perhaps accelerate higher. In the stated case, it could even visit the $82 resistance.
On the downside, initial support is near the $78.00 level. The next major support sits near the $77.80 level. Any more losses might call for a test of the $76.50 support zone in the coming days.
Looking at gold prices, there was a decent recovery wave above the $1,915 level but the bears might remain active near the $1,930 zone.
Economic Releases to Watch Today
- Jackson Hole Symposium
- US Initial Jobless Claims - Forecast 240K, versus 239K previous.
- US Durable Goods Orders for July 2023 – Forecast -4.0% versus +4.6% previous.
Eyes on NASDAQ’s next move after Nvidia’s earnings triumph boosts confidence
In a significant boost to investor sentiment, Nvidia's earnings report surpassed even the loftiest expectations, particularly spotlighting its thriving data center business. The company's A100 and H100 AI chips, integral to powering AI marvels like ChatGPT, stood out as key contributors to their success. In a forward-looking statement, Nvidia anticipates a fiscal third-quarter revenue of approximately USD 16B, hinting at a colossal 170% growth compared to the same quarter last year.
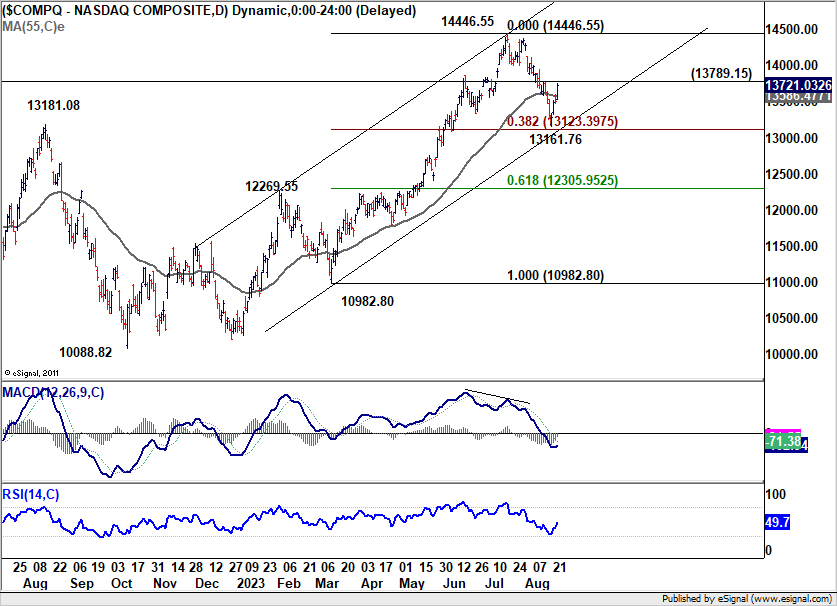
NASDAQ, seemingly anticipating this optimistic news, had already surged by 1.59% at the day's close, prior to Nvidia's earnings announcement. The development now argues that pull back from 14446.55 has completed at 13161.76, just ahead of the medium term channel support, as well as 38.2% retracement of 10982.80 to 14446.55 at 13123.39. More importantly, if this turn out to be true, rise from 10088.82 should then remain intact for another high above 14446.55.
Market watchers will now keenly focus on the momentum in the coming days, especially awaiting reactions post the much-anticipated speech by Fed Chair Jerome Powell at the Jackson Hole Symposium. This will likely shed light on the feasibility of this bullish prognosis.
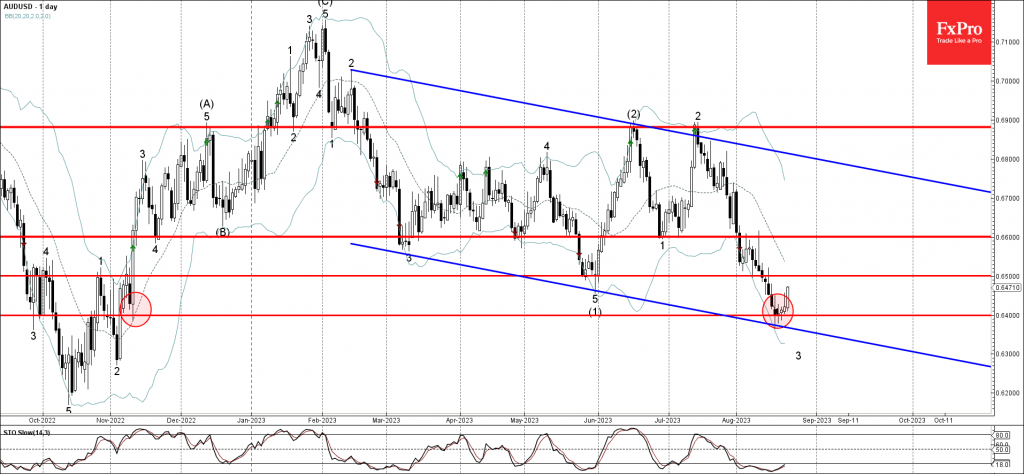
AUDUSD Wave Analysis
- AUDUSD reversed from support level 0.6400
- Likely to rise to resistance level 0.6500
AUDUSD currency pair recently reversed up from the key support level 0.6400, which also reversed the pair In November, standing near the lower daily Bollinger Band and the support trendline of the daily down channel from February.
The upward reversal from the support level 0.6400 stopped the earlier short-term impulse wave 3 from the middle of July.
Given the strength of the support level 0.6400 and the oversold daily Stochastic, AUDUSD can be expected to rise further toward the next resistance level 0.6500.
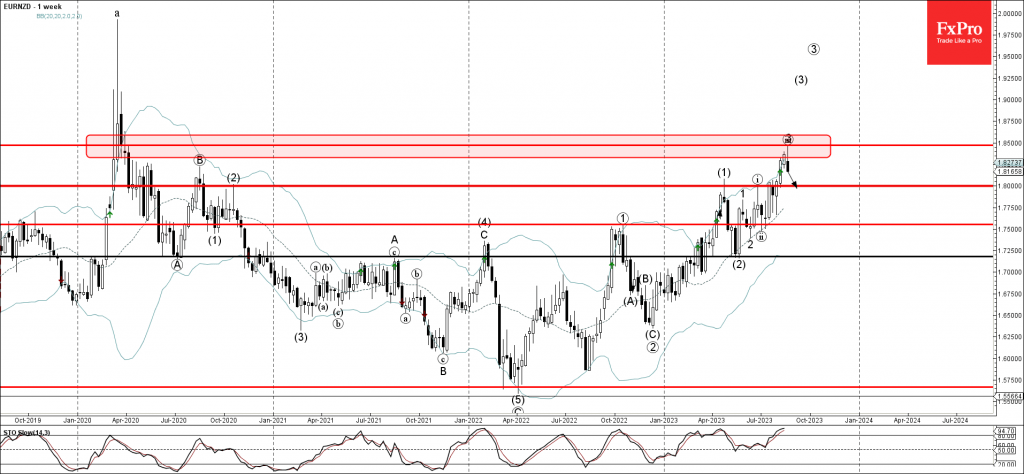
EURNZD Wave Analysis
- EURNZD reversed from resistance level 1.8500
- Likely to fall to support level 1.8000.
EURNZD recently reversed down from the key resistance level 1.8500 standing well above with the upper weekly and the daily Bollinger Bands.
The downward reversal from the support level 1.8500 stopped the earlier intermediate impulse wave (3) from June.
Given the strength of the resistance level 1.8500 and the overbought weekly Stochastic, EURNZD can be expected to fall further toward the next round support level 1.8000.
Sunset Market Commentary
Markets:
The preliminary August PMI’s showed business activity in EMU contracting at accelerating pace. The composite output declined from 48.6 to 47. After 14 consecutive sub 50 readings for the manufacturing sector (43.7 from 42.7), negative growth spread to the services sector (from 50.9 in July to 48.3, the lowest level in 30 months). Both manufacturing and the services reported falling output and orders, with the goods producing sector still recording the shaper rates of decline. The backlog of work declined in both sectors. According S&P/HCOB “hiring came close to stalling as companies grew more reluctant to expand capacity in the face of deteriorating demand and gloomier prospects for the year ahead’. Despite the contraction in activity, prices remain cause of concern. Inflationary pressures are weaker than seen on average during the previous two years, but average selling prices and input costs again accelerated in August. Especially the rise in the rate of input cost inflation caught the eye as a fall in manufacturers’ costs was counterbalanced by an upturn in input costs from the services sector, mainly attributed to rising wage pressures. On a country level, Germany registered the steepest decline (composite 44.7 from 48.5). The rate of contraction in France was unchanged at 46.6 after the steep drop last month. The rest of Europe recorded a more moderate decline in output. According the analysis of HCOB, July and August PMI’s point at a 0.2% GDP contraction in Q3. The sharp decline in EMU activity both hammered EMU yields and the single currency. German yields currently decline between 8 bps (2 & 30-y) and 10 bps (5-10y) (before the release of the US PMI’s). Markets understandably see the weaker activity as potentially triggering a pause in the ECB hiking cycle at the September meeting. However, higher wages still at risk of sustaining an upward wage price spiral, suggest quite a tense internal debate within the ECB. The poor EMU performance pushed EUR/USD below the 1.0834 support. However, the decline slowed in US dealings (currently 1.0825). EUR/GBP briefly tested the 0.85 area post the EMU PMI’s, but the negative surprise in the UK PMI (see below) was at least as big as in EMU, questioning the BoE’s anti-inflationary commitment. The UK 2-y yield currently declines 15 bps+. EUR/GBP rebounded to the 0.856 area. The recessionary narrative also blocked a modest further rise in European equities (Eurostoxx 50 -0.2%). US indices open marginally stronger (S&P 500 +0.3%).
US PMI’s are published as we finish this report. They also show a further deceleration in activity. However, the composite index at 50.4 (from 52.0) stays in positive territory. Both manufacturing (47.0) and services (51.0) fell more than expected. In a first reaction US yields fully catch up with the decline in EMU rates. The belly of the curve outperforms (5-y -13 bps). The dollar returns part of its intraday outperformance with the DXY index dropping from near 104 to 103.75.
News & Views:
The UK composite PMI crashed in August from 50.8 to 47.9 (vs 50.4 expected). It’s a return to bust-territory (< 50) following a spell from August 2022 until January 2023. Details showed a similar deterioration in both manufacturing (42.5 from 45.3 vs 45 expected) and services (48.7 from 51.5 vs 51 expected). S&P Global Market Intelligence, responsible for the release, said that details suggest that inflation should moderate further in the months ahead, but also indicate that the fight against inflation is carrying a heavy cost in terms of heightened recession risks. July and August PMI’s combined hint at a 0.2% Q/Q GDP contraction in Q3. Companies are reporting reduced orders for goods and services as demand is increasingly hit by the cost-of-loving crisis, higher interest rates, export losses and concerns about the economic outlook while a further pull-back in hiring indicates that the labour market is losing steam.
The Indian government is expected to impose a ban on sugar exports for the fiscal year 2023-2024 according to a Reuters report. It would be the first such restriction in seven years. A concerning dearth of rainfall has adversely impacted cane yields. The decision could put additional pressure on sugar prices. The UN Food and Agricultural World Sugar price index reached its highest level since 2011 as recently as May this year.
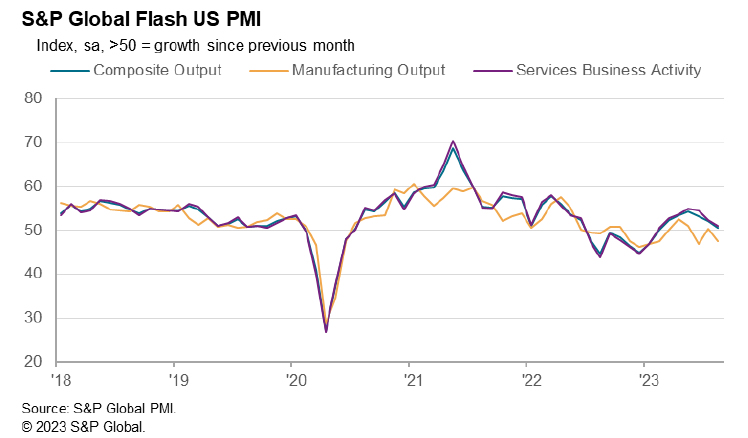
US PMI composite fell to 50.4, near stagnation
US PMI Manufacturing fell form 49.0 to 47.0 in August. PMI Services fell from 52.3 to 51.0. PMI Composite fell from 52.0 to 50.4.
Chris Williamson, Chief Business Economist at S&P Global Market Intelligence said:
"A near-stalling of business activity in August raises doubts over the strength of US economic growth in the third quarter. The survey shows that the service sector-led acceleration of growth in the second quarter has faded, accompanied by a further fall in factory output.
"Companies report that demand is looking increasingly lethargic in the face of high prices and rising interest rates. A resultant fall in new orders received by firms in August could tip output into contraction in September as firms adjust operating capacity in line with the deteriorating demand environment. Hiring could likewise soon turn into job shedding in the coming months after a near-stagnation of employment in August.
"Rising wage pressures as well as increased energy prices have meanwhile pushed input cost inflation higher, which will raise concerns over the stickiness of consumer price inflation in the months ahead. One upside is that weak demand is starting to limit pricing power, which should help keep a lid on inflation around the 3% mark."
WTI Oil: Prices Accelerate Lower on Fresh Demand Concerns
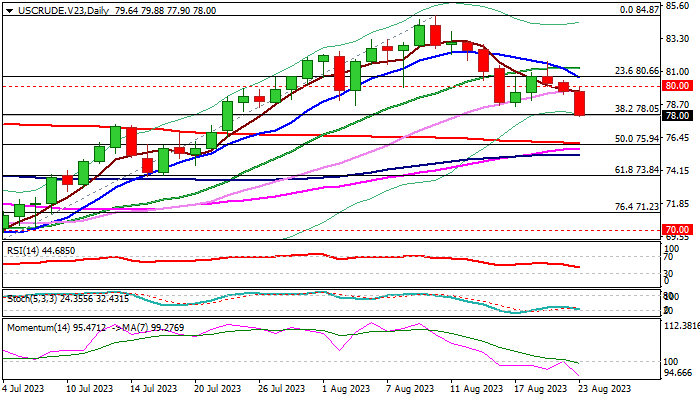
WTI oil price fell around 1.6% on Wednesday after weak manufacturing data from Japan, Eurozone and Great Britain (PMI’s stay in contraction territory below 50 threshold) raised concerns about demand and further soured near-term sentiment.
Acceleration of a bear-leg off $81.71 (Aug 21 recovery peak) broke through $78.58 (Aug 17 higher low) and cracked pivotal Fibo support at $78.05 (38.2% of $67.02/$84.87) generating fresh bearish signal for deeper drop (signal to be confirmed on close below $78.05) towards next targets at $76.03/$75.94 (200DMA/50% retracement).
Weakening technical structure on daily chart (14-d momentum remains in negative territory and started fresh decline, south-heading RSI below neutrality zone and multiple bear-crosses of 5/10/20/30DMA’s) contribute to bearish near-term outlook.
Resistances at $78.58/$79.02 (Aug 17/18 lows) should cap and keep intact upper pivots at $80.00/66 (psychological/10DMA) violation of which would sideline bears.
Res: 78.58; 79.02; 79.62; 80.00.
Sup: 76.41; 76.02; 75.17; 74.50.
Rate Expectations Pared Back as PMIs Point to Recession
European stocks have given back the bulk of their gains this morning as flash PMI data points to a possible recession over the remainder of the year.
The UK readings were particularly stark, with both the services and manufacturing PMIs falling well short of forecasts and the former deep into contraction territory. What's more, the weakness was quite widespread from new orders to hiring, which suggests we're not just talking about a blip in the data, but rather the prospect of a recession in the second half of the year.
From the Bank of England's perspective, there's a lot within the data that will be viewed as encouraging, with slower employment resulting in less tightness in the labour market and lower prices paid across manufacturing and services sectors indicating easing inflationary pressures, in theory at least.
The surveys alone won't be enough to convince the MPC and another rate hike in September looks a near-certainty but beyond that, traders have been paring back expectations on the back of these releases, with only one more then priced in this year.
ECB may be convinced to hold in September after latest data
The data from the eurozone was no more promising, particularly Germany - the bloc's largest economy - which has had a harder year than most and looks likely to continue to do so going into next year.
There was a slight and unexpected improvement in the manufacturing number, albeit from a very low base and it still remains deep in contraction territory. But services contracted against expectations and the number was some way below forecasts and the July reading.
Interest rate probabilities were pared back in the eurozone this morning too, with traders viewing the meeting in a few weeks as a coin toss between standing pat and another 25 basis point hike. Another hike is far from guaranteed in the cycle and today's data certainly supports the case for pausing to see what impact past tightening has had.
European PMIs see oil accelerate lower
Oil prices are drifting lower again this morning on the back of the European PMIs and in a sign that traders may have an eye on Jackson Hole later this week. Economic resilience has been a key feature globally this year but we may finally be seeing interest rates taking their toll just as traders began to accept they may need to stay higher for longer.
Policymakers have been at the more hawkish end of the spectrum for some time and traders were increasingly coming around to the idea that rates won't fall as soon or as quickly as they hoped. Today's numbers may help the case for that not to be the case but they'll need to be backed up by plenty of hard data to convince central banks.
Supply restrictions have enabled prices to move into a higher range over the last month but that will only be sustained as long as economies continue to display the kind of resilience they have until now. Avoiding a recession was the goal of central banks but now it may be a case of aiming to keep it shallow.
Will central banks maintain hawkish stance at Jackson Hole?
Gold has pared losses over the last few days to trade around $1,900, with traders eyeing Jackson Hole for hints about future monetary policy moves. The event has, on occasion, been used as a platform to communicate a significant shift in approach, and with the Fed and others nearing or at the end of their tightening cycles, there's every chance it's used in a similar manner again.
That said, the prospect of the Fed and others becoming suddenly dovish is not realistic. While they may indicate the tightening cycle is likely over, which would be a big shift in the communication, they will almost certainly push back at the prospect of rate cuts in the foreseeable future.
Considering gold has been forced lower by the prospect of higher rates for longer, it would likely take an attempt to cool that speculation to trigger a significant recovery. Confirmation on the other hand may contribute further to its decline, potentially solidifying the break below $1,900.