Sample Category Title
Bitcoin: Bounce, Rally Yet to Start
Market picture
Crypto market capitalisation was up 1.6% over 24 hours to $1.066 trillion, with impressive gains on Wednesday afternoon. Following the strong rally in US tech stocks, buyers are gently picking up cryptocurrencies after the recent sell-off.
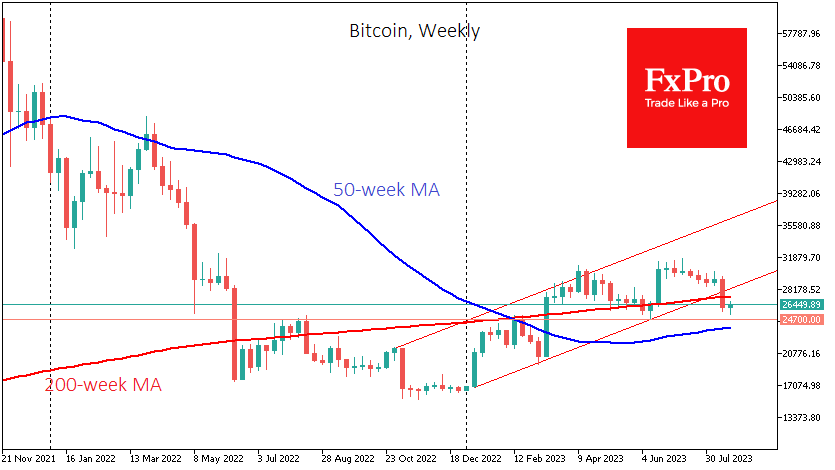
Bitcoin touched a low for the week of $25.33K – above the local June lows of $24.7K, fuelling hopes that the uptrend is still in play. Meanwhile, BTCUSD remains below its 200-week average and the lower boundary of its former bull corridor.
Technically, Bitcoin is dominated by downside risks, with the potential to fall to $23.8K, where the 50-week moving average lies. However, we see Wednesday’s rebound as short-term profit-taking on short positions amid the most oversold RSI conditions since June 2022.
News background
Bitcoin’s mining difficulty rose 6.17% to an all-time high of 55.6T. According to Glassnode, the network’s 7-day moving average hash rate peaked at 414 EH/s.
Twitter analyst Bluntz, who predicted a bear trend for Bitcoin in 2018, expects the crypto market’s total capitalisation to fall by 15% before a new rally begins. He believes this will be the last good opportunity to buy Bitcoin for the next few years.
According to the Financial Times, inflows into European crypto funds increased significantly after BlackRock launched a spot bitcoin ETF. Investments increased by €150 million in June alone.
Cryptocurrencies increase financial risks in emerging markets and are not attractive, says a new report from the Bank for International Settlements (BIS). This will become even more true as crypto assets become more widespread and their links to the traditional financial system strengthen.
XAU/USD: Gold Price Climbs to Two-Week High
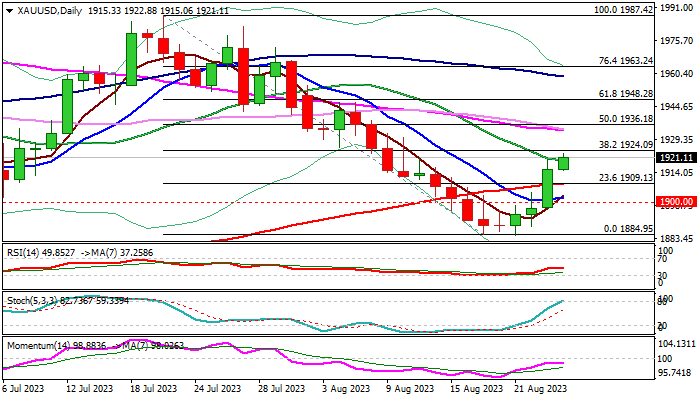
Recovery leg from $1884 (Aug 17/21 double-bottom) extends into fourth straight day and hit two-week high in early Thursday’s trading.
Gold’s near-term action remains underpinned by weaker dollar and increased demand as traders await fresh signals about interest rates from the gathering of central bankers in Jackson Hole, with focus on Friday’s speech of Fed Chair Jerome Powell.
Series of weaker than expected PMI data from Japan, EU, UK and US, released on Wednesday, point to stagnation and slowdown in the economic activity in these economies, which is strong warning to the central bankers that further increasing of interest rates may additionally hurt economic growth in already fragile conditions.
Although the US policymakers were referring to recent solid economic data which signal that the US economy remains resilient despite high borrowing cost, the latest data showed the weakest growth in months and warn that business activity stagnated in August, contributing to scenario of pausing in hike cycle.
Similar situation is in Europe, with more negative signals about contraction in business activity, which suggests that the ECB may stay on hold in September, with the worst situation seen in the UK, as weak data boost fears that the economy may slide into recession
Such scenario is likely to be supportive for gold, as weakening economic conditions would point to deepening crisis and prompt traders into safety, with pause in raising interest rates to increase pressure on US dollar.
Technical picture on daily chart is improving, following Wednesday’s break and close above 200DMA ($1908) and formation of 5/10DMA bull cross, though the risk of recovery stall exists as 14-d momentum indicator is still in negative territory and stochastic is overbought.
The price is holding just under pivotal Fibo barrier at $1924 (38.2% retracement of $1987/$1884), clear break of which is needed to generate fresh bullish signal and further reduce downside risk.
Fresh recovery could be also attracted by thinning daily cloud which twists next week and possibly help bulls to accelerate towards key obstacles at $1936/42 (50% retracement/cloud base).
Caution on return and close below 200DMA which will generate initial signal that recovery phase might be over, with dip through $1902/00 (10DMA / psychological) to confirm scenario.
Res: 1924; 1936; 1942; 1948.
Sup: 1915; 1908; 1902; 1900.
EUR/GBP Daily Outlook
Daily Pivots: (S1) 0.8497; (P) 0.8532; (R1) 0.8570; More...
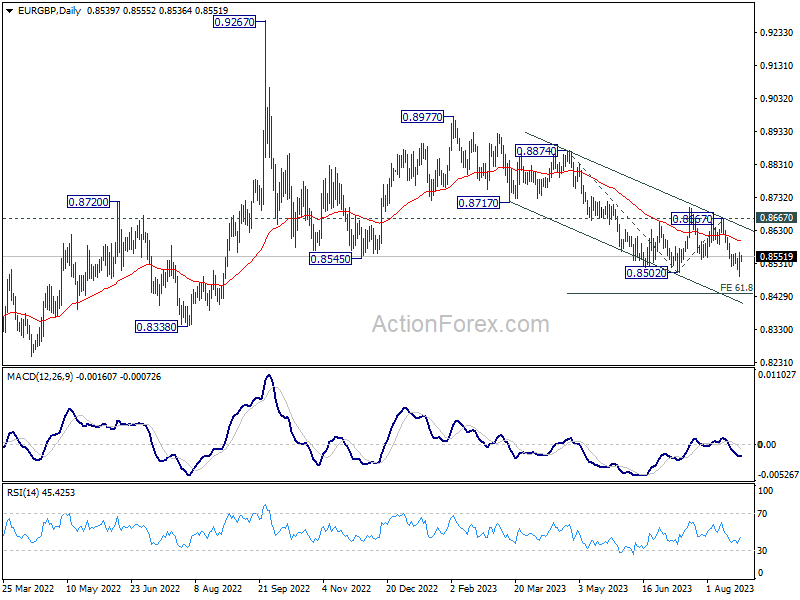
Intraday bias in EUR/GBP is turned neutral again as it recovered quickly after dipping to 0.8491. On the downside, break of 0.9891 will resume larger down trend to 61.8% projection of 0.8874 to 0.8502 from 0.8667 at 0.8437. On the upside, above 0.8564 minor resistance turn bias back to the upside for stronger rebound instead.
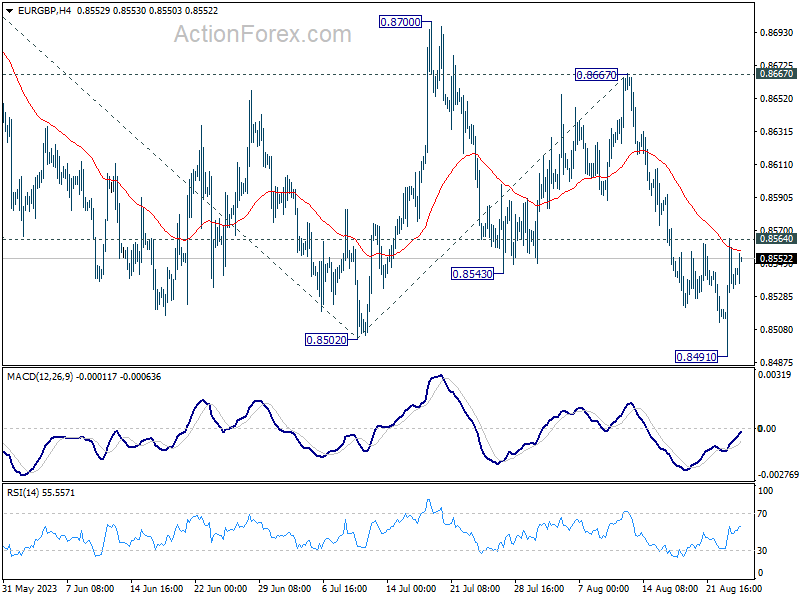
In the bigger picture, the down trend from 0.9267 (2022 high) is seen as part of the long term range pattern from 0.9499 (2020 high). Further decline is in favor as long as 0.8667 resistance holds. Break of 0.8502 will resume the fall towards 0.8201 (2022 low).
EUR/AUD Daily Outlook
Daily Pivots: (S1) 1.6714; (P) 1.6807; (R1) 1.6854; More...
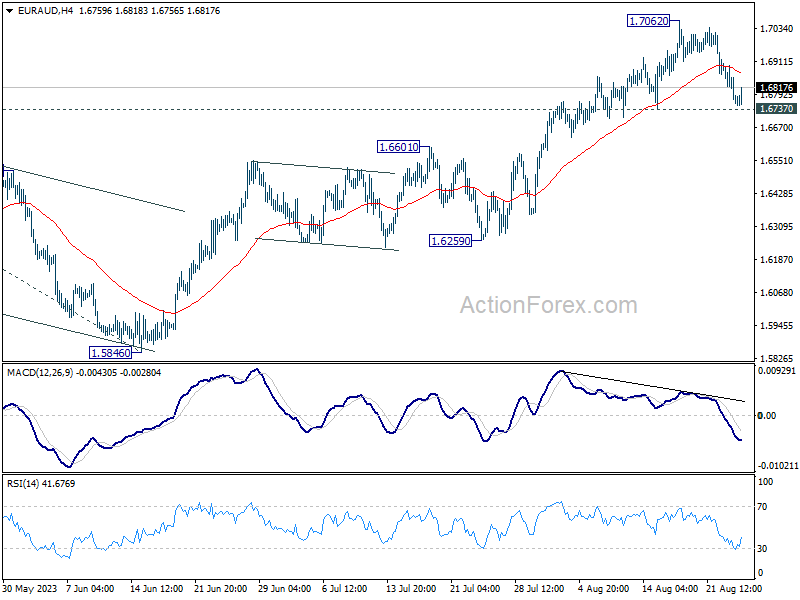
Intraday bias in EUR/AUD remains neutral for the moment. Outlook also stays bullish with 1.6737 support intact. Break of 1.7062 will resume larger rise from 1.481 to 1.7377 projection level next. However, firm break of 1.6737 will bring deeper pull back to 1.6601 resistance turned support instead.
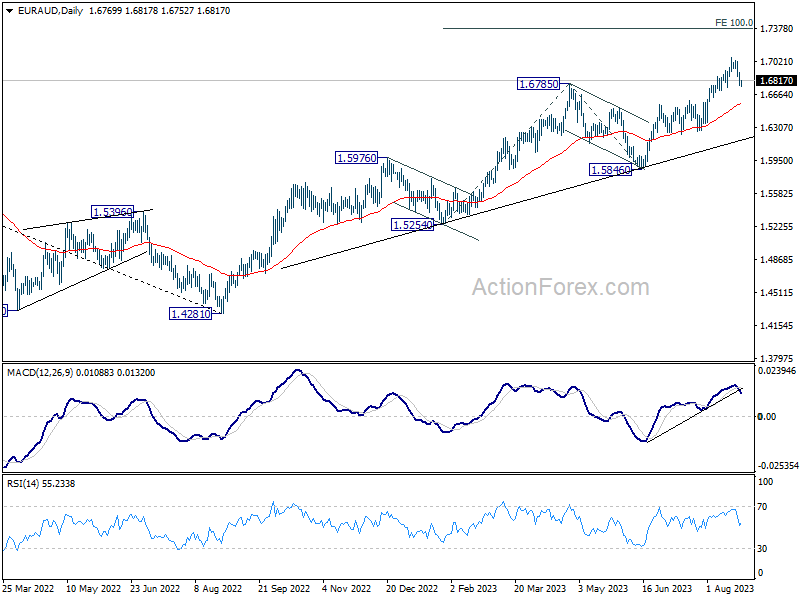
In the bigger picture, the rise from 1.4281 (2022 low) is in progress. Next target is 100% projection of 1.5254 to 1.6785 from 1.5846 at 1.7377. For now, outlook will stay bullish as long as 1.5846 support holds, even in case of another pull back.
EUR/JPY Daily Outlook
Daily Pivots: (S1) 156.69; (P) 157.54; (R1) 158.20; More....
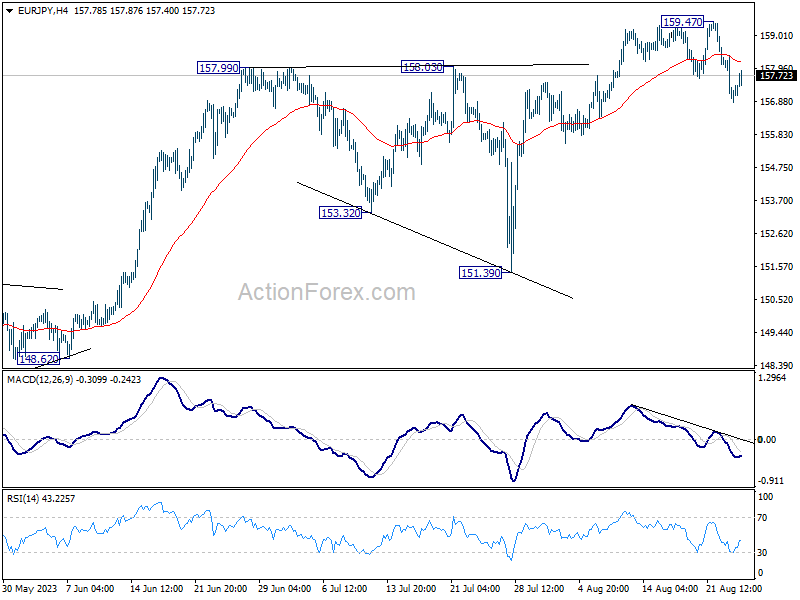
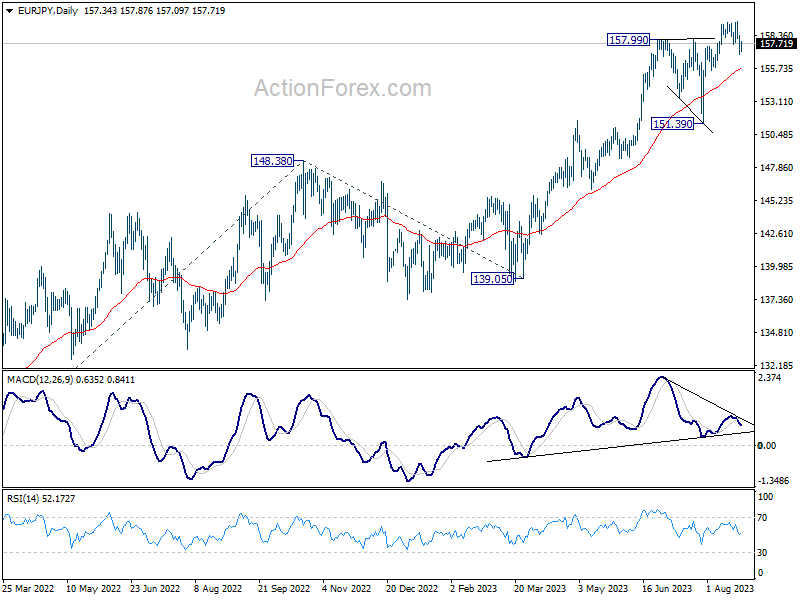
Intraday bias in EUR/JPY stays mildly on the downside for the moment. Fall from 159.47 short term top should target 55 D EMA (now at 155.69) first. For now, risk will stay mildly on the downside as long as 159.47 holds, in case of recovery.
In the bigger picture, rise from 114.42 (2020 low) is in progress. Next target is 100% projection of 124.37 to 148.38 from 139.05 at 163.06. Sustained break there will pave the way to retest long term resistance at 169.96. This will now remain the favored case as long as 151.39 support holds, even in case of deep pull back.
GBP/JPY Daily Outlook
Daily Pivots: (S1) 183.16; (P) 184.55; (R1) 185.74; More...
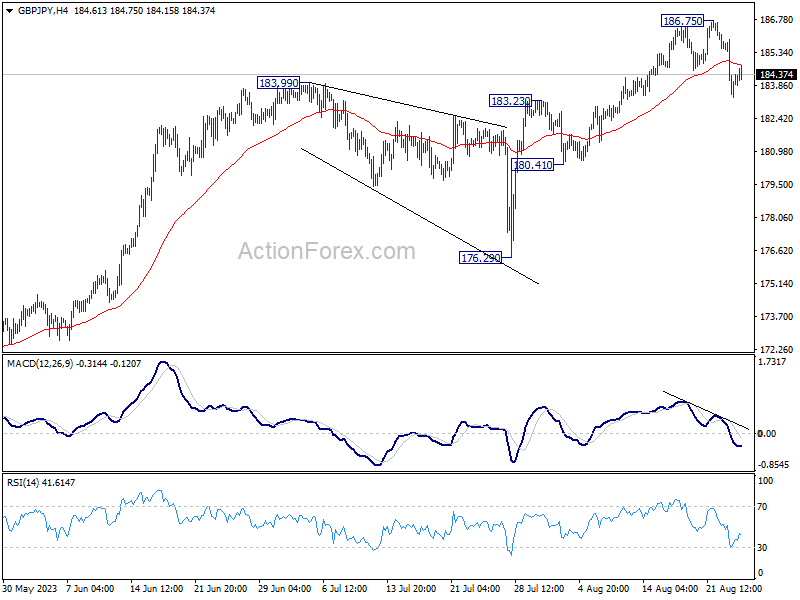
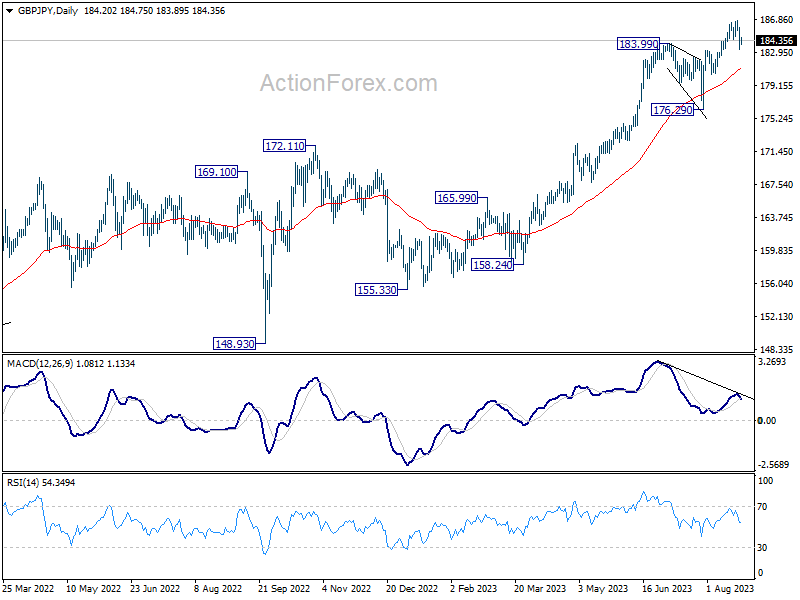
Intraday bias in GBP/JPY stays on the downside at this point. Fall from 186.75 short term top is in progress for 55 D EMA (now at 180.84). For now, risk will remain on the downside as long as 186.75 resistance holds, in case of recovery.
In the bigger picture, up trend from 123.94 (2020 low) is in progress. Next target is 195.86 (2015 high). This will now remain the favored case as long as 176.29 support holds, even in case of deeper pull back.
EUR/CHF Daily Outlook
Daily Pivots: (S1) 0.9517; (P) 0.9536; (R1) 0.9557; More...
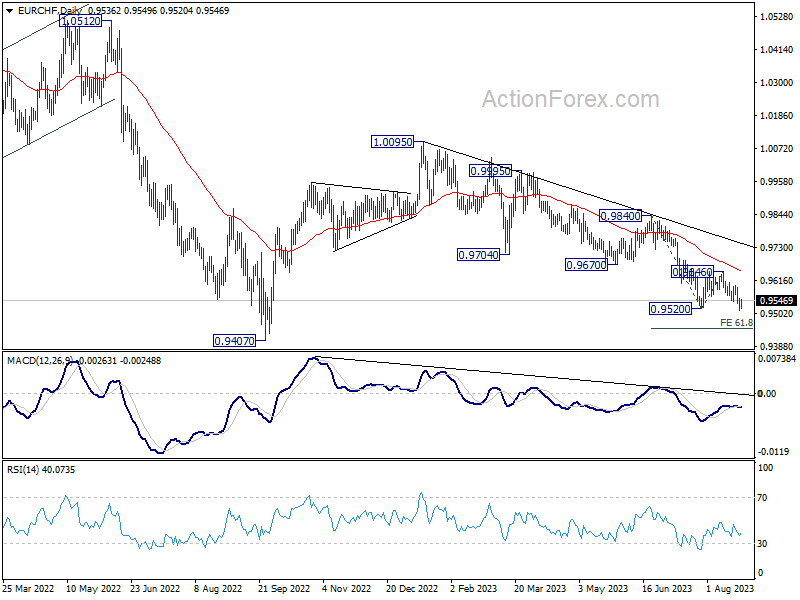
Intraday bias in EUR/CHF remains on the downside for the moment. Current fall from 1.0095 should target 61.8% projection of 0.9840 to 0.9520 from 0.9646 at 0.9448. On the upside, break of 0.9599 resistance is needed to indicate short term bottoming. Otherwise, outlook will stay bearish in case of recovery.
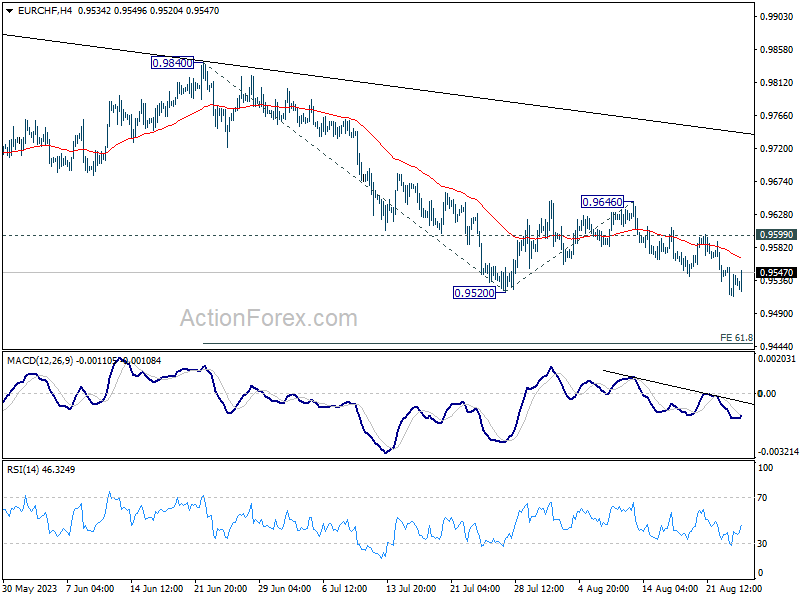
In the bigger picture, medium term outlook is staying bearish as the pair is capped well below falling 55 W EMA (now at 0.9849). Down trend from 1.2004 (2018 high) is in favor to continue. Sustained break of 0.9407 will target 61.8% projection of 1.1149 to 0.9407 from 1.0095 at 0.9018. For now, this will remain the favored case as long as 0.9670 support turned resistance holds, in case of strong rebound.
WTI Oil Futures Extend Slide Below 80
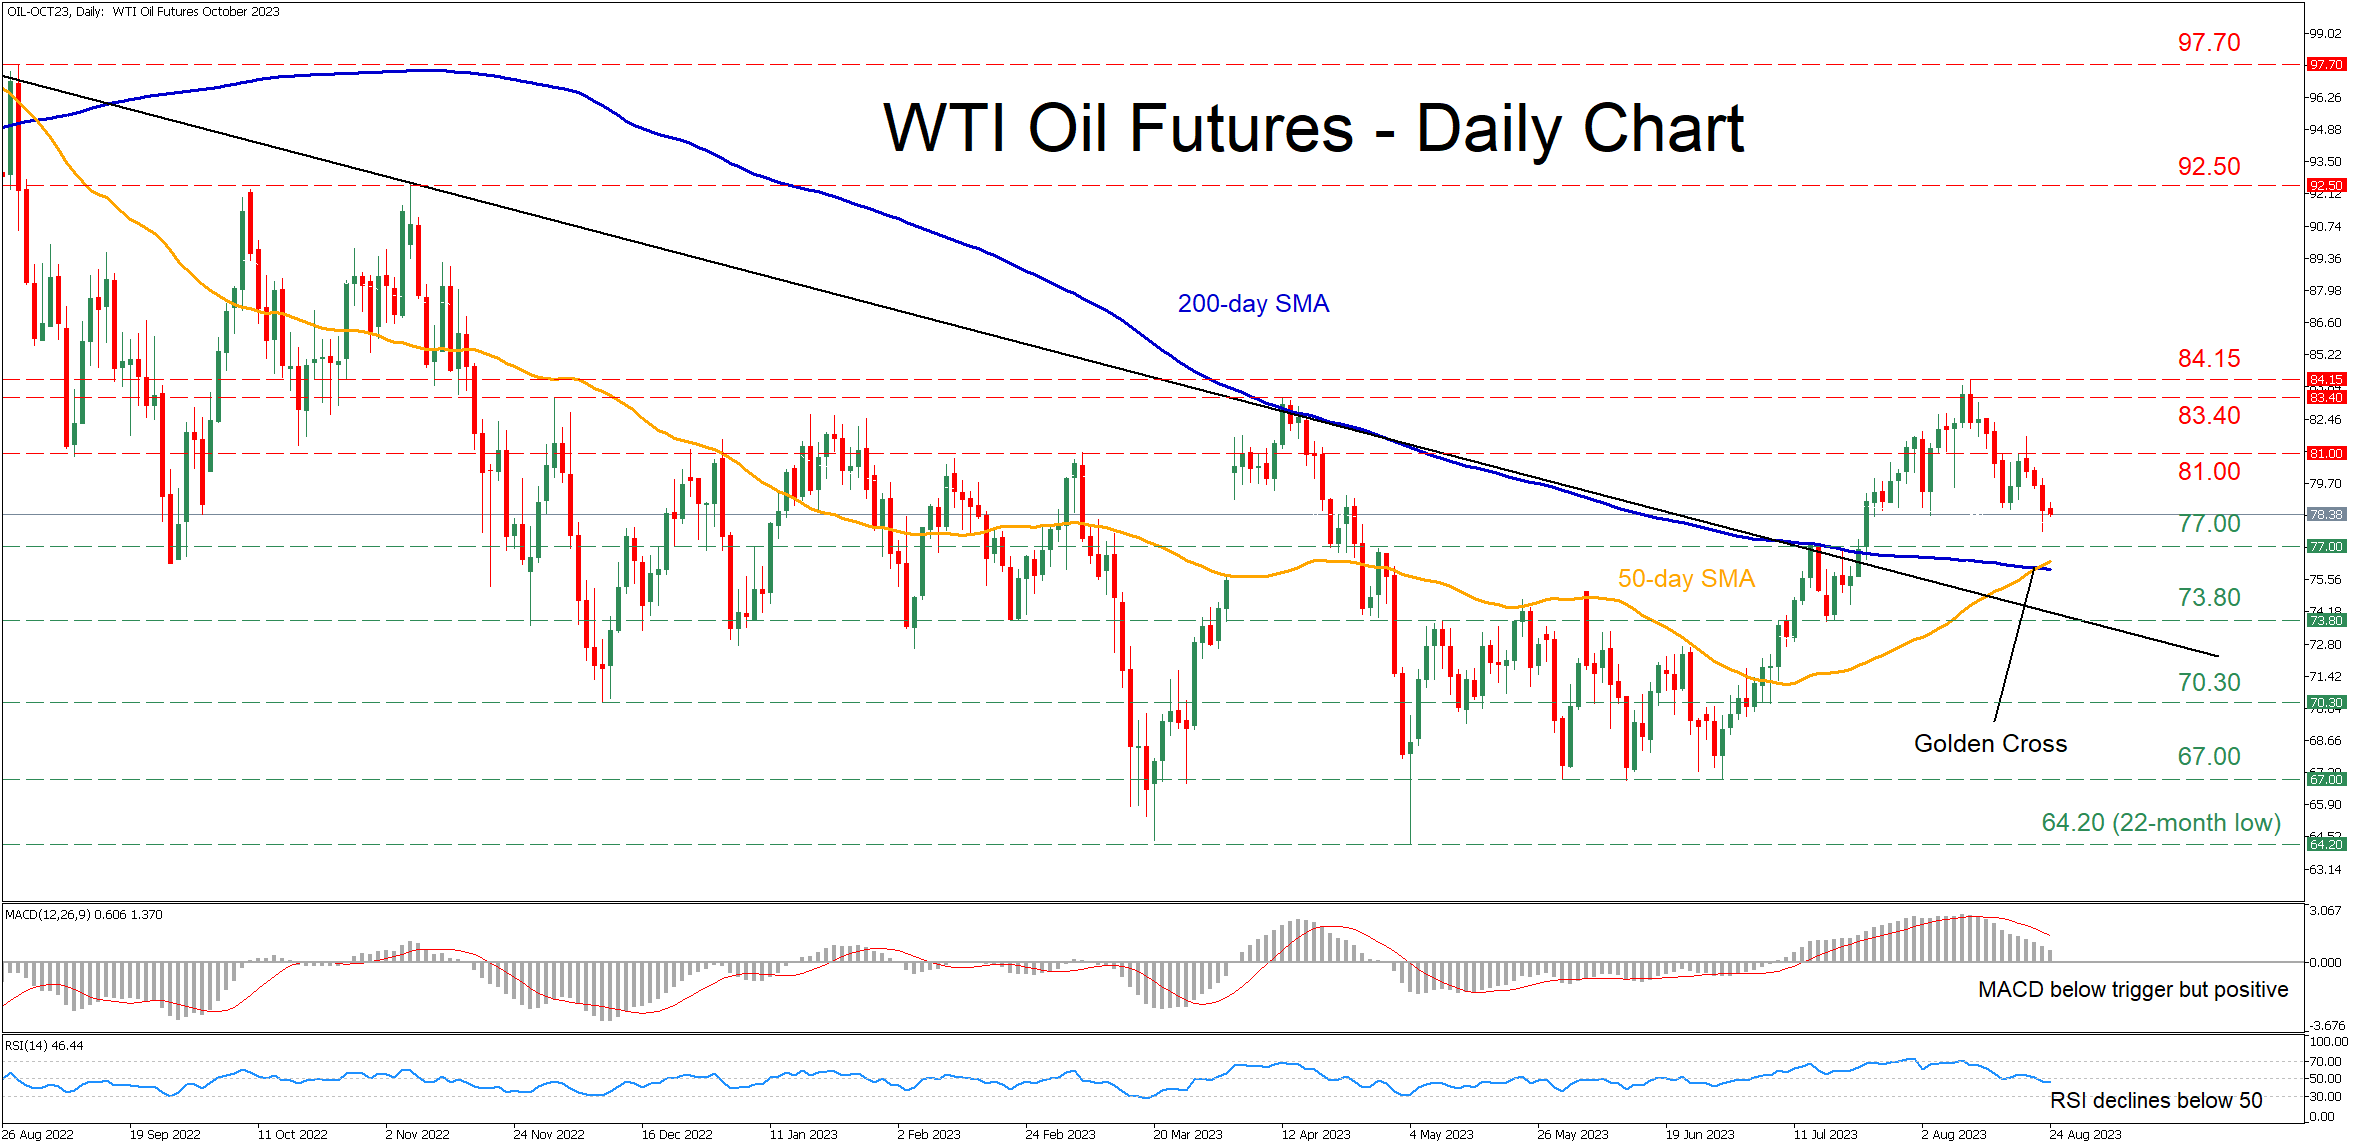
WTI oil futures (October delivery) have been steadily losing ground after peaking at the nine-month high of 84.15 on August 10. Moreover, bearish pressures have not shown any sign of easing despite the completion of a golden cross between the 50- and 200-day simple moving averages (SMAs).
The momentum indicators currently suggest that bearish forces are holding the upper hand. Specifically, the MACD is softening below its red signal line but remains positive, while the RSI crossed below its 50-neutral threshold.
Should the bears attempt to push the price lower, the July resistance of 77.00 could serve as initial support. Sliding beneath that floor, the price might descend towards 73.80 before the December 2022 low of 70.30 appears on the radar. Further declines could then cease at the 67.00 hurdle, which held strong three times during May and June.
On the flipside, bullish actions could propel the price towards the March high of 81.00. Violating that zone, oil could challenge the April peak of 83.40. Even higher, 84.15, which is the highest level observed in 2023, could curb further advances.
In brief, WTI oil futures have been experiencing a correction after their solid summer rally got rejected at a fresh nine-month high. However, for the short-term technical picture to turn negative, the price needs to cross below the downward sloping trendline that connects the price’s lower highs since August 2022.
USD/CAD Daily Outlook
Daily Pivots: (S1) 1.3495; (P) 1.3550; (R1) 1.3579; More....
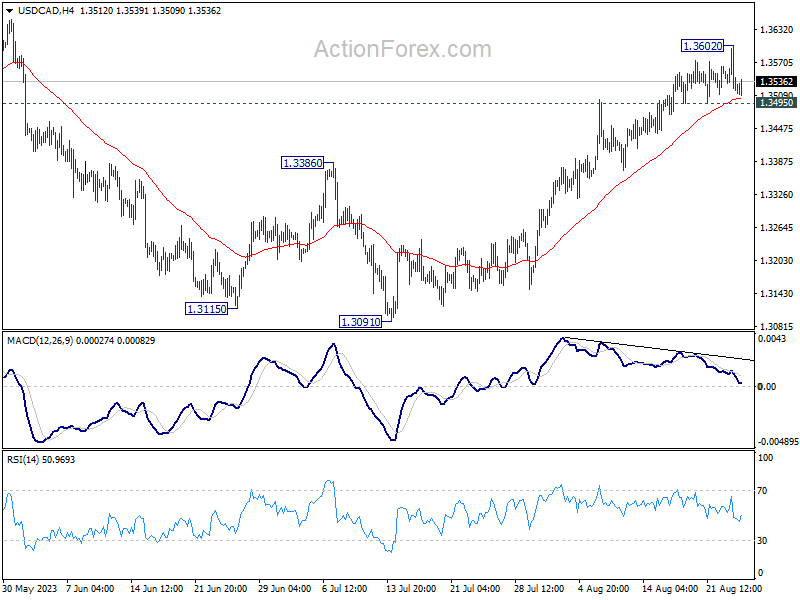
Intraday bias in USD/CAD is turned neutral again as it retreat after rising to 1.3602. Above 1.3602 will resume the whole rally from 1.3091 to 1.3653 resistance first. Decisive break there will confirm that correction from 1.3976 has completed, a target a test on this high. However, break of 1.3495 will indicate short term topping, on bearish divergence condition in 4H MACD, and turn bias to the downside for deeper pull back.
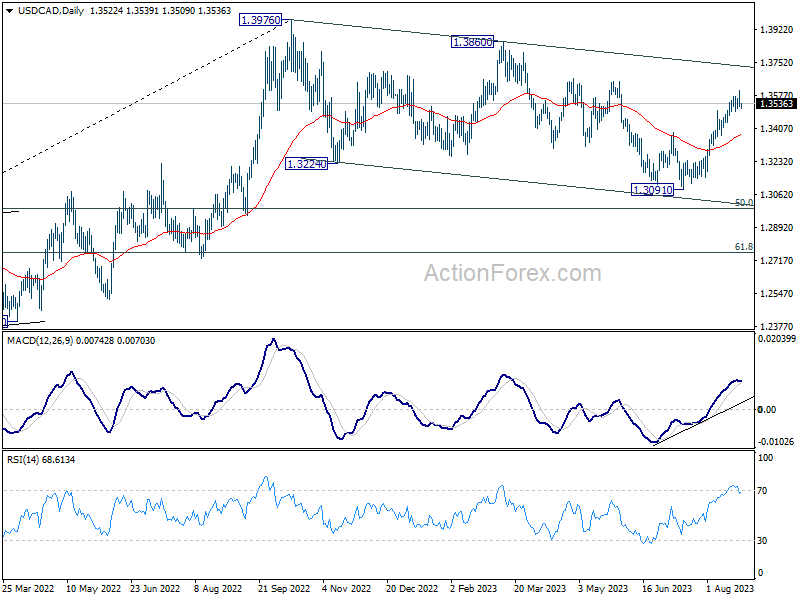
In the bigger picture, price actions from 1.3976 are viewed as a corrective fall only. Upon completion, rise from 1.2005 (2021 low) would resume through 1.3976. Next target is 61.8% projection of 1.2005 to 1.3976 from 1.3091 at 1.4309. In case of another fall, downside should be contained by 61.8% retracement of 1.2005 to 1.3976 at 1.2758.
AUD/USD Daily Report
Daily Pivots: (S1) 0.6434; (P) 0.6458; (R1) 0.6506; More...
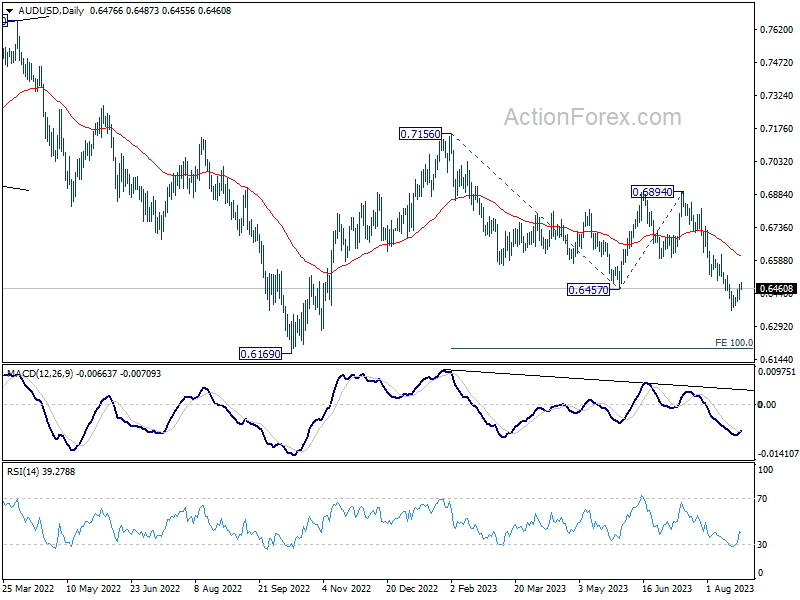
AUD/USD's recovery from 0.6363 continues today and intraday bias remains neutral at this point. While stronger recovery cannot be ruled out, upside should be limited by 0.6615 resistance. Break of 0.6363 will resume larger fall from 0.7156 to 100% projection of 0.7156 to 0.6457 from 0.6894 at 0.6195.
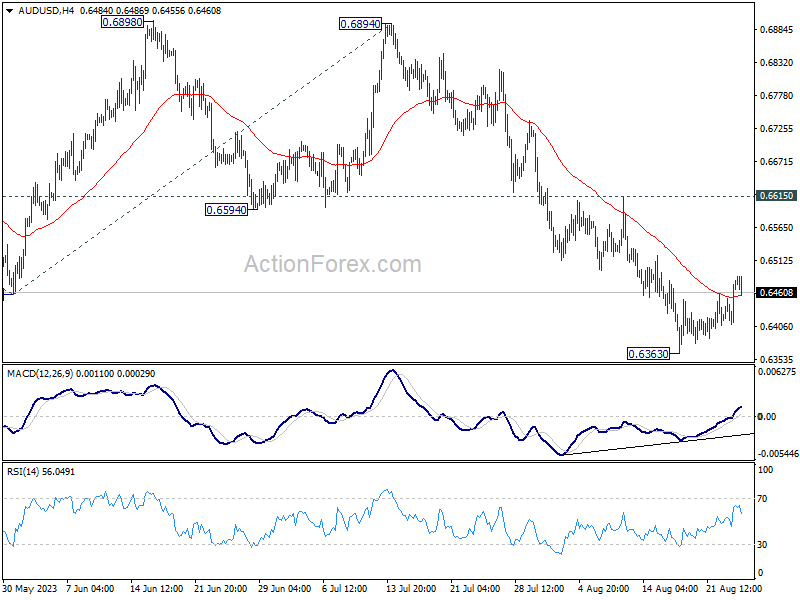
In the bigger picture, current development argues that the down trend from 0.8006 (2021 high) is still in progress. Decisive break of 0.6169 will target 61.8% projection of 0.8006 to 0.6169 to 0.7156 at 0.6021. This will now remain the favored case as long as 0.6894, in case of strong rebound.