
Sample Category Title
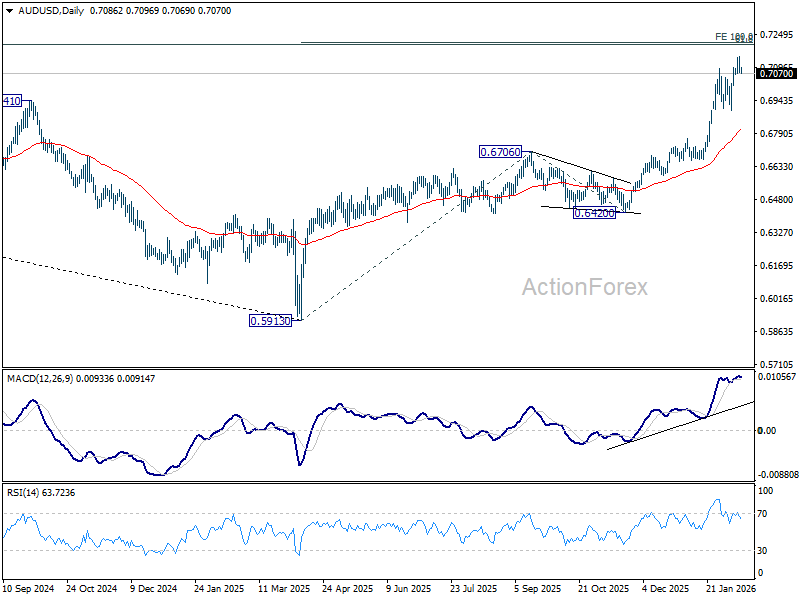
AUD/USD Daily Report
Daily Pivots: (S1) 0.7078; (P) 0.7110; (R1) 0.7159; More...
Intraday bias in AUD/USD is turned neutral first with current retreat, and some consolidations would be seen. But downside should be contained above 0.6896 support to bring another rally. On the upside, above 0.7146 will resume larger up trend to 100% projection of 0.5913 to 0.6706 from 0.6420 at 0.7213. However, considering bearish divergence condition in D MACD, firm break of 0.6896 will argue that deeper correction is underway to 55 D EMA (now at 0.6802).
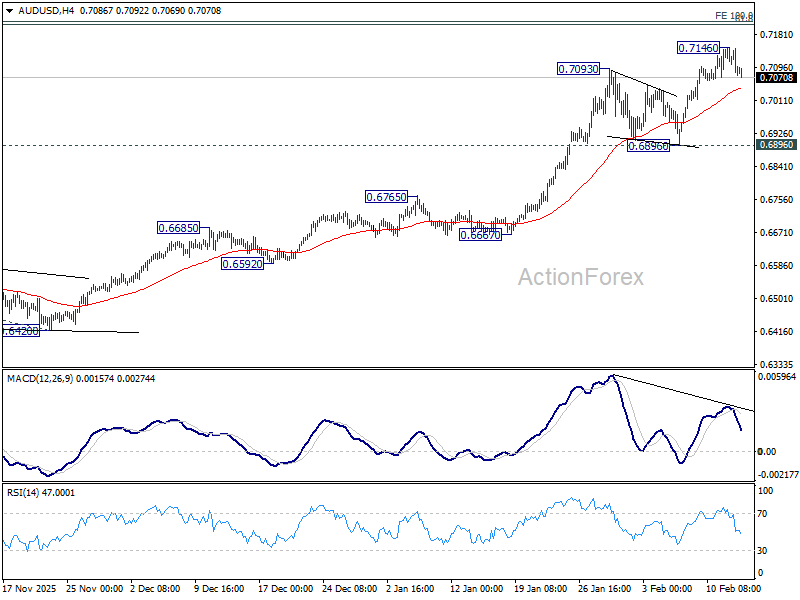
In the bigger picture, current development argues that rise from 0.5913 (2024 low) is reversing whole down trend from 0.8006 (2021 high). Further rally should be seen to 61.8% retracement of 0.8006 to 0.5913 at 0.7206. This will remain the favored case as long as 0.6706 resistance turned support holds, even in case of deep pullback.
Yen Stands Tall as Risk-Off Tone Strengthens With Metal Crash, Tech Rout
Risk aversion reasserted itself across global markets overnight as NASDAQ led US equities sharply lower once again, with AI disruption fears resurfacing as the primary catalyst. Asian markets followed and traded broadly lower. The vulnerability in equities was mirrored in fixed income markets. Safe-haven demand pushed US Treasuries higher, sending the 10-year yield tumbling and extending its recent technical breakdown.
Attention now turns to the January US CPI release. However, expectations for sustained volatility following the data appear limited. Instead, the more important question is whether AI-driven risk-off trades quickly resume once the event risk passes. If sentiment remains fragile, markets could revert to selling rallies in technology and cyclicals rather than focusing solely on inflation dynamics.
Meanwhile, not all traditional safe havens behaved uniformly. Gold and silver experienced what some described as a flash crash, diverging from the broader defensive tone. The trigger appeared to be geopolitical rather than macroeconomic. US President Donald Trump said he insisted that talks with Iran continue during a meeting with Israeli Prime Minister Benjamin Netanyahu, adding that a deal could be reached within a month. The remarks were interpreted as reducing near-term geopolitical risk premiums embedded in precious metals and oil prices.
On trade policy, fresh research from the New York Fed highlighted 90% of tariffs imposed on imported goods are absorbed by American consumers and companies. The study found that Americans absorbed 94% of tariff costs between January and August, easing slightly later in the year but still accounting for the vast majority of the burden. These findings align with analysis from the Congressional Budget Office, which estimates that 70% of import price increases are passed through to consumers, with businesses absorbing 30% via lower margins.
Separately, the US finalized a trade agreement with Taiwan, setting tariffs on Taiwanese exports at 15% and opening Taiwan’s market to US goods. Taipei committed to removing or reducing 99% of tariff barriers and pledged to purchase over USD 84 billion in US goods between 2025 and 2029, including LNG, crude oil and aircraft.
In currency markets, Yen remains the strongest performer of the week, followed by Aussie and Swiss Franc. Sterling is now the weakest, trailed by Dollar and Kiwi, while Euro and Loonie trade in the middle.
In Asia, at the time of writing, Nikkei is down -1.14%. Hong Kong HSI is down -2.10%. China Shanghai SSE is down -0.76%. Singapore Strait Times is down -1.43%. Overnight, DOW fell -1.34%. S&P 500 fell -1.57%. NASDAQ fell -2.03%. 10-year yield fell -0.068 to 4.104.
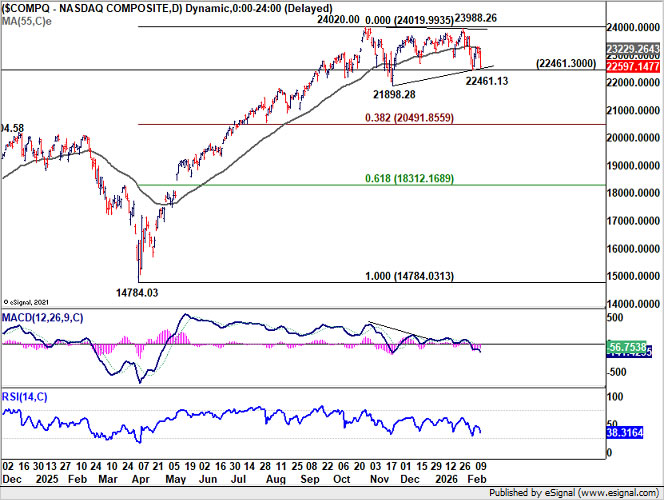
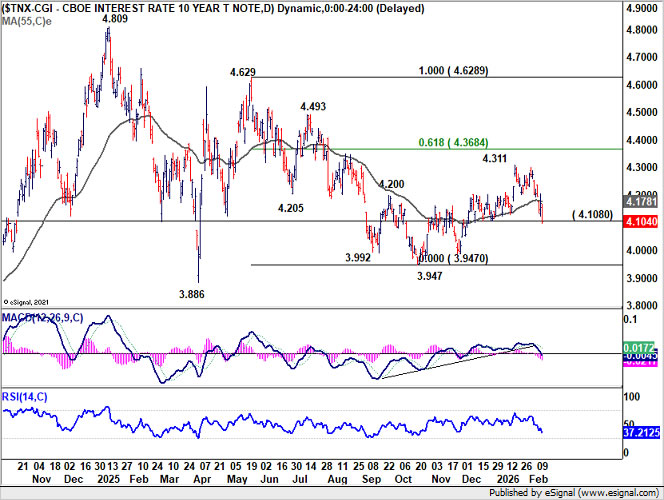
Brutal risk shift ahead of US CPI: Yields sink, NASDAQ fails, USD/JPY under threat
US equities staged a sharp reversal overnight, closing decisively lower with NASDAQ leading losses at -2%. DOW fell -1.3%, slipping back below the 50,000 mark after managing to hold it for four sessions only. Treasury markets reinforced the risk-off signal as 10-year yield took another leg lower and is now on the verge of breaking below 4.1% handle.
January CPI is due, but its influence may be limited. The strong non-farm payrolls report has effectively removed urgency for a March Fed move and supports a pause at least through June. Unless inflation delivers a major shock, markets would revert to broader risk dynamics once the event passes.
The catalyst behind the equity selloff is once again AI disruption anxiety. Software stocks, which have been under persistent pressure this year, extended losses sharply. More concerning is that the negative tone is spreading beyond technology. Financials came under pressure amid fears that AI could disrupt wealth management and advisory services. Industrials and logistics stocks also saw heavy selling on concerns that AI-driven efficiency gains in freight and supply chains could erode traditional revenue models. Even real estate came under scrutiny on speculation that higher unemployment or automation could dampen demand for office space.
Technically, NASDAQ’s rejection at the 55 D EMA (now at 23,229), is a clear near-term bearish signal. Immediate focus now turns to 22,461 support. Firm break there would open the door through 21,898 support towards 38.2% retracement of 14,784.03 to 24,020.00 at 20,419.85.
Meanwhile, 10-year yield’s close below 4.108 solidifies the view that the rebound from 3.947 3.947 has completed as a corrective move to 4.311. As long as 55 D EMA (now at 4.178) caps upside, downside risk dominates. Sustained trading below 4.100 would send yield further to 4.000 psychological level and potentially retest the October low near 3.947.
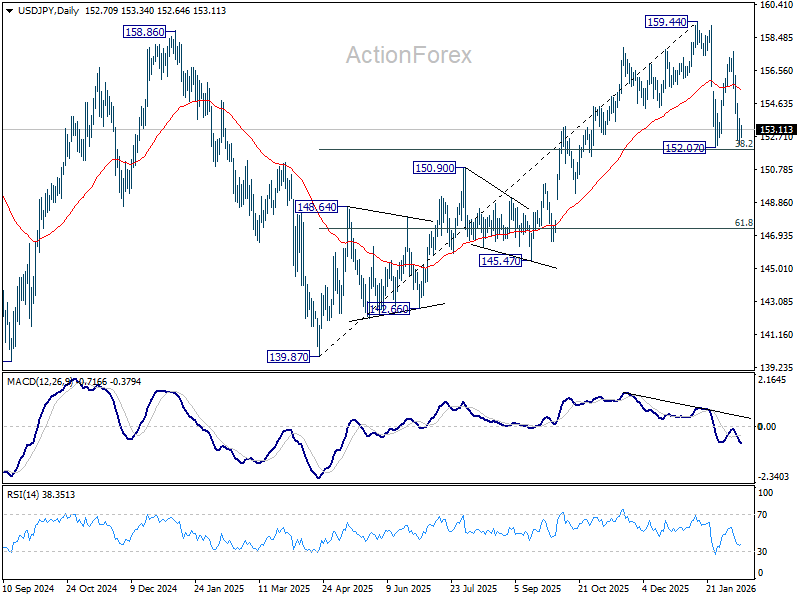
USD/JPY remains marginally above 38.2% retracement of 139.87 to 159.44 at 151.96, leaving the pattern from 159.44 technically seen as a consolidation within the broader uptrend from 139.87. As long as this level holds, the structural bias cannot be deemed decisively bearish.
That said, extended weakness in US equities and further decline in Treasury yields would likely intensify downside pressure on USD/JPY. A clear break below 151.96 would mark a significant technical shift towards bearish trend reversal. Deeper fall would then likely be seen to 61.8% retracement at 147.34, and possibly below.
BoJ’s Tamura says inflation becoming “sticky,” sees scope to tighten
BoJ board member Naoki Tamura said in a speech that the wage–price cycle the Bank has been aiming to establish remains intact, with inflation increasingly driven by domestic factors rather than imported cost shocks. He argued that inflation is “becoming endogenous and sticky,” as higher labor costs replace raw material prices as the primary driver.
Tamura noted, as early as this spring the Bank could judge its price stability target achieved — provided wage growth in 2026 is confirmed to be consistent with the 2% goal for a third consecutive year. Such confirmation would mark a significant milestone in Japan’s long struggle to exit deflation.
He cautioned, however, that price developments warrant close attention as Yen resumes depreciation. Also, as firms continue to lift wages, there is strong potential for higher labor costs to be passed through across production, distribution and retail stages.
Tamura also there remains “considerable distance” to the neutral interest rate level, implying that even further rate hikes would leave financial conditions accommodative. The challenge, he said, is to avoid both a premature tightening that risks deflation and an environment of persistent inflation that exceeds what can be considered moderate — a balancing act that keeps normalization gradual.
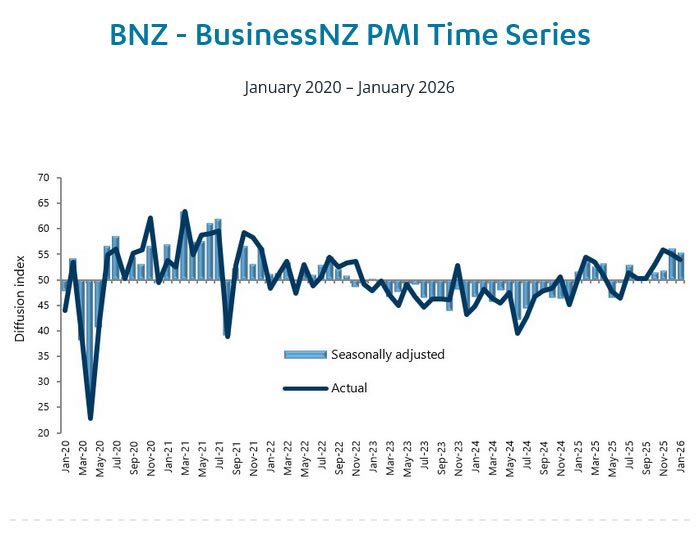
NZ BNZ manufacturing eases to 55.2, but signals continued expansion
New Zealand’s BusinessNZ Performance of Manufacturing Index eased from 56.1 to 55.2 in January, indicating a slight moderation in momentum but remaining firmly in expansion territory. Production slipped from 57.5 to 56.6, employment edged down from 53.7 to 52.9, and new orders cooled from 59.9 to 56.4, pointing to slower yet still solid activity.
Despite the pullback, BNZ described the latest reading as reflecting a “healthy level of expansion.” Senior Economist Doug Steel said the January PMI adds to evidence that the economy has “finally turned the corner,” aligning with forecasts and a broader set of indicators suggesting decent growth.
However, underlying sentiment showed some softening. The proportion of positive comments from respondents fell to 47.7% in January, down from 57.1% in December and 54.4% in November. While the sector remains in growth mode, the decline in optimism hints at a more cautious tone among manufacturers as 2026 begins.
AUD/USD Daily Report
Daily Pivots: (S1) 0.7078; (P) 0.7110; (R1) 0.7159; More...
Intraday bias in AUD/USD is turned neutral first with current retreat, and some consolidations would be seen. But downside should be contained above 0.6896 support to bring another rally. On the upside, above 0.7146 will resume larger up trend to 100% projection of 0.5913 to 0.6706 from 0.6420 at 0.7213. However, considering bearish divergence condition in D MACD, firm break of 0.6896 will argue that deeper correction is underway to 55 D EMA (now at 0.6802).
In the bigger picture, current development argues that rise from 0.5913 (2024 low) is reversing whole down trend from 0.8006 (2021 high). Further rally should be seen to 61.8% retracement of 0.8006 to 0.5913 at 0.7206. This will remain the favored case as long as 0.6706 resistance turned support holds, even in case of deep pullback.
BoJ’s Tamura says inflation becoming “sticky,” sees scope to tighten
BoJ board member Naoki Tamura said in a speech that the wage–price cycle the Bank has been aiming to establish remains intact, with inflation increasingly driven by domestic factors rather than imported cost shocks. He argued that inflation is “becoming endogenous and sticky,” as higher labor costs replace raw material prices as the primary driver.
Tamura noted, as early as this spring the Bank could judge its price stability target achieved — provided wage growth in 2026 is confirmed to be consistent with the 2% goal for a third consecutive year. Such confirmation would mark a significant milestone in Japan’s long struggle to exit deflation.
He cautioned, however, that price developments warrant close attention as Yen resumes depreciation. Also, as firms continue to lift wages, there is strong potential for higher labor costs to be passed through across production, distribution and retail stages.
Tamura also there remains “considerable distance” to the neutral interest rate level, implying that even further rate hikes would leave financial conditions accommodative. The challenge, he said, is to avoid both a premature tightening that risks deflation and an environment of persistent inflation that exceeds what can be considered moderate — a balancing act that keeps normalization gradual.
First Impression: RBNZ Survey of Inflation Expectations, Q1 2026
Expectations for inflation over the coming years have picked up ahead of the RBNZ’s upcoming policy meeting.
RBNZ inflation expectations survey
- 1 year ahead: 2.59% (Prev, 2.39%, +20bps)
- 2 years ahead: 2.37% (Prev: 2.28%, +9bps)
- 5 years ahead: 2.31% (Prev: 2.22%, +9bps)
- 10 years ahead: 2.30% (Prev: 2.18%, +12bps)
Inflation expectations have pushed higher in the RBNZ’s latest survey of professional forecasters and selected businesspeople.
Expectations for inflation one year ahead rose to 2.59%, up from 2.39% at the end of last year. An increase in near-term expectations for inflation wasn’t surprising given that actual inflation has also been hotter than expected – headline inflation rose to 3.1% at the end of last year. While much of that was due to higher prices for volatile items like food and fuel, core inflation is also at firm levels.
Notably, however, it’s not just expectations for inflation over the next few months that have picked up. The closely watched measure of inflation in two years’ time rose to 2.37% (up from 2.28% previously).
Longer term expectations were also up 9 to 12bps.
Expectations for inflation over the coming years are still well contained within the RBNZ target band. However, they’ve been drifting higher over the past year and are noticeably above the 2% target midpoint.
While inflation expectations at these levels aren’t a game changer for the RBNZ, they add to a picture of a less-benign inflation environment than had been anticipated. In addition to hotter inflation and the uplift in inflation expectations, we’re seeing increasing signs that growth in the economy is picking up.
With lingering spare capacity and above average unemployment, the RBNZ won’t be rushing to hike interest rates as soon as next week’s interest rate meeting. However, the direction for rates is ‘up’ from here. We expect the OCR forecasts in next week’s RBNZ Monetary Policy Statement will signal an earlier start to the interest rate hiking cycle than the central bank previously assumed, including the chance of a December hike.
We’re forecasting a 25bp hike in December, with further hikes beyond that time. See our full preview of next week’s RBNZ policy meeting here.
Brutal risk shift ahead of US CPI: Yields sink, NASDAQ fails, USD/JPY under threat
US equities staged a sharp reversal overnight, closing decisively lower with NASDAQ leading losses at -2%. DOW fell -1.3%, slipping back below the 50,000 mark after managing to hold it for four sessions only. Treasury markets reinforced the risk-off signal as 10-year yield took another leg lower and is now on the verge of breaking below 4.1% handle.
January CPI is due, but its influence may be limited. The strong non-farm payrolls report has effectively removed urgency for a March Fed move and supports a pause at least through June. Unless inflation delivers a major shock, markets would revert to broader risk dynamics once the event passes.
The catalyst behind the equity selloff is once again AI disruption anxiety. Software stocks, which have been under persistent pressure this year, extended losses sharply. More concerning is that the negative tone is spreading beyond technology. Financials came under pressure amid fears that AI could disrupt wealth management and advisory services. Industrials and logistics stocks also saw heavy selling on concerns that AI-driven efficiency gains in freight and supply chains could erode traditional revenue models. Even real estate came under scrutiny on speculation that higher unemployment or automation could dampen demand for office space.
Technically, NASDAQ’s rejection at the 55 D EMA (now at 23,229), is a clear near-term bearish signal. Immediate focus now turns to 22,461 support. Firm break there would open the door through 21,898 support towards 38.2% retracement of 14,784.03 to 24,020.00 at 20,419.85.
Meanwhile, 10-year yield’s close below 4.108 solidifies the view that the rebound from 3.947 3.947 has completed as a corrective move to 4.311. As long as 55 D EMA (now at 4.178) caps upside, downside risk dominates. Sustained trading below 4.100 would send yield further to 4.000 psychological level and potentially retest the October low near 3.947.
USD/JPY remains marginally above 38.2% retracement of 139.87 to 159.44 at 151.96, leaving the pattern from 159.44 technically seen as a consolidation within the broader uptrend from 139.87. As long as this level holds, the structural bias cannot be deemed decisively bearish.
That said, extended weakness in US equities and further decline in Treasury yields would likely intensify downside pressure on USD/JPY. A clear break below 151.96 would mark a significant technical shift towards bearish trend reversal. Deeper fall would then likely be seen to 61.8% retracement at 147.34, and possibly below.
USD/JPY Slides Back To Square One After Failed Breakout
Key Highlights
- USD/JPY trimmed all gains and traded below 155.00.
- It traded below a key bullish trend line with support at 155.20 on the 4-hour chart.
- EUR/USD is consolidating above the 1.1840 support.
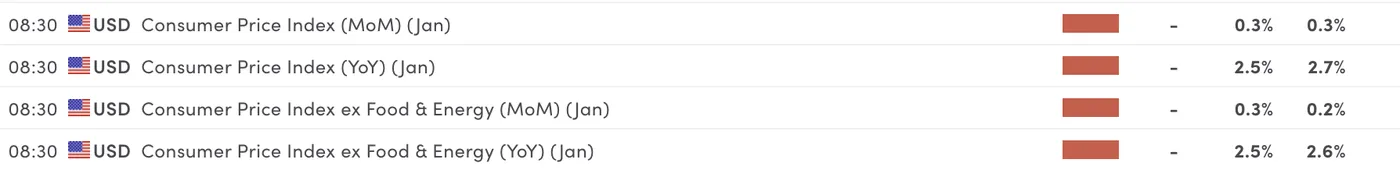
- The US CPI could rise by 2.5% in Jan 2026 (YoY).
USD/JPY Technical Analysis
The US Dollar failed to extend gains above 157.50 against the Japanese Yen. USD/JPY dipped below 155.50 and 155.00 to enter a bearish zone.
Looking at the 4-hour chart, the pair dipped below a key bullish trend line with support at 155.20. The pair even settled below the 100 simple moving average (red, 4-hour) and the 200 simple moving average (green, 4-hour).
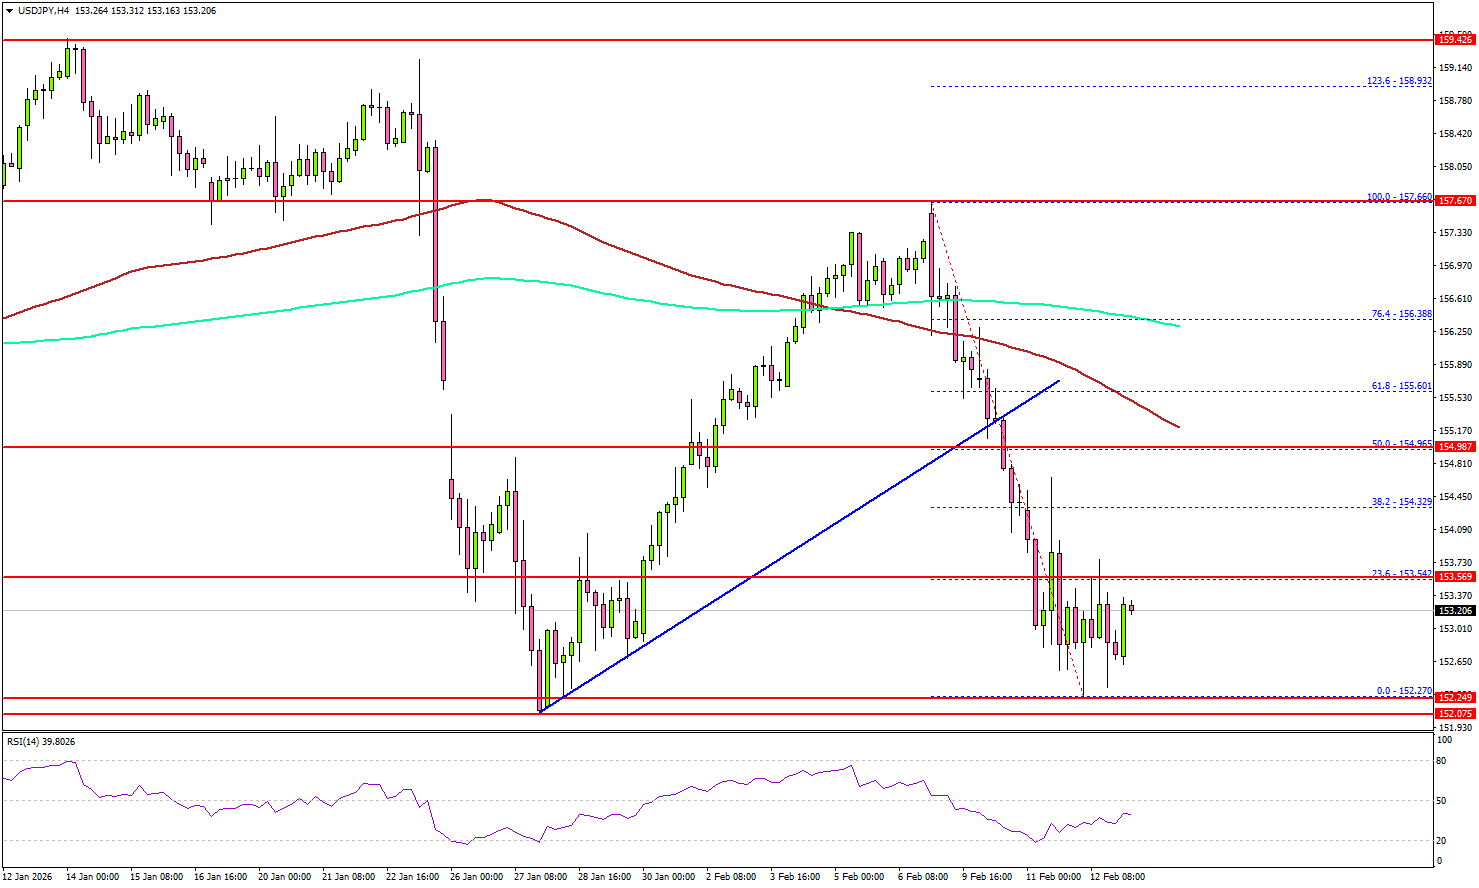
A low was formed at 152.27, and the pair is now consolidating below the 23.6% Fib retracement level of the downward move from the 157.66 swing high to the 152.27 low.
On the upside, the pair could face hurdles near 153.50. The next stop for the bulls might be 154.00. A close above 154.00 could open the doors for more gains. In the stated case, the bulls could aim for a move toward the 50% Fib retracement level of the downward move from the 157.66 swing high to the 152.27 low at 154.95.
Any more gains could set the pace for a fresh move to 156.50. Immediate support could be 152.65. The first major area for the bulls might be near 152.20. The main support sits at 151.50, below which the pair might gain bearish momentum. In the stated case, it could even revisit 150.00.
Looking at EUR/USD, the pair struggled to clear 1.1920 and might again decline if it fails to stay above 1.1800.
Upcoming Key Economic Events:
- US Consumer Price Index for Jan 2026 (MoM) – Forecast +0.3%, versus +0.3% previous.
- US Consumer Price Index for Jan 2026 (YoY) – Forecast +2.5%, versus +2.7% previous.
- US Consumer Price Index Ex Food & Energy for Jan 2026 (YoY) – Forecast +2.5%, versus +2.6% previous.
NZ BNZ manufacturing eases to 55.2, but signals continued expansion
New Zealand’s BusinessNZ Performance of Manufacturing Index eased from 56.1 to 55.2 in January, indicating a slight moderation in momentum but remaining firmly in expansion territory. Production slipped from 57.5 to 56.6, employment edged down from 53.7 to 52.9, and new orders cooled from 59.9 to 56.4, pointing to slower yet still solid activity.
Despite the pullback, BNZ described the latest reading as reflecting a “healthy level of expansion.” Senior Economist Doug Steel said the January PMI adds to evidence that the economy has “finally turned the corner,” aligning with forecasts and a broader set of indicators suggesting decent growth.
However, underlying sentiment showed some softening. The proportion of positive comments from respondents fell to 47.7% in January, down from 57.1% in December and 54.4% in November. While the sector remains in growth mode, the decline in optimism hints at a more cautious tone among manufacturers as 2026 begins.
Cliff Notes: Divergent Conditions
Key insights from the week that was.
The Westpac-MI Consumer Sentiment Survey provided yet another gloomy read in February, the headline index slipping a further 2.6% into pessimistic territory to 90.5. Much of the fall appears to have been driven by a re-assessment of current family finances and spending attitudes following recent upside inflation surprises. The ‘family finances vs a year ago’ and ‘time to buy a major item’ sub-indexes fell 4.7% and 5.6% respectively to be well below long-run average levels.
While sentiment amongst those surveyed after the RBA’s decision to raise the cash rate by 25bps was 2.6% lower than the responses received prior, the hit to confidence was much smaller than the average -3.8% response recorded in rate hike months through history. Consumer rate expectations are currently quite hawkish, with over 80% of consumers anticipating mortgage rates to rise this year, nearly half of which expect an increase of at least 100bps. This is contributing to more cautious homebuyer sentiment, pointing to downside risks in dwelling finance, notwithstanding the boost associated with the expanded First Homebuyer Guarantee scheme.
Against this backdrop, the downside surprise in December’s household spending figures (–0.4%mth) was, at face value, a concern. However, being a data series with limited history, shifting seasonal patterns such as the ‘pull-forward’ effect of sales events like Black Friday can drive significant volatility month-to-month. While weaker confidence could make for a somewhat shakier start to 2026, consumption still looks set to deliver robust growth this year. For our in-depth take on the consumer, see our latest Red Book.
In the US, January nonfarm payrolls surprised materially to the upside, rising 130k, or 113k net of revisions to November and December. Having edged lower over the 6 months to October, averaging -13k per month, payrolls have since risen 73k per month. The household survey was also constructive in January, the unemployment rate edging lower from 4.4% to 4.3% as the participation rate gained 0.1ppt to 62.5%. Average hourly earnings also maintained a robust growth pace, up 0.4% in the month and 3.7% over the year.
Retail sales, however, surprised to the downside in December. Headline sales were flat and the control group, which strips out volatile items and feeds through to GDP, fell 0.1%. Following the longest ever Federal Government shutdown and with inflation continuing to show persistence, as tariffs feed through to consumer prices and capacity constraints are felt, consumer caution through year end is unsurprising.
In Japan meanwhile, Prime Minister Sanae Takaichi and the LDP achieved a landslide win in the lower house election, the LDP winning a super majority in their own right by winning two-thirds of the seats. The result will bolster the LDP’s ability to undertake reform, starting with a JPY17.1tril fiscal package that focuses on increased defence spending and public investment and also intends to implement a temporary consumption tax holiday for food items. The intent behind these measures is to improve economic capacity and encourage greater discretionary spending by households.
Closer to home, our New Zealand colleagues updated their views on the path forward for New Zealand’s economy and monetary policy. Unemployment remains elevated, but accommodative monetary policy has sparked above-trend growth. This momentum is expected to continue through 2026 and 2027. So, with inflation risks still evident, the RBNZ is now expected to quickly return policy to a neutral stance from December 2026 through 2027, and then to a moderately restrictive level of 4.25% by March 2028. Westpac NZ economics’ detailed views can be accessed here. Westpac Economics’ broader take on the world and latest views on Australia will also be released today on Westpac IQ.
Get Ready for CPI – US Inflation Preview
The trading world awaits the final piece to this week's US economic puzzle, with the US Consumer Price Index (CPI) releasing tomorrow at 8:30 A.M. (ET).
After a cold Retail Sales (0% vs 0.4% exp) and a surprisingly strong Non-Farm Payrolls report (130K vs 70K exp), the third wave of high-tier US data should provide the answers for early 2026 rate cut pricing (and if they are even still a thing).
The Federal Reserve had pivoted within its dual mandate, putting less emphasis on the inflation mandate and prioritizing a visibly weakening labor market, to justify the streak of 25 bps cuts between September and December 2025, from 4.50% to the current 3.75%.
Ahead of these cuts, the Fed held a frustrating pause (at least frustrating for President Trump) since December 2024.
After the massive -140K drop in October, Non-Farm Payrolls rebounded through a gradual recovery and haven't reported a figure below +40K since. Hence, communications from the Fed quickly turned back to inflation.
Core CPI, which excludes volatile Energy and Food prices from the headline Index, remained much closer to 3% than the 2% mandate throughout 2025, with the effects of the infamous Trump Tariffs delaying post-COVID inflation drops further (compared to what was seen in Canada, for example). And that hasn't sat well with the Fed.
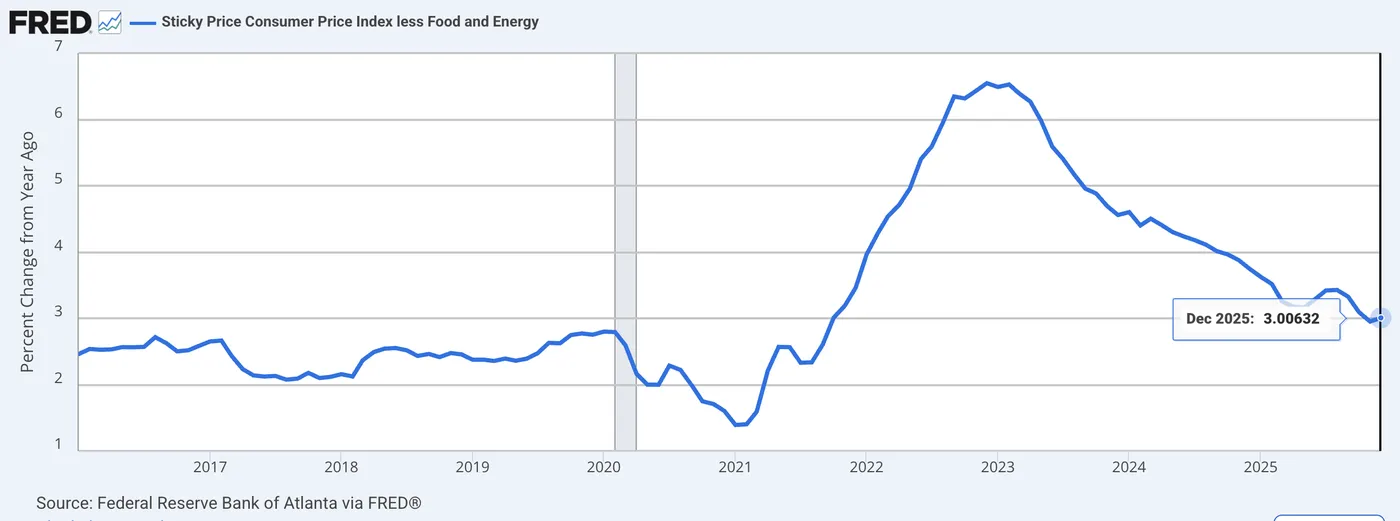
US Core Inflation (Sticky Price Index) since 2016 – Source: FRED
Expectations for tomorrow's report
US Inflation Data expectations – MarketPulse Economic Calendar
Tomorrow's report should bring further clarity to the US CPI releases, which had previously been obscured by the longest-ever Government shutdown in October, which prevented precise data collection.
Both the Headline and Core CPI are expected to release at +0.3% m/m, taking the year-over-year data to 2.5% for both.
Comforting for the Fed? Maybe, but this release should also be affected by last year's high-base effect (January 2025 Core CPI was at 3.1%!), and hence provide more sensitivity to any beat.
Producer Prices tend to be reflected in CPI between 3 and 6 months after their rise, but the more lasting effects may even take more than a year.
For those who forgot, PPI sent out a major warning about tariffs in July 2025: We are entering the final periods to observe significant effects from the Trump Policies, and the Fed will be watching closely.
It has a few of the most hawkish regional members on the voting chairs in 2026 (Hammack and Logan), so thresholds for cuts will be high.
Markets are at a sensitive inflexion point, with Equities still at or very close to their all-time highs (despite huge routs in the Tech and Software Sectors) and extreme trends looking fragile, as seen this morning with the large drops in Gold and Silver.
If things turn sour, Stocks and Metal Markets could quickly see a Crypto-like bear market for the foreseeable future, as Participants will be forced to deleverage.
Let's discover reactions to see why.
Reactions Scenarios
The following FOMC Rate Decision will be announced on March 18 and is currently priced at only 8% (from 23% pre-NFP), leaving little room for a correction at this meeting.
However, there are still about two cuts fully priced in for the rest of the year.
Markets are impossible to predict fully; hence, these scenarios could elicit quite different reactions.
As-expected
This would kick the can down the road for policy pricing, being the final influent data release before February 27 (PPI).
Stock Indexes:
An as-expected data will send Stock Markets to a quick test of their recent all-time highs, but the effect should slow down throughout the session. After the data, expect Indexes to keep consolidating at their highs (48,000 to 50,000 for the DJIA) in the waiting for more clarity.
Metals:
After today's large drop, metals should continue seeing progressive outflows – Silver back to $70 and Gold hanging around $4,200 to $4,400
Cryptos:
Cryptos should rally initially but the rise shouldn't be long-lasted. It could at least prevent a consistent drop lower, back to a more rangebound action in Bitcoin (between $70,000 to $80,000).
US Dollar:
Initial push lower but should stabilize above 2026 lows before reverting higher and maintain its rangebound trajectory.
Rate Cut pricings:
The March meeting should see its pricing rise back towards 20%. Further changes will be contingent for a larger rise depending on the state of Markets until future data lands (if Stocks dip strongly, expect rate cut odds to rise)
Inflation beats
This is the worst case scenario for all assets which have rallied throughout the 2025 Debasement Trade.
Stocks, Metals and Cryptos should all drop lower, with short-end yields rising strongly in a bear flattening curve, profiting to the US Dollar (rallying back to at least 98.00).
The extent of the moves will depend on how strong the beat is. +0.1% to expectations should see modest moves, but anything above 0.3% will see large repricings.
Expect to only see one more cut priced in for 2026 in that scenario.
Inflation misses
This is what Markets are salivating for the most.
Stock Indexes should all rally to some new all-time highs, with the Dow Jones potentially testing 51,000.
Nasdaq should also retest its 26,200 and even extend further.
The US Dollar will see a shift drop to some new 2026 lows as pricing for a March meeting cut can rise to above 50%.
Cryptos and Metals should also see a decent rebound in that event, profiting from the drop in the US Dollar.
Both asset classes would however need a significant drop in CPI to head back to their all-time highs, with both of their Markets troubled by pessimistic sentiment and positioning.
After swift rises, the action should settle, with leverage and positioning still elevated. Nevertheless, expect the recent descending trends to cease and sentiment ease.
The extent of such reactions of course depends on how large the miss is.
Metals Market – Gold (XAU/USD) and Silver (XAG/USD) Flash Crash
Metals just saw immense outflows with Gold dipping to $4,900 and Silver coming back to $76, respectively down 2.75% and 10% on the session!
In Markets, a "fat finger" happens when gigantic liquidation or buy orders happen without any news to back-up the newfound volatility. But as I am about to publish this piece, some news just released.
Update: The broad selloff seems to be from Israel's PM Netanyahu confirming that the US President Trump would prefer seeking a deal with Iran, taking out some elevated risk-premiums in the commodities.
It was surprising to see metals hold yesterday's hawkish Non-farm payrolls so well, with the large pricing out of Fed Cuts through 2026 after the data.
Oil is also dumping back to below $63, down 3.50% on the session.
Mid-Session Metals Market picture – Looking ugly
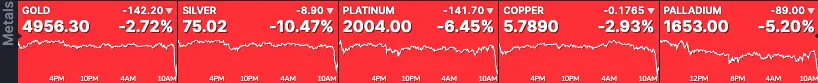
Metals Market daily performance (12:00) – Courtesy of Finviz
Gold stumbles by 3.60%
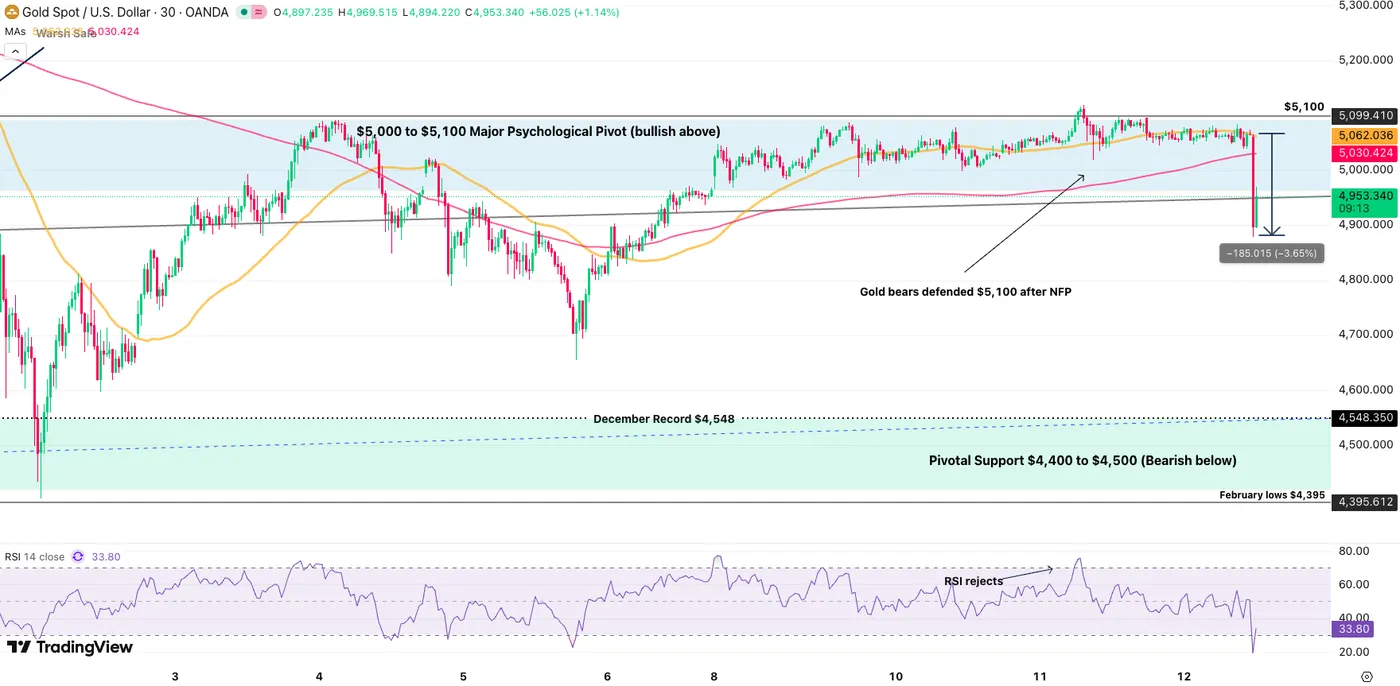
XAU/USD 30M Chart – Source: TradingView, February 12, 2026
Gold saw a huge liquidation candle in the last 30 minutes, with dip-buyers attempting to bring the metal back above $5,000 which will now stand as key technical indicator for appetite.
Silver dips below $76
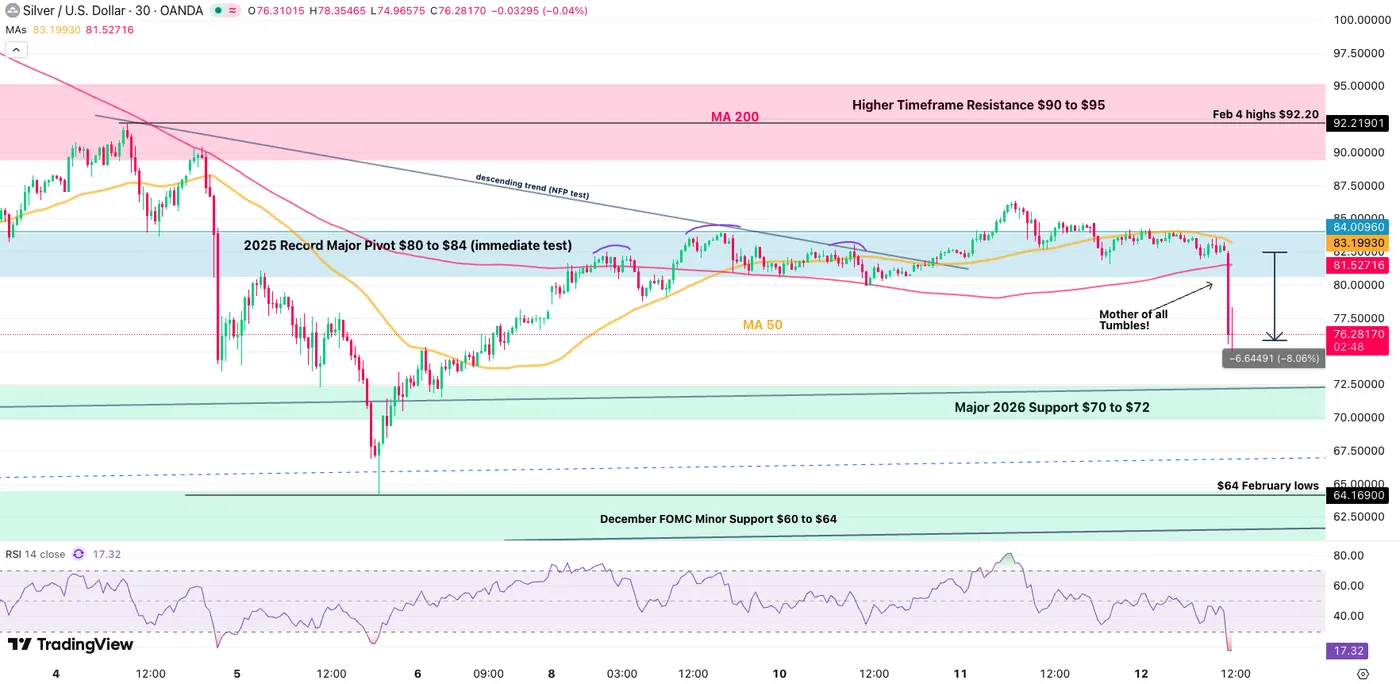
XAG/USD 30M Chart – Source: TradingView, February 12, 2026
Silver isn't looking much better, failing to breach its $84 Pivotal resistance.
Any session close below $76 can trigger further downside movement. Unlike Gold, Silver is struggling to rebound after the flash sale.
Keep a close eye on such flows ahead of tomorrow's CPI report which could accelerate such outflows on a data beat! Preparation for the Inflation data coming up this afternoon.
Safe Trades!