Sample Category Title
EUR/GBP Daily Outlook
Daily Pivots: (S1) 0.8797; (P) 0.8825; (R1) 0.8879; More...
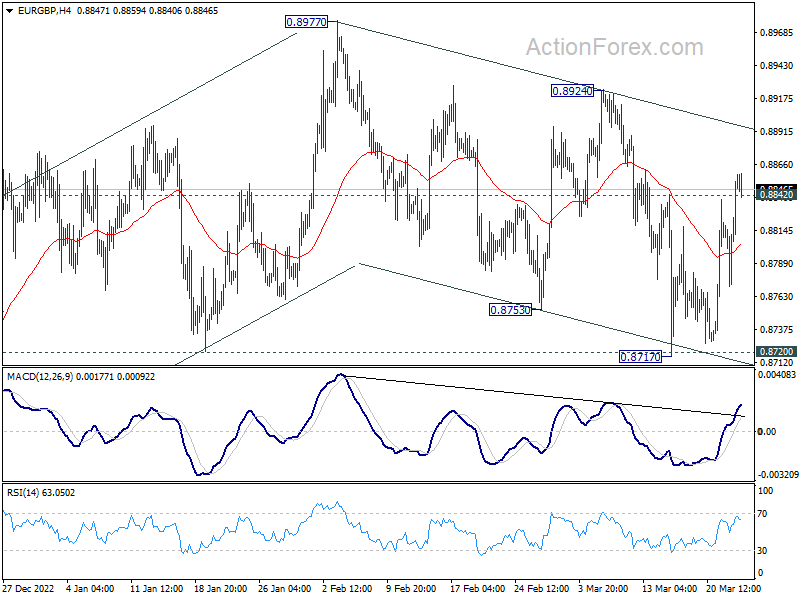
The break of 0.8852 minor resistance argues that EUR/GBP's corrective fall from 0.8977 has completed, after touching 0.8720 support. Intraday bias is back on the upside for 0.8924 resistance first. Firm break there should resume larger rise from 0.8545 through 0.8977 high. This will continue to be the favored case as long as 0.8270 support holds.
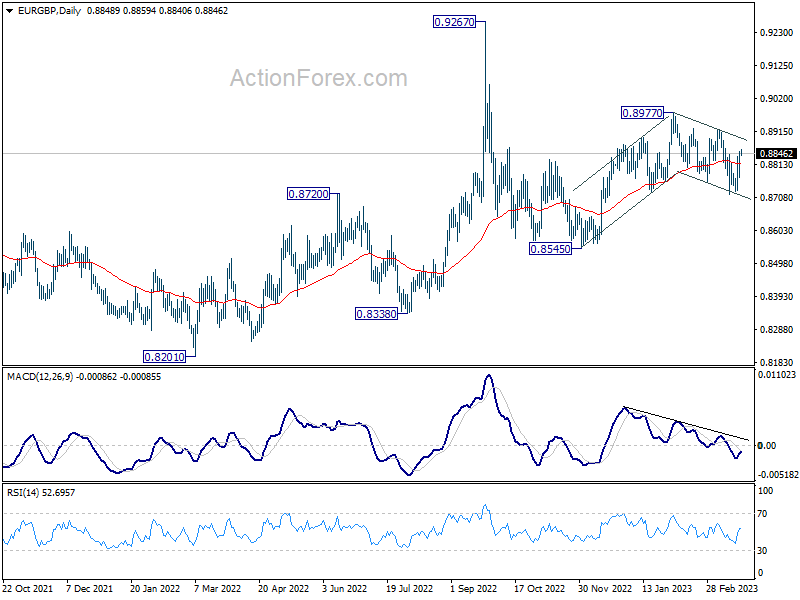
In the bigger picture, outlook is rather mixed for now, except that price actions from 0.9267 (2022 high) are part of the long term range pattern from 0.9499 (2020 high). With 0.8720 support intact, rise from 0.8545 is in favor to continue through 0.8977. However, firm break of 0.8720 will argue that such rebound has completed, and open up deeper fall through this support level.
EUR/AUD Daily Outlook
Daily Pivots: (S1) 1.6115; (P) 1.6185; (R1) 1.6314; More...
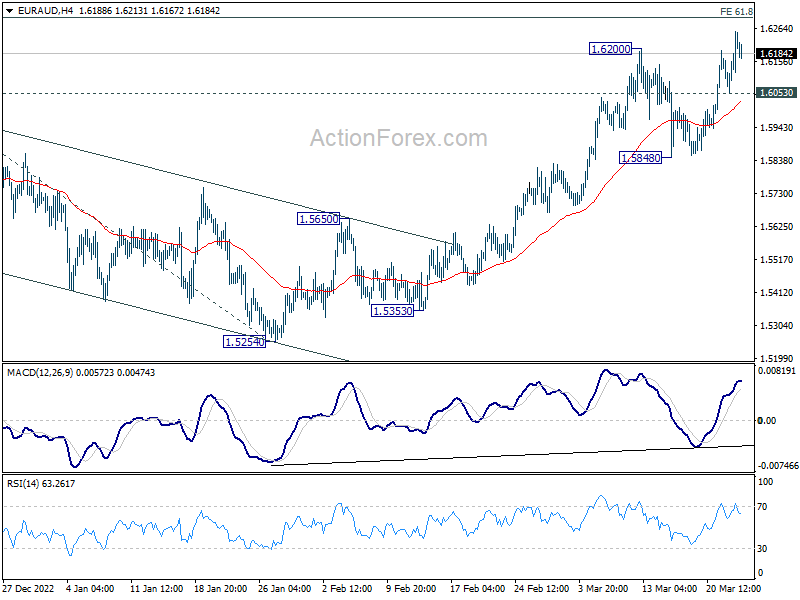
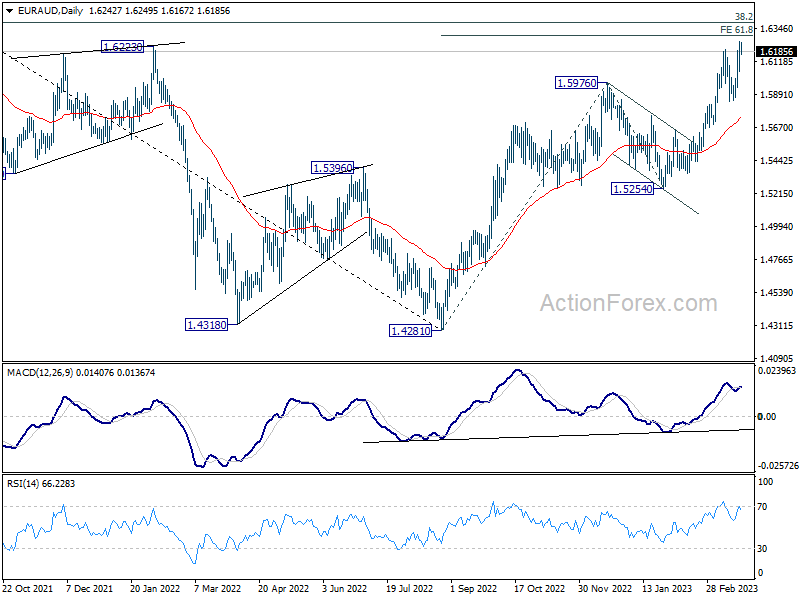
EUR/AUD's break of 1.6200 resistance confirms resumption of larger rise from 1.4281. Intraday bias is back on the upside for 61.8% projection of 1.4281 to 1.5976 from 1.5254 at 1.6302 and then 1.6389 fibonacci level. On the downside, below 1.6053 minor support will turn intraday bias neutral first. But outlook will continue to stay bullish as long as 1.5848 support holds.
In the bigger picture, the strong support from 55 week EMA (now at 1.5404) is raising the chance of bullish trend reversal. Focus is now on 1.6434 cluster resistance (38.2% retracement of 1.9799 to 1.4281 at 1.6389). Sustained break there should confirm that whole down trend from 1.9799 (2020 high) has completed. Further rally should then be seen to 61.8% retracement at 1.7691. However, rejection by this cluster resistance will make medium term outlook neutral at best.
EUR/CHF Daily Outlook
Daily Pivots: (S1) 0.9930; (P) 0.9956; (R1) 0.9986; More...
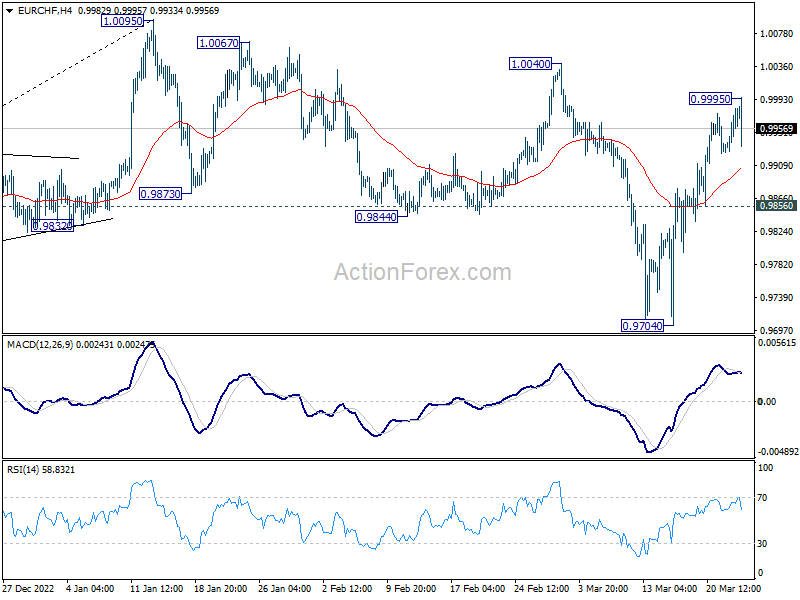
EUR/CHF edged higher to 0.9995 earlier today but quickly retreated. Intraday bias remains neutral first. Outlook is unchanged that corrective decline from 1.0095 should have completed at 0.9704. Further rally is in favor as long as 0.9856 minor support holds. Above 0.9995 will target 1.0040 and then 1.0095. However, firm break of 0.9856 will dampen this bullish view and turn bias back to the downside for 0.9704 support instead.
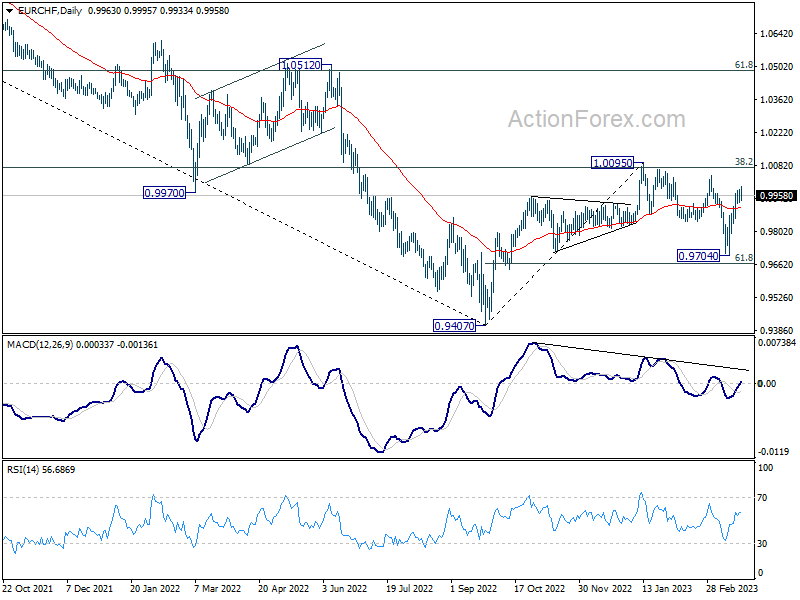
In the bigger picture, prior rejection by 55 week EMA (now at 1.0011) and 38.2% retracement of 1.1149 to 0.9407 at 1.0072 suggests that medium term outlook is staying bearish. That is, down trend from 1.2004 is not completed yet and is in favor to resume through 0.9407 at a later stage. However, decisive break of 1.0095 resistance will raise the chance of bullish trend reversal. Rise from 0.9407 should then target 1.0505 cluster resistance (2020 low at 1.0505, 61.8% retracement of 1.1149 to 0.9407 at 1.1484).
SNB hikes 50bps, signals more tightening possible
SNB raises its policy rate by 50bps to 1.50% as widely expected. The central bank indicated the openness to further tightening while inflation forecasts are raised due to stronger second-round effects and increased overseas inflationary pressure.
The central bank said the rate hike is for "countering the renewed increase in inflationary pressure". It also noted in the statement, "it cannot be ruled out that additional rises in the SNB policy rate will be necessary to ensure price stability over the medium term." It also remains "willing to be active in the foreign exchange market" with focus on "selling foreign currency" for some quarters.
The bank's conditional inflation forecast assumes an interest rate of 1.5% over the horizon. Average inflation estimates for 2023 and 2024 were raised from 2.4% to 2.6% and from 1.8% to 2.0%, respectively. Inflation is projected to average 2.0% in 2025, a new forecast.
SNB statement highlighted that "stronger second-round effects and the fact that inflationary pressure from abroad has increased again mean that, despite the raising of the SNB policy rate, the new forecast is higher through to mid-2025 than in December."
The central bank anticipates a modest GDP growth of around 1% for the year, citing subdued foreign demand and the dampening effect of inflation on purchasing power.

AUDUSD Tests 200-day SMA After Rebound Off 0.6560
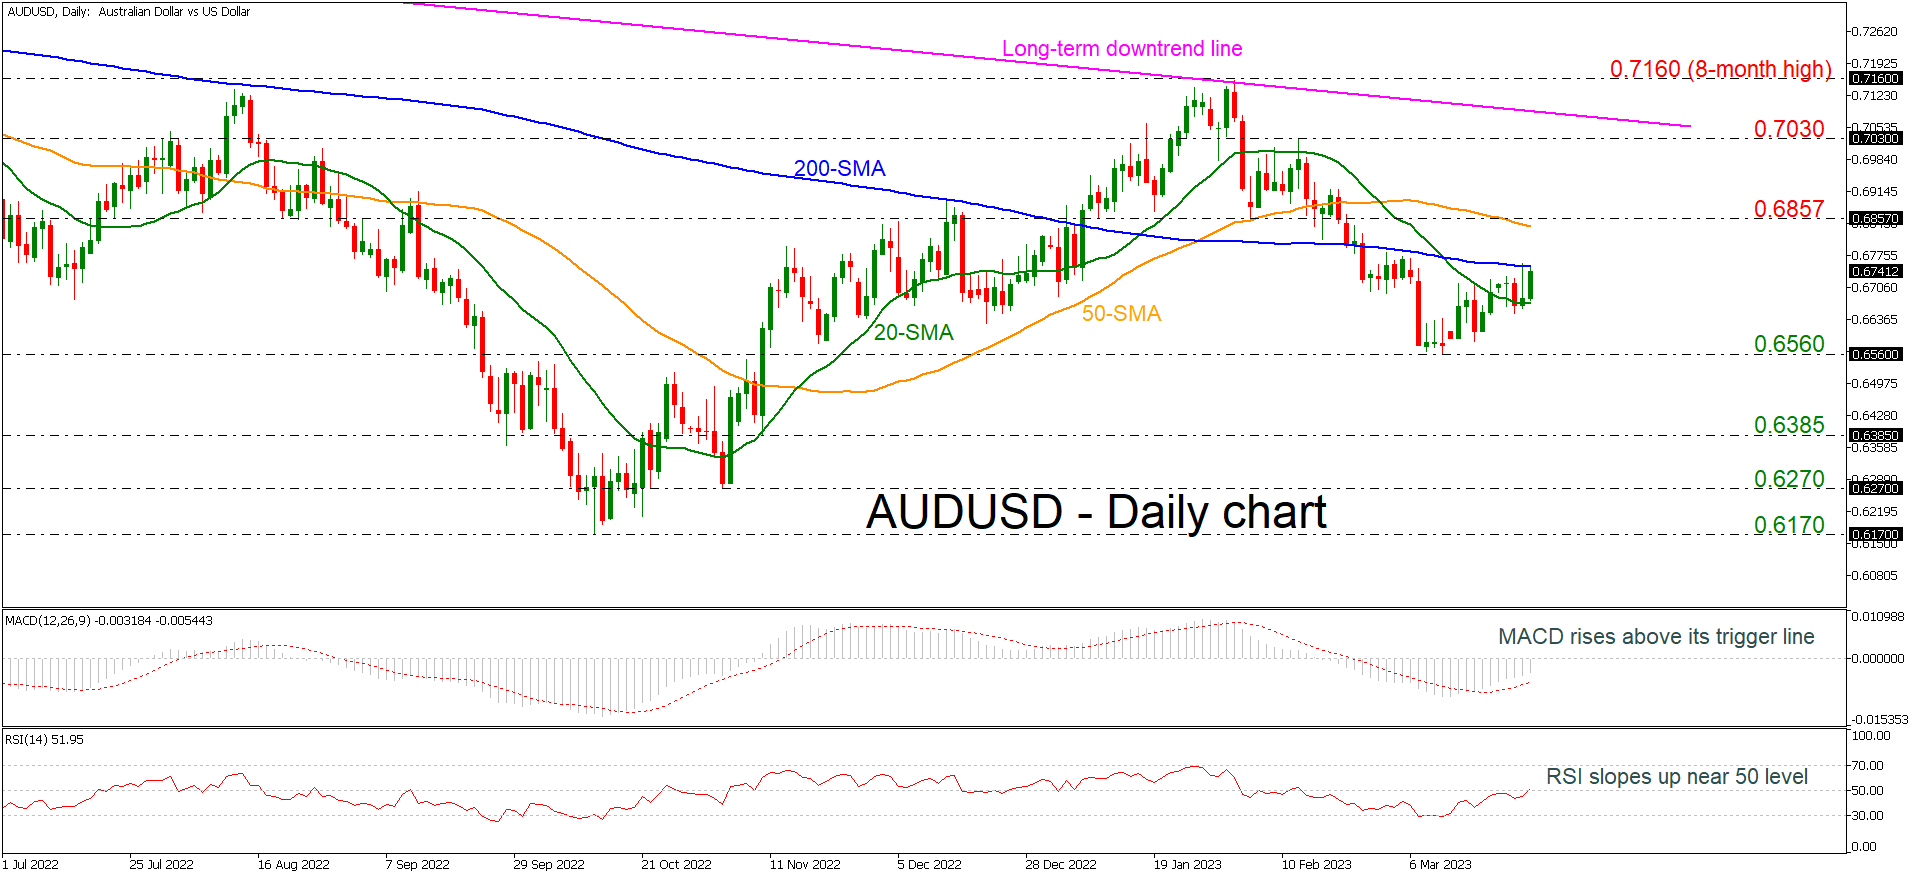
AUDUSD rebounded off the 0.6560 support level and is heading towards the 200-day simple moving average (SMA), which stands near 0.6755. The bulls may be optimistic for more upside movements as the MACD is heading north above its trigger line in the negative region and the RSI is crossing the 50 level to the upside.
In the positive scenario, in case of a successful climb above the 200-day SMA, then the market may challenge the 50-day SMA around the 0.6857 resistance. More gains could lead the market towards the 0.7030 resistance ahead of the long-term descending trend line around 0.7070.
On the other hand, a dive below the 20-day SMA could endorse the bearish structure that started from the pullback off the eight-month peak at 0.7160 and hit the 0.6560 barrier. Steeper declines could open the way until the 0.6385 support.
In brief, despite its resilience above 0.6560, AUDUSD has yet to show any clear bullish signals, remaining exposed to downside corrections in the medium-term outlook.
USD/CAD Daily Outlook
Daily Pivots: (S1) 1.3677; (P) 1.3711; (R1) 1.3765; More....
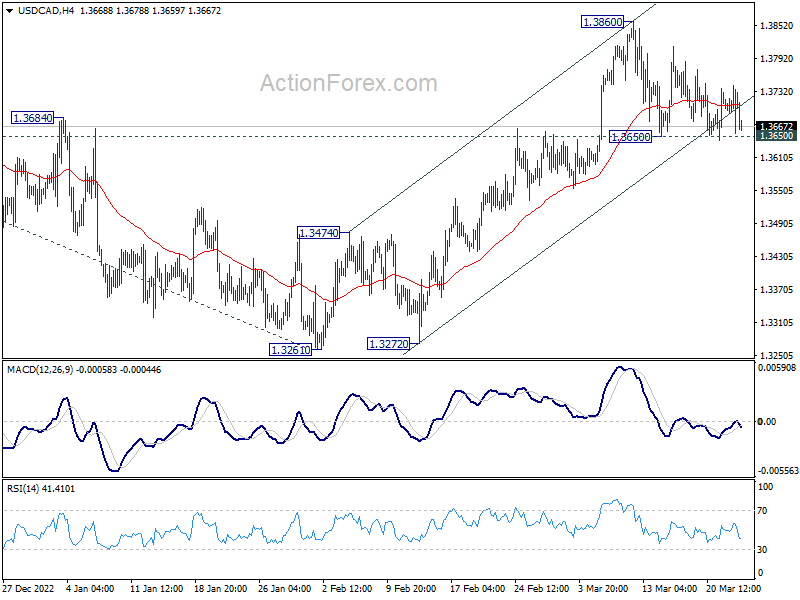
Outlook in USD/CAD remains unchanged and intraday bias stays neutral first. Further rally is expected with 1.3650 support intact. On the upside, break of 1.3860 will resume the rally from 1.3261 to retest 1.3976 high. However, firm break of 1.3650 will mix up the near term outlook and bring deeper pullback to 55 day EMA (now at 1.3576).
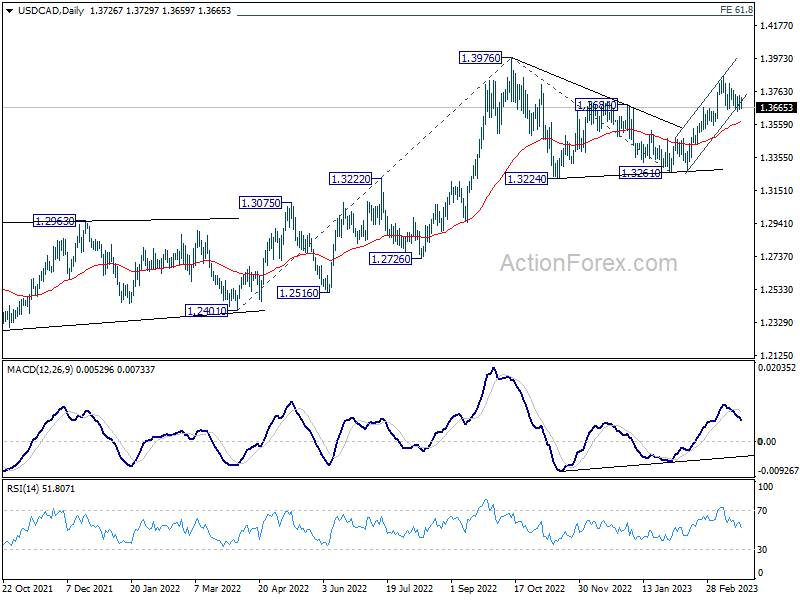
In the bigger picture, the up trend from 1.2005 (2021 low) is still in progress. Break of 1.3976 will confirm resumption and target 61.8% projection of 1.2401 to 1.3976 from 1.3261 at 1.4234. Firm break there will pave the way to long term resistance zone at 1.4667/89 (2016, 2020 highs). On the downside, break of 1.3261 support is needed to confirm medium term topping. Otherwise, outlook will remain bullish even in case of deep pull back.
AUD/USD Daily Report
Daily Pivots: (S1) 0.6643; (P) 0.6701; (R1) 0.6741; More...
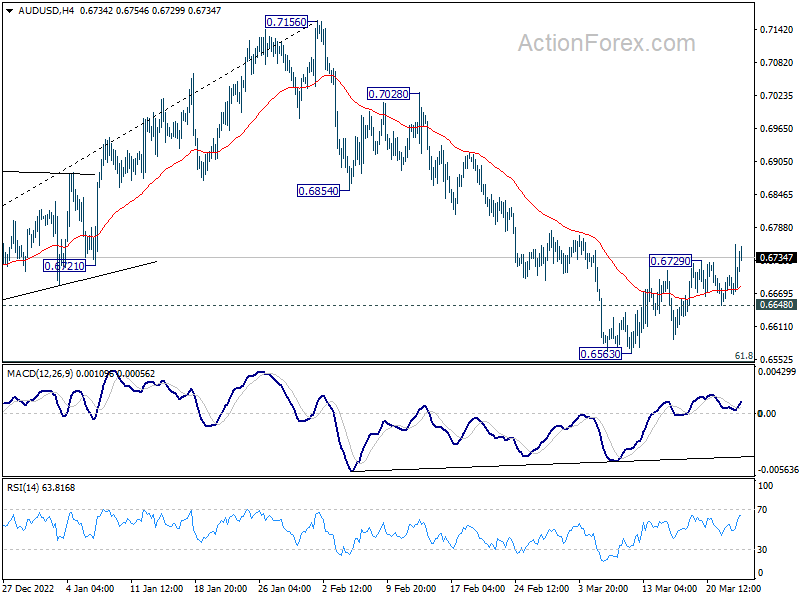
AUD/USD's break of 0.6729 resistance should confirm short term bottoming at 0.6563. Fall from 0.7156 might have also completed just ahead of 0.6546 fibonacci level. Intraday bias is on the upside for 55 day EMA (now at 0.6773). Sustained break there will pave the way back to retest 0.7156 high. On the downside, however, below 0.6648 minor support will turn intraday bias neutral again first.
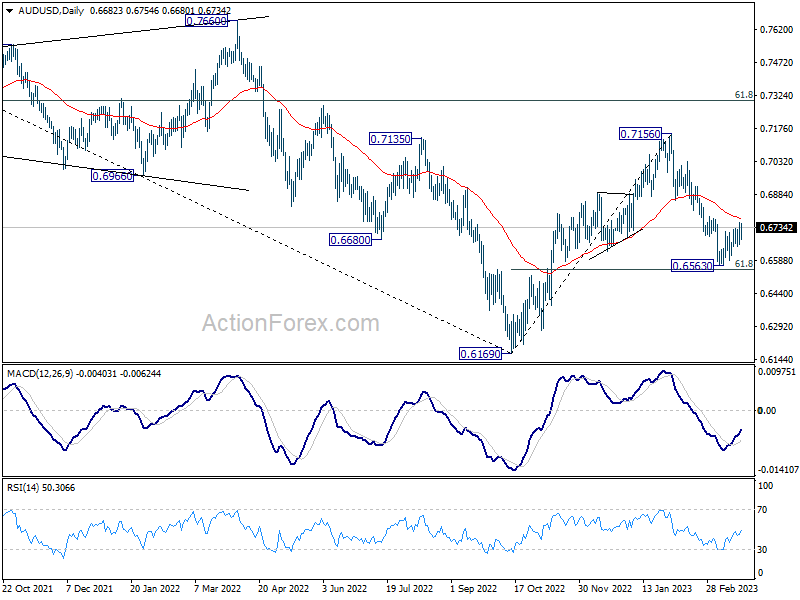
In the bigger picture, as long as 61.8% retracement of 0.6169 to 0.7156 at 0.6546 holds, the decline from 0.7156 is seen as a correction to rally from 0.6169 (2022 low) only. Another rise should still be seen through 0.7156 at a later stage. However, sustained break of 0.6546 will raise the chance of long term down trend resumption through 0.6169 low.
XAU Remains High
EUR/GBP breaks resistance
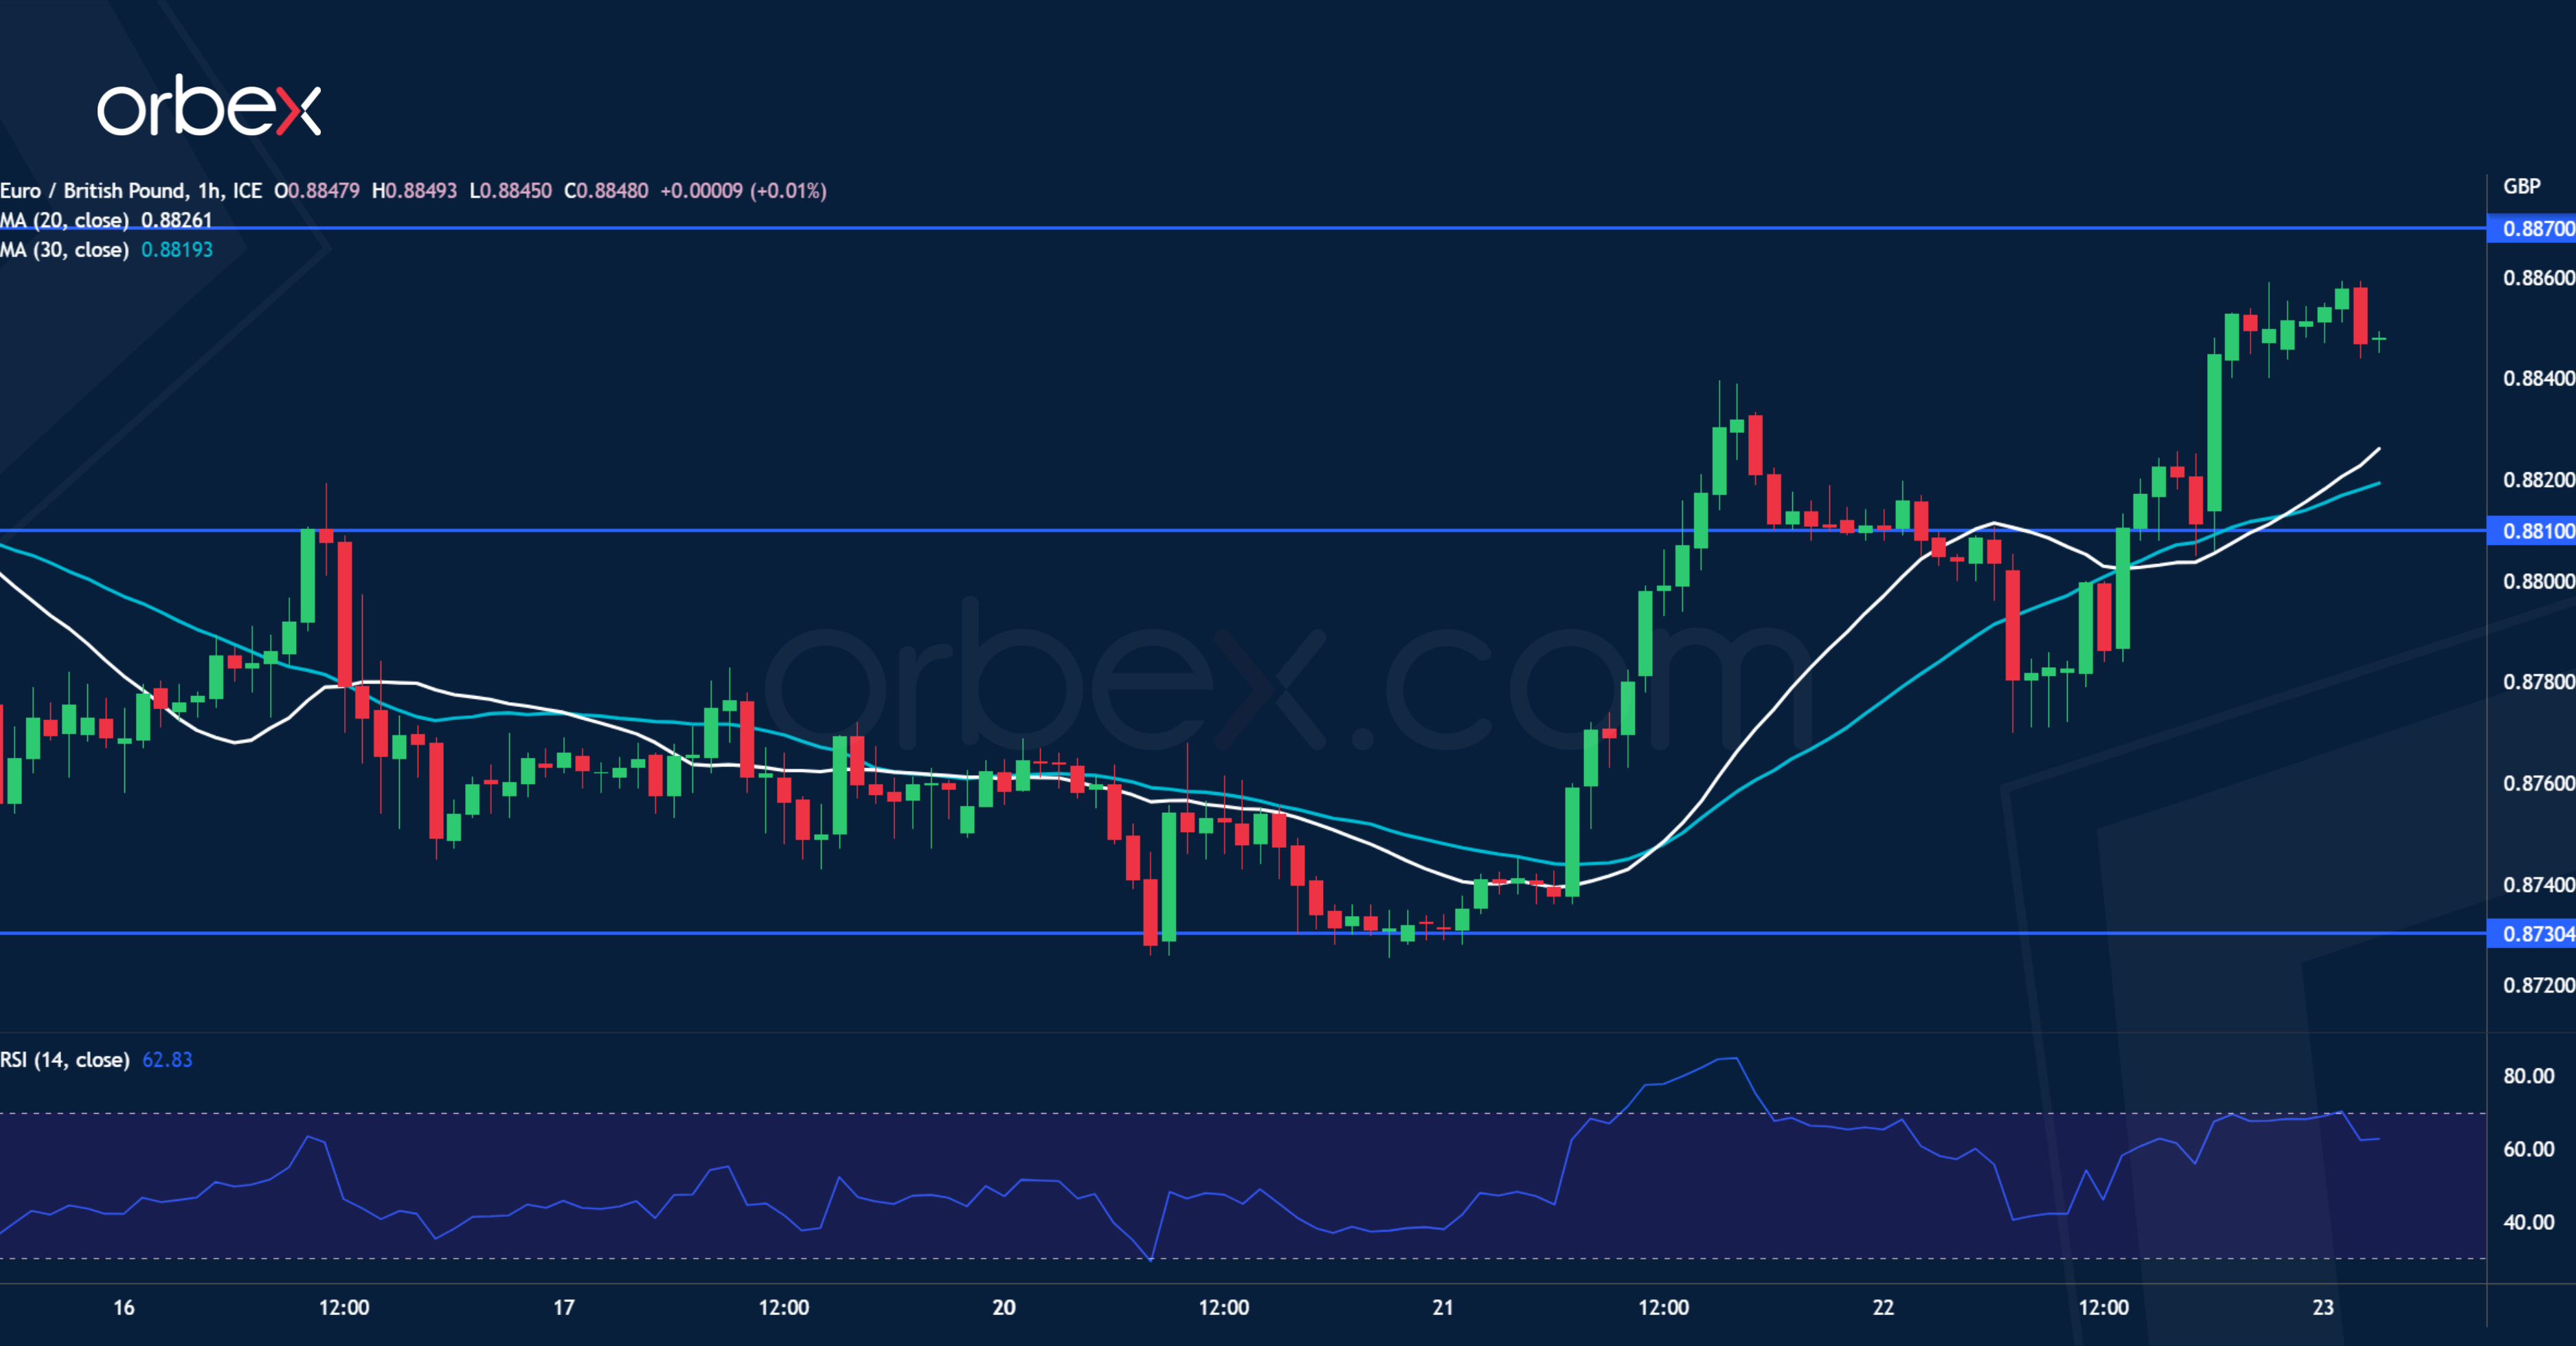
The pound struggles as a jump in February’s CPI may force the BoE to press for more rate hikes. The euro has bounced off this year’s low of 0.8730 and a subsequent surge above the key supply area around 0.8840 prompted sellers to cover their positions, easing the downward pressure. As the RSI flirts again with the overbought area, the next step is to see follow-up buying around the fresh support of 0.8810. A close above 0.8870 would attract more momentum buyers and extend the rally to the March high of 0.8920.
XAU/USD tests peak
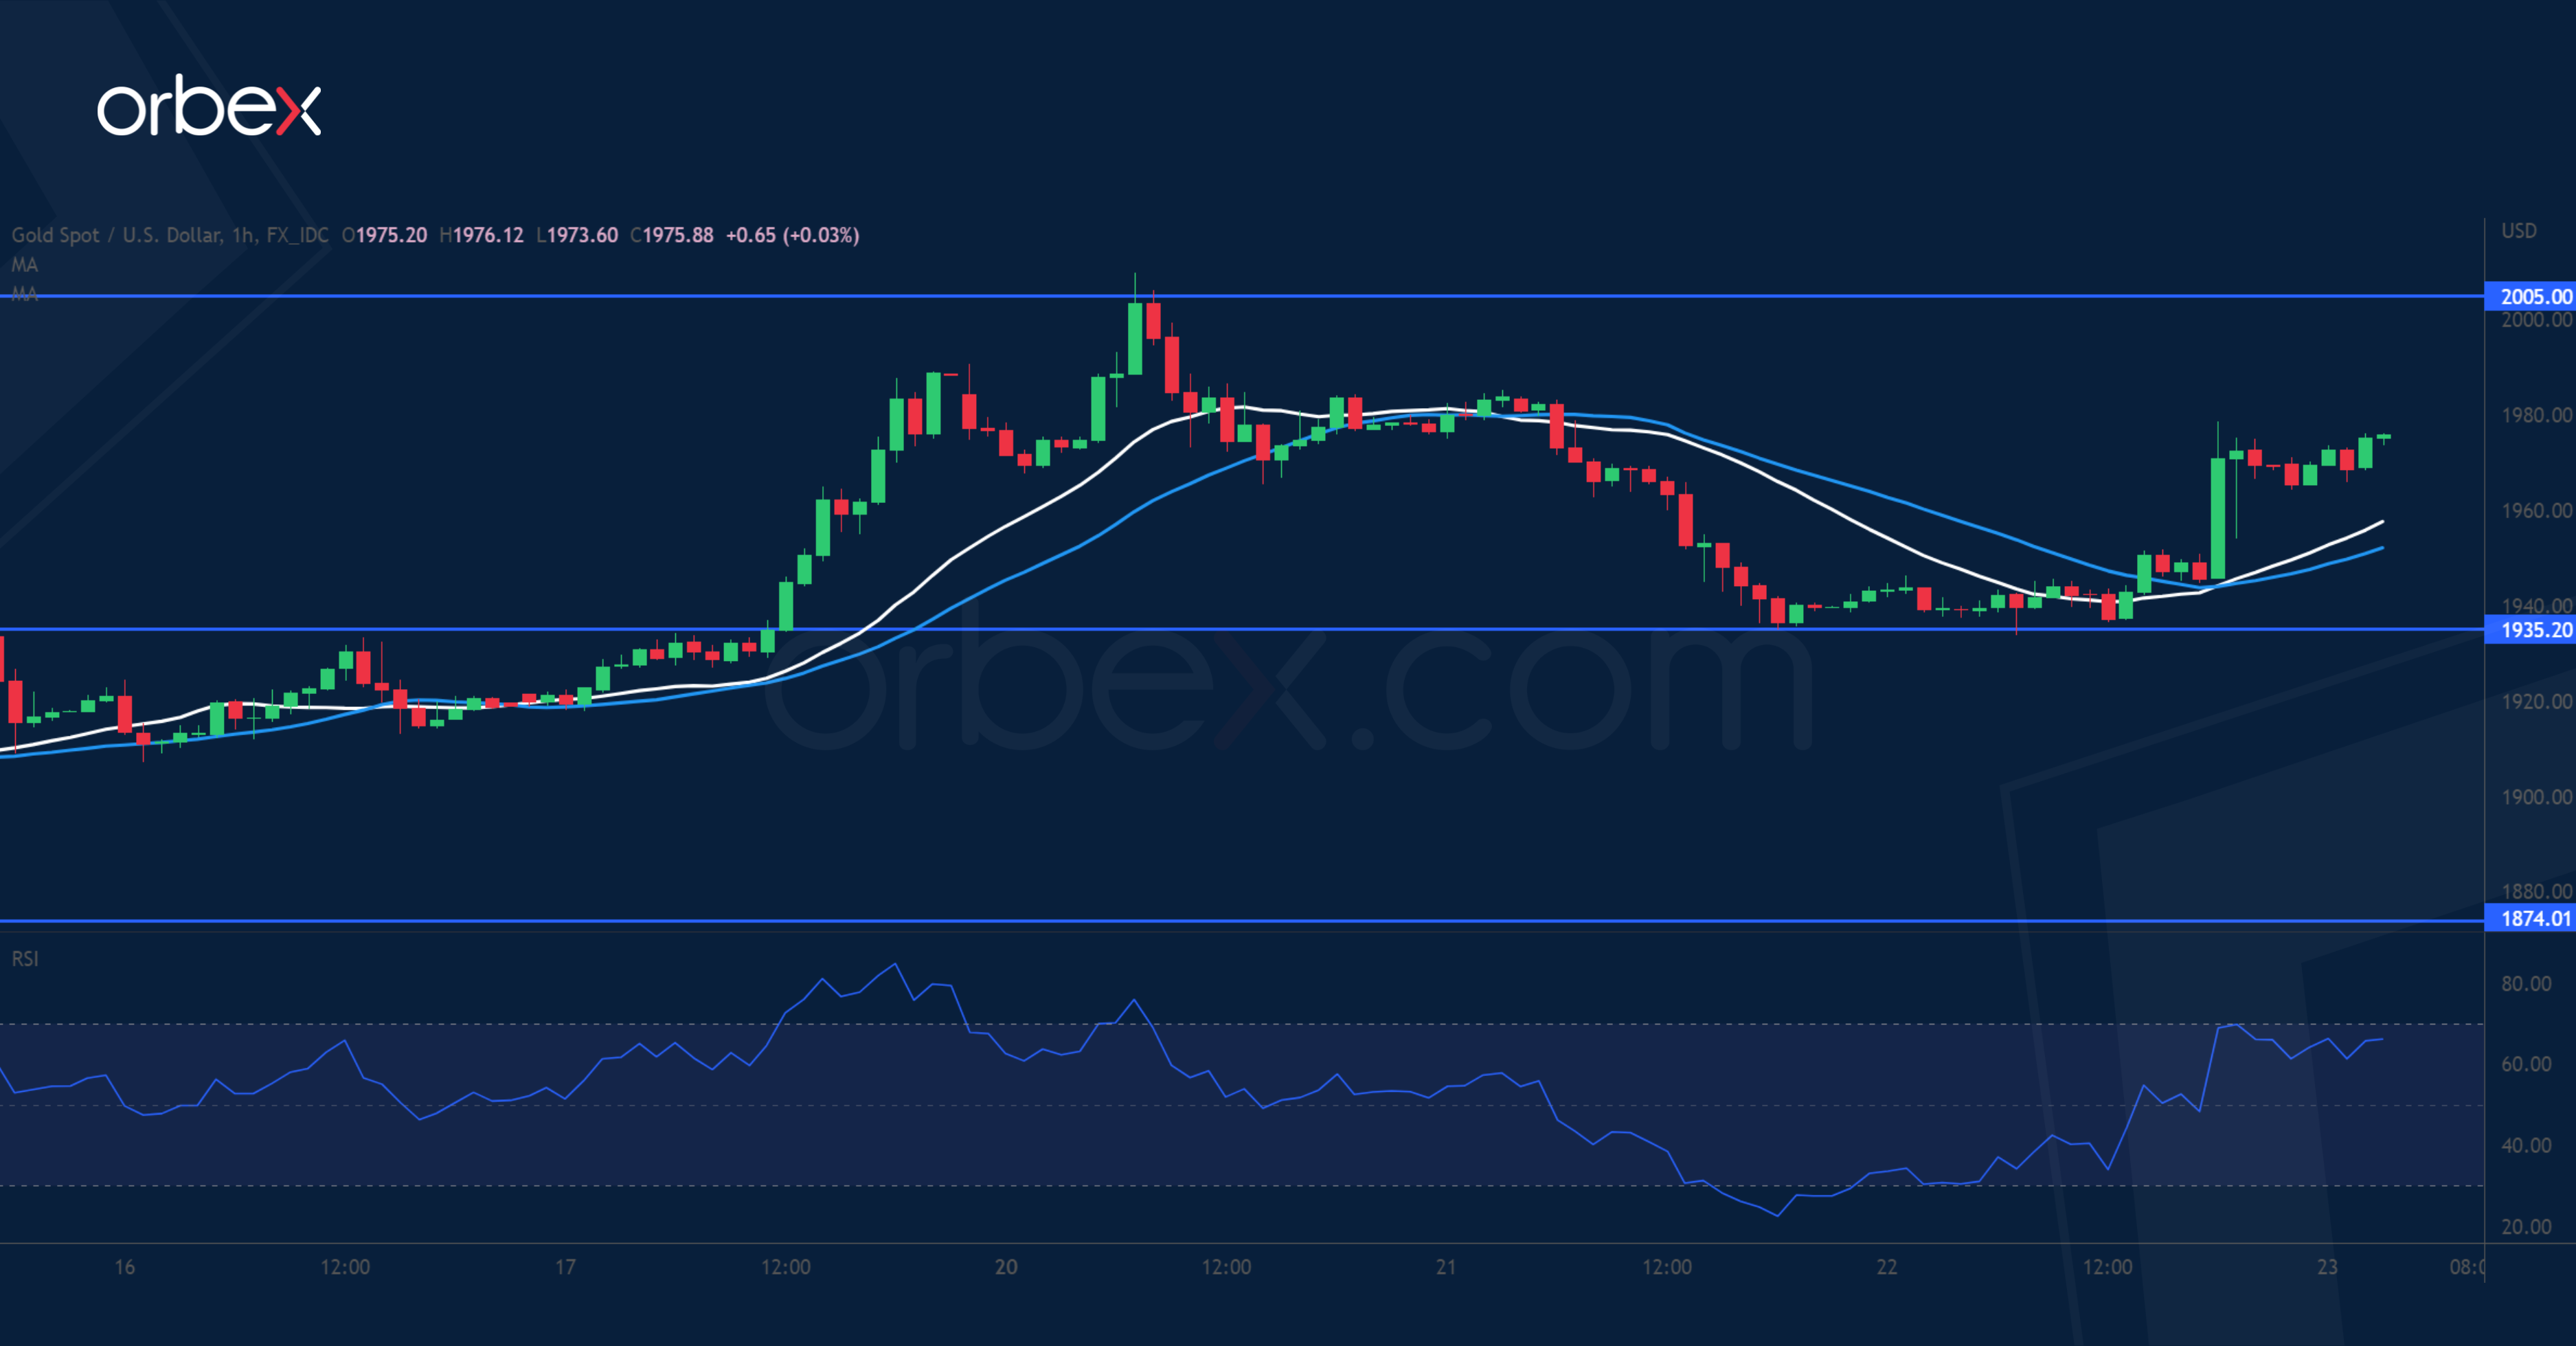
Gold bounces back as safe haven demand jumps amid ongoing tightening. The precious metal has soared to a 11-month high at the psychological level of 2000. While the bullish MA cross shows an acceleration to the upside, the RSI’s double top in the overbought area suggests that the bulls could use some breathing room. On the hourly chart, 1935 saw bids from short-term trend-followers. Further down, 1874 over the 20-day SMA would be the bulls’ second layer of defence. A pop above 2005 would resume the climb.
S&P 500 drops back
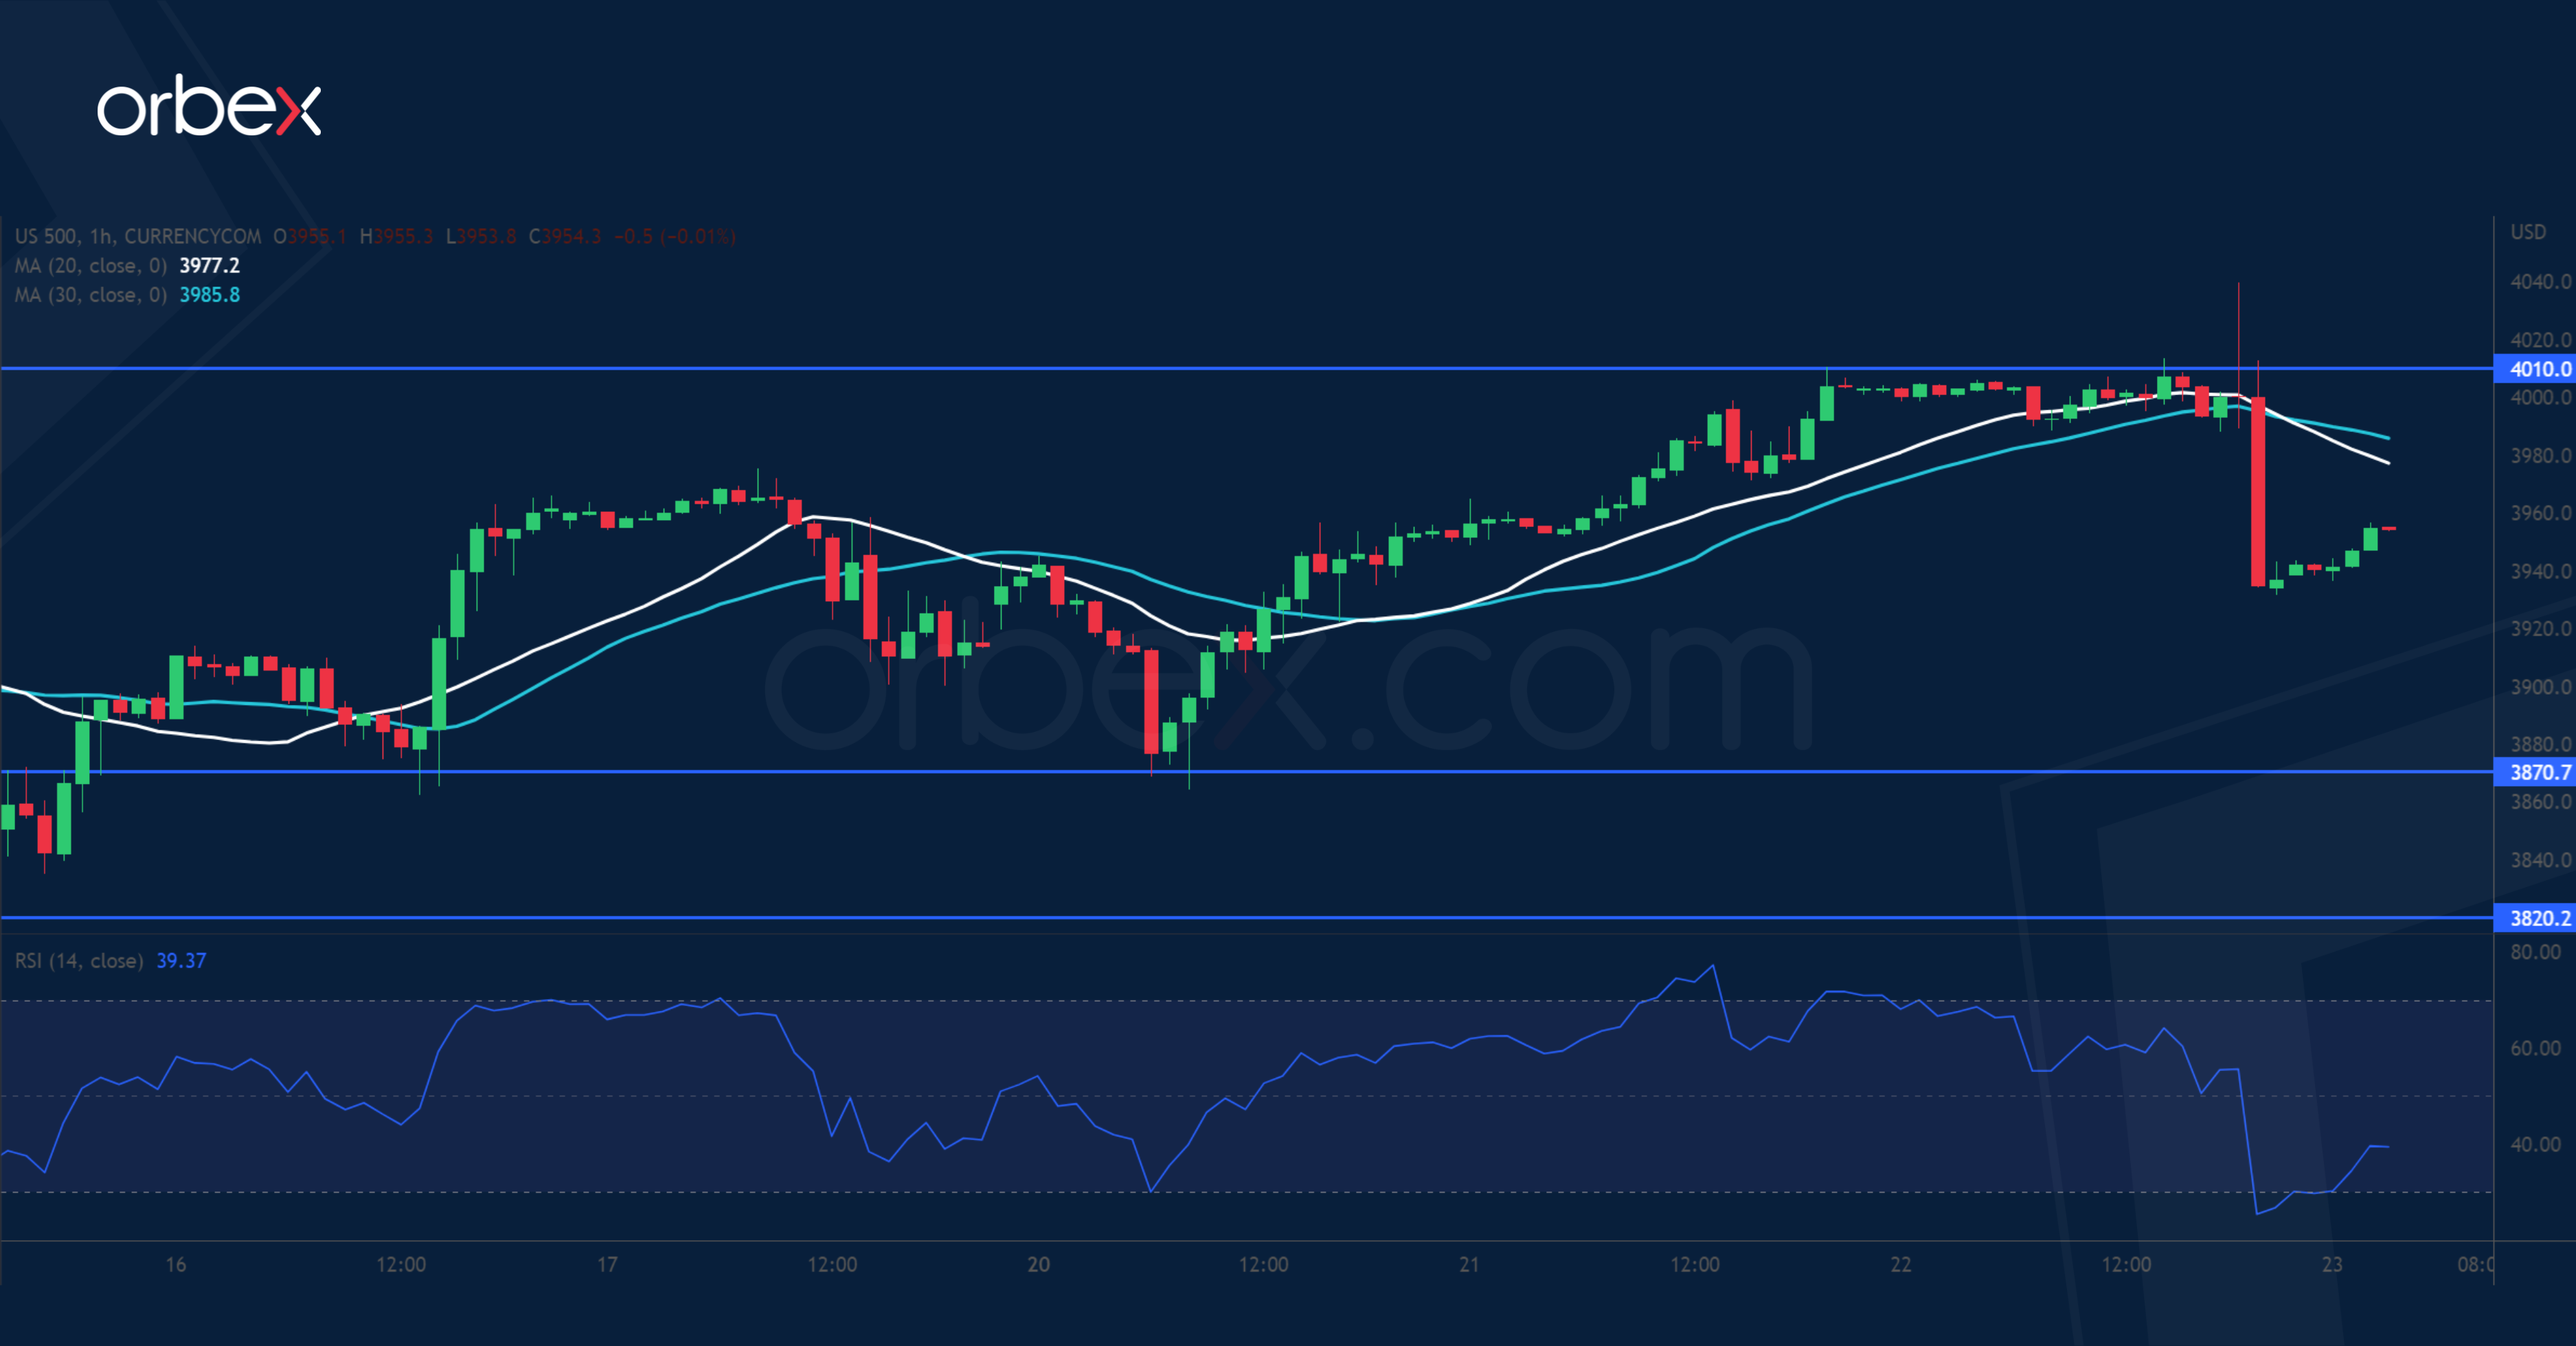
The S&P 500 closed lower after the Fed kept its options open for future hikes despite systemic worries. After the market stabilised and found a bottom at 3820, a series of higher lows has helped the index claw back previous losses. However, the supply zone between the psychological level of 4000 from a previous sell-off and 4010 has proven to be a tough hurdle to overcome with a shooting star suggesting a rejection of the breakout. With the RSI back into the oversold area 3870 is a key support to keep the recent recovery valid.
Contrast Between ECB at Watcher Conference and Fed Was Striking
Markets
The contrast between the ECB at the Watcher conference and the Fed yesterday was striking. Delivering a 50 bps rate hike last week, it said then and again yesterday that there is still more ground to cover. The Fed hiked rates by 25 bps to 4.75-5%. Language about future tightening in the policy statement was softened from “ongoing increases in the target range” to “some additional policy firming”. The updated dot plot suggested one more 25 bps move this year but that would be the end of it. Growth forecasts were revised down for this year (0.4%) and the next (1.2%) while inflation was seen a bit higher at 3.3% in 2023 and at an unchanged 2.5% in the next. Unemployment is still expected at a low 4.5-4.6% across the horizon, suggesting ongoing faith in a (very) strong labour market. The recent banking turmoil and its effect on credit flows and thus consumption and demand is uncertain. But Chair Powell said that a potential pullback in lending would indeed do some of the work of monetary policy. He kept the other option of still-higher interest rates open in case of only a modest economic impact and given still-elevated inflation and the excellent shape of the labour market but the lack of conviction was palpable. Powell also downplayed chances for rate cuts already this year with the dot plot showing none. Markets came to a different conclusion though. After a one in two chance for a final hike in May, they expect economic activity to cool down so much that it would prompt the Fed into 75 bps of rate cuts in the second half of this year. US yields across the curve fell by 8 (30-y) to 25.9 bps (3-y). Losing this much of interest rate support, the dollar slid from EUR/USD 1.076 to 1.085. DXY fell from 103.19 to 102.34 and USD/JPY dropped from 132.51 to 131.44. US equities lost about 1.65% despite the sharp drop in US bond yields. The declines were partially inspired by comments from US Treasury Secretary Yellen (see headline below).
Asian-Pacific equity markets trade mixed this morning as they digest the Fed’s message yesterday. Hong Kong outperforms while Japan lags behind. The USD extends losses against all G10 peers and that probably won’t change for now. EUR/USD surpasses 1.09. Short-term US yields lose another 4 bps. German Bund yields are set to open lower. Focus today shifts to European soil. The economic calendar contains several central bank policy meetings by the Norges Bank (+25 bps expected), the Swiss National Bank (+50 bps expected) and the Bank of England. The latter was served an ugly inflation print yesterday. Prices unexpectedly accelerated again, de facto fulfilling the condition of “evidence of more persistent inflationary pressures”. This paves the way for a probably final 25 bps hike to 4.25%. The Bank of England has long been split in whether to tighten further or stand pat. After the Fed’s policy decision yesterday, the debate is now likely settled. That means more scope for EUR/GBP to run higher.
News Headlines
US Treasury Secretary Yellen yesterday pushed back against the recently floated idea of providing a blanket deposit insurance to stabilize the US financial system. “I have not considered or discussed anything having to do with blanket insurance or guarantees of deposits,” she said before a Senate subcommittee. Bloomberg earlier this week reported that the US Treasury is studying ways to temporarily raise the federal insurance cap above $250k if smaller lenders face difficulties. In her opening remarks, she stressed that shareholders and bondholders of failed banks are not being protected by the US government.
The Hungarian economic development ministry announced that it will extend a cap on large bank deposits – due to expire end of March – by three months. Under the cap, Hungarian commercial banks cannot pay an interest rate above the 3-month discount-bill yield for deposits of up to a year. To protect the economy, the economics ministry has also banned the unrestricted transfer of central bank discount bills.
USD/JPY Daily Outlook
Daily Pivots: (S1) 130.69; (P) 131.84; (R1) 132.68; More...
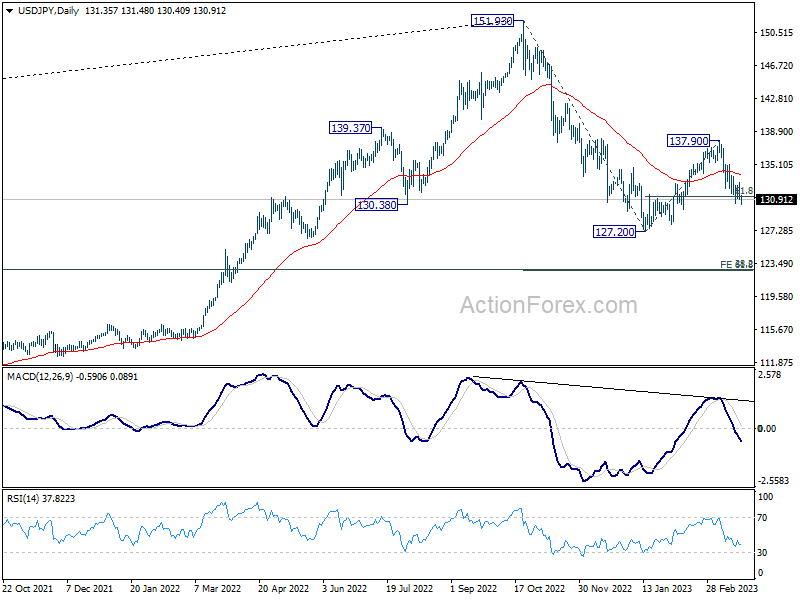
USD/JPY's is trying to resume the fall from 137.90 by breaching 130.52 temporary low, and intraday bias is back on the downside. Sustained trading below 61.8% retracement of 127.20 to 137.90 at 131.28 will pave the way to retest 127.20 low next. On the upside, however, break of 132.99 resistance will suggest short term bottoming and turn bias back to the upside for stronger rebound.
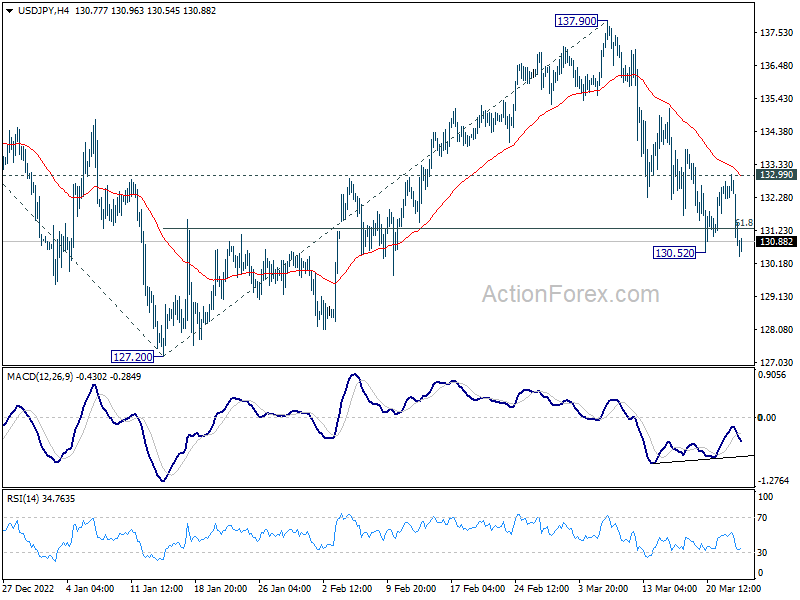
In the bigger picture, rebound from 127.20 should have completed at 137.90 as a corrective move, with strong break of 55 day EMA. The down trend from 151.93 (2022 high) is not over yet. Break of 127.20 will resume this down trend and target 61.8% projection of 151.93 to 127.20 from 137.90 at 122.61. This will now be the favored case as long as 137.90 resistance holds.