

Sample Category Title
USD/CHF Daily Outlook
Daily Pivots: (S1) 0.9132; (P) 0.9189; (R1) 0.9230; More...
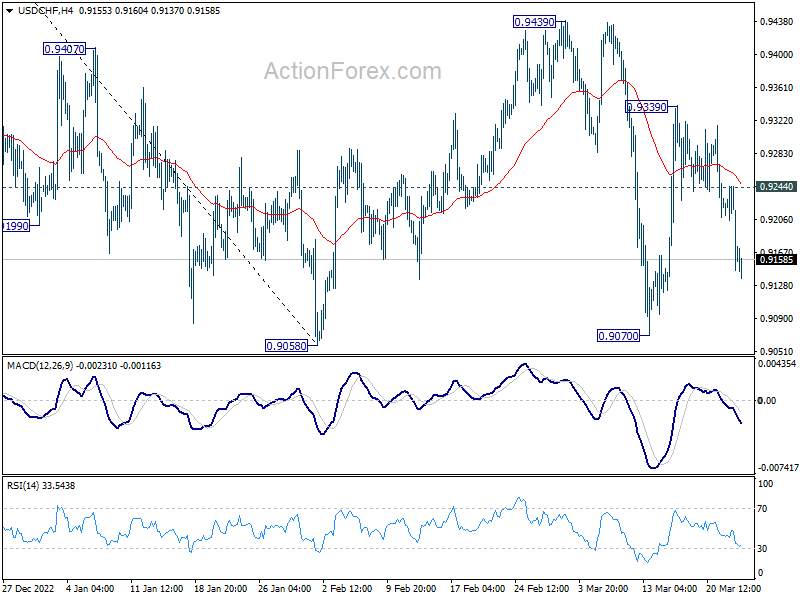
Intraday bias in USD/CHF is back on the downside as recovery from 0.9070 should have completed at 0.9439 already. Deeper fall would be seen to retest 0.9058 low first. Decisive break there will resume larger down trend from 1.1046. On the upside, above 0.9244 minor resistance will turn intraday bias neutral again. Overall outlook will stay bearish as long as 0.9474 fibonacci level holds.
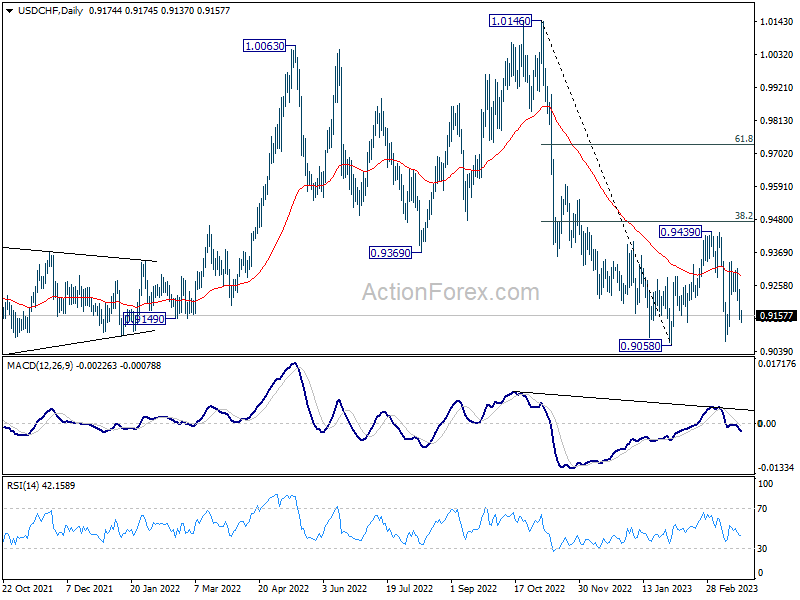
In the bigger picture, fall from 1.1046 (2022 high) should still be in progress with 38.2% retracement of 1.0146 to 0.9058 at 0.9474 intact. Prior rejection by 55 week EMA was a medium term bearish sign. Break of 0.9058 will resume such decline towards 0.8756 support (2021 low). But overall, such fall is still as a leg in the long term range pattern from 1.0342 (2016 high). So, downside should be contained by 0.8756 to bring reversal.
GBP/USD Daily Outlook
Daily Pivots: (S1) 1.2207; (P) 1.2271; (R1) 1.2333; More...
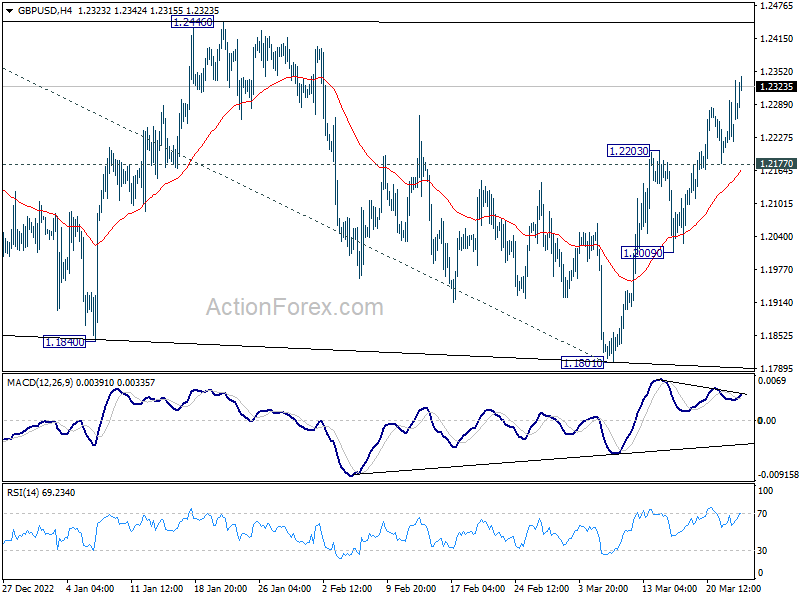
Intraday bias in GBP/USD remains on the upside at this point. Rise from 1.1801 is in progress for retesting 1.2445/6 resistance zone. Decisive break there will resume larger rise from 1.0351, and target 1.2759 fibonacci level. On the downside, break of 1.2177 minor support will argue that corrective pattern from 1.2445 is extending with another falling leg, and turn bias to the downside.
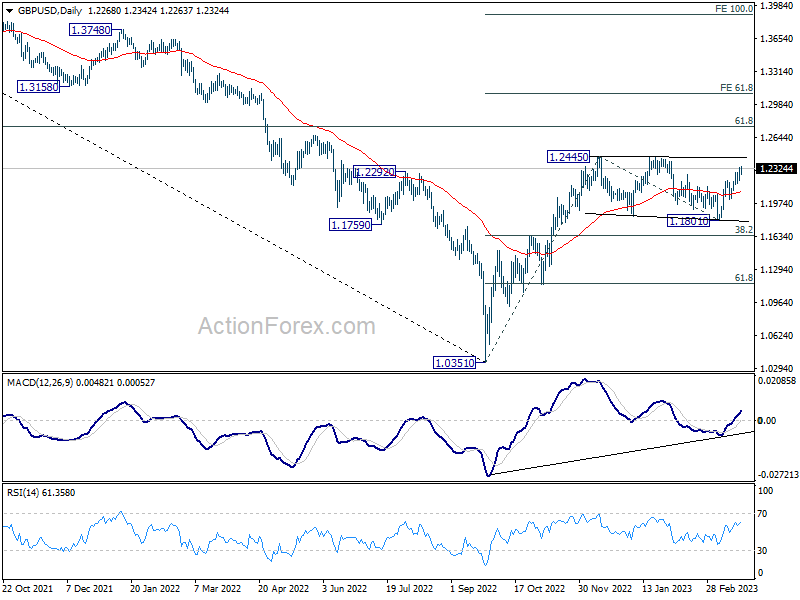
In the bigger picture, price action from 1.2445 are seen as a corrective pattern to rise from 1.0351 medium term bottom (2022 low). Resumption of the rally from 1.0351 is expected and break of 1.2446 will target 61.8% retracement of 1.4248 (2021 high) to 1.0351 at 1.2759. This will remain the favored case as long as 38.2% retracement of 1.0351 to 1.2445 at 1.1645 holds.
Fed Hikes 25bp, BoE is Next to Decide
Yesterday’s Federal Reserve (Fed) decision was relatively hawkish.
The Fed raised the rates by 25bp, as broadly priced in, but Fed Chair Jerome Powell signaled that there would be another 25bp hike on the wire before this tightening cycle ends. That was hawkish.
The Fed confirmed that the Quantitative Tightening (QT) is up and running at the speed of $95bn per month.
The latest dot plot was unchanged with most members expecting the Fed rate to reach 5.10%. That would’ve been interpreted as being dovish if the meeting took place two weeks ago, before the Silicon Valley Bank (SVB) debacle – when Powell was still hinting that the Fed would speed up rate hikes to abate inflation.
Now, it’s not even sure that there would be another rate hike.
The Fed’s policy no longer depends on inflation only, it also depends on how the latest bank stress will impact credit availability. As Powell says, a decent ‘credit tightening from baking troubles’ in a way ‘substitutes for rate hikes’.
And uncertainty regarding a potential credit tightening brings confusion on the table regarding the Fed policy.
For equity traders, the combination of a 25bp hike, the hint of another 25bp, and the risk of credit tightening was too much to cheer. The S&P500 lost 1.65%.
But, on the bonds front, the perception of the latest Fed decision was different. The US 2-year yield fell despite Powell insisting that the tightening may not be over due to ‘inflation still running too hot’.
Moreover, the markets went on pricing a 100bp cut for the year end. The gap between the dot plot and market pricing widened, yet again, raising, one more time, the credibility issues that Powell is encountering right now.
And activity on Fed funds futures tells that the chance of another 25bp hike is no more than 35% in the wake of Powell’s comments.
In other words, bond traders don’t believe Powell. And Powell’s job has just gotten more complicated with financial stress joining the inflation headache.
The US dollar index fell after the FOMC decision yesterday, along with the yields.
US futures are in the positive at the time of writing. It is well possible that the post-FOMC equity selloff quickly reverses, at falling yields are supportive of equity valuations – if financial stress is contained and economic data is not too bad.
ECB, BoE expectations remain hawkish
The dollar’s sharp fall led to a strong rally in the EURUSD yesterday. The pair traded past the 1.0910 level as a couple of hours before the Fed decision and Powell’s speech, the European Central Bank (ECB) President Christine Lagarde repeated that the ECB will keep a ‘robust’ approach to respond to inflation risks, and that the 2% inflation target is non-negotiable.
Oh, how the tables turned
This year, we are faced with a decidedly hawkish ECB and a weakened Fed. And the sufficiently hawkish ECB and softening Fed expectations hint that the EURUSD has potential to extend gains above the 1.10 mark in the coming months. The 1.1275 is now a reasonable target for the bulls.
Across the Channel, Cable also rallied yesterday. It rallied because the latest inflation report from the UK was a shocker. The headline inflation unexpectedly ticked above the 10% mark, as food prices rose 18% last month. But core inflation, which doesn’t take into account food and energy prices, unexpectedly rose as well, and sat above the 6% level, again.
The latest set of CPI figures threw Mr. Bailey’s prediction of a ‘sharp fall’ in inflation under the bus.
And because inflation won’t ease by itself, it is almost certain that the Bank of England (BoE) will hike its own policy rate by 25bp when it meets today.
Cable is preparing to test the January highs as the softening Fed expectations due to bank stress and hawkish BoE expectations due to high inflation hint that the pair could continue its advance to 1.25 in the continuation of the actual positive trend.
Fed Holds a Steady Course
Market movers today
A rather quiet day in terms of data, and hence, focus remains on central banks with a number of monetary policy announcements and several ECB speakers scheduled.
The Swiss National Bank is the first to announce their decision, and despite the turmoil in the country's banking system, we and consensus expect them to hike the policy rate by 50bp to 1.50%.
Norges Bank comes next, and we expect them to hike the policy rate by 25bp to 3.00% as they have been signalling.
The Central Bank of Turkey rate decision is also due today and market consensus is for 'on hold'.
Lastly, we expect the Bank of England to announce their final 25bp hike in the afternoon, bringing the Bank rate to 4.25%. After an upside inflation surprise yesterday, markets are also more convinced and the hike is fully priced in (see also Bank of England Preview - Final hike in store, 17 March).
On data front, we get US home sales for February and euro area preliminary consumer confidence for March.
The 60 second overview
Fed: As widely expected, the Federal Reserve hiked rates by 25bp last night. In line with our expectations, no changes were made to the QT, and the 2023 median 'dot' was unchanged at 5.1%. That said, both the statement and Powell's comments were tilted to the dovish side, highlighting that the 'Recent (banking sector) developments are likely to result in tighter credit conditions for households and businesses and to weigh on economic activity, hiring, and inflation'. US Treasury yields declined and EUR/USD ticked higher towards 1.09 as a response, but equity markets were under pressure after Yellen commented that the US is not considering a 'blanket insurance' for bank deposits. For now, we stick to our call of a final Fed hike in May, and no rate cuts through 2023. Going forward, we will closely follow the upcoming macro and bank lending data, which will provide first concrete insights into how the uncertainty has affected the real economy. See our full Fed review: A cautious 25bp hike, 22 March.
ECB: President Lagarde delivered a fairly balanced speech at the ECB watchers conference, stressing that the central bank will adopt a robust data-dependent approach that allows it to respond to inflation risks as needed, but also aid financial markets if threats emerge. She also repeated that if the ECB's baseline holds there will be more ground to cover in terms of future rate hikes - a message mirrored by comments from Bundesbank President Nagel earlier that ECB is not yet done raising rates. Lagarde said officials will keep a close eye on the banking sector in the next weeks and months to see whether firms are becoming more reluctant to lend. Markets have now repriced the ECB peak rate back to 3.5%. As more time lapses (without negative news on the banking turmoil), more focus will return to macro data - which still warrants further repricing higher in our view.
FI: There was a solid rally in US Treasury bonds after the FOMC meeting. The Federal Reserve raised rates by 25bp as expected, but signaled that the problems in the US banking sector could dampen the need to do more. However, they remain committed to bringing down inflation and are confident that raising rates should not deepen the current problems in the US banking sector. 2Y US Treasury yields dropped 23bp, while 10Y Treasuries dropped 18bp.
FX: The USD sold off yesterday. It started before the FOMC meeting and continued after the 25bp hike was announced and during the press conference. EUR/USD rose to around 1.09 and USD/JPY fell to around 131. Scandies failed to benefit from the weaker USD, which likely reflects the setback in equities.
Credit: Credit markets were in a wait-and-see mode ahead of the Fed decision last night, with iTraxx Main broadly unchanged at 90bp (-1bp) and Xover at 470bp (-2bp). The AT1 market saw further stabilisation with prices generally increasing again. Meanwhile, UBS launched a tender offer totalling EUR2.75bn in its recently issued senior HoldCo bonds at the reoffer price, in what seems to be a move to please credit investors.
Nordic macro
We expect Norges Bank to hike the policy rate by 25bp to 3.00% as it has been signalling. We also expect the bank to signal a further hike, most likely in June. This will be reflected in the policy rate path in the new monetary policy report, which will probably also show a possibility of a third hike in late summer/autumn. The most interesting part will be to see how NB will balance the risk of inflation from a weaker NOK vs. the current risk in the financial system.
Yesterday it was communicated that Riksbank's Henry Ohlsson will retire early, in June, whereas his current term ends in 2026. He started in 2015 and finally, you could say, the consistent rate hawk got his way. There is no drama in this, in our view. The chairman of the General Council said he will propose that there will be no replacement of Ohlsson, though the formal decision will be taken on 21 April. The new Riksbank law stipulates that there will be only five Board members from 2028 at the latest. Today, Erik Thedéen gives a speech with the interesting title "My view on monetary policy" (15:00). The mantra so far is that they are data dependent, but of course they are concerned with the uptrend in core inflation accelerating.
EUR/USD Daily Outlook
Daily Pivots: (S1) 1.0772; (P) 1.0842; (R1) 1.0926; More...
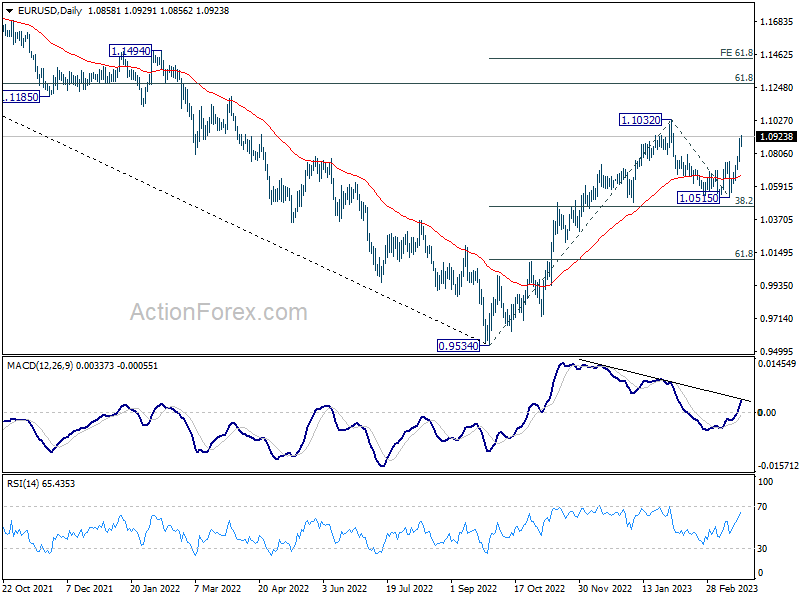
EUR/USD's rise from 1.0515 accelerates higher and intraday bias stays on the upside for retesting 1.1032 high. Decisive break there will resume whole up trend from 0.9534 and target 1.1273 fibonacci level next. On the downside, below 1.0787 minor support will turn intraday bias neutral and bring consolidations first, before staging another rally.
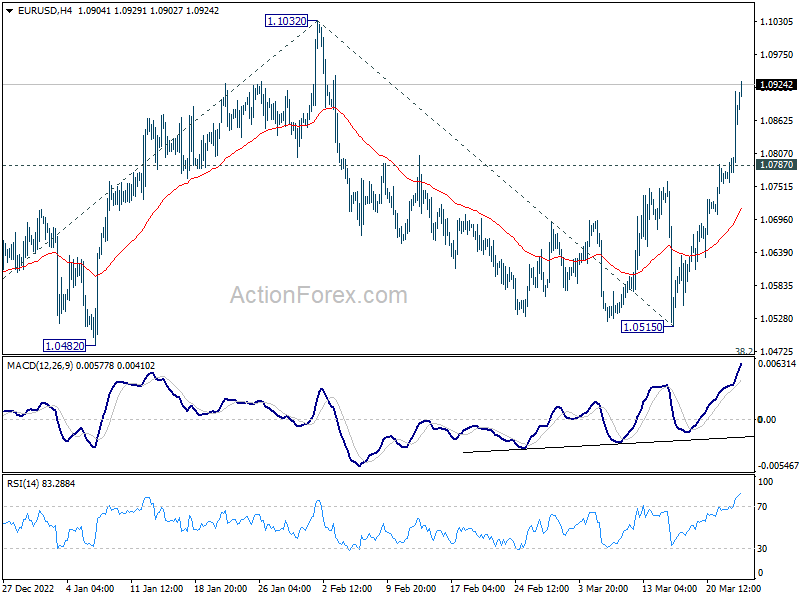
In the bigger picture, rise from 0.9534 (2022 low) is in progress with 38.2% retracement of 0.9534 to 1.1032 at 1.0460 intact. The strong support from 55 week EMA (now at 1.0623) was also a medium term bullish sign. Next target is 61.8% retracement of 1.2348 (2021 high) to 0.9534 at 1.1273. Sustained break there will solidity the case of bullish trend reversal and target 1.2348 resistance next (2021 high).
Euro Leads Gains as Dollar Struggles Post-FOMC; BoE and SNB Decisions Take Center Stage
Dollar faced broad sell-off overnight after the less hawkish than expected Fed rate hike and press conference, with Euro emerging as the biggest winner against the greenback. Sterling and Swiss Franc followed suit, while Australian and New Zealand dollars also strengthened but lagged on a weekly basis.
Attention now shifts to BoE and SNB rate decisions. Both are expected to continue their rate hike cycles, but uncertainties remain about the path ahead. Any outcome perceived as less hawkish could push Euro further up, aided by an extended rally in EUR/CHF and a stronger rebound in EUR/GBP.
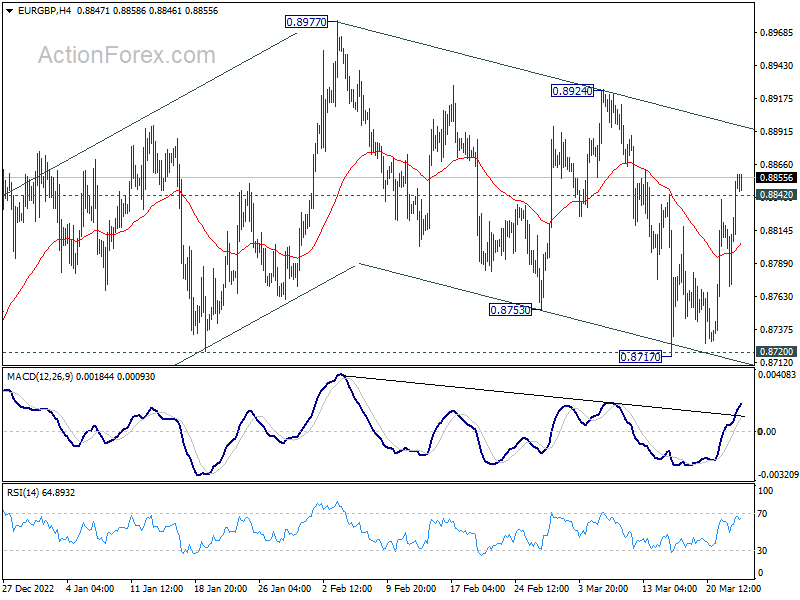
Technically, EUR/GBP's break of 0.8842 minor resistance affirm the case that corrective fall from 0.8977 has completed with three waves down to 0.8717, after drawing support from 0.8720. Further break of 0.8924 resistance will send the cross through 0.8977 to resume whole rise from 0.8545 (2022 low).
In Asia, Nikkei closed down -0.17%. Hong Kong HSI is up 1.74%. China Shanghai SSE is up 0.48%. Singapore Strait Times is down -0.14%. Japan 10-year JGB yield is down -0.0295 at 0.305. Overnight, DOW dropped -1.63%. S&P 500 dropped -1.65%. NASDAQ dropped -1.60%. 10-year yield dropped -0.106 to 3.500
S&P 500 down, reacted more to Yellen than Powell?
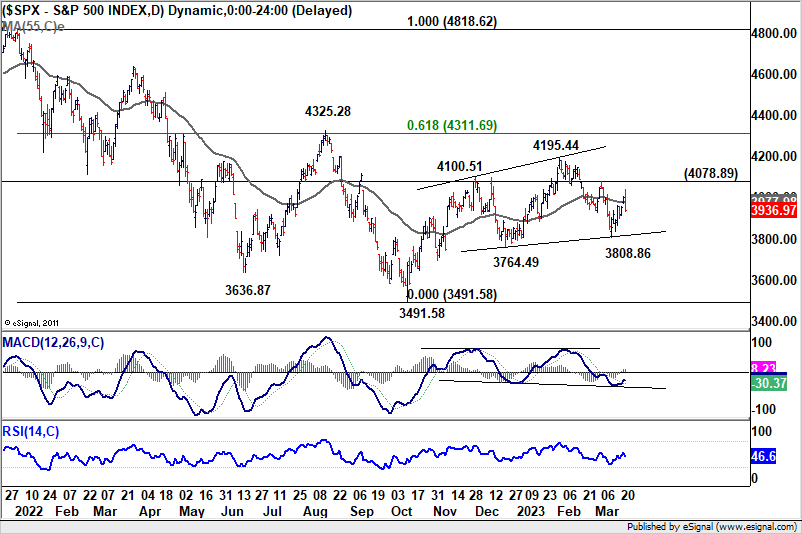
US markets experienced a complex development overnight due to simultaneous reactions to two events. Initially, the markets responded bullishly to the Fed's less hawkish than expected rate hike and press conference. However, just an hour before the close, sellers jumped in, and the three major indexes closed -1.6% lower.
The selloff might be more attributed to Treasury Secretary Janet Yellen's comments at a Senate committee. She explicitly stated, "I have not considered or discussed anything having to do with blanket insurance or guarantees of deposits."
Yellen further elaborated, "when a bank failure is deemed to create systemic risk, which I think of as the risk of a contagious bank run...we are likely to invoke the systemic risk exception, which permits the FDIC to protect all depositors, and that would be a case-by-case determination."
Meanwhile, Asian markets have remained sluggish and mixed today, without any apparent signs of bearishness carried over. It may take some more time to understand the unfolding situation fully.
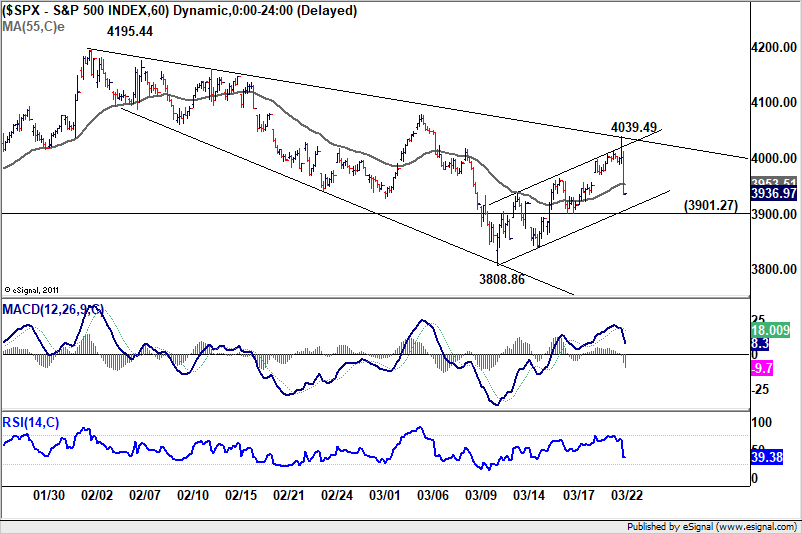
Technically, near term outlook in S&P 500 isn't too bearish yet given it's holding inside a near term channel. However, break of 3901.27 support will argue that the corrective rebound from 3808.85 has completed at 4039.49, after hitting falling trend line resistance. Deeper selloff would then follow through 3808.86 to resume whole decline from 4195.44.
Fed softened hawkish tone, but not dovish
In light of the Fed announcement and press conference overnight, it appears that another 25bps rate hike is likely in May, followed by a prolonged pause with no rate cut expected until next year. The overall picture remains hawkish, albeit not as much as after Fed Chair Jerome Powell's earlier testimony this month.
As anticipated, Fed raised interest rates by 25bps to 4.75-5.00%. While the tightening bias was maintained, the statement softened its tone, stating, "some additional policy firming may be appropriate." Despite recent market turmoil, median projections still indicated an interest rate peak of 5.1% this year, suggesting one more 25bps hike before pausing until next year. The median projection for 2024 interest rate increased from 4.1% to 4.3%, signaling a slower path of rate cuts.
During the post-meeting press conference, Powell acknowledged that "financial conditions seem to have tightened" recently, adding that if the situation persists, it could "easily have a significant macroeconomic effect, and we would factor that into our policy decisions." While he admitted that a pause was considered during the meeting, he emphasized that a rate cut this year was "not our baseline expectation," stating, "the key is we have to have policies tight enough to bring inflation down to 2%."
Suggested readings on Fed:
- FOMC's Fight Against Inflation Finely Balanced
- FOMC Hikes Rates, But End of Tightening Cycle Coming Into View
- Suderman Says: Rates Up as Expected, But Peak in Sight?
- FOMC Hikes Policy Rate by 25 Basis Points, Cautions on Bank Stress
- Fed hikes 25 bps, terminal rate forecast unchanged at 5.1%
- (FED) Federal Reserve Issues FOMC Statement
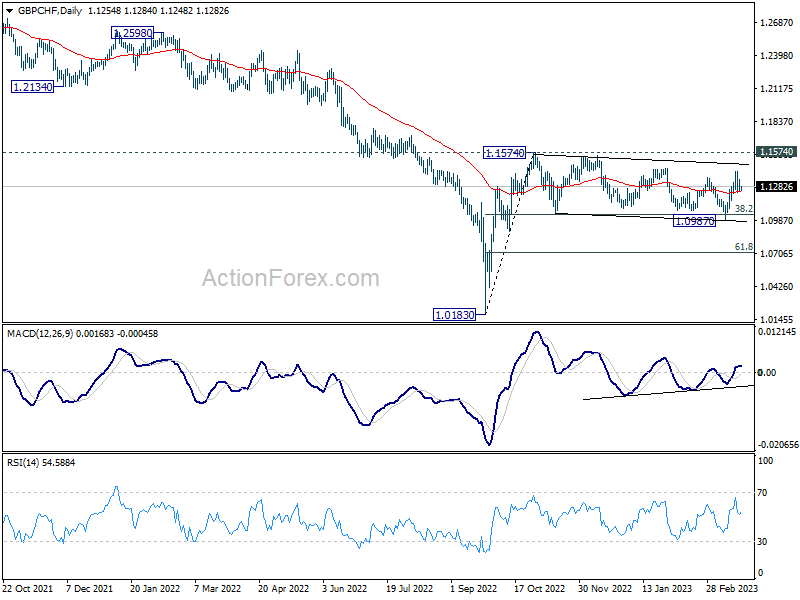
GBP/CHF extending range trading ahead of BoE and SNB
BoE and SNB are both expected to raise interest rates today. A 25bps hike by BoE to 4.25% is widely anticipated, though the case for a subsequent pause has been shaken by the reacceleration of consumer inflation in February. The Monetary Policy Committee is known for its divided outlook on the amount of tightening needed, and today's voting should continue to reflect this pattern.
An explicit indication of a pause could put downward pressure on Sterling, but such a signal is unlikely to emerge. Instead, BoE is more likely to adopt a non-committal stance, waiting for incoming data and the next economic projections in May before making a firm judgment.
Concurrently, SNB is expected to hike by 50bps to 1.50%. Market expectations suggest a possible 25bps hike in June to a terminal rate of 1.75%, followed by a pause. However, the SNB's comments and projections could reshape these expectations.
Here are some previews for BoE and SNB:
- UK Inflation Will Strengthen the Hawks
- BoE Rate Decision: One Last Hike Before Hitting Pause?
- BoE Preview: 25 bps Hike and Done?
- Bank of England Preview – Final Hike in Store
- Bank of England & Swiss National Bank Both Set to Hike
- Will the SNB Roil Markets With a Hike Amid Credit Suisse Crisis?
GBP/CHF is still bounded in medium term sideway consolidation from 1.1574. Outlook is kept bullish as the crosses quickly recovered after breaching 38.2% retracement of 1.0183 to 1.1574 at 1.1043 briefly. A break through 1.1574 resistance to resume the rise form 1.0184 is expected. But that might not happen today, unless there is some drastic surprise from BoE or SNB.
EUR/USD Daily Outlook
Daily Pivots: (S1) 1.0772; (P) 1.0842; (R1) 1.0926; More...
EUR/USD's rise from 1.0515 accelerates higher and intraday bias stays on the upside for retesting 1.1032 high. Decisive break there will resume whole up trend from 0.9534 and target 1.1273 fibonacci level next. On the downside, below 1.0787 minor support will turn intraday bias neutral and bring consolidations first, before staging another rally.
In the bigger picture, rise from 0.9534 (2022 low) is in progress with 38.2% retracement of 0.9534 to 1.1032 at 1.0460 intact. The strong support from 55 week EMA (now at 1.0623) was also a medium term bullish sign. Next target is 61.8% retracement of 1.2348 (2021 high) to 0.9534 at 1.1273. Sustained break there will solidity the case of bullish trend reversal and target 1.2348 resistance next (2021 high).
Economic Indicators Update
| GMT | Ccy | Events | Actual | Forecast | Previous | Revised |
|---|---|---|---|---|---|---|
| 08:30 | CHF | SNB Interest Rate Decision | 1.50% | 1.00% | ||
| 12:00 | GBP | BoE Rate Decision | 4.25% | 4.00% | ||
| 12:00 | GBP | MPC Official Bank Rate Votes | 7--0--2 | 7--0--2 | ||
| 12:30 | USD | Current Account (USD) Q4 | -217B | |||
| 12:30 | USD | Initial Jobless Claims (Mar 17) | 195K | 192K | ||
| 14:00 | USD | New Home Sales Feb | 650K | 670K | ||
| 14:30 | USD | Natural Gas Storage | -58B |
Technical Outlook and Review
DXY:
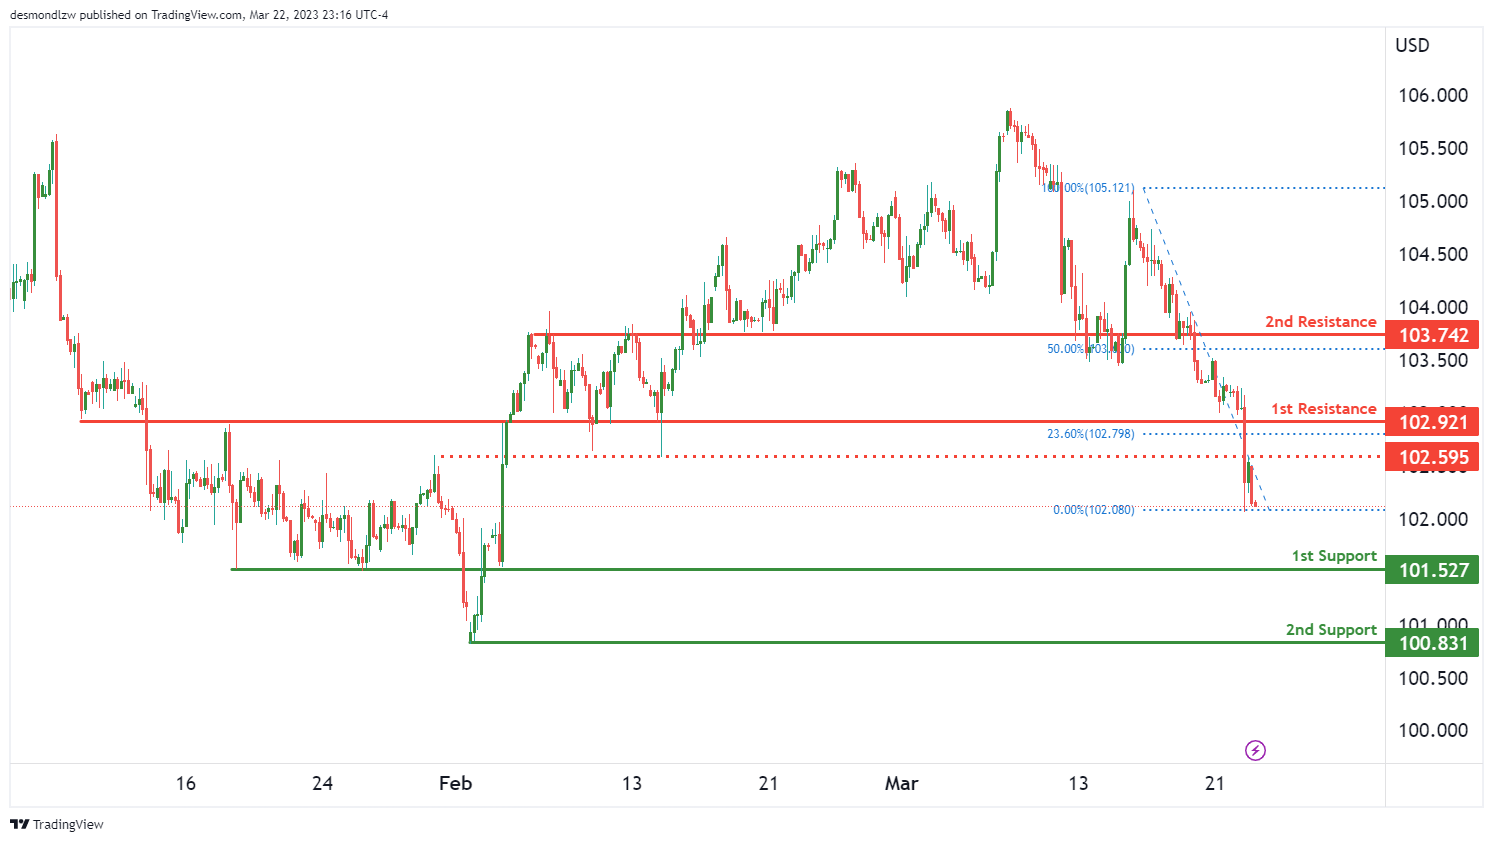
Looking at the DXY chart, the overall momentum of the chart is bearish, indicating a potential bearish continuation in the short term. Price is currently at a level where it could potentially drop to the 1st support at 101.52. This support level is an overlap support, which means that it has been tested several times in the past and has shown to be a strong level of support.
If prices break below the 1st support, it could drop further towards the 2nd support at 100.83, which is a swing low support level. On the other hand, if prices manage to rebound from the current level, it could potentially move up towards the 1st resistance at 102.92. This resistance level is an overlap resistance and has a 23.60% Fibonacci retracement lining up with it, making it a strong level of resistance.
If prices break above the 1st resistance, it could potentially continue to move up towards the 2nd resistance at 103.74. This level is a swing high resistance and coincides with a 50% Fibonacci retracement level, providing additional resistance. It’s worth noting that there is also an intermediate resistance at 102.59 that could potentially halt the bullish momentum.
Overall, the DXY chart shows a bearish bias, with potential for prices to drop towards the 1st support at 101.52. However, a break above the 1st resistance at 102.92 could potentially trigger a bullish reversal towards the 2nd resistance at 103.74.
EUR/USD:
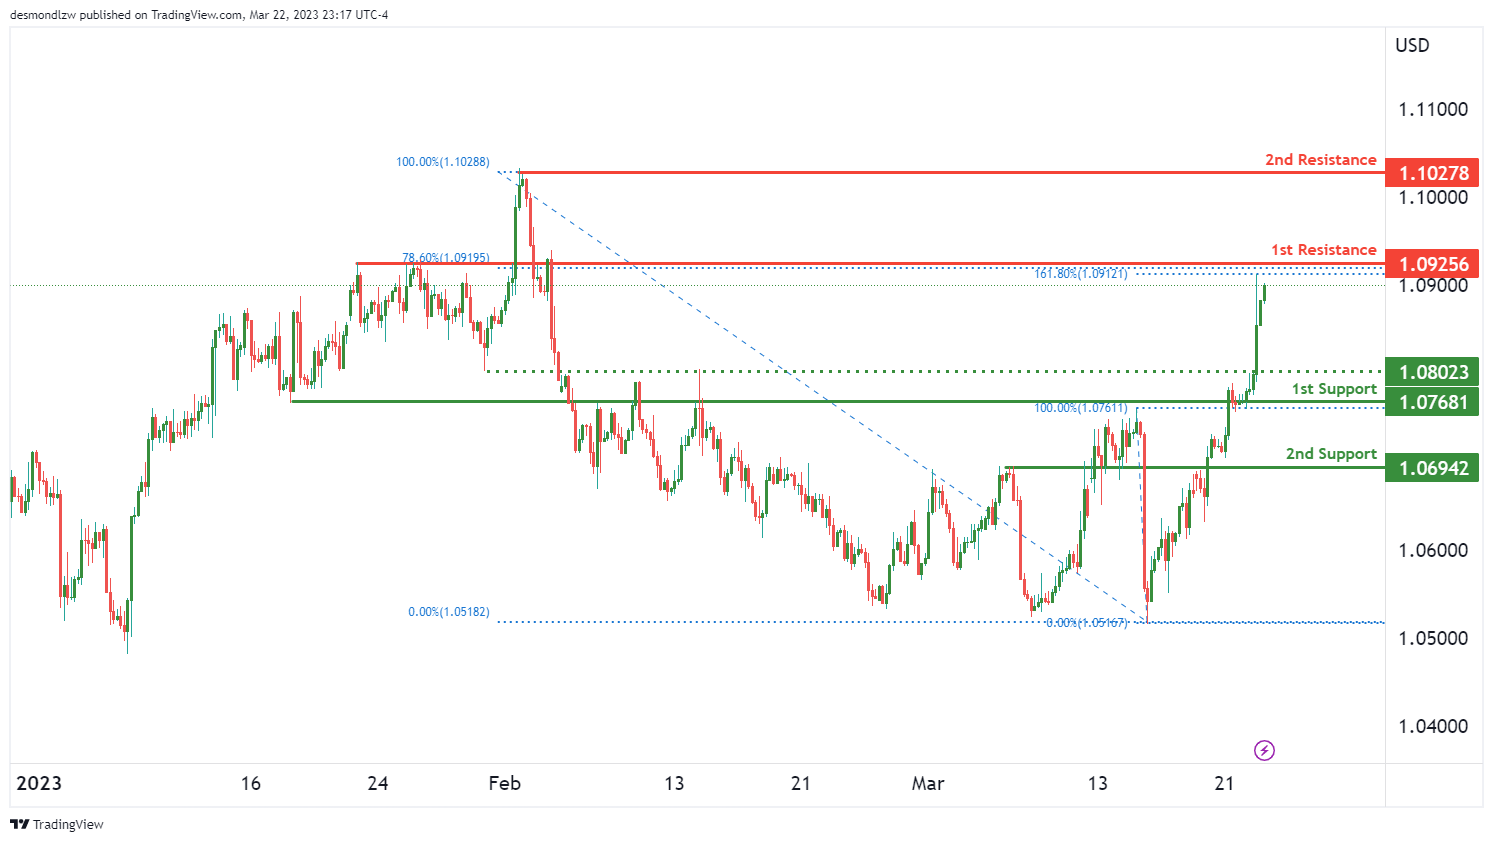
Looking at the EURUSD chart, the overall momentum of the chart is bearish. However, in the short term, the price could potentially rise towards the 1st resistance level at 1.093 before reversing off it and dropping towards the 1st support level at 1.077.
The 1st support level at 1.077 is a strong level of support, being an overlap support. The 2nd support level at 1.069 is also an overlap support, making it another strong level of support.
On the resistance side, the 1st resistance level at 1.093 is also an overlap level and coincides with a 161.80% Fibonacci Extension, making it a significant level of resistance. The 2nd resistance level at 1.103 is a swing high resistance level and may provide additional resistance if prices break through the 1st resistance level.
There is also an intermediate support level at 1.080, which is between where price is currently and the 1st support level. If price were to break this intermediate support, it could trigger a stronger bearish acceleration towards our 1st support.
It is worth noting that the overall momentum of the chart is bearish, with prices expected to drop towards the 1st support level in the longer term.
GBP/USD:
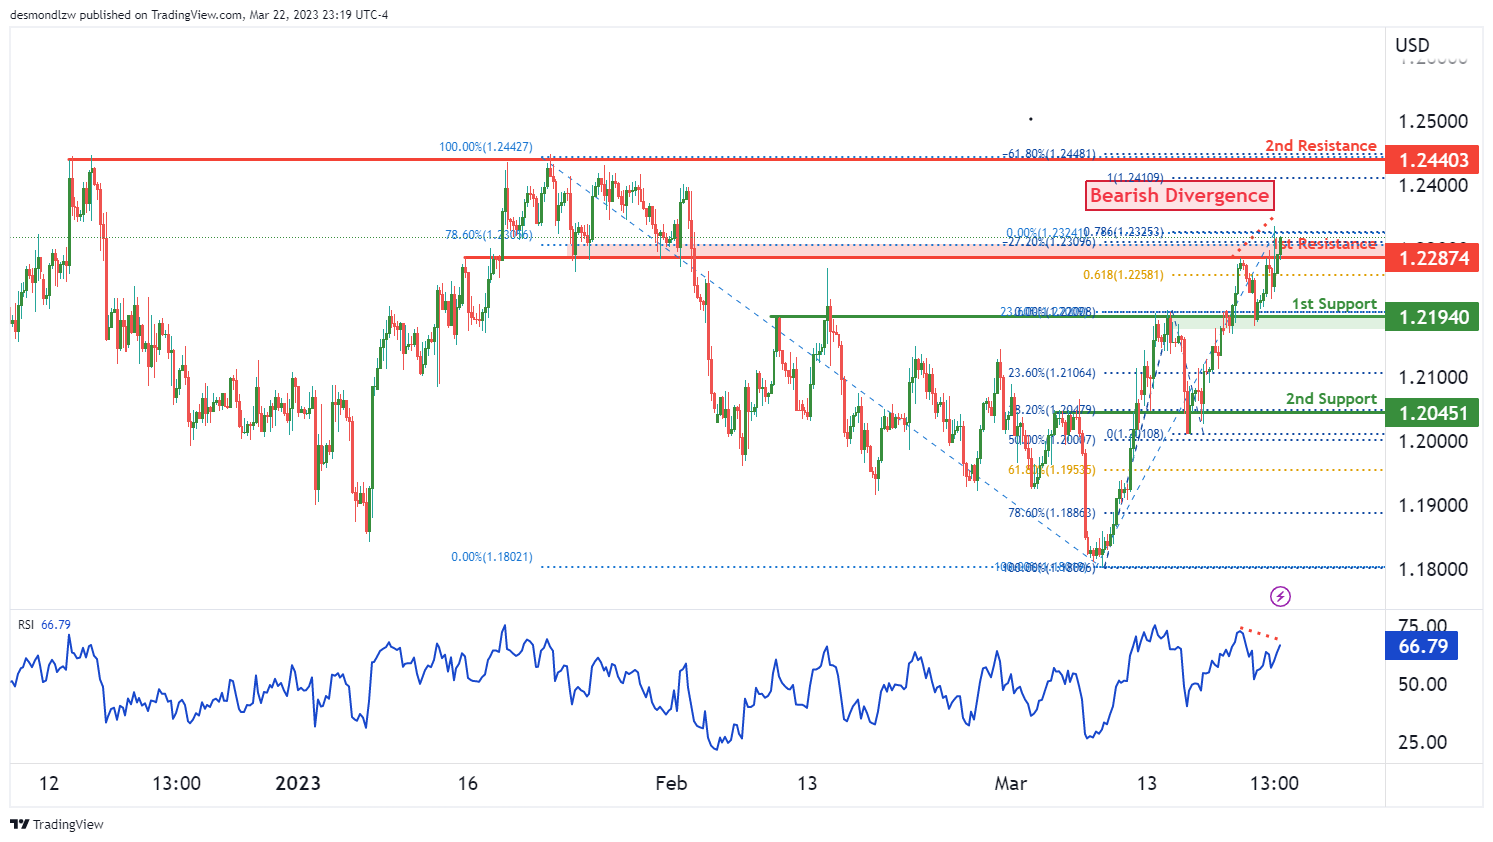
the GBP/USD chart, the overall momentum is bearish. There’s a potential for price to have a bearish reaction off the 1st resistance level and drop to the 1st support level. The 1st support level at 1.2194 is an overlap support and has a 23.60% Fibonacci retracement lining up with it, making it a strong support level. The 2nd support level at 1.2045 is also an overlap support and has a 38.20% Fibonacci retracement lining up with it, further adding to its strength.
On the resistance side, the 1st resistance level at 1.2287 is an overlap resistance and has a 78.60% Fibonacci retracement lining up with it, making it a strong resistance level. The 2nd resistance level at 1.2440 is a swing high resistance and has a 161.80% Fibonacci extension lining up with it, making it an even stronger resistance level.
Additionally, the RSI is displaying bearish divergence versus price, which suggests that a reversal might occur soon. Overall, the bearish momentum of the chart, combined with the strong support and resistance levels, suggests that we could potentially see a bearish reaction off the 1st resistance level and a drop towards the 1st support level.
USD/CHF:
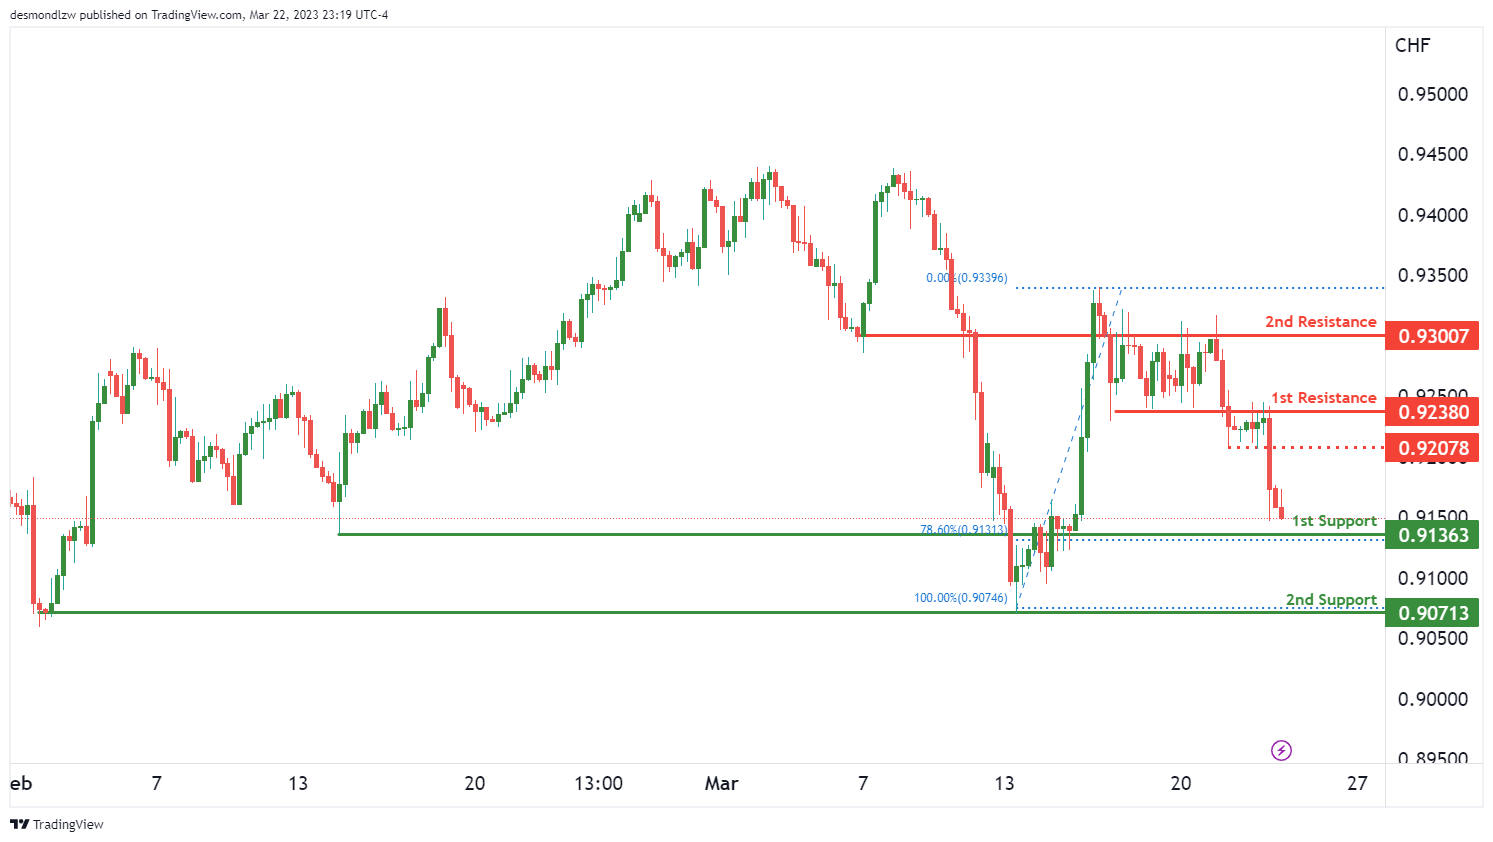
Looking at the USD/CHF chart, the overall momentum is currently bearish. However, price could potentially drop further to the 1st support level at 0.9136 in the short term before bouncing from there and rising to the 1st resistance level at 0.9238.
The 1st support level is a good level as it is an overlap support and also has a 78.60% Fibonacci retracement lining up with it. Additionally, the 2nd support level at 0.9071 is a multi-swing low support, making it another good level of support.
On the resistance side, the 1st resistance level at 0.9238 is an overlap resistance. The 2nd resistance level at 0.9300 is another overlap resistance. Finally, there is an intermediate resistance level at 0.9207, which is between the current price and the 1st resistance.
USD/JPY:
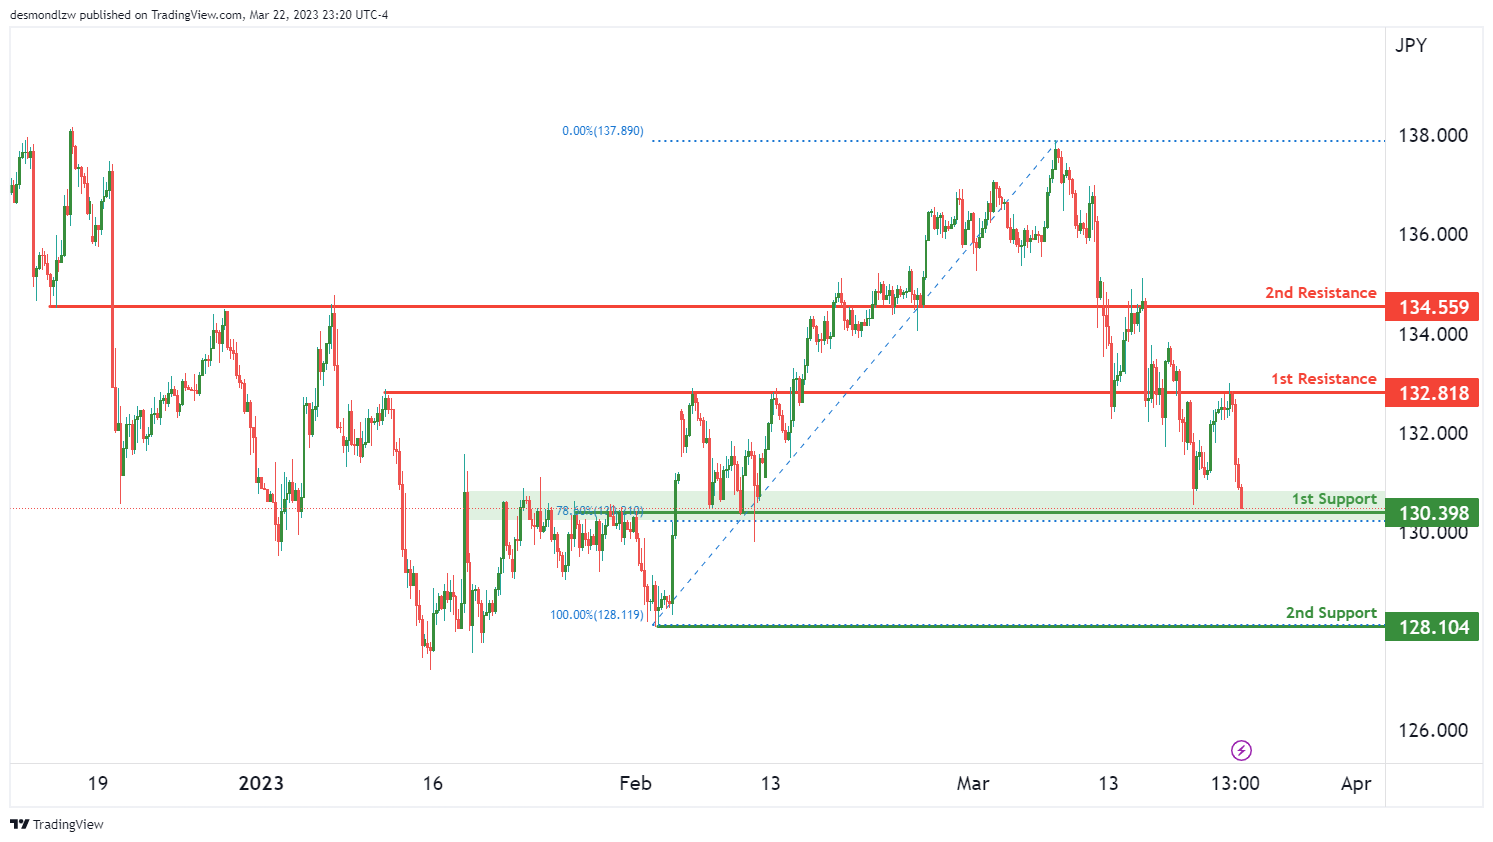
The USD/JPY chart is showing overall bullish momentum, with potential for a bullish bounce off the 1st support level towards the 1st resistance. The 1st support level is located at 130.39 and is an overlap support level, with a 78.60% Fibonacci retracement lining up with it. The 2nd support level is at 128.10 and is a multi-swing low support. On the resistance side, the 1st resistance level is at 132.81 and is an overlap resistance level. The 2nd resistance level is at 134.55 and is also an overlap resistance level.
Traders should keep an eye on the price action around these levels, as a bounce from the 1st support level towards the 1st resistance level could provide a bullish opportunity. However, a break below the 1st support level could signal a potential change in momentum towards a bearish direction.
AUD/USD:
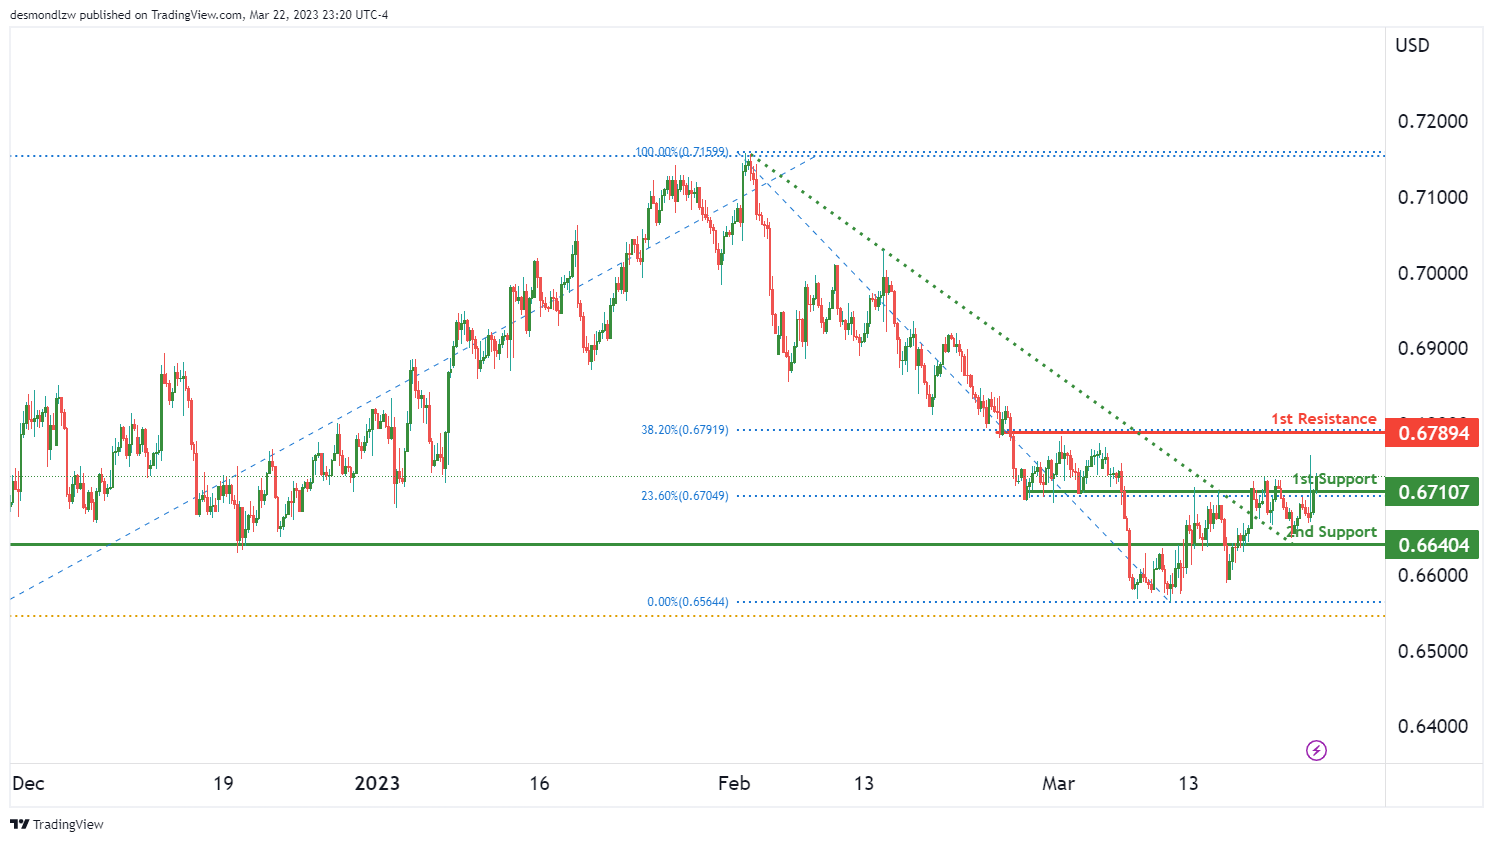
The AUD/USD chart is showing bullish momentum, with the potential for price to continue rising towards the first resistance level. The first support level is at 0.6710, which is an overlap support and also coincides with a 23.60% Fibonacci retracement. If price were to bounce off this level, it could potentially rise towards the first resistance level at 0.6789, which is a pullback resistance.
There is a second support level at 0.6640, which is also an overlap support. This level could potentially provide additional support if price were to drop below the first support.
Overall, the bullish momentum of the chart suggests that there is a higher probability for prices to continue rising towards the first resistance level.
NZD/USD:
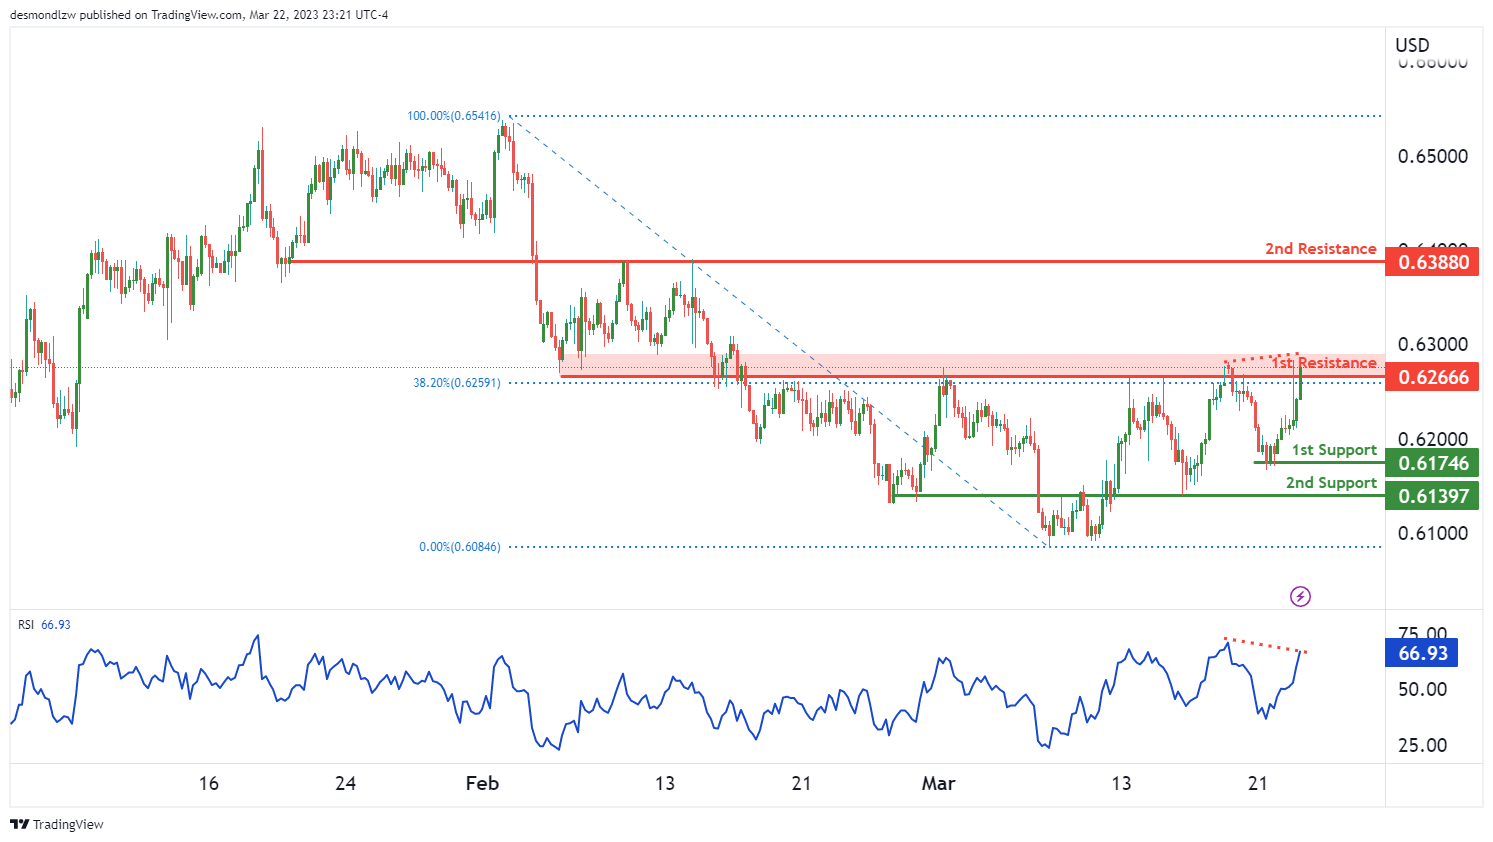
The NZD/USD chart has a bearish overall momentum, which means prices are expected to move lower. The current price movement could potentially lead to a bearish reaction off the 1st resistance level, which is at 0.6266. This level is a strong overlap resistance and also has a 38.20% Fibonacci retracement lining up with it. A drop towards the 1st support at 0.6174 could be seen if the resistance level holds.
If the 1st support level fails to hold, the next level to watch is the 2nd support at 0.6139, which is also an overlap support. On the other hand, if the price manages to break above the 1st resistance, the next level to watch is the 2nd resistance at 0.6388, which is also an overlap resistance.
It’s important to note that the RSI is displaying bearish divergence versus price, which suggests that a reversal might occur soon. This means that traders need to be cautious and consider the possibility of a trend reversal
USD/CAD:
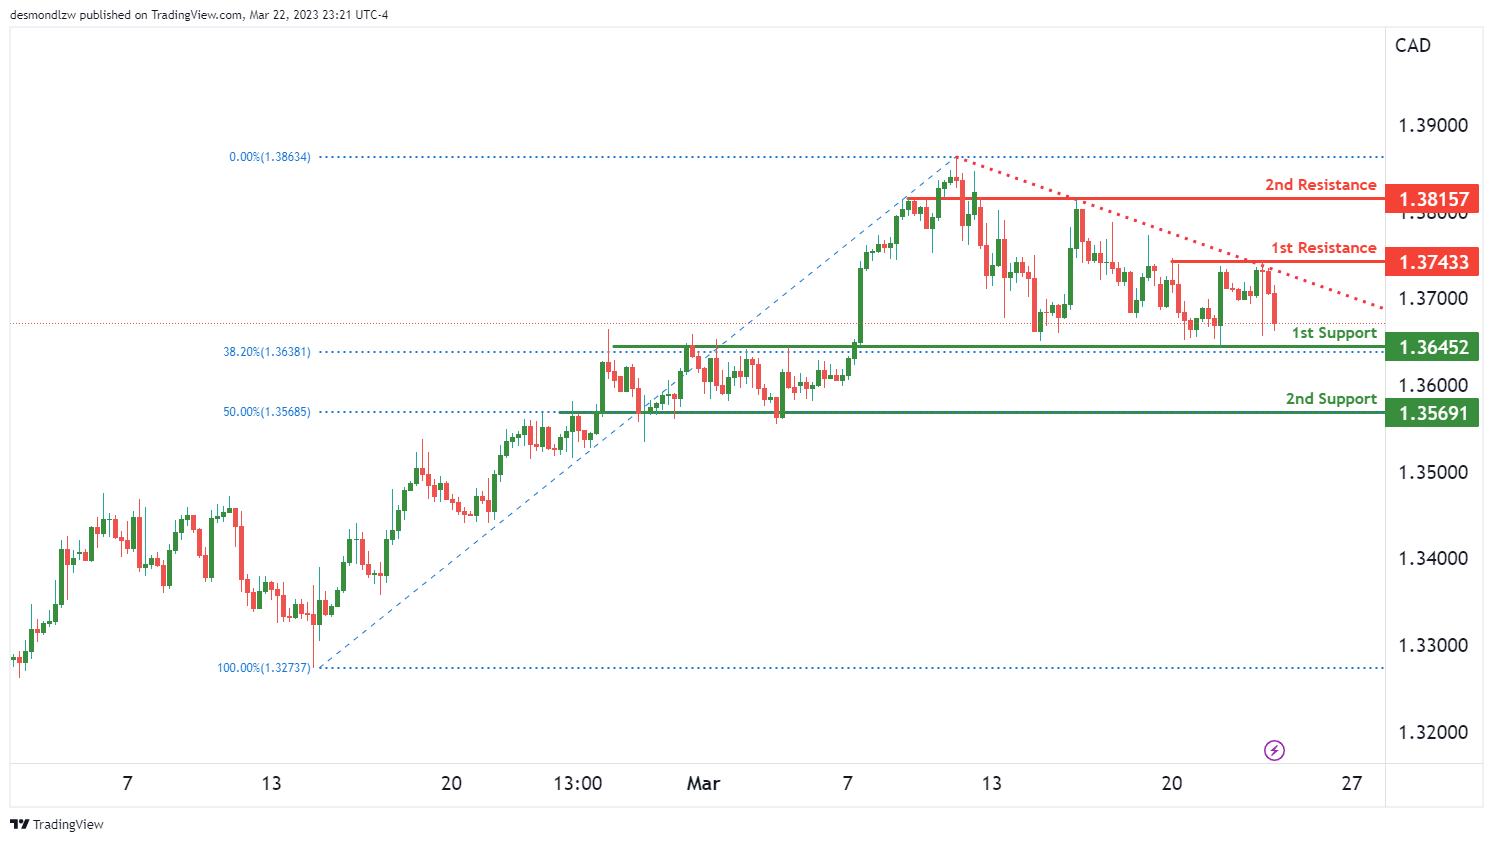
The USD/CAD currency pair has been showing bearish momentum on the charts. Price is currently below a major descending trend line, indicating that a continuation of the bearish trend is likely. There are two potential support levels that price could reach, with the first being at 1.3645. This level is an overlap support and is also located at the 38.20% Fibonacci retracement level, making it a strong support level. The second support level is at 1.3569 and is an overlap support as well as being located at the 50% Fibonacci retracement level.
On the other hand, there are two potential resistance levels that price could encounter. The first is at 1.3743 and is a multi-swing high resistance level. The second resistance level is at 1.3815 and is an overlap resistance level.
DJ30:
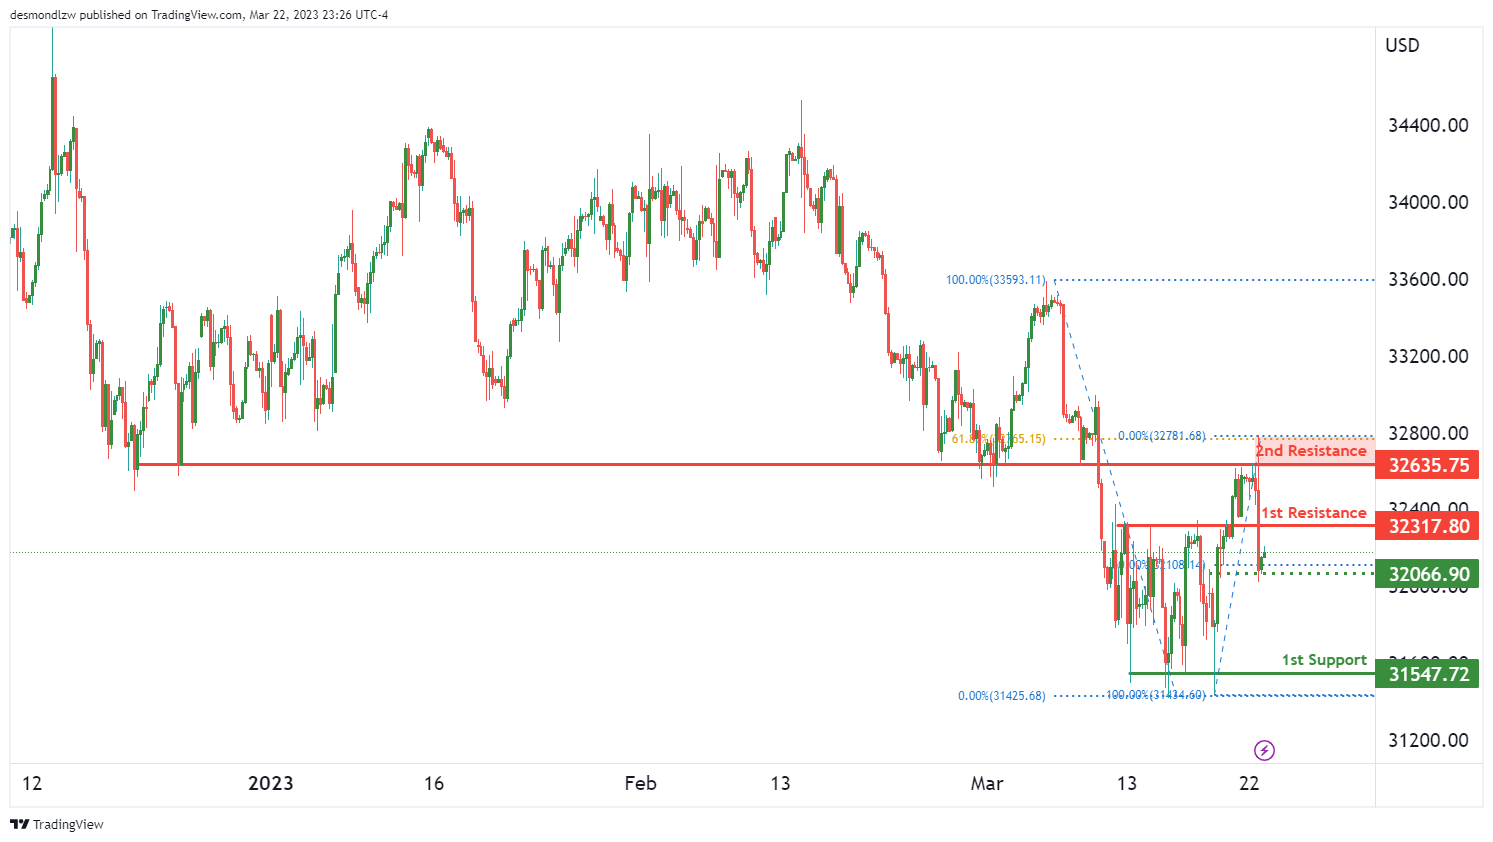
The DJ30 is currently exhibiting bearish momentum on the chart, and there could be a potential continuation of this bearish trend towards the first support level. The first support level is located at 31547 and is considered a multi-swing low support, making it a good level to watch.
The intermediate support level is located at 32066, which is a swing low support and a 50% Fibonacci retracement level. This level could also act as a support for the price, should it drop further.
On the other hand, there are two resistance levels to watch out for, the first being at 32317. This level is considered an overlap resistance and could act as a potential resistance for any bullish move. The second resistance level is at 32635, which is also an overlap resistance and coincides with the 61.80% Fibonacci retracement level.
GER30:
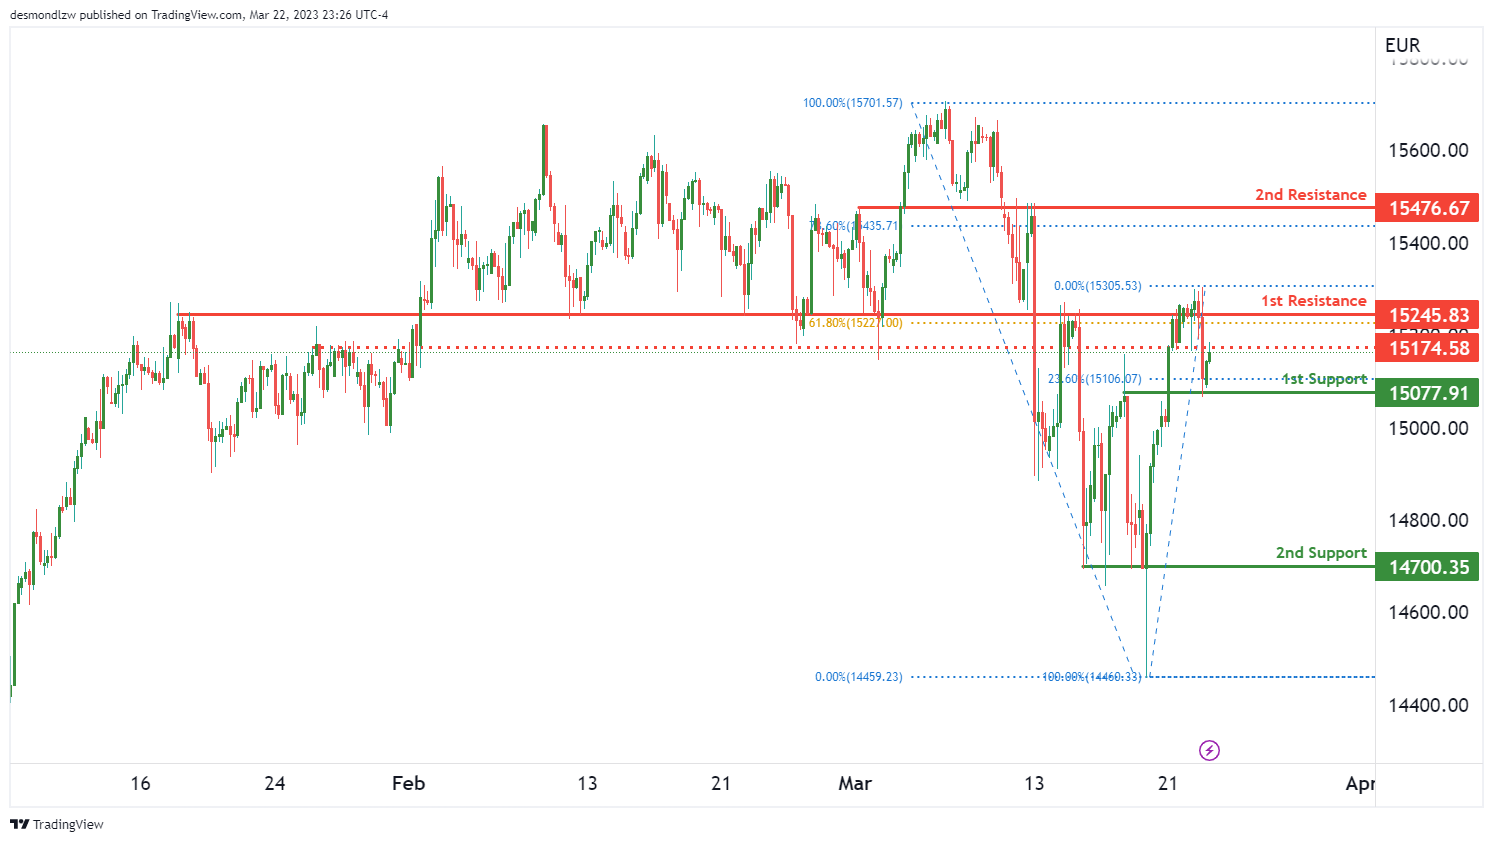
GER30 is currently exhibiting a bullish momentum as price is above the Ichimoku cloud and an ascending support line. There is a potential for a bullish continuation towards the 1st resistance at 15245. The 1st support at 15077 is a strong overlap support level with a 23.60% Fibonacci retracement, which adds to the strength of the support level. Another support level to watch out for is the intermediate support at 14700, which has acted as a multi-swing low support level in the past.
On the resistance side, the 1st resistance level is a strong overlap resistance with a 61.80% Fibonacci retracement. A breakout from this level could push the price towards the 2nd resistance level at 15476, which is also an overlap resistance with a 78.60% Fibonacci retracement. There is also an intermediate resistance level at 15174 that price could encounter on the way up. The overall bias of the GER30 chart is bullish, which suggests that price could rise from support to resistance.
BTC/USD:
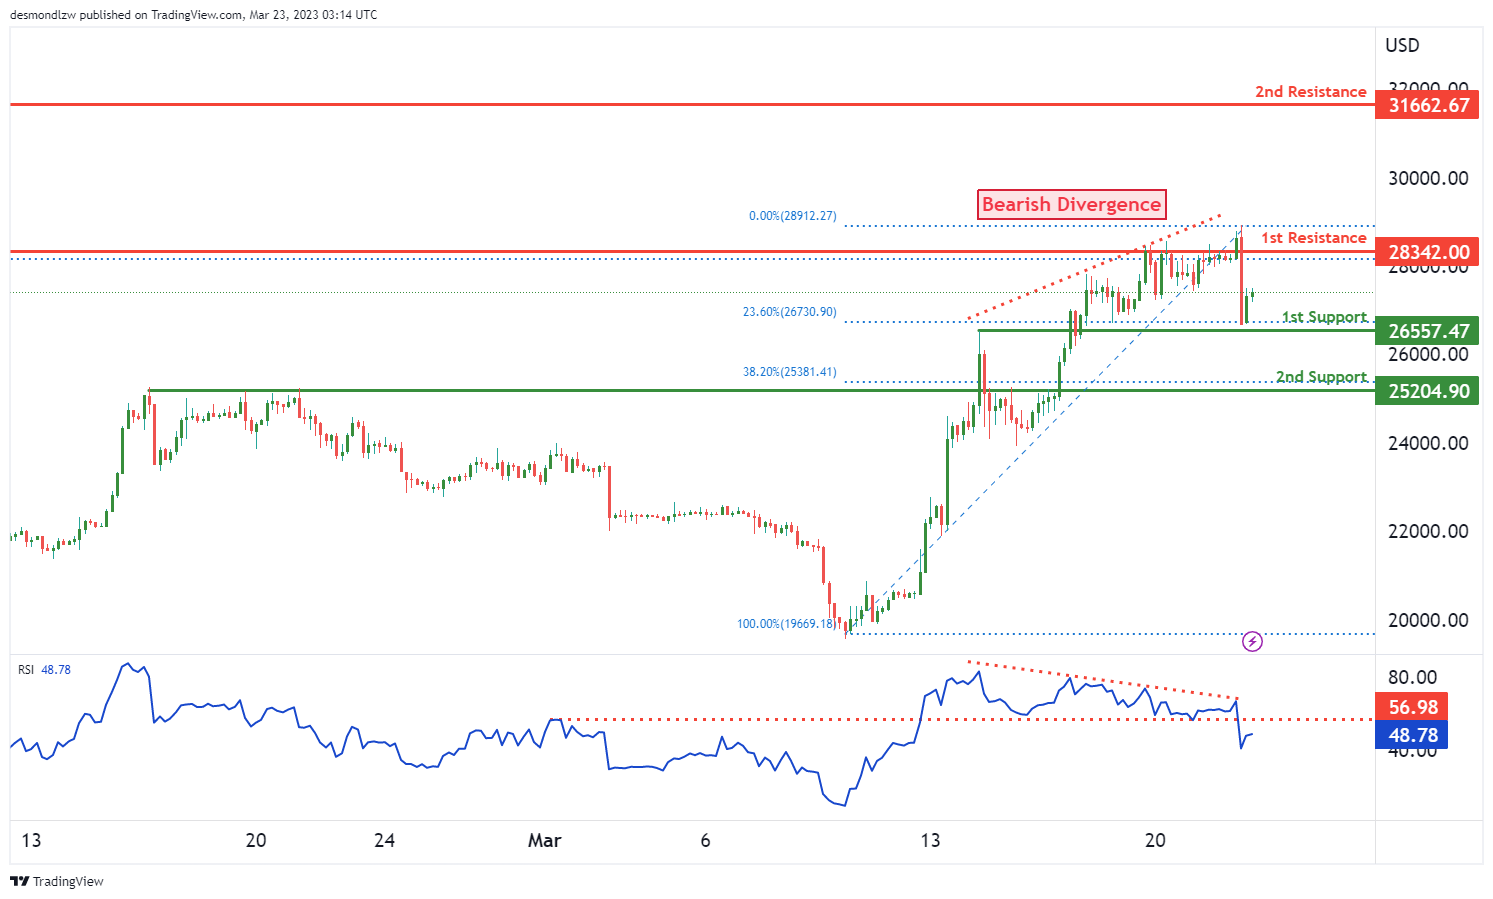
The overall momentum of the BTC/USD chart is bearish, with the price potentially making a bearish break off the first support level and dropping towards the second support level. It is important to note that the price is currently below the Ichimoku cloud, which suggests bearish momentum.
The first support level is at 26557, and it is a strong overlap support with a 23.60% Fibonacci retracement lining up with it. However, if the price breaks below this level, it could drop towards the second support level at 25204, which is another overlap support with a 38.20% Fibonacci retracement.
On the resistance side, the first resistance level is at 28342, which is a multi-swing high resistance. If the price were to rise and break above this level, it could potentially reach the second resistance level at 31662, which is a swing high resistance.
US500
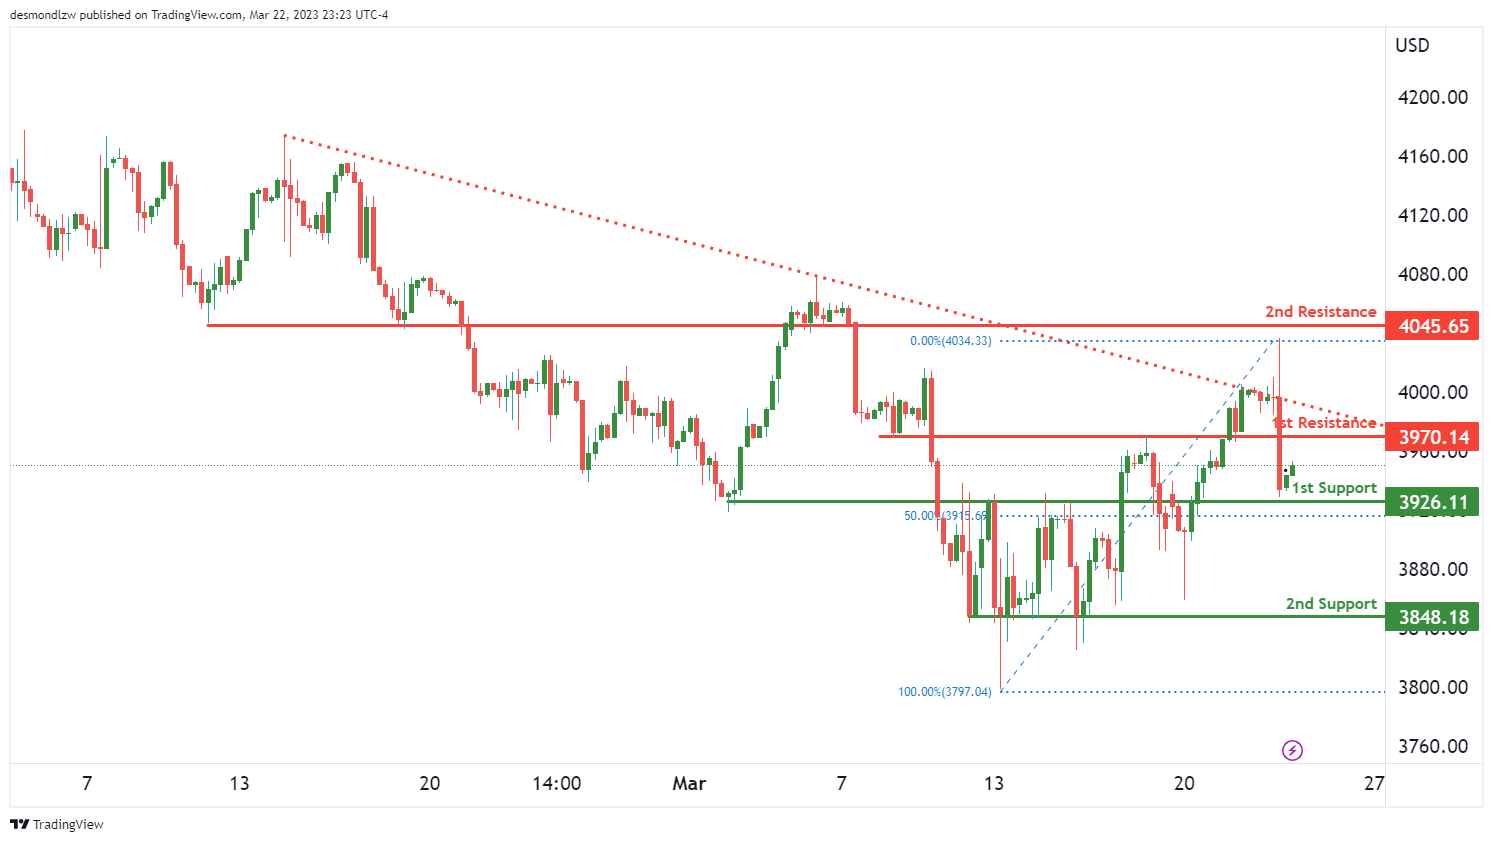
The US500 chart is currently showing bearish momentum, as price is below a major descending trend line. As such, a potential bearish break off the 1st support level may occur, leading to a drop towards the 2nd support level.
The 1st support level is located at 3926 and is an overlap support with the 50% Fibonacci retracement. If price were to break this support level, it could potentially drop towards the 2nd support at 3848, which is a multi-swing low support.
On the resistance side, the 1st resistance level is at 3970 and is an overlap resistance. If price were to break this resistance level, it could potentially rise towards the 2nd resistance at 4046, which is also an overlap resistance.
Overall, the chart is currently showing a bearish bias and the descending trend line is suggesting that bearish momentum is still present. If the 1st support level is broken, it may trigger further selling pressure towards the 2nd support level
ETH/USD:
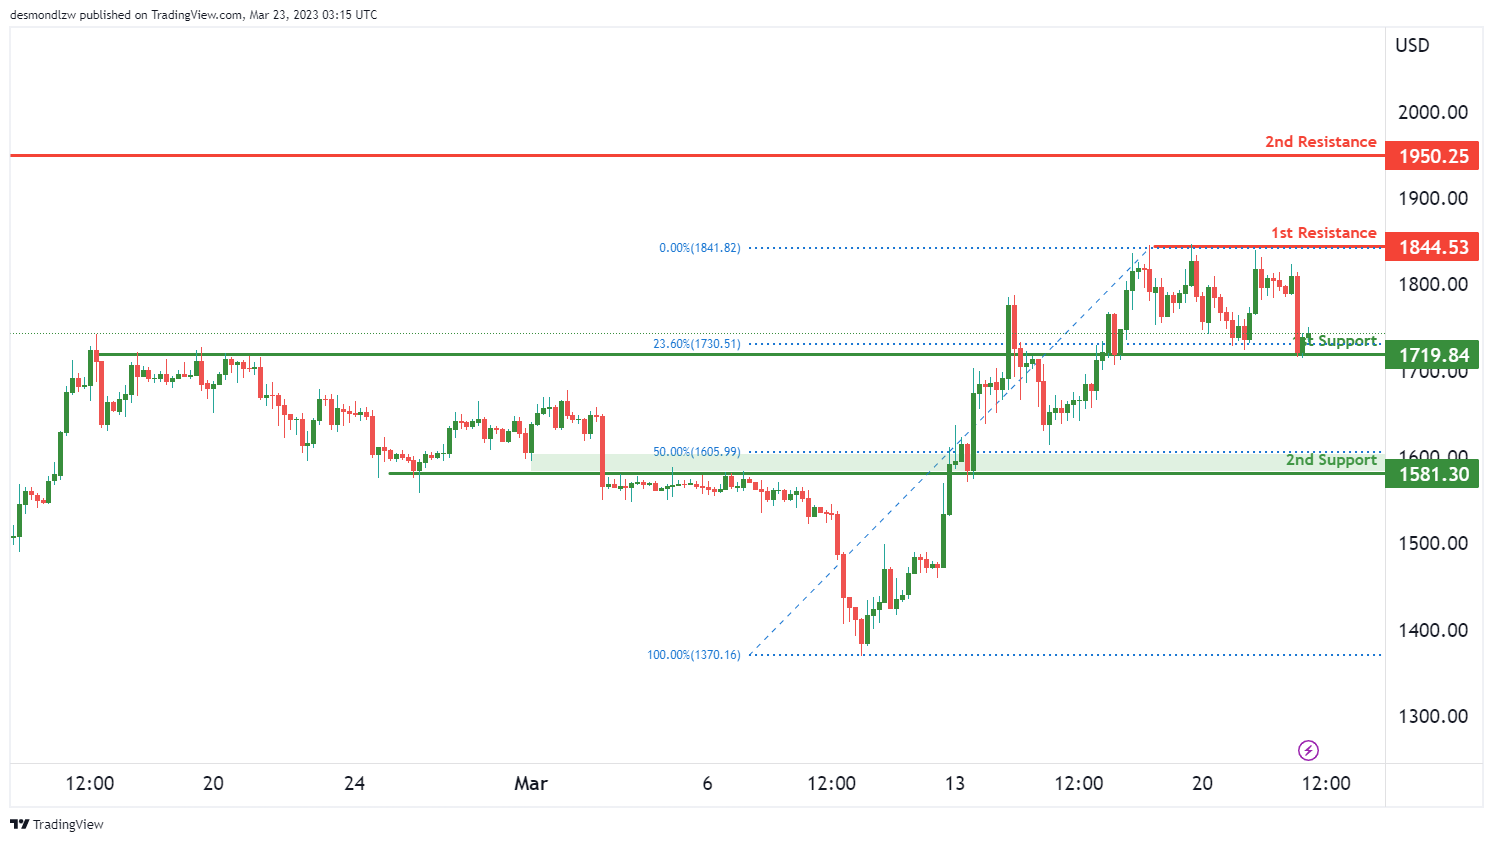
Based on the overall bullish momentum of the ETH/USD chart, the price could potentially bounce off the first support level at 1719.84, which is a strong overlap support level and is also in line with a 23.6% Fibonacci retracement. If the price successfully rebounds from this support level, it could potentially head towards the first resistance level at 1844.53, which is a multi-swing high resistance level.
It’s also worth noting that there is a second support level at 1518.30, which is also a strong overlap support level and coincides with a 50% Fibonacci retracement.
In the event of a strong bullish breakout, the price may potentially reach the second resistance level at 1950.25, which is a swing high resistance level.
WTI/USD:
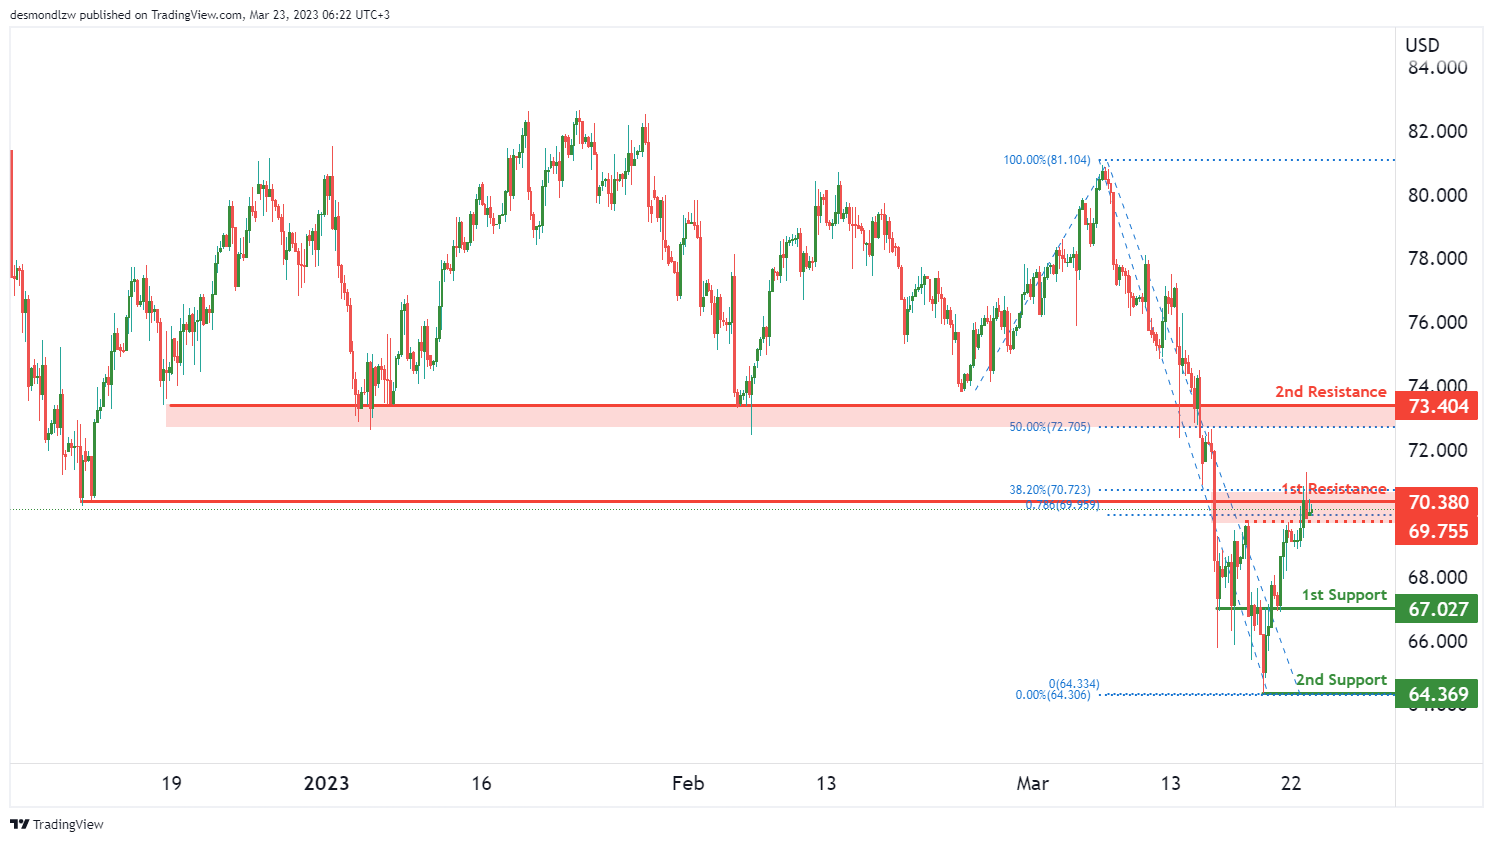
The overall momentum of the WTI chart is bearish. The price could potentially make a bearish reaction off the first resistance and drop to the first support. The first support level is at 67.02 and it’s a good level because it’s an overlap support. The second support level is at 64.36 and it’s a swing low support.
On the other hand, the first resistance level is at 70.38 and it’s a pullback resistance that lines up with a 38.20% Fibonacci retracement. If the price were to break above this level, it could potentially rise towards the second resistance level at 73.40, which is a pullback resistance and coincides with a 50% Fibonacci retracement.
It’s worth noting that the current momentum of the chart is bearish, and the price is expected to react bearishly off the first resistance level and drop towards the first support level. However, if the price were to break above the first resistance level, it could potentially trigger a bullish reversal towards the second resistance level.
XAU/USD (GOLD):
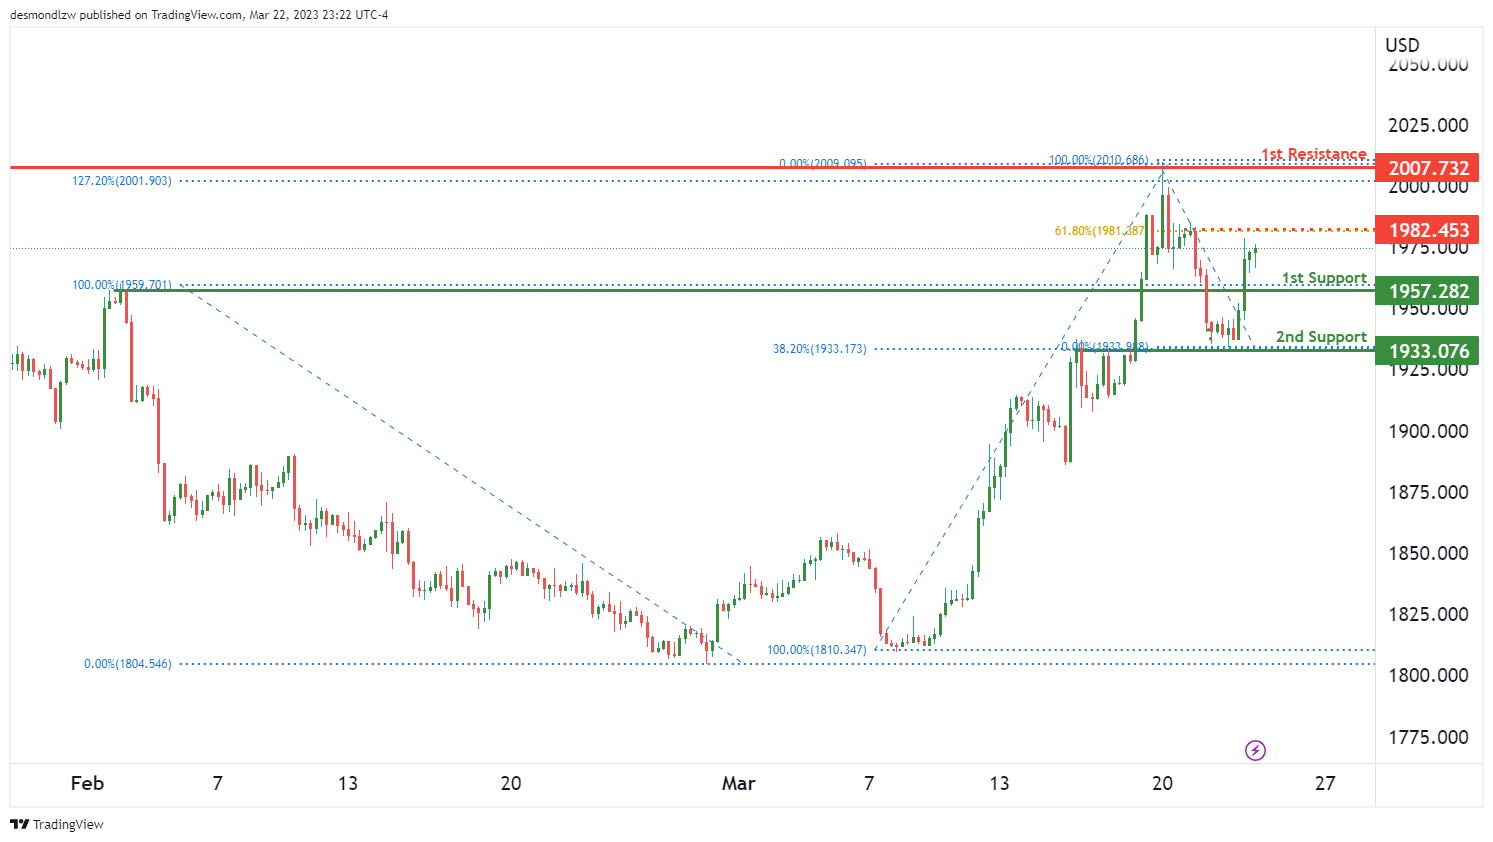
The XAU/USD chart shows a bullish momentum, and price could potentially continue to rise towards the 1st resistance level at 2007.00, which is a swing high resistance level.
The 1st support level at 1957.00 is a strong overlap support level, which could provide a bounce if price were to drop. The 2nd support level at 1933.00 coincides with the 38.20% Fibonacci retracement level, which could act as another support level.
If price were to break through the 1st resistance level, it could potentially continue to rise towards the intermediate resistance level at 1982.00, which is also an overlap resistance level and coincides with the 61.80% Fibonacci retracement level.
GBP/CHF extending range trading ahead of BoE and SNB
BoE and SNB are both expected to raise interest rates today. A 25bps hike by BoE to 4.25% is widely anticipated, though the case for a subsequent pause has been shaken by the reacceleration of consumer inflation in February. The Monetary Policy Committee is known for its divided outlook on the amount of tightening needed, and today's voting should continue to reflect this pattern.
An explicit indication of a pause could put downward pressure on Sterling, but such a signal is unlikely to emerge. Instead, BoE is more likely to adopt a non-committal stance, waiting for incoming data and the next economic projections in May before making a firm judgment.
Concurrently, SNB is expected to hike by 50bps to 1.50%. Market expectations suggest a possible 25bps hike in June to a terminal rate of 1.75%, followed by a pause. However, the SNB's comments and projections could reshape these expectations.
Here are some previews for BoE and SNB:
- UK Inflation Will Strengthen the Hawks
- BoE Rate Decision: One Last Hike Before Hitting Pause?
- BoE Preview: 25 bps Hike and Done?
- Bank of England Preview – Final Hike in Store
- Bank of England & Swiss National Bank Both Set to Hike
- Will the SNB Roil Markets With a Hike Amid Credit Suisse Crisis?
GBP/CHF is still bounded in medium term sideway consolidation from 1.1574. Outlook is kept bullish as the crosses quickly recovered after breaching 38.2% retracement of 1.0183 to 1.1574 at 1.1043 briefly. A break through 1.1574 resistance to resume the rise form 1.0184 is expected. But that might not happen today, unless there is some drastic surprise from BoE or SNB.
S&P 500 down, reacted more to Yellen than Powell?
US markets experienced a complex development overnight due to simultaneous reactions to two events. Initially, the markets responded bullishly to the Fed's less hawkish than expected rate hike and press conference. However, just an hour before the close, sellers jumped in, and the three major indexes closed -1.6% lower.
The selloff might be more attributed to Treasury Secretary Janet Yellen's comments at a Senate committee. She explicitly stated, "I have not considered or discussed anything having to do with blanket insurance or guarantees of deposits."
Yellen further elaborated, "when a bank failure is deemed to create systemic risk, which I think of as the risk of a contagious bank run...we are likely to invoke the systemic risk exception, which permits the FDIC to protect all depositors, and that would be a case-by-case determination."
Meanwhile, Asian markets have remained sluggish and mixed today, without any apparent signs of bearishness carried over. It may take some more time to understand the unfolding situation fully.
Technically, near term outlook in S&P 500 isn't too bearish yet given it's holding inside a near term channel. However, break of 3901.27 support will argue that the corrective rebound from 3808.85 has completed at 4039.49, after hitting falling trend line resistance. Deeper selloff would then follow through 3808.86 to resume whole decline from 4195.44.
Fed softened hawkish tone, but not dovish
In light of the Fed announcement and press conference overnight, it appears that another 25bps rate hike is likely in May, followed by a prolonged pause with no rate cut expected until next year. The overall picture remains hawkish, albeit not as much as after Fed Chair Jerome Powell's earlier testimony this month.
As anticipated, Fed raised interest rates by 25bps to 4.75-5.00%. While the tightening bias was maintained, the statement softened its tone, stating, "some additional policy firming may be appropriate." Despite recent market turmoil, median projections still indicated an interest rate peak of 5.1% this year, suggesting one more 25bps hike before pausing until next year. The median projection for 2024 interest rate increased from 4.1% to 4.3%, signaling a slower path of rate cuts.
During the post-meeting press conference, Powell acknowledged that "financial conditions seem to have tightened" recently, adding that if the situation persists, it could "easily have a significant macroeconomic effect, and we would factor that into our policy decisions." While he admitted that a pause was considered during the meeting, he emphasized that a rate cut this year was "not our baseline expectation," stating, "the key is we have to have policies tight enough to bring inflation down to 2%."
Suggested readings on Fed:
- FOMC's Fight Against Inflation Finely Balanced
- FOMC Hikes Rates, But End of Tightening Cycle Coming Into View
- Suderman Says: Rates Up as Expected, But Peak in Sight?
- FOMC Hikes Policy Rate by 25 Basis Points, Cautions on Bank Stress
- Fed hikes 25 bps, terminal rate forecast unchanged at 5.1%
- (FED) Federal Reserve Issues FOMC Statement