Sample Category Title
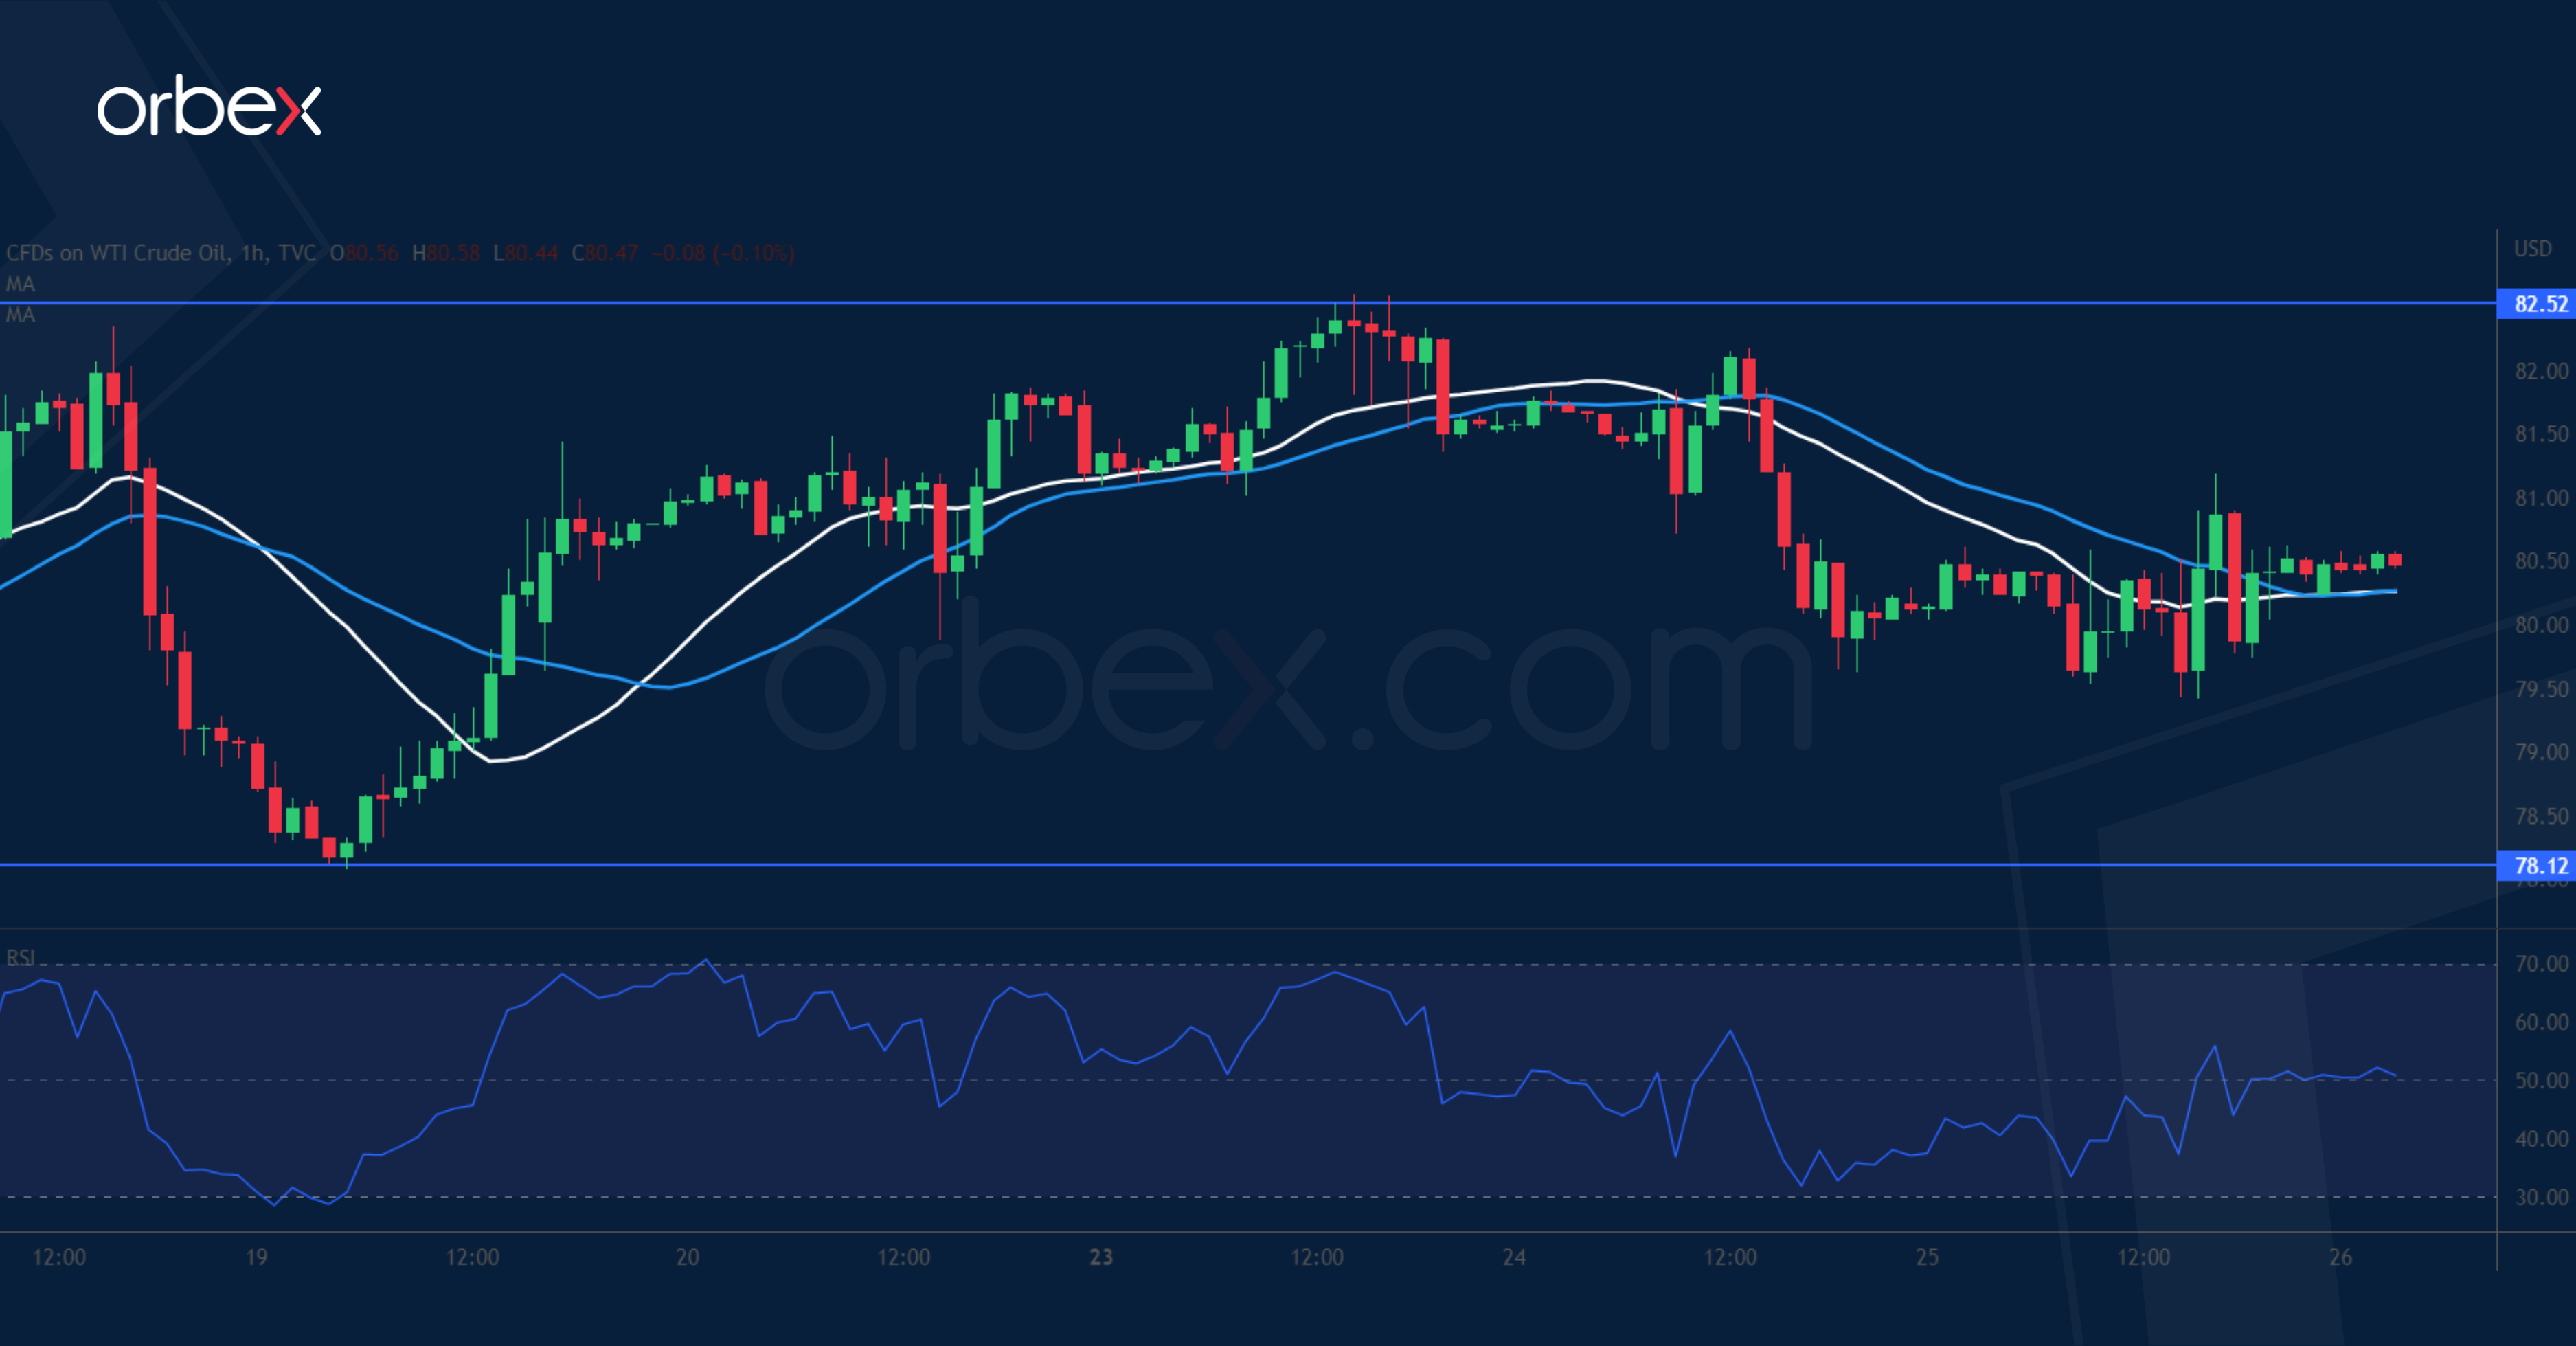
US Oil Consolidates Gains
WTI crude treads water as US crude inventories show a smaller buildup. The price action is grinding last December’s high of 82.50 as its breach might trigger an extended rally in the medium-term. Instead, a drop below the immediate support at 80.30 has put the bulls on the defensive. The previous swing low at 82.50 sits on the 20-day moving average and is a key level to keep the price afloat. A bearish breakout would shake out recent buyers and send the price to the psychological level of 75.00.
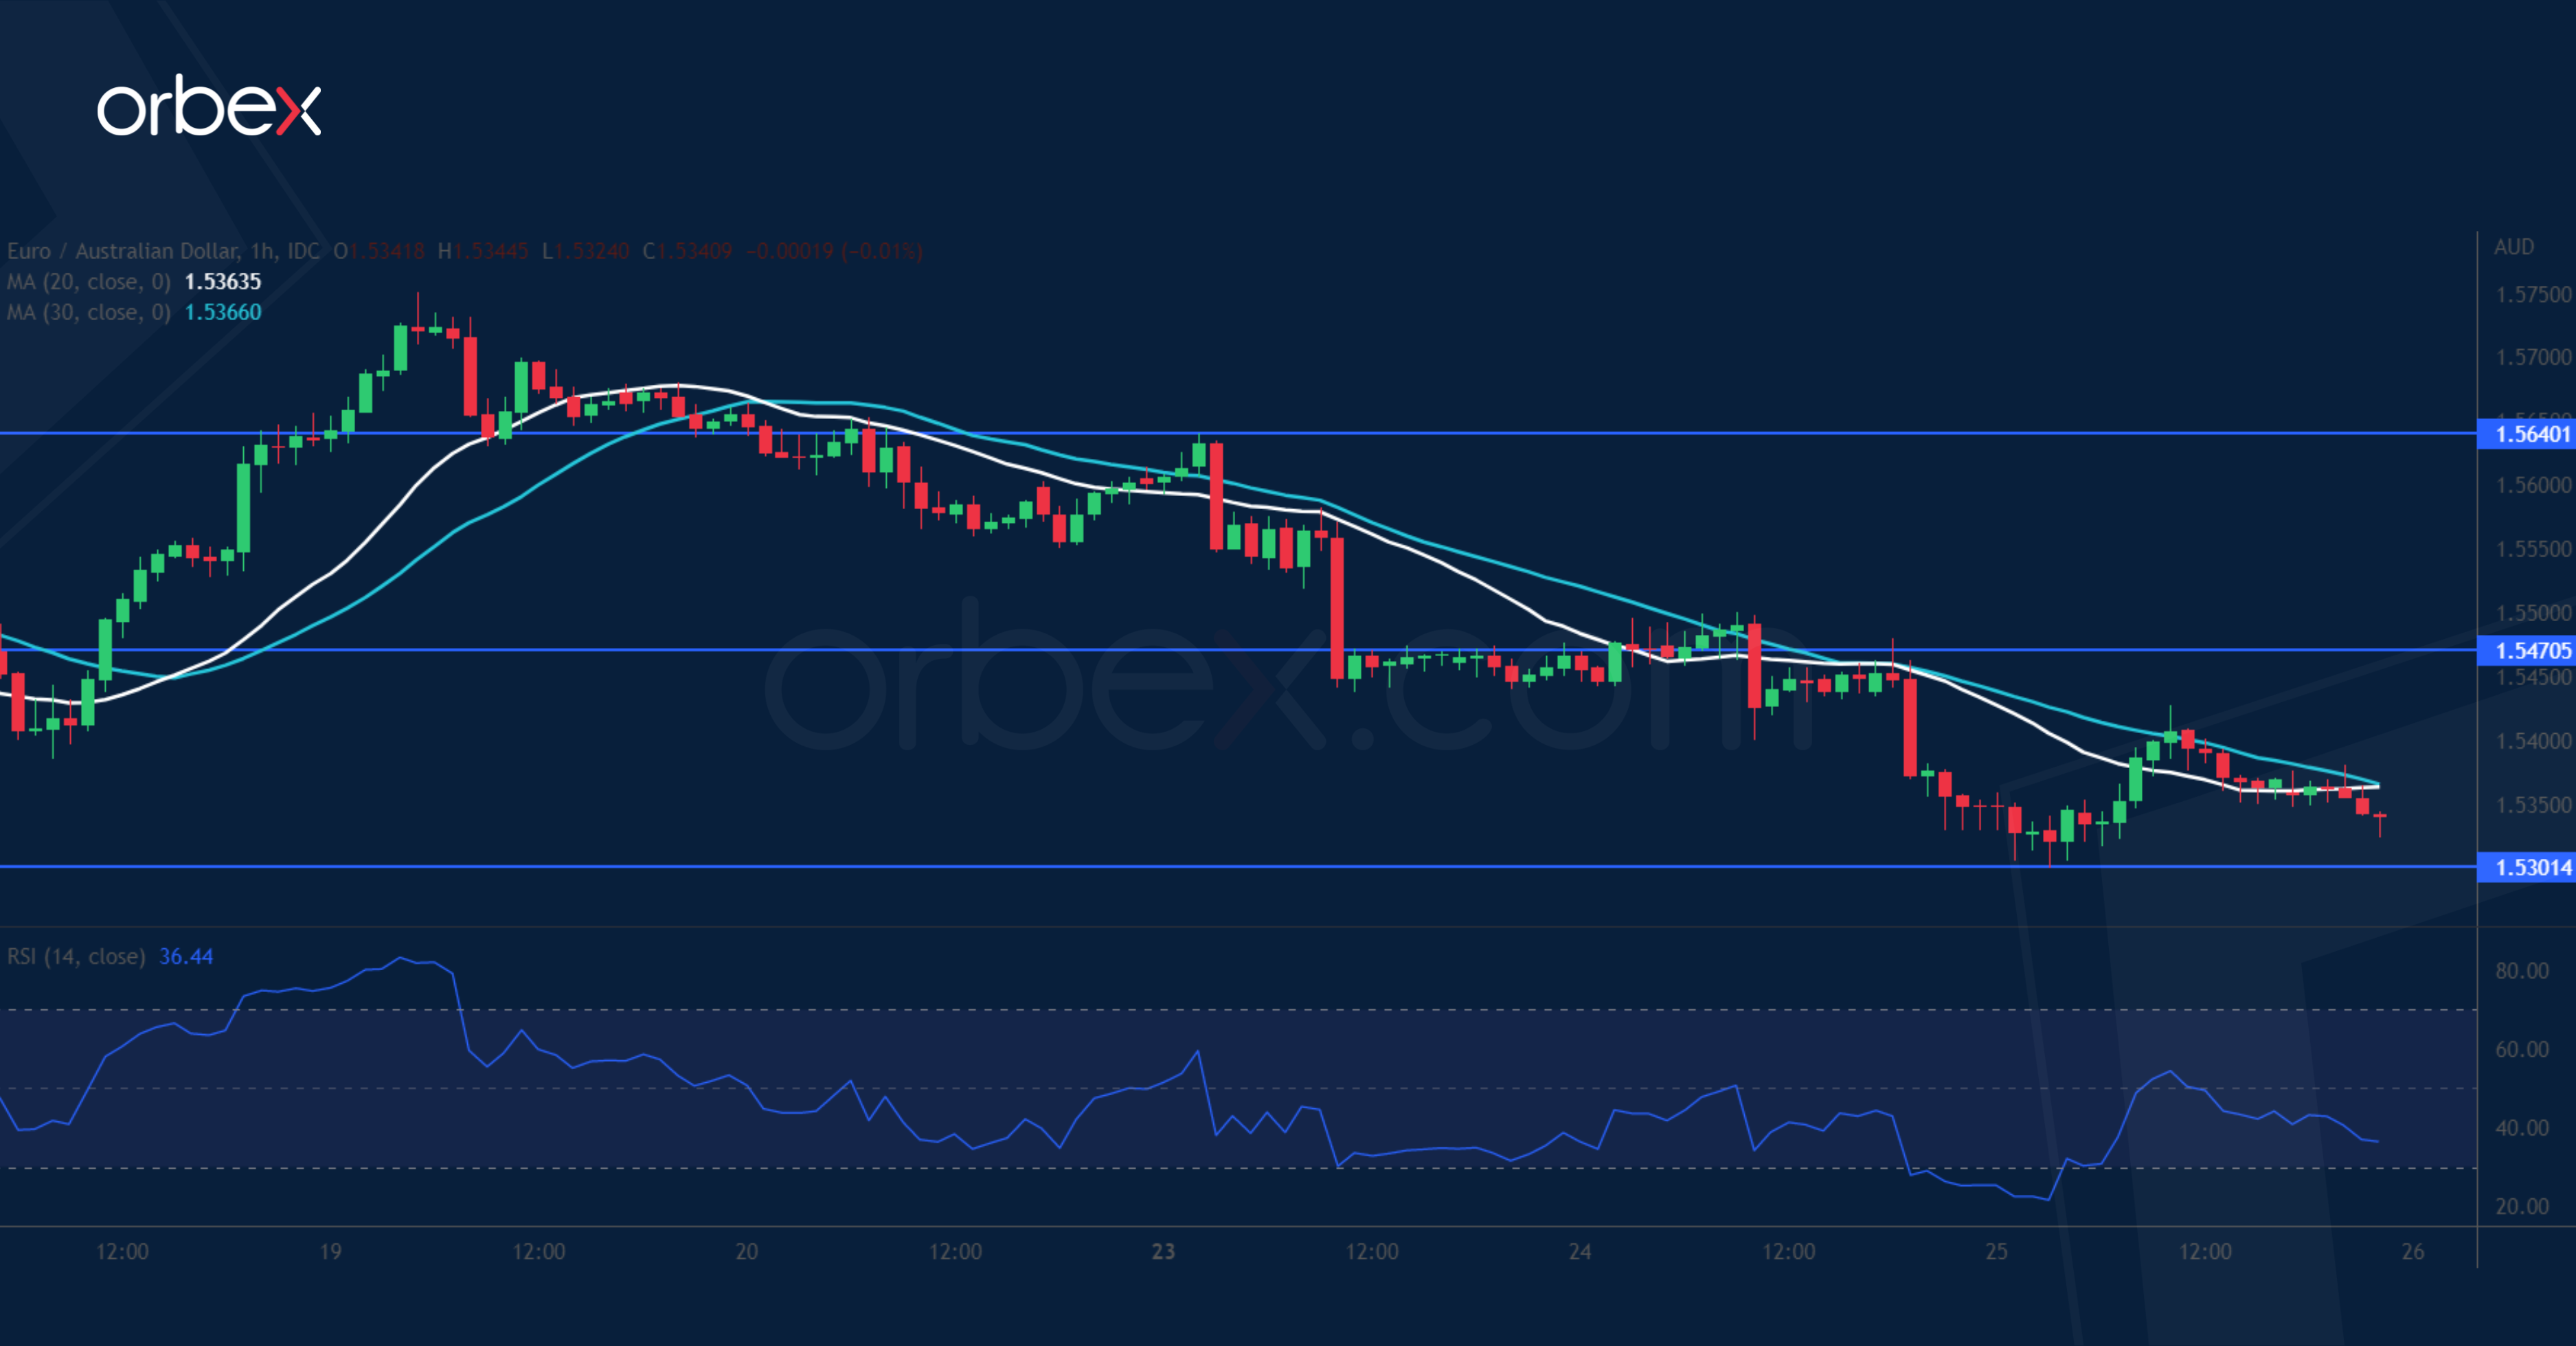
EUR/AUD Sinks Further
The Australian dollar climbed after Q4 inflation came in hotter-than-expected. On the daily chart, the euro turned south at the support-turned-resistance (1.5950) from a sell-off earlier last year. This suggests that the medium-term bias is still skewed to the downside. Zooming into the hourly chart, a break below 1.5400 has invalidated the latest bounce and confirmed the pessimism on the higher timeframe. The RSI’s oversold situation has gathered limited support over 1.5300, but stiff selling could be expected around 1.5470.
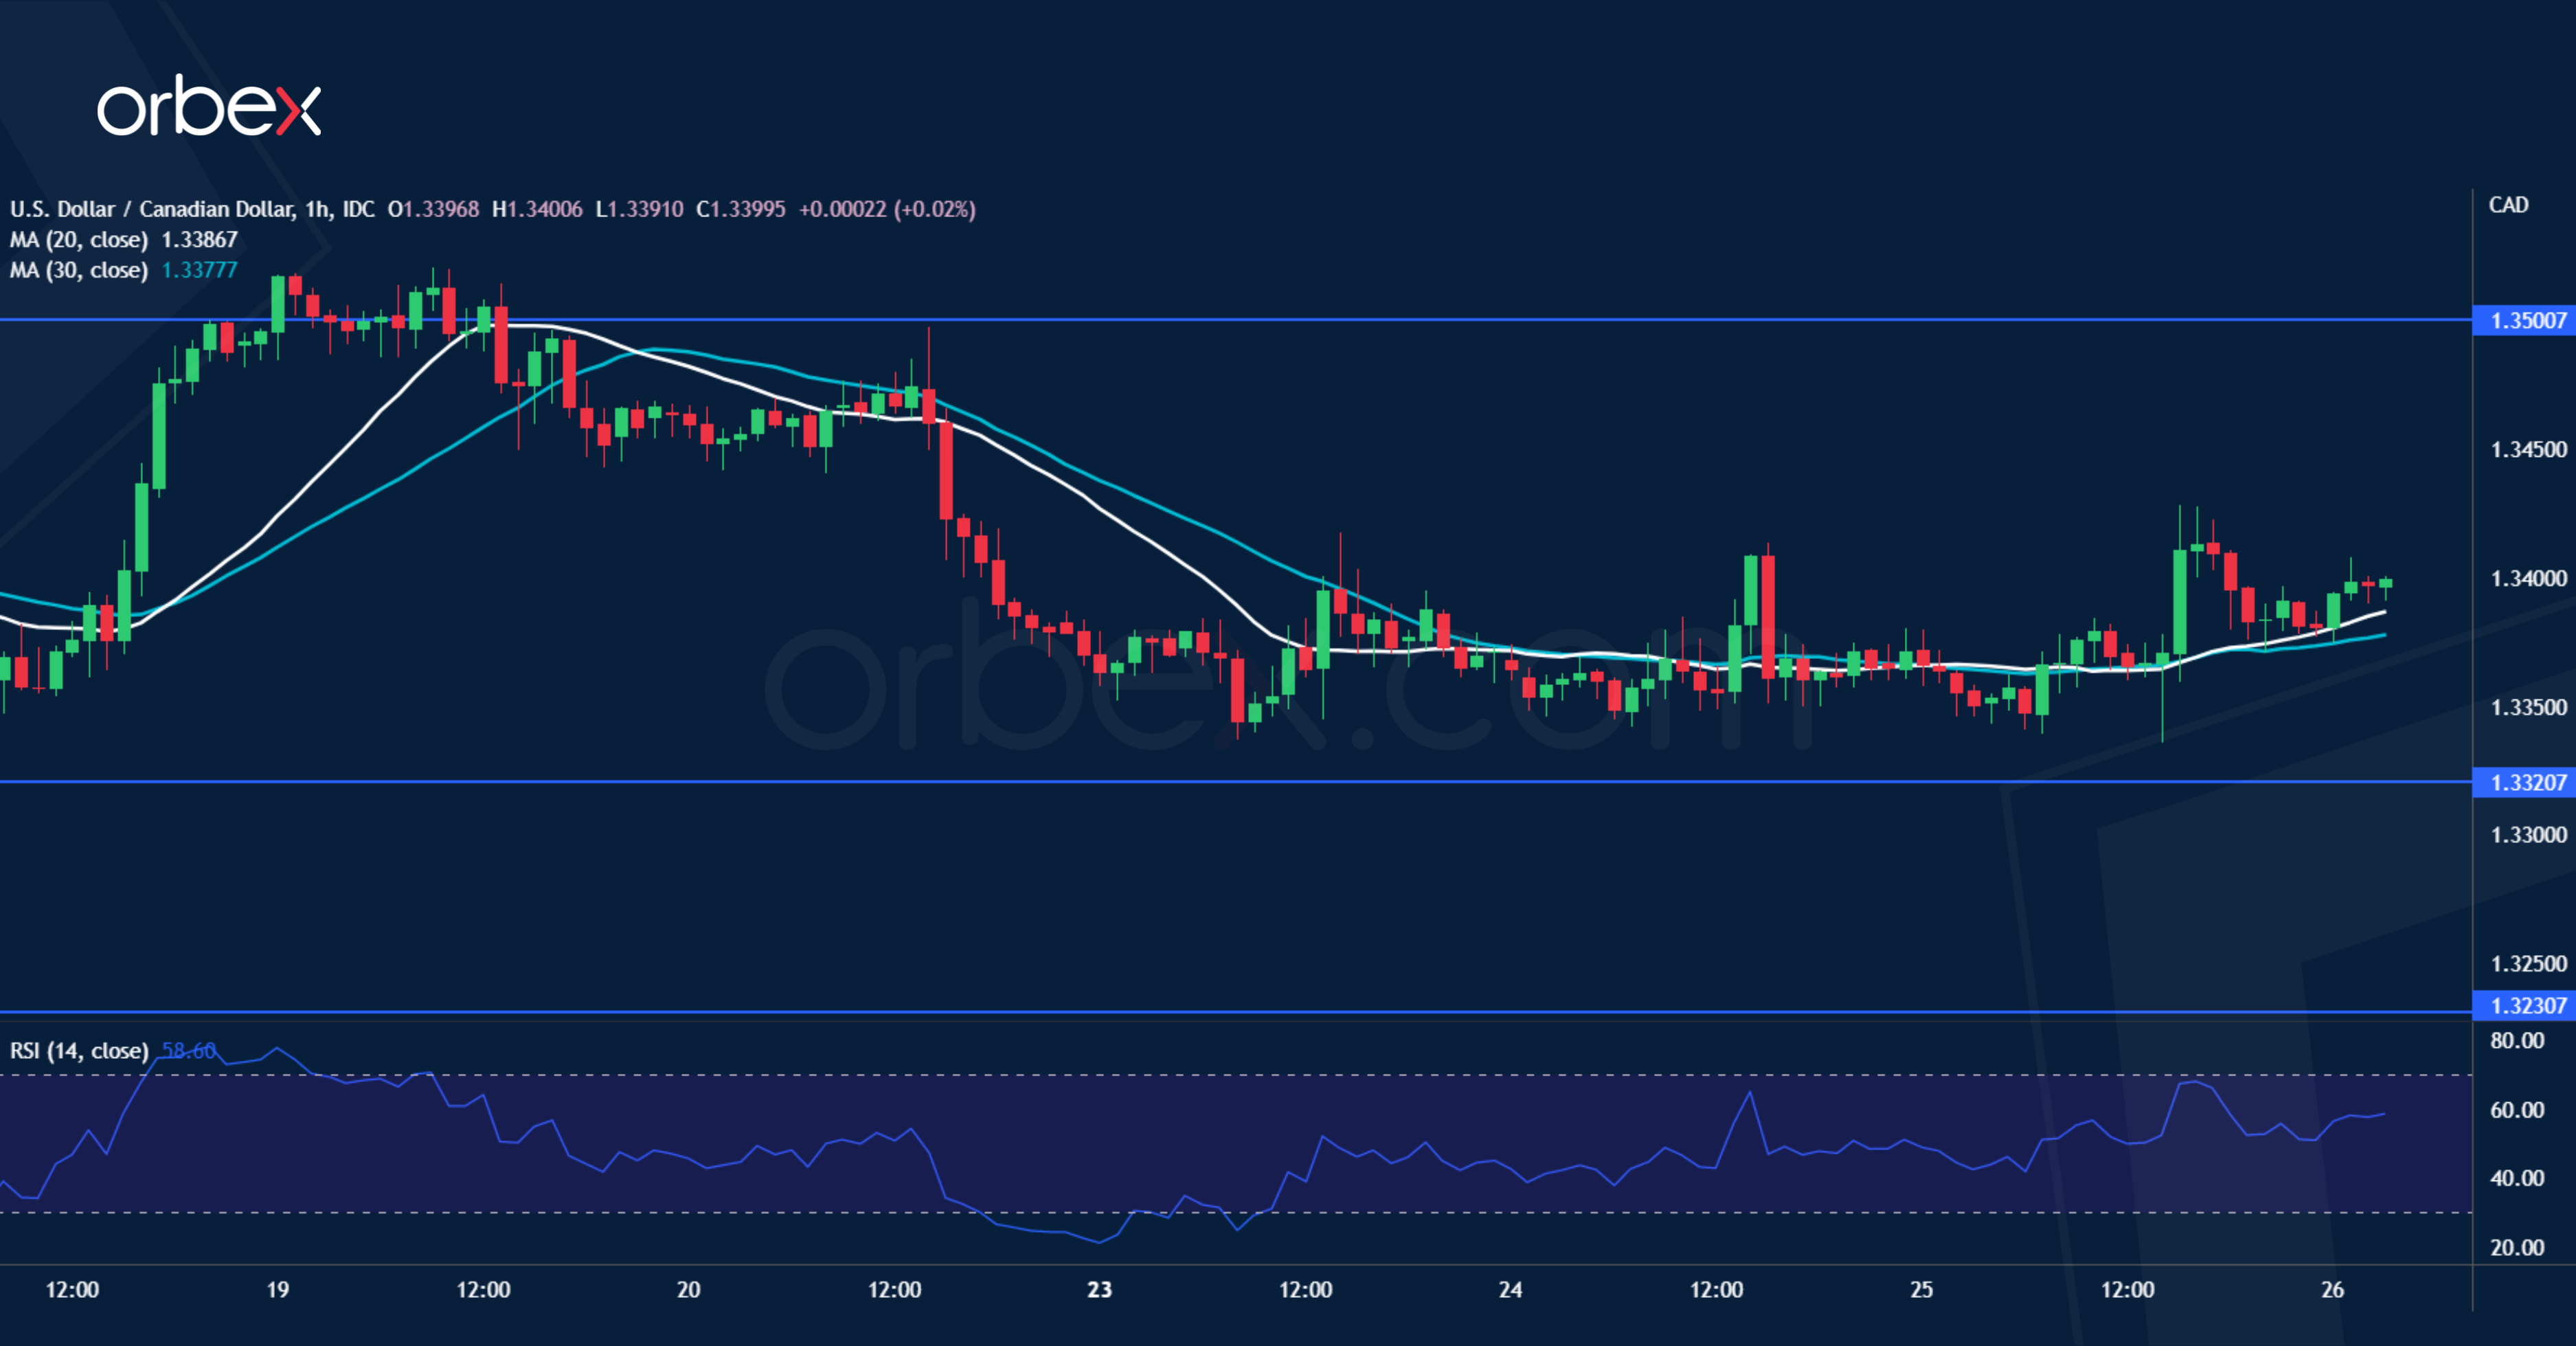
USD/CAD Attempts to Rebound
The Canadian dollar slipped after the BoC signalled a pause in rate increases. On the daily chart, the pair is looking to hold above 1.3320 as a triangle consolidation pattern seems to be taking shape between 1.3230 and 1.3700. After hitting resistance at the former support at 1.3520 the short-term price action reversed and tested 1.3320 again. Its breach would send the greenback to the critical floor at 1.3230. On the upside, 1.3500 is the first hurdle and 1.3660 may cap any further advance in the short-term.
Can US Q4 GDP Break the Recession Narrative?
Amidst all the debate of whether the US is heading into a recession this year, we get the first look at last year's GDP figures. This could be the biggest market moving event of the week, especially if expectations are not met. And there is something of a wide range of forecasts. The Fed's GDPNow tool is saying it will be 3.5%, while the consensus among economists is that it will be 2.6%. That compares to the prior quarter's revised 3.2% result.
But it's important to remember that just as a country can have a "technical recession", it can have "technical growth" as well. One of the main drivers for third quarter GDP growth was an unexpected decline in imports. Meaning that the trade calculation contributed to GDP, but only because Americans were buying less.
It's all inflation's fault
Given the context of high inflation at the time, it's logical Americans were buying less. At the time, the dollar was relatively strong, meaning that imports constituted deflationary pressures. Since then, the dollar has gotten weaker in anticipation that the Fed will stop raising rates. That means imported goods have increased in price, which could technically support a growing GDP figure.
The other interesting factor is that a recent review of leading indicators by the Conference Board showed that all segments of the US economy were decreasing except for two. Those were employment and personal consumption. The unemployment rate remains remarkably low, just a couple decimals off a multi-decade low. But that is likely because it's still dislocated from covid.
Where's the money coming from?
Turning to address the personal consumption factor, Americans have been spending down their savings of late. More worrisome for the long-term resilience of the economy, they have been taking on increasing amounts of debt. Major US banks pointed this out in their latest earnings, as deposits have diminished. Concurrently, net charge-offs (a measure of distressed debt) have been creeping higher, as Americans struggle to pay for their credit cards.
The head of JPMorgan, who's rather pessimistic about the economic future of the US, pointed to the rate of savings among his bank's customers is dwindling and would run out by October of this year. If interest rates remain high, it would be much harder for people to take on debt to continue spending. The largest driver of the US economy, and one of only two positive sectors at the moment, is dwindling.
Gauging the market reaction
The market might not particularly like a good GDP figure, since that would imply the Fed could keep hiking in order to tame inflation. But, even if that hurts stocks, it could give the dollar a bit of a boost. Meanwhile, a disappointing figure could give the markets some relief over rate hikes, as it could be interpreted as a sign that the Fed's forecasts are a little too optimistic, and they might even have to cut rates in the near future.
The Fed meets next week, and there is a pretty solid consensus that there will be just a 25bps hike. This is the last major data point before the meeting, because January NFP figures won't be released until the Friday after the FOMC. Therefore this data could be pivotal for expectations for the Fed.
S&P 500 Rally Suggests Falling Recession Odds – Earnings Could Change that
The S&P 500 was flat yesterday, as investors tried to make sense of the deluge of company earnings that hit the fan before, during and after the session. Microsoft didn’t gain on better-than-expected earnings, and Tesla announced record profits, but the share price jumped only 5% in the afterhours.
We are apparently stepping into a period where earnings projections outweigh the better-than-expected results. It makes the price moves harder to predict, however, it also gives us a hint that the S&P500 may have topped a couple of days ago, and more importantly, the market may soon get the fading recession odds straight, if the economic data continues surprising to the downside, as it has been the case at many prints since the start of the year.
The positive price action in stocks, and the positive price action in bonds suggest that the recession odds became less for stock traders, and more for bond traders since the start of this year.
In this sense, the odds for central bank policies are also evolving to the dovish side – or mostly.
Bank of Canada hiked its bank rate by 25bp yesterday and announced to pause.
The BoC decision spurred the expectation that the Federal Reserve (Fed) could do the same: hike by 25bp next week then pause.
This is certainly why the dollar index remained under pressure yesterday. The EURUSD is again above 1.0920, as the RSI index warns that the rally is extending into the overbought territory.
For the Bank of England (BoE), investors are almost sure that the year will end with a 25bp hike due to slowing economy, but Cable is above 1.24 this morning, as some traders still think that the BoE will have to address higher inflation before slowing economy.
In Australia, however, the surprise rebound in Australian inflation, spurred the Reserve Bank of Australia (RBA) hawks yesterday, and accelerated the Aussie’s appreciation against the dollar.
In summary, investors’ hearts will continue to swing between slowing economy and easing inflation, and the bumps in inflation along the way.
But the data will tell who is right and who is wrong. Today, the US will reveal the Q4 GDP data, and the US economy may have grown at a slower pace of 2.6%, versus 3.2% printed earlier. Core durable orders on the other hand may have contracted in December. So any softness, or worse, any disappointment could further weigh on stocks.
Or not! The direction is very blurry at the moment and the deluge of economic data and earnings could tilt market sentiment in either way.
Intel, Mastercard, Visa and American Airlines are among companies to report their Q4 earnings today in the US, Volvo and LVMH will report their results in Europe. Chevron and American Express will be going to the earnings confessional tomorrow.
Elsewhere, news from China is not bad. Both travel and box office numbers show that Chinese people are spending money for travel and leisure. And the latest reports suggest that Chinese households added a massive $2.6 trillion to their bank accounts last year. All this money could be spent on new iPhones, new Louis Vuitton bags, new Tesla cars, and could temper the recession odds.
GBP/JPY Daily Outlook
Daily Pivots: (S1) 159.83; (P) 160.38; (R1) 161.25; More...
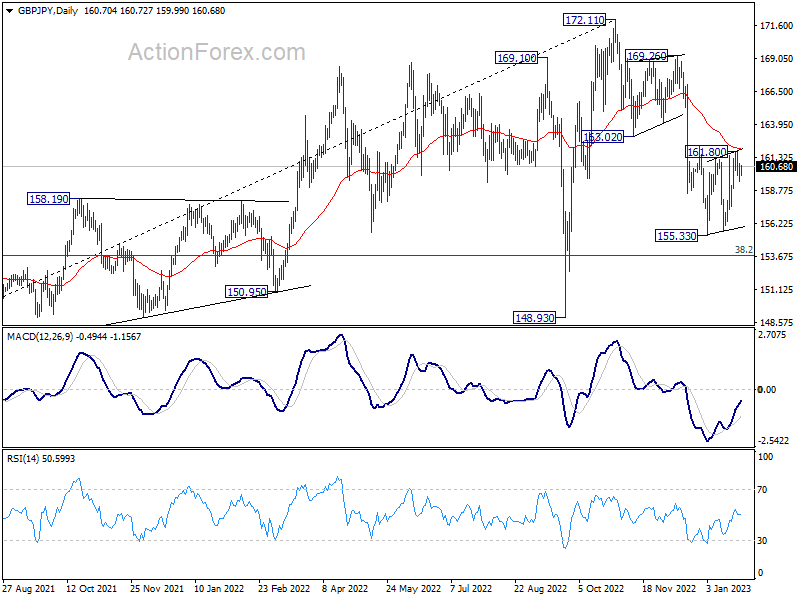
Intraday bias in GBP/JPY remains neutral and outlook is unchanged. On the downside, break of 155.33 low will resume the fall form 172.11 to 153.70 fibonacci level next. Risk will stays on the downside as long as 55 day EMA (now at 162.03) holds, even in case of another rally attempt.
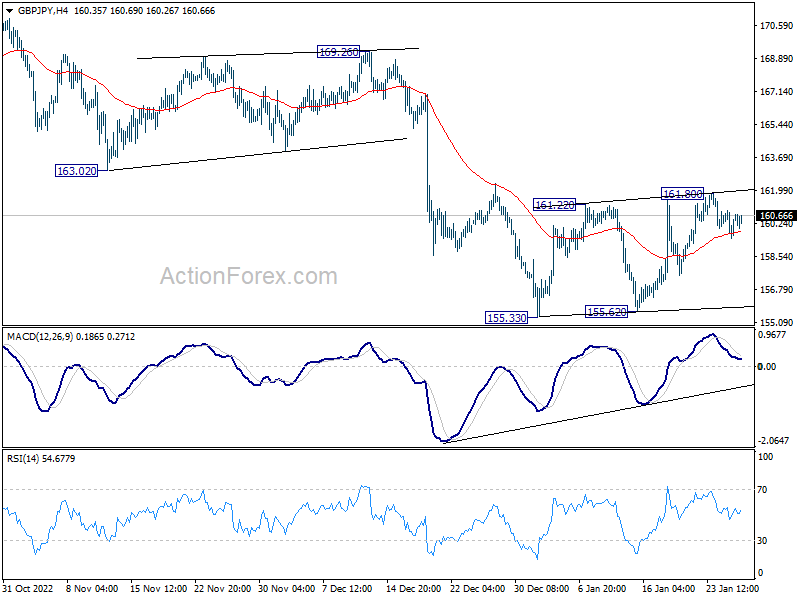
In the bigger picture, as long as 163.02 support turned resistance holds, decline from 172.11 medium term top is expected to continue to 38.2% retracement of 123.94 to 172.11 at 153.70. Sustained break there will raise the change of trend reversal and target 61.8% retracement at 142.34. Nevertheless, break of 163.02 support turned resistance will argue that the decline has completed, and retain medium term bullishness.
EUR/JPY Daily Outlook
Daily Pivots: (S1) 140.72; (P) 141.51; (R1) 142.26; More....
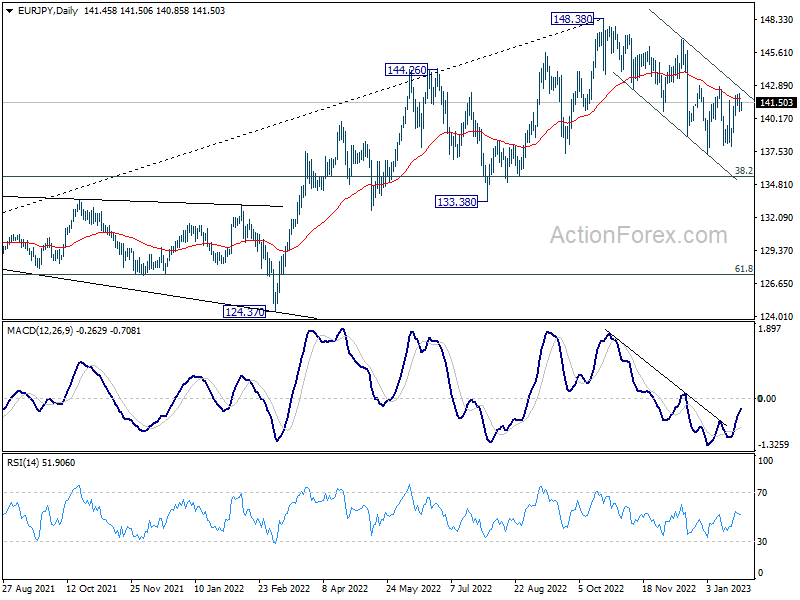
Intraday bias in EUR/JPY stays neutral as range trading continues. On the downside, break of 137.37 will resume the whole decline from 148.38 to 135.40 fibonacci level next. However, firm break of 142.84 will argue that the correction from 148.38 has completed, and bring stronger rise back to 146.71 resistance.
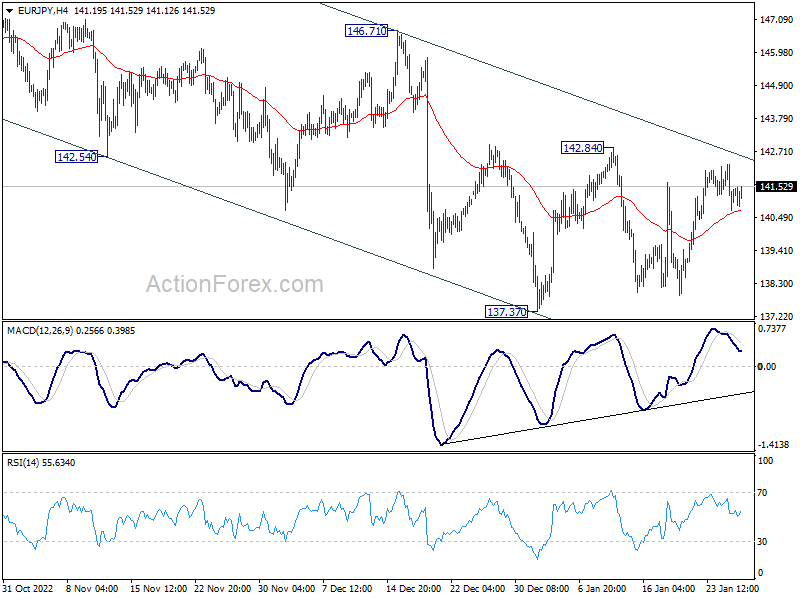
In the bigger picture, as long as 55 week EMA (now at 138.62) holds, larger up trend from 114.42 (2020 low) is still in progress for 149.76 long term resistance. However, firm break of 55 week EMA will bring deeper fall to 38.2% retracement of 114.42 to 148.38 at 135.40. Sustained break there will raise the chance of trend reversal, and target 61.8% retracement at 127.39.
EUR/GBP Daily Outlook
Daily Pivots: (S1) 0.8783; (P) 0.8818; (R1) 0.8836; More...
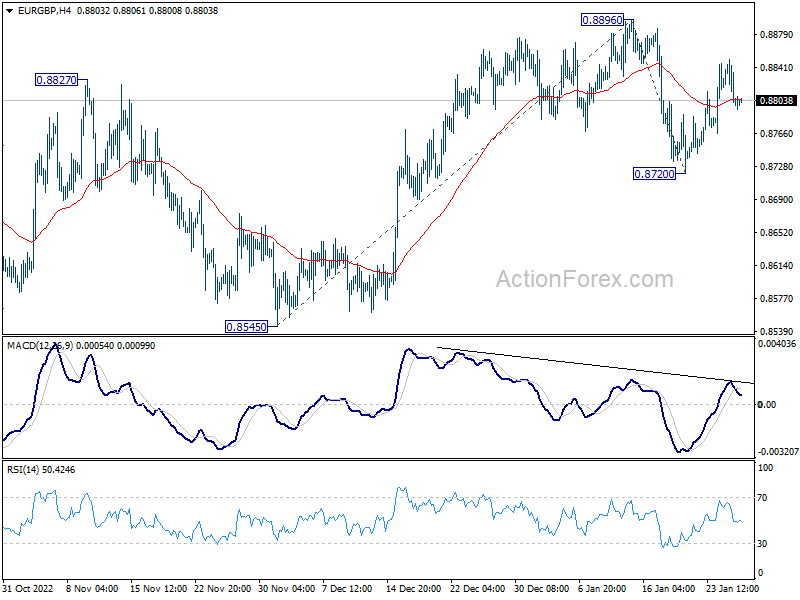
Intraday bias in EUR/GBP is turned neutral again as it retreated well ahead of 0.8896 resistance. On the upside firm break of 0.8896 will resume the rise from 0.8545 and target 61.8% projection of 0.8545 to 0.8896 from 0.8720 at 0.8937. On the downside, break of 0.8720 will resume the fall from 0.8896 instead.
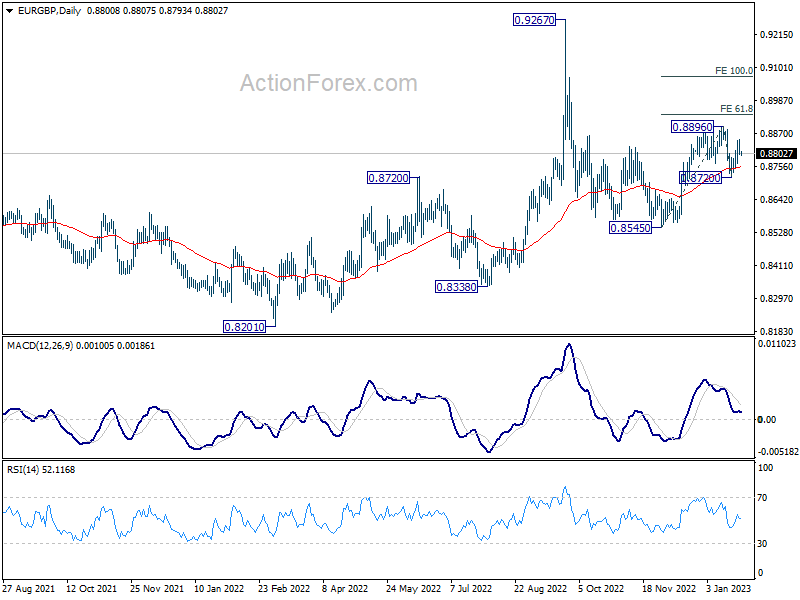
In the bigger picture, the notable support from 55 day EMA (now at 0.8752) retains near term bullishness. Break of 0.8896 should target 0.9267 (2022 high) and possibly above, to resume whole up trend from 0.8201 (2022 low). However, break of 0.8270 support and sustained trading below 55 day EMA will set the stage for 0.8545 and below.
EUR/AUD Daily Outlook
Daily Pivots: (S1) 1.5291; (P) 1.5386; (R1) 1.5462; More...
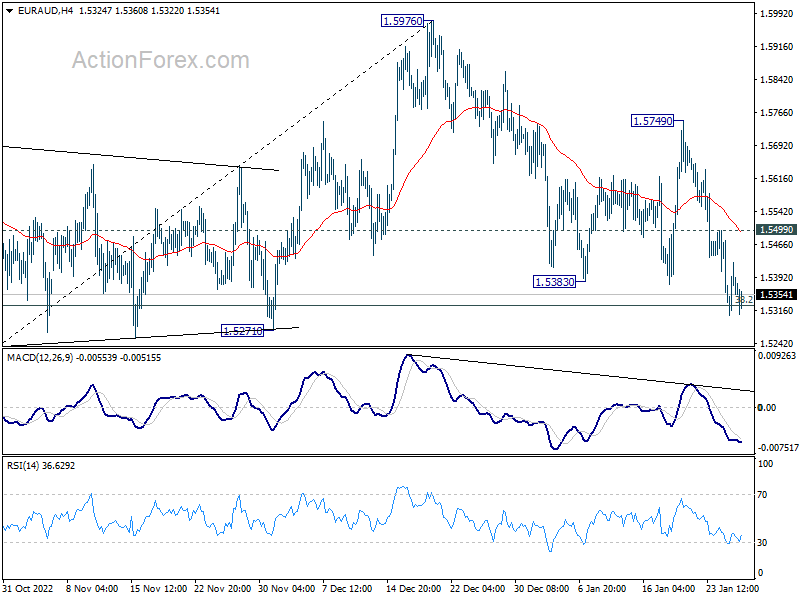
Intraday bias in EUR/AUD remains on the downside with focus on 1.5271 support. Decisive break there will carry larger bearish implication. Deeper decline would then be seen to 61.8% retracement of 1.4281 to 1.5976 at 1.4928. Nevertheless, rebound from current level, followed by break of 1.5499 minor resistance, will revive near term bullishness for 1.5749 resistance and above.
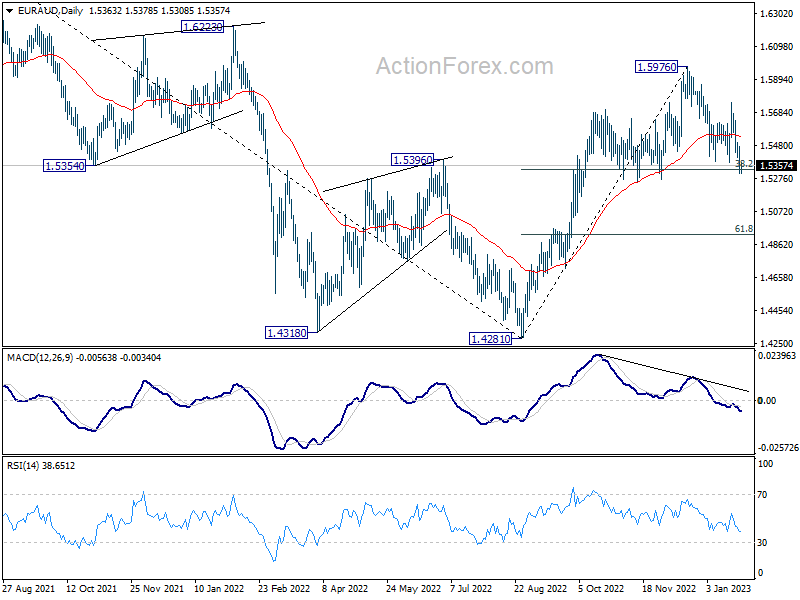
In the bigger picture, it's still early to confirm if rise from 1.4281 represents bullish trend reversal. But as long as 1.5271 support holds, such rally is in favor to continue. Break of 1.5976 will target 1.6434 key resistance next. On the other hand, firm break of 1.5271 will retain medium term bearishness instead.
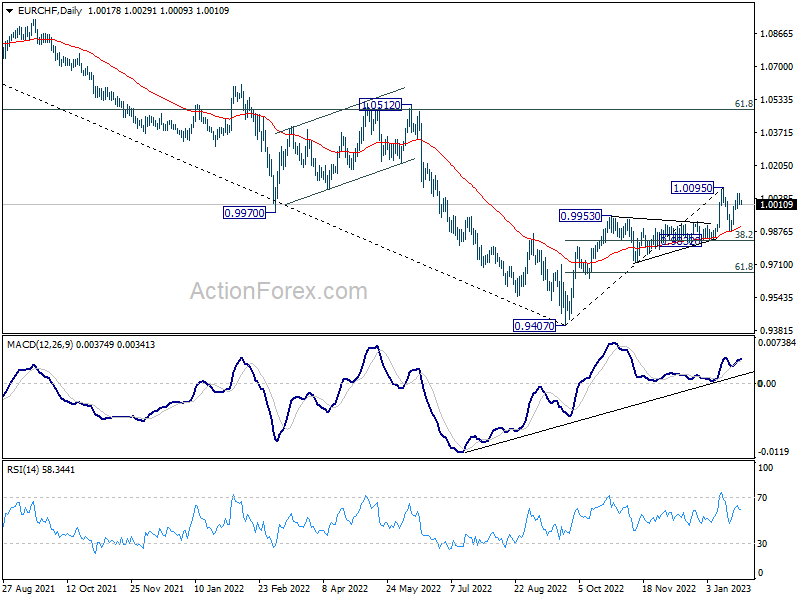
EUR/CHF Daily Outlook
Daily Pivots: (S1) 0.9998; (P) 1.0034; (R1) 1.0055; More....
Intraday bias in EUR/CHF retreated ahead of 1.0095 and intraday bias is turned neutral first. On the downside, break of 0.9952 minor support will turn bias back to the downside, to extend the corrective pattern from 1.0095 with another leg, back towards 0.9873 support. On the upside, firm break of 1.0095 will resume whole rally from 0.9407 low.
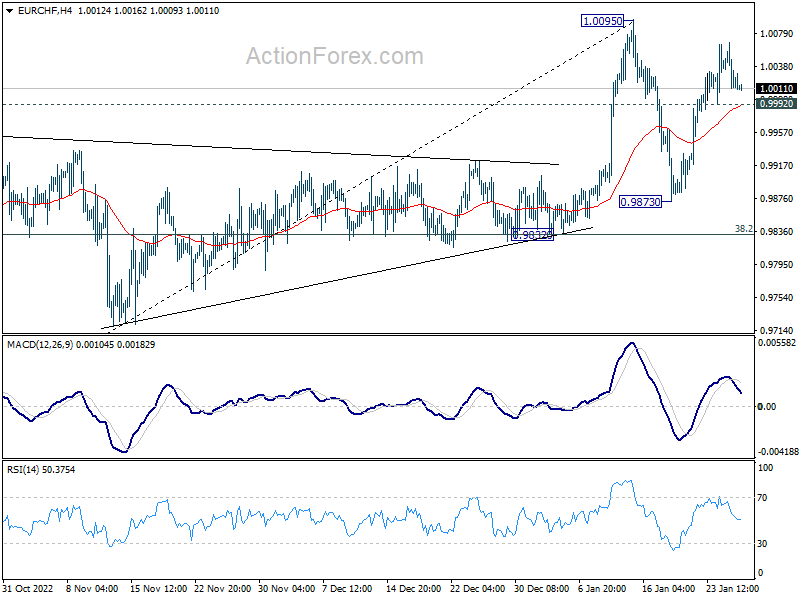
In the bigger picture, the initial rejection by 55 week EMA (now at 1.0039) mixed up the outlook. On the upside, sustained trading above 55 week EMA will raise the chance of bullish trend reversal. Rise from 0.9407 should then target 1.0505 cluster resistance (2020 low at 1.0505, 61.8% retracement of 1.1149 to 0.9407 at 1.1484). However, firm break of 0.9832 support will revive medium term bearishness and bring retest of 0.9407 low instead.