Sample Category Title
USD/CAD At Risk Ahead of BoC Interest Rate Decision
Key Highlights
- USD/CAD extended losses below the 1.3450 support.
- A major bearish trend line is forming with resistance near 1.3445 on the 4-hours chart.
- EUR/USD is eyeing more gains above the 1.0900 resistance zone.
- The BoC interest rate decision is scheduled today (forecast 4.5%, versus 4.25% previous).
USD/CAD Technical Analysis
The US Dollar started a fresh decline from well above 1.3550 against the Canadian Dollar. USD/CAD declined below 1.3450 to move into a short-term bearish zone.
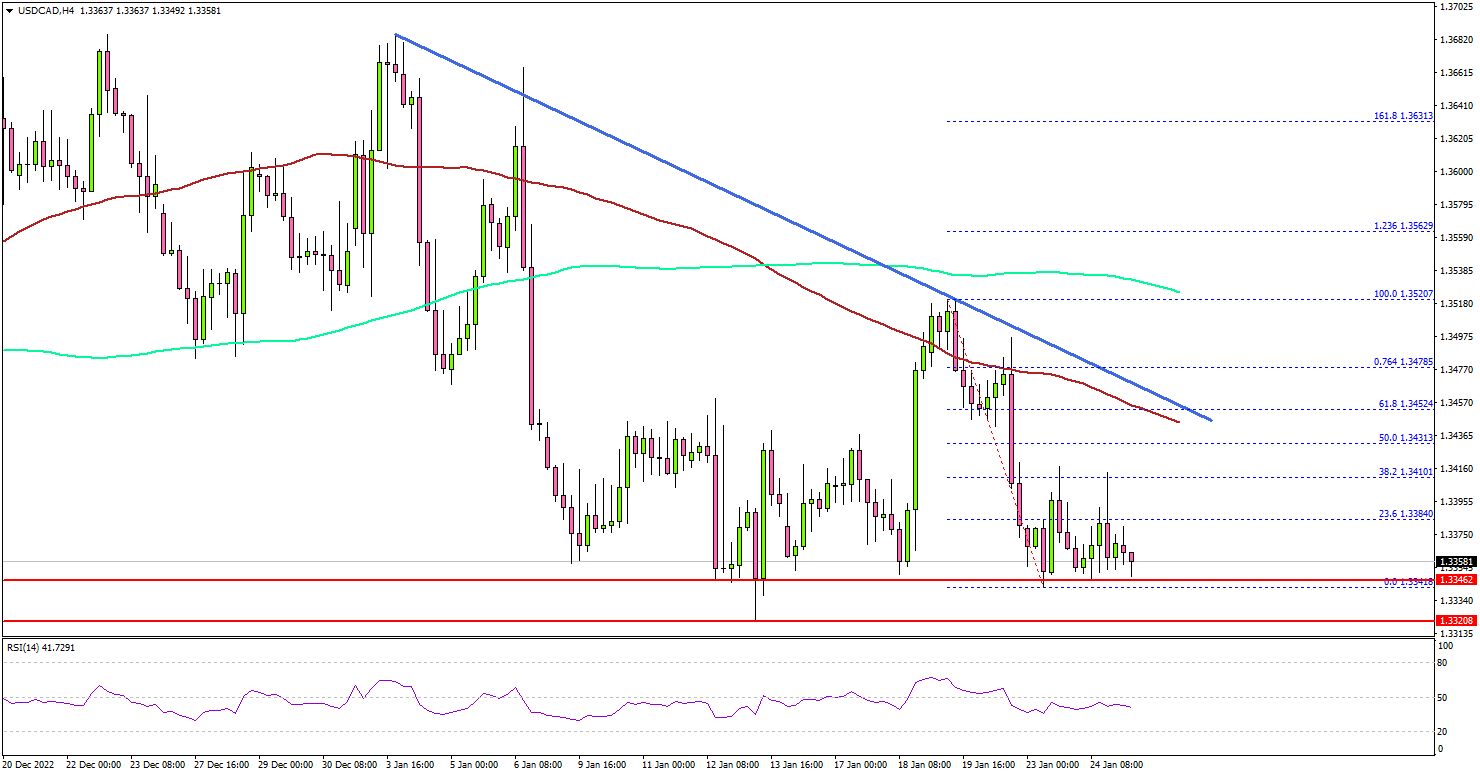
Looking at the 4-hours chart, the pair settled below the 1.3450 level, the 100 simple moving average (red, 4-hours) and the 200 simple moving average (green, 4-hours).
The pair even traded below the 1.3400 level and tested the 1.3350 support zone. It is now consolidating losses above the 1.3350 support. On the upside, an initial resistance is near the 1.3420 level.
The next major resistance may perhaps be near 1.3450. There is also a major bearish trend line forming with resistance near 1.3445 on the same chart. A clear move above the 1.3450 resistance might start a steady increase towards the 1.3520 resistance zone.
Any more gains could open the doors for a move towards the 1.3600 level. The next key hurdle is near 1.3640, above which the pair could climb towards the 1.3800 resistance zone.
On the downside, there is a major support at 1.3350. The next major support is near the 1.3320 level. A downside break below the 1.3320 zone might push the pair lower.
The next major support sits near the 1.3250 level. Any more losses might open the doors for a move towards the 1.3120 support zone.
Looking at EUR/USD, the pair is consolidating in a tight range and might attempt a fresh increase above the 1.0900 resistance.
Economic Releases
- German IFO Business Climate Index for Jan 2022 – Forecast 90.2, versus 88.6 previous.
- BoC Interest Rate Decision – Forecast 4.5%, versus 4.25% previous.
EURCHF : Euro Swiss Pair Bouncing from Weekly Blue Box
In the present article, we are going to take a look on the weekly chart of EURCHF: Euro Swiss forex pair. In a quiet natural way, this cross is a ratio of two pairs: EURUSD and USDCHF. Even though, both dollar linked pairs are by far more liquid instruments, the EURCHF shows its own character. Indeed, from January 2015 lows it develops a clean double three structure and follows hereby Fibonacci extension levels.
In our initial article from March 2020, we have forecasted another bullish cycle after 7 swings lower. As a matter of fact, the market has provided a short term bounce and correction continued as a larger 7 swings structure. Here, we take a view on EURCHF pattern in the past 8 years and provide an outlook with targets for coming 3-5 years.
EURCHF Weekly Elliott Wave Analysis 01.24.2023
The weekly chart below shows the price behavior of the cross ratio EURCHF. From the lows of January 2015, the pair has developed a cycle higher in red wave x of a cycle degree. It has printed the highs in April 2018 at 1.2005. The advance is an Elliott wave zigzag pattern being a 3 swings corrective structure. Generally speaking, the correction might be over after 3 swings already. However, in contrast to stocks, forex is a range bound market. Therefore, the latter can trend also in corrective sequences.
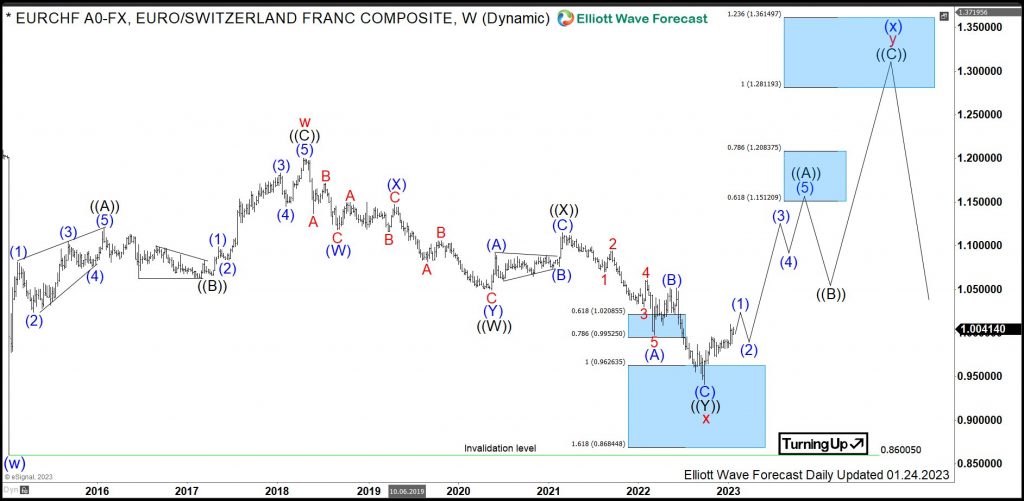
From April 2018 highs, a correction lower in wave x has unfolded as a double three pattern being 3-3-3 structure. First, wave ((W)) has ended in May 2020 at 1.0492 lows. Then, a connector in wave ((X)) has printed a lower high in March 2021 at 1.1151. From there, wave ((Y)) has developed another 3 swings to the downside. Hereby, blue wave (A) of black wave ((Y)) has reached 1.0208-0.9952 intermediary range being 0.618-0.786 extension area. After a bounce in wave (B), the final swing in blue wave (C) of black wave ((Y)) has reached 0.9626-0.8684 full extension area. From that area, a strong reaction higher can be seen. Now, the bottom at 0.9407 lows is favored to be the end the entire correction of cycle from January 2015 lows.
From the September 2022 lows, EURCHF might be in the first stages of a new cycle in red wave y. While above 0.9407 lows, pair can reach in 3 swings 1.2811-1.4914 area. Hereby, intermediary area 1.1512-1.2083 should provide medium term resistance.
WTI Crude Oil Wave Analysis
- WTI crude oil reversed from resistance level 96.00
- Likely to fall to support level 78.0
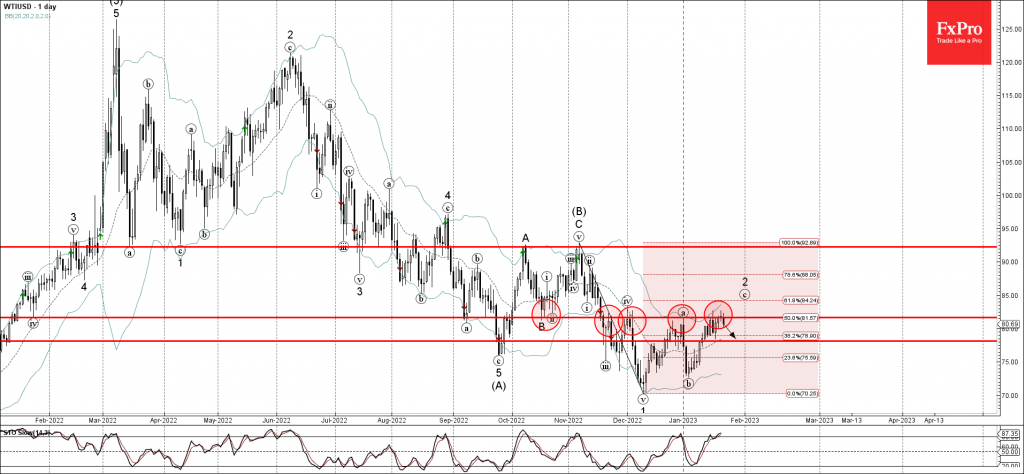
WTI crude oil recently reversed down from the pivotal resistance level 96.00 (which has been reversing the price from the end of November) intersecting with the 50% Fibonacci correction of the previous downward impulse from November.
The downward reversal from the resistance level 96.00 stopped the earlier minor ABC correction 2.
Given the persistent daily downtrend, WTI crude oil can be expected to fall further toward the next support level 78.0.
AUDJPY Wave Analysis
- AUDJPY reversed from key resistance level 92.00
- Likely to fall to support level 90.00
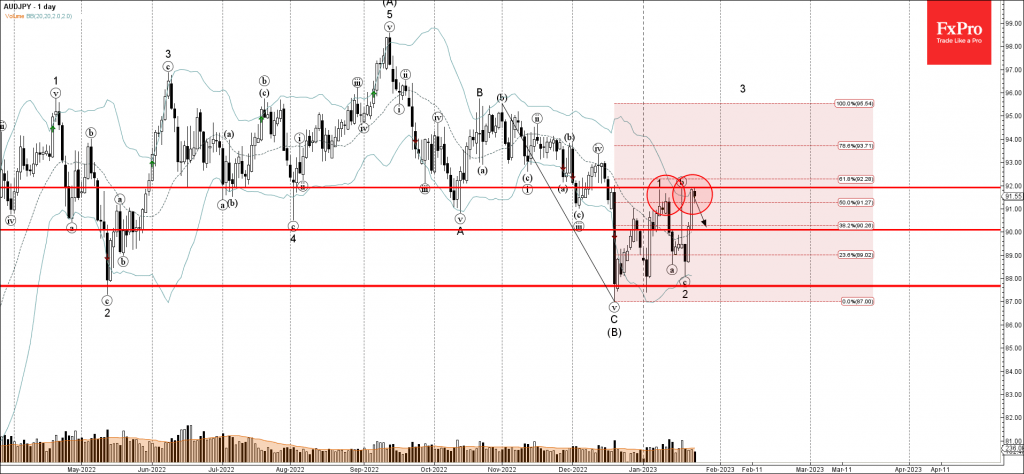
AUDJPY currency pair recently reversed down from the key resistance level 92.00 (which stopped the two of the previous minor waves -1 and b) intersecting with the upper daily Bollinger Band and the 50% Fibonacci correction of the previous sharp downward impulse from October.
The downward reversal from the resistance level 92.00 stopped the earlier minor impulse wave 3 of wave (C) from December.
Given the strength of the resistance level 92.00, AUDJPY currency pair can be expected to fall further toward the next round support level 90.00.
US GDP and PCE Inflation Eyed Ahead of Fed Decision as Dollar Languishes
Investors will get the first reading on US GDP growth for the fourth quarter on Thursday (13:30 GMT), while on Friday, the last inflation statistics before Fed policymakers gather for their first meeting of 2023 will be watched. The data could be a boon for risk appetite, as the American economy probably grew at a solid clip in Q4, and inflation as measured by the PCE price index moderated further. But the US dollar is looking increasingly in trouble, as the Fed has already strongly hinted that another downshift in the pace of rate hikes is on the cards next week.
Headed for recession?
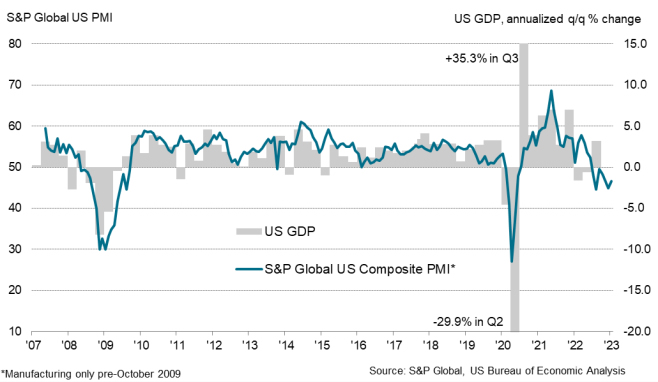
It's a busy few days for US data and fresh out of the oven are S&P Global’s flash PMI estimates for January. US growth stuttered towards the end of 2022 according to both the S&P and ISM surveys and it doesn’t appear that there was a dramatic improvement at the beginning of 2023 as the PMIs point to ongoing contraction in business activity, albeit at a smaller pace.
However, despite the general deterioration in the various indicators, the economy isn’t in a broad-based decline yet and therefore not quite in a recession. Durable goods numbers due on Thursday are expected to show that orders bounced back by 2.5% over the month in December after tumbling 2.1% in the prior month. More encouragingly, GDP is projected to have notched up annualized growth of 2.6% in the final three months of 2022.
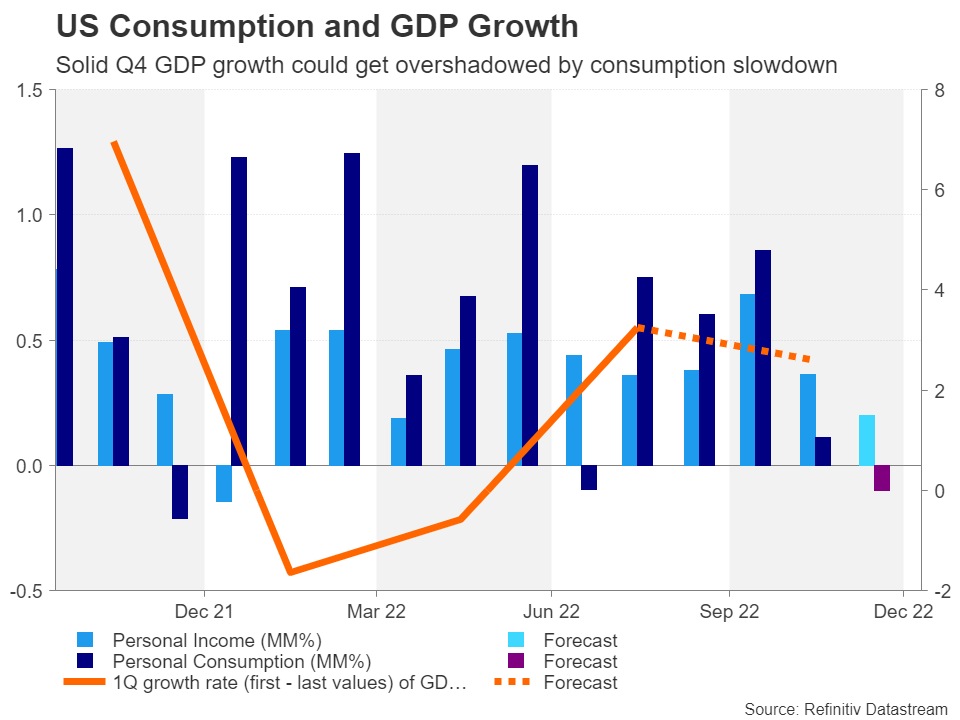
Weaker consumption poses a danger
However, Friday’s data on personal income and spending will be more crucial in painting a more accurate picture for what to expect for the current quarter amid signs that US consumers have finally started to feel the squeeze from soaring prices. Personal income is forecast to have risen by 0.2% m/m in December, halving from November’s rate of 0.4%, while consumption is expected to have dropped by 0.1% m/m after increasing by 0.1% previously.
If consumer spending does indeed fall in December, it would suggest that the post-pandemic spending spree has run its course and that the Fed’s series of interest rate hikes have finally started to bite. The outlook for consumers remains clouded because although inflation is falling, which should boost real wages in the coming months, job losses are on the rise, especially in the tech sector.
Inflation is falling
Nevertheless, the latest PCE inflation figures should offer some relief on Friday if they support the market view that a Fed pivot is nearer than what policymakers would like to publicly acknowledge. The core PCE price index, which is favoured by the Fed, is forecast to have quickened slightly to 0.3% on a month-on-month basis, but the 12-month rate is expected to have edged further down from 4.7% to 4.4%, which would make it the lowest since October 2021.
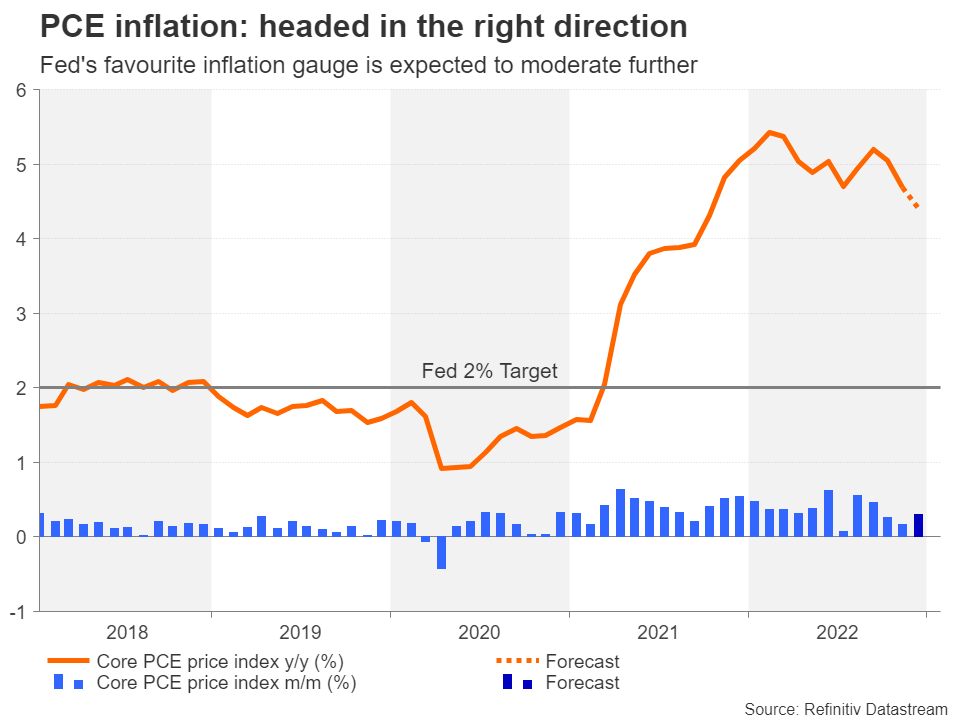
If the downward trend in core PCE is maintained and there aren’t upside surprises in any of the other data points, particularly personal consumption, the dollar is likely to come under pressure. The greenback’s gauge against a basket of currencies is drifting near eight months lows, while the euro has scaled a nine-month peak versus its US counterpart.
Can the dollar regain the front foot?
But the single currency has just reached a key technical level – the 50% Fibonacci retracement of the January 2021-September 2022 downtrend, which may prove to be a more challenging barrier to overcome. Furthermore, with the FOMC and ECB decisions due on February 1 and 2, respectively, some investors might sit on the sidelines until then.
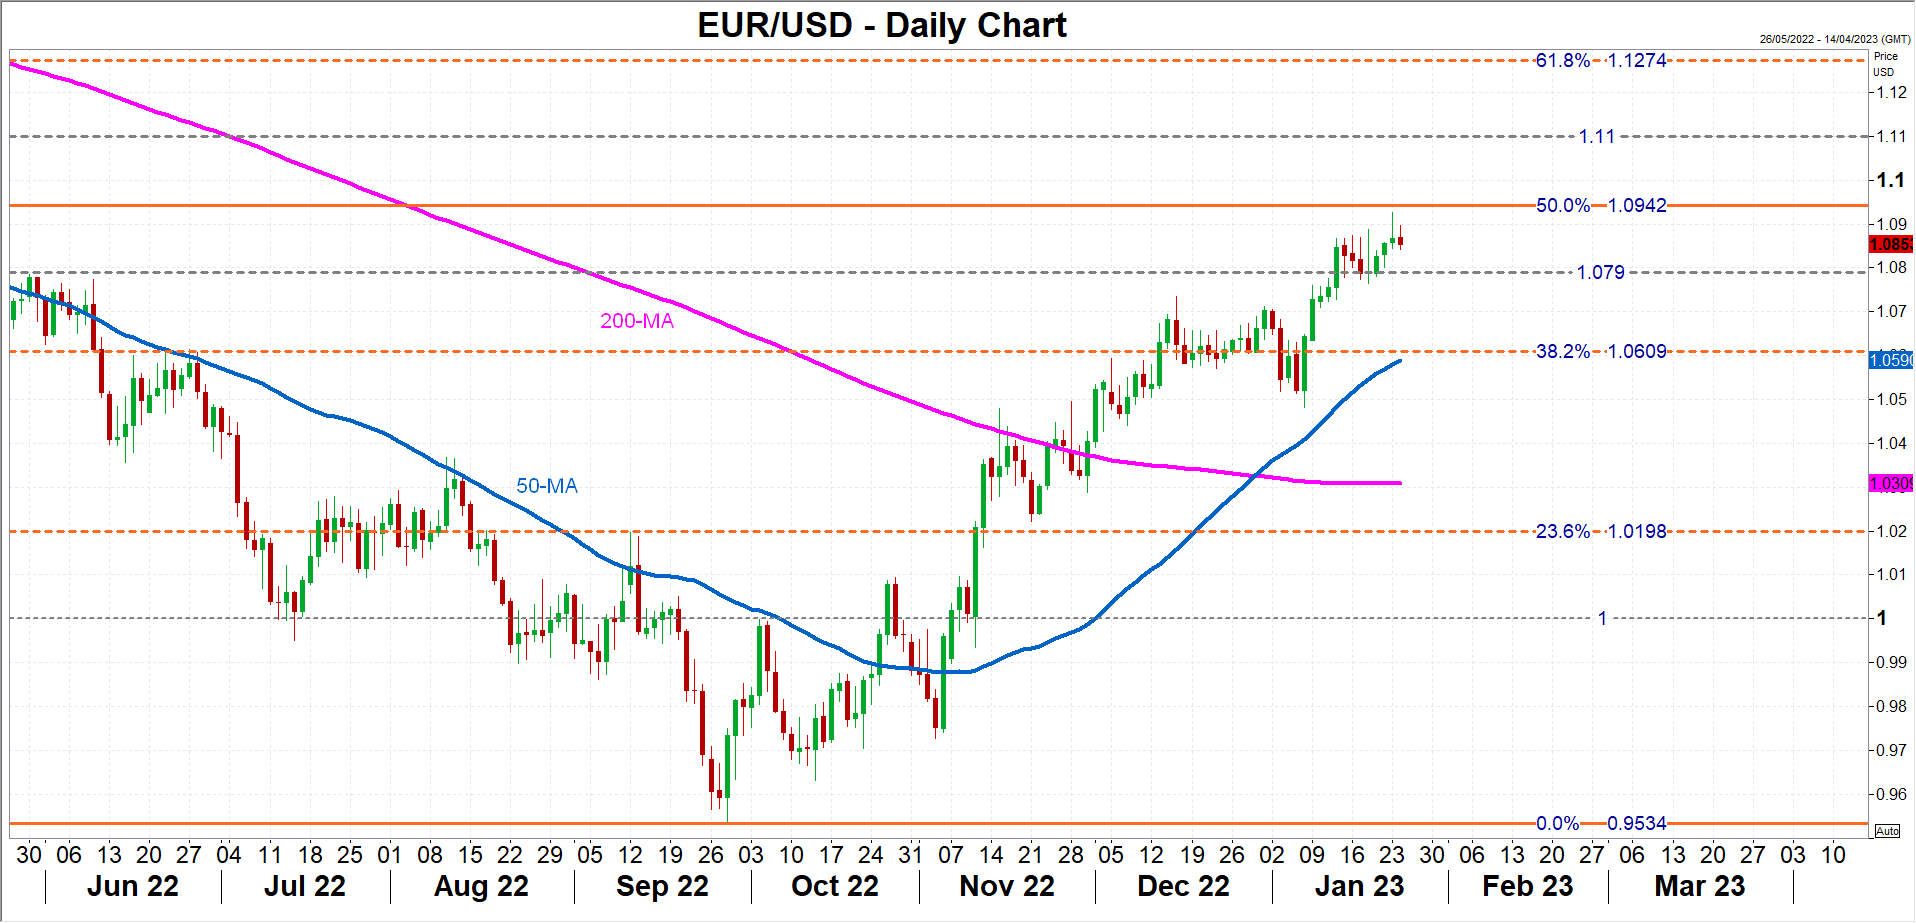
Still, a soft set of data has the potential to lift the euro above the 50% Fibonacci of $1.0942, opening the way for the $1.11 handle. Alternatively, if inflation doesn’t slow as fast as anticipated, the euro could seek immediate support in the $1.0790 region before heading towards its 50-day moving average at $1.0590.
In the bigger picture, the odds might be stacked against the dollar, as the pace of monetary policy tightening between the Fed and other central banks begins to diverge in 2023 and the US economy teeters on the brink of recession. But that doesn’t mean that there is cause to fall too out of love with US assets as this rotation out of the dollar could merely be an adjustment after investors became too optimistic about America’s growth prospects and overly pessimistic about the rest of the world's.
ECB Panetta: Beyond February any unconditional guidance would depart from data-driven approach
ECB Executive Board member Fabio Panetta said in an interview, "It was reasonable to increase rates in December and signal a similar step in February."
"But beyond February any unconditional guidance – that is, guidance unrelated to the economic outlook – would depart from our data-driven approach."
"Our December decisions were based on the projections available at that time. In March we will have new ones and should reassess the situation."
"Inflation is still too high, but recent developments suggest that we can fend off the risks of second-round effects and bring down inflation by continuing to adjust our policy rates in a well-calibrated, non-mechanical way."
Fed Preview: What It Takes for the Fed to Cut Rates
Fed Preview: What It Takes for the Fed to Cut Rates
- The Fed looks keen on raising Fed funds rate to 5%. We expect a 25bp rate hike next week followed by another 25bp hike in March and May, respectively.
- A turn in the business cycle and drop in short-term inflation expectations pave the way for rate cuts next year, but the neutral rate is higher than before the crisis.
- We think the trajectory for Fed funds discounted by markets looks broadly fair, but we see slight upside to the front end of the curve and in particular 6M-2Y.
The Fed appears adamant to raise Fed funds rate to 5%, but it will take a little longer than we previously expected. We now look for the Fed to hike 25bp next week followed by two more 25bp hikes in March and May to conclude the hiking cycle. For markets, focus has already turned to looming cuts - the swap market discounts first two 25bp rate cuts already in the second half of this year. We look at what it takes this time for the Fed to cut rates.
Normally, a turn in the business cycle paves the way for the Fed to cut rates. This time it needs to take into account the risk of prolonging the underlying inflation. The drop in inflation and wage growth are encouraging signs for the Fed, but labour market conditions remain tight. Recent easing in financial conditions and higher metal prices point towards a rebound in the manufacturing cycle, but the Fed cannot risk retightening labour markets too early when no real slack has been created. For now, most leading indicators remain firmly at recessionary levels, and we expect modest GDP contraction in the coming quarters, but the downturn could be shallower than previously thought. Some further easing in labour market conditions will still be needed for the rate cuts to materialise.
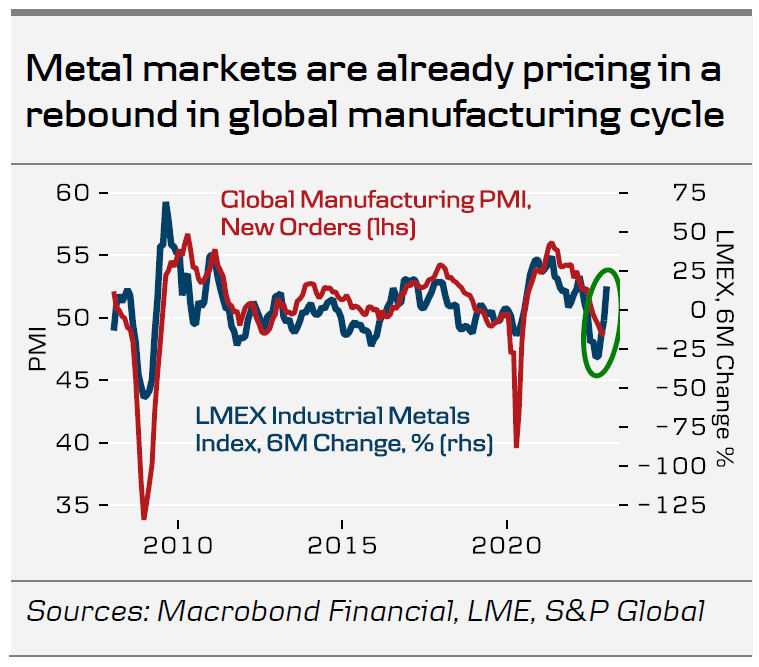
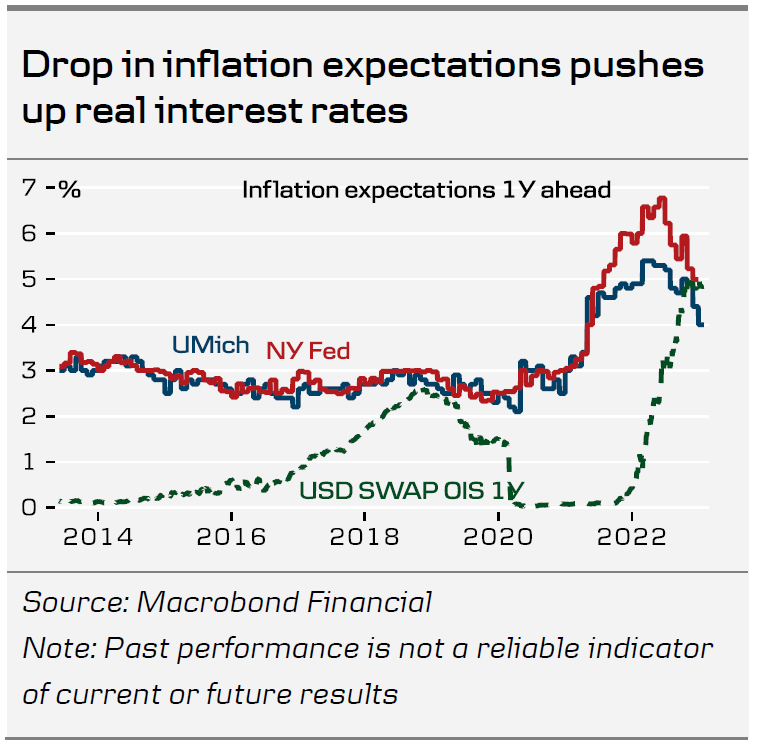
That said, the Fed could succeed in a soft landing, i.e. get inflation down to 2% and avoid a (deep) recession in the economy, which in our view would warrant rate cuts. A 5% policy rate is suitable, when inflation and inflation expectations are high, but not compatible with 2% inflation. Both market and consumer survey based short-term inflation expectations have declined recently, which means the Fed can lower its (nominal) policy rate and keep the real interest rate and thus monetary policy unchanged. The trend in short-term inflation expectations sets the pace and timing for the rate cuts even without a recession.
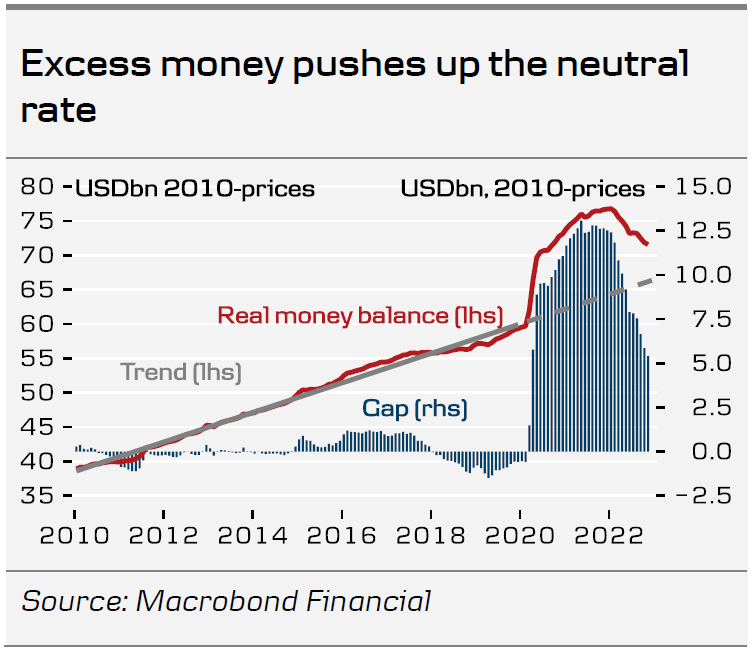
The neutral rate of interest in the US is higher now than before the crisis. There is still a real money balance surplus in the US. It requires the Fed to keep real interest rates higher to avoid a resurgence in inflation. If the neutral Fed funds rate was 2-2.5% before the crisis, it might now be 2.5-3%. It dictates the end-point for future rate cuts.
The market discounts the Fed to hike Fed funds to 4.9% in June and lower it to 2.5% in the coming 2-3 years. We think the trajectory looks broadly fair, but see upside to the front end of the curve and in particular 6M-2Y, i.e. we expect rates to peak at slightly higher level, for the Fed to first cut rates in 2024 and probably not all the way to 2.5%. This is a soft landing scenario for interest rates, where the US gets away with mild recession or avoids it completely. If inflation starts to rebound (e.g. on the back of the recent rally in commodity prices), the Fed may have to keep Fed funds at 5% or higher for longer. If labour market conditions suddenly deteriorate and inflation plunges, rate cuts would come sooner.
Sunset Market Commentary
Markets
Positive risk vibes coming from WS yesterday and Asia this morning, triggered a positive start in Europe as well. The single currency profited, with EUR/USD reaching for the 1.09 handle. Opening moves occurred in the run-up to EMU January PMI releases. Recall that markets since November reacted asymmetric to economic releases. They embraced negative economic surprises and below-consensus inflation prints. Both from the point of view that these would stop central banks from executing their monetary policy normalization plans. It led to the current situation where market positioning is completely misaligned with central bank guidance. Markets are betting on a lower policy rate peak than central banks suggest while simultaneously betting on a soon (<6 months) policy reversal once rates hit those peak levels. Central banks stress the opposite: don’t expect any rate cuts say in the next 12 months after hitting the peak. It’s important to keep this situation sketch in mind when looking at today’s EMU PMI’s and the market reaction. Both EMU manufacturing (48.8 from 47.8) and services PMI (50.7 from 49.8) beat consensus with the composite number (50.2 from 49.3) moving back above the 50 boom/bust handle for the first time since June 2022. S&P Global, responsible for the surveys, dedicated the tentative return to growth to markedly improving prospects for the year ahead with order books meanwhile showing reduced rates of contraction. Employment growth also picked up momentum as firms prepared for a better than previously expected year ahead. The PMI survey adds to evidence that the EMU could escape a recession with the nadir being reached back in October. Falling energy prices, easing supply chain stress and the Chinese reopening restored confidence since though we’re not out of the woods yet. Average selling prices for both goods and services ticked higher, reflecting still-elevated cost growth and upward wage pressure. Those strengthen the case for monetary policy makers to pursue more normalisation/tightening in their inflation crusade. For the first in a long time, that’s how European markets reacted post-PMI’s. Although the move lacked real strength, it was clearly directional. The EuroStoxx50 trades 0.7% off its intraday high. European bonds – who already sold off in recent sessions – grinded a few ticks lower. EUR/USD fell back to 1.0860. EUR/GBP surged from 0.8770 to 0.8840 with sterling weakness stemming from disappointing PMI’s (composite 47.8 from 49). US January PMI’s beat consensus as well, rebounding slightly more than forecast. The composite measure increases from 45 to 46.6 (still way into contraction territory). In a first reaction, US yields and the dollar gain a few ticks, as does – somewhat counterintuitive – US stocks. Moves remain very limited in absolute terms.
News & Views
The German government is due to lift its 2023 GDP projection from a 0.4% contraction to a 0.2% expansion, Bloomberg reported citing people familiar with the new forecasts. Growth for next year is seen at 1.8% from 2.3% earlier. The previous forecasting round dates back from October. At the time, fears for an energy crunch during the winter ran high and installed a mood of doom and gloom. An unusually warm winter helped cut gas/energy consumption and, combined with diversifying supplies, have eased much of those concerns. Economy minister Habeck will present the updated projections tomorrow.
Hungary’s central bank (MNB) kept the base rate steady at 13%. The MNB has said before that this level is adequate to manage fundamental inflation risks. Inflation rose to 24.5% in December due to a pick-up in fuel prices but should start to ease slowly in the first half of 2023. But still-elevated inflation expectations require a tight monetary policy for a prolonged period. To enhance monetary policy transmission, it will further absorb interbank liquidity through, amongst others, its one-day deposit quick tenders for which the rate is set at 18%. The MNB vowed to maintain the current terms of these emergency measures introduced in mid-October “until a trend improvement in risk perceptions occurs”. Some forint investors doubted the MNB’s commitment, thinking the central bank would be lured by the recent easing in global financial conditions to cut the 18% shadow policy rate already. Together with the doubling in the required reserve ratio to 10%, the Hungarian currency rallied. EUR/HUF fell from 398 to the recent lows around 392 currently. Most Hungarian swap yields pared losses of as much as 25 bps to trade 5-10 bps lower.
US PMI composite rose to 46.6, started 2023 on a disappointingly soft note
US PMI Manufacturing rose from 46.2 to 46.8 in January. PMI Services rose from 44.7 to 46.6. PMI Composite rose from 45.0 to 46.6.
Chris Williamson, Chief Business Economist at S&P Global Market Intelligence said:
"The US economy has started 2023 on a disappointingly soft note, with business activity contracting sharply again in January. Although moderating compared to December, the rate of decline is among the steepest seen since the global financial crisis, reflecting falling activity across both manufacturing and services.
"Jobs growth has also cooled, with January seeing a far weaker increase in payroll numbers than evident throughout much of last year, reflecting a hesitancy to expand capacity in the face of uncertain trading conditions in the months ahead. Although the survey saw a moderation in the rate of order book losses and an encouraging upturn in business sentiment, the overall level of confidence remains subdued by historical standards. Companies cite concerns over the ongoing impact of high prices and rising interest rates, as well as lingering worries over supply and labor shortages.
"The worry is that, not only has the survey indicated a downturn in economic activity at the start of the year, but the rate of input cost inflation has accelerated into the new year, linked in part to upward wage pressures, which could encourage a further aggressive tightening of Fed policy despite rising recession risks."