Sample Category Title
Technical Outlook and Review
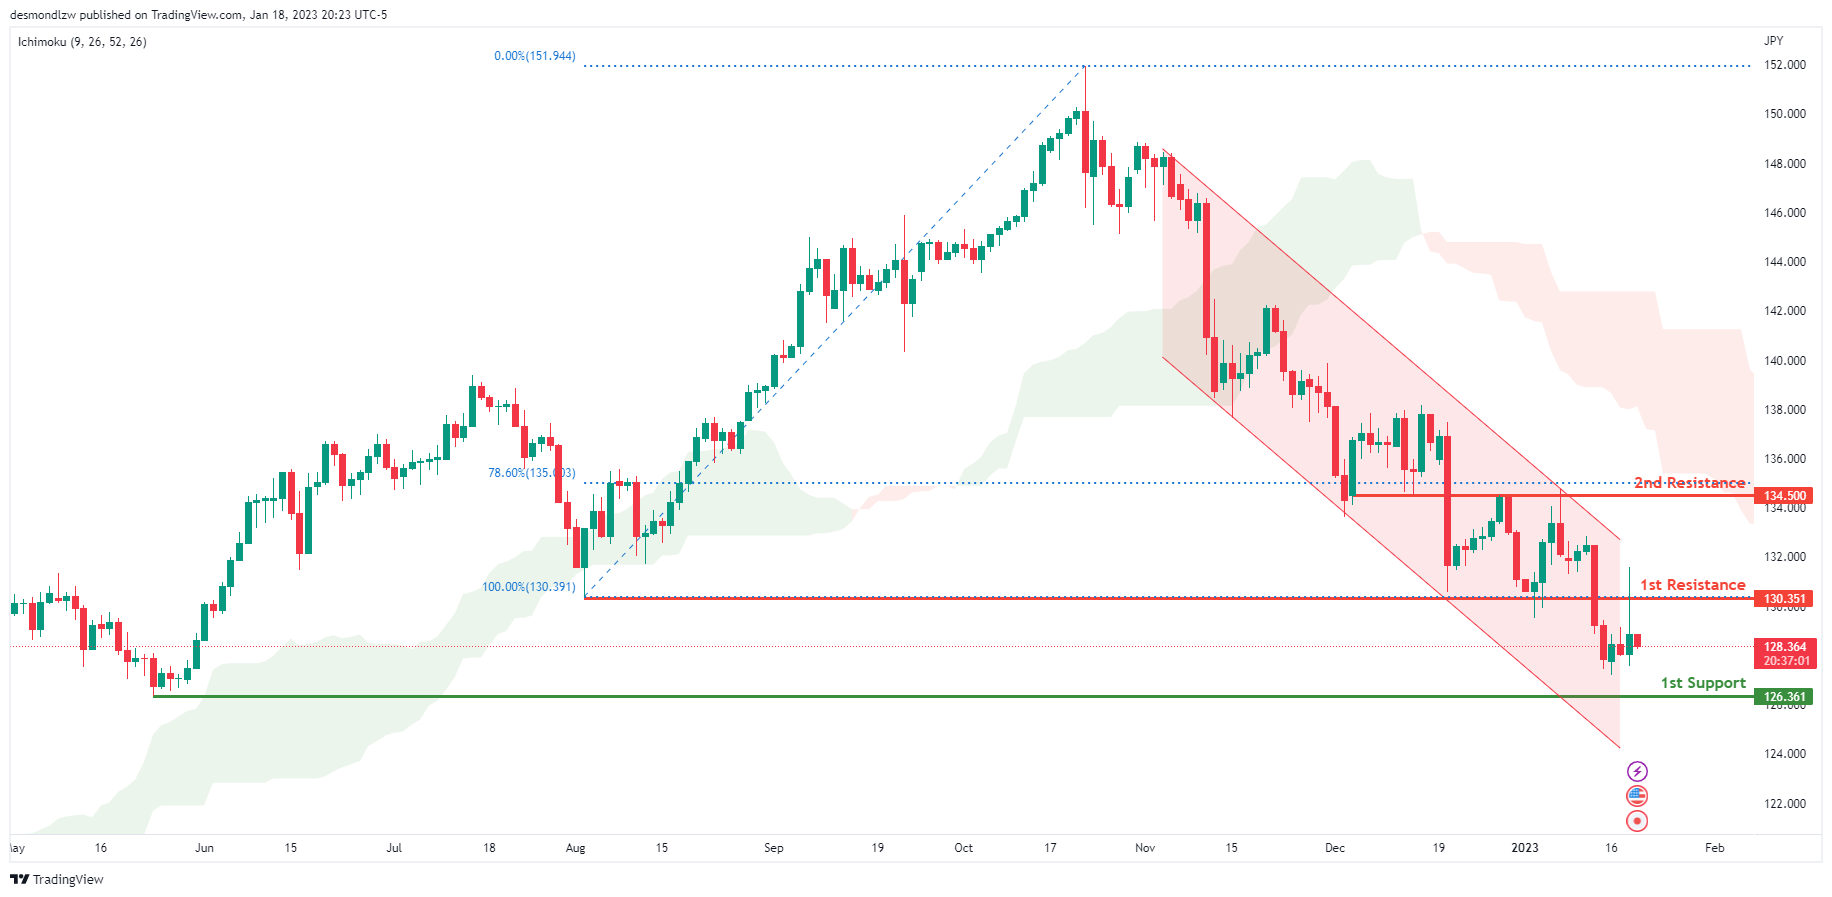
USD/JPY:
Looking at the Daily chart, my overall bias for USDJPY is bearish due to the current price being below the Ichimoku cloud, indicating a bearish market. To add confluence to this bias, price is also within a descending channel. If this bearish momentum continues, expect the price to possibly continue heading towards the 1st support level at 126.361, where the previous swing low is. In an alternate scenario, price could possibly head back up to retest the 1st resistance at 130.351, where the previous swing low is.
Areas of consideration:
- H4 time frame, 1st resistance at 130.351
- H4 time frame, 1st support at 126.361
DXY:
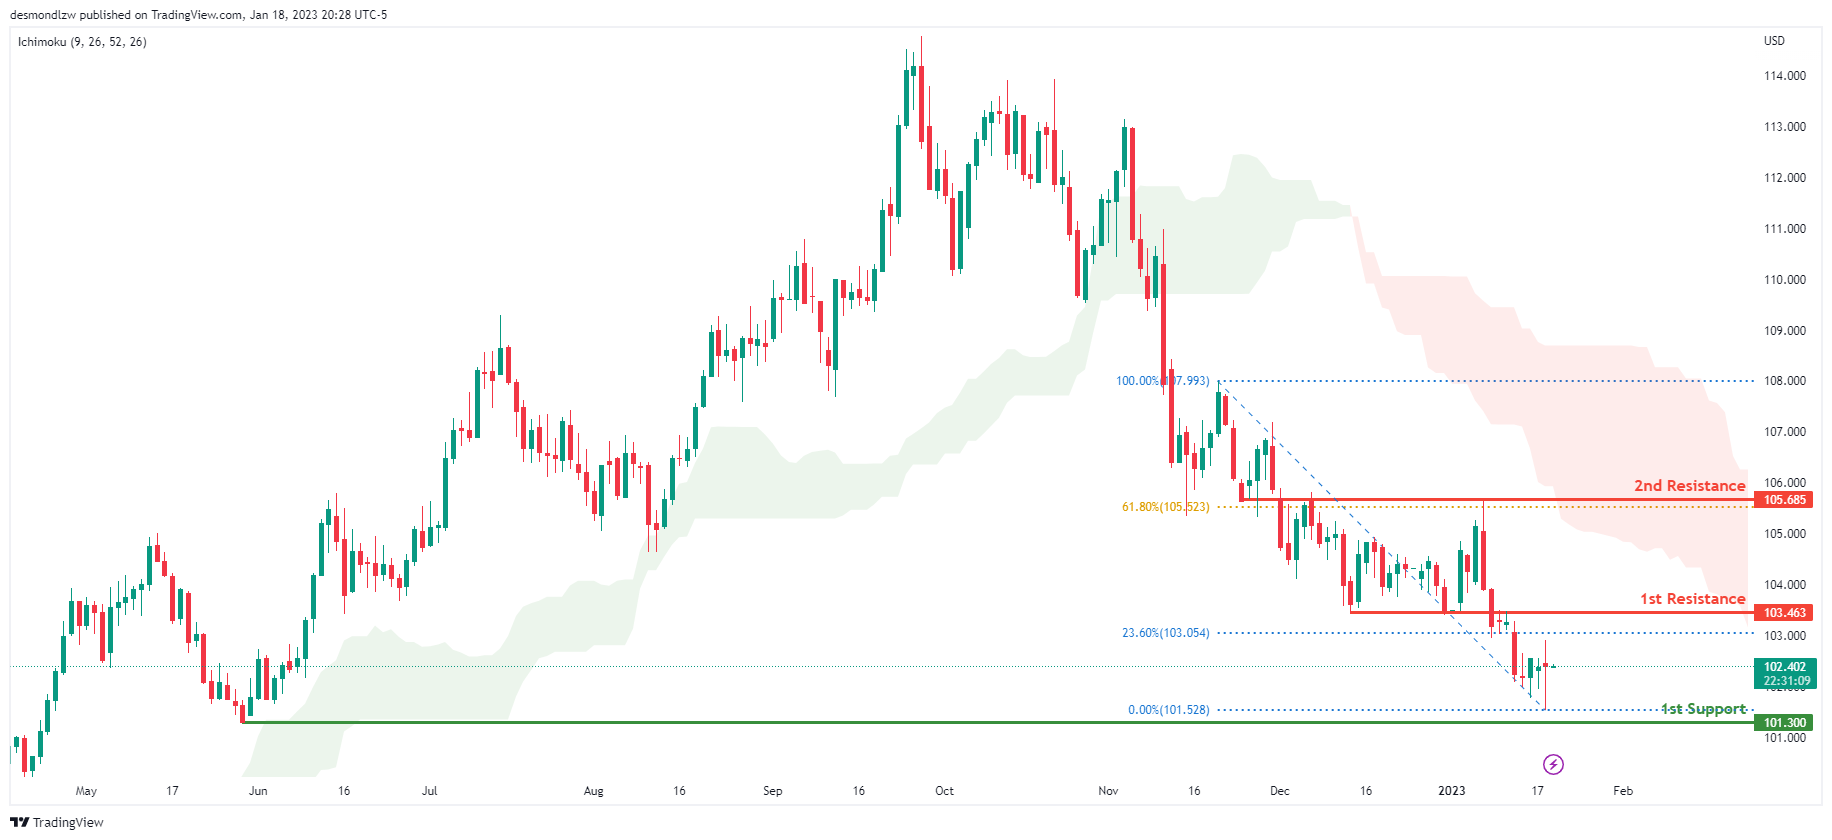
Looking at the Daily chart, my overall bias for DXY is bearish due to the current price being below the Ichimoku cloud, indicating a bearish market. If this bearish momentum continues, expect the price to possibly continue heading towards the 1st support at 101.300, where the previous low is. . In an alternative scenario, price could head back up to retest the 1st resistance at 103.463, where the 23.6% Fibonacci line is.
Areas of consideration:
- H4 time frame, 1st resistance at 103.463
- H4 time frame, 1st support at 101.300
EUR/USD:
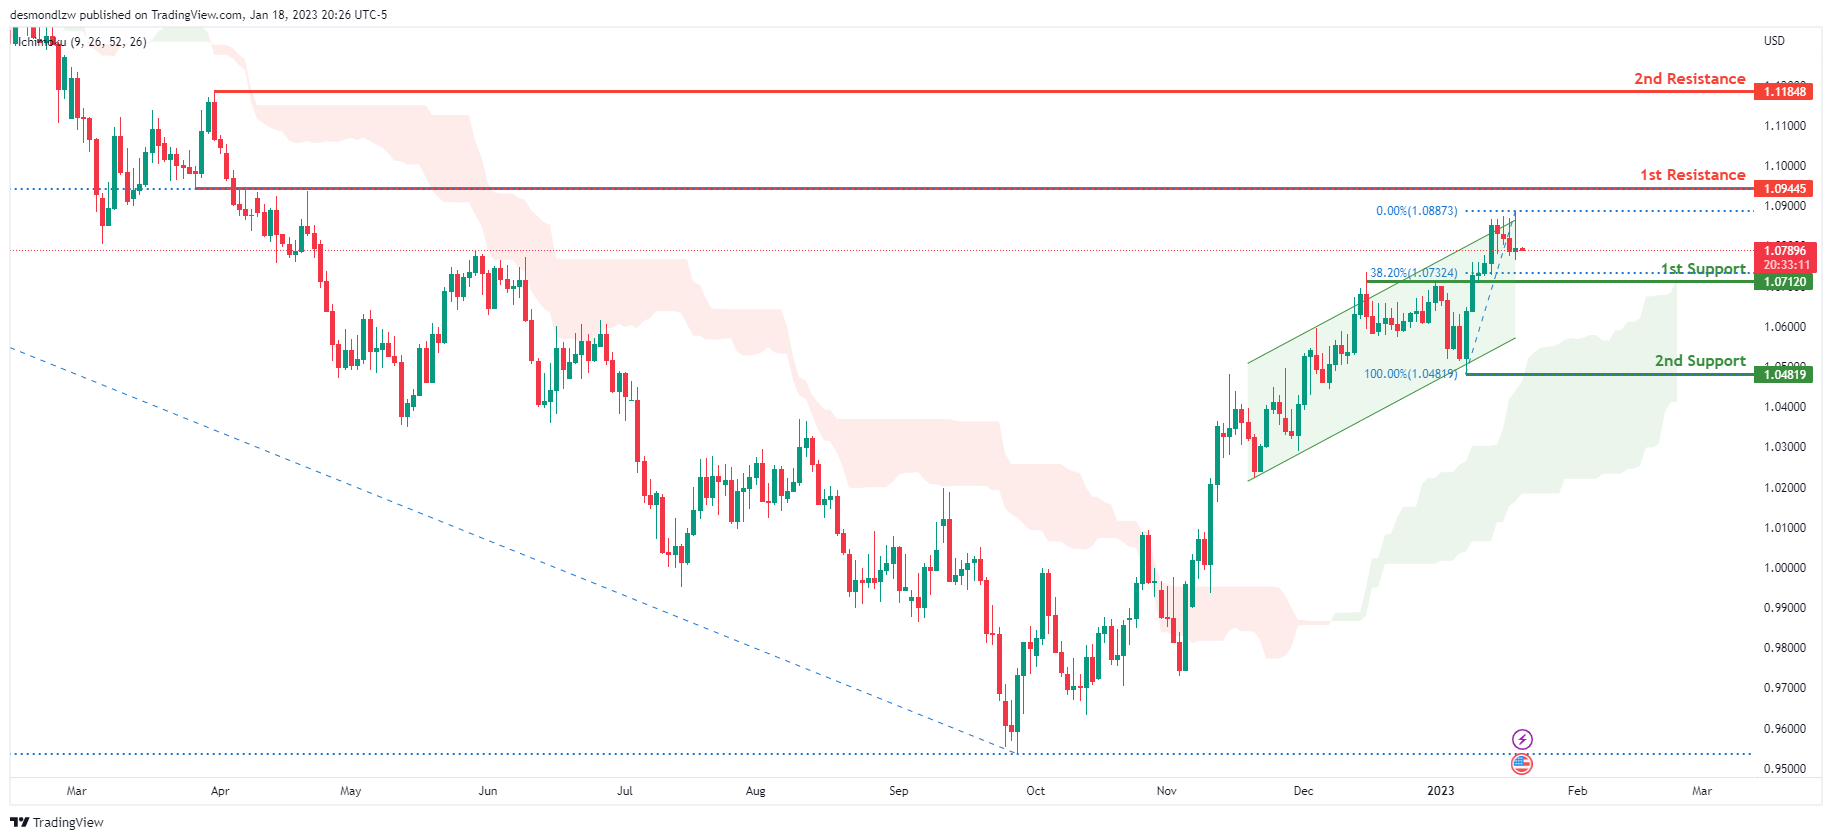
Looking at the Daily chart, my overall bias for EURUSD is bullish due to the current price being above the Ichimoku cloud, indicating a bullish market structure. To add confluence to this bias, price is also within an ascending channel. If this bullish momentum continues, expect the price to possibly continue heading towards the 1st resistance at 1.09445, where the 50% Fibonacci line is. In an alternate scenario, price could possibly head back down to retest the 1st support level at 1.07120, where the 38.2% Fibonacci line is.
Areas of consideration :
- H4 1st resistance at 1.09445
- H4 1st support at 1.07120
GBP/USD:
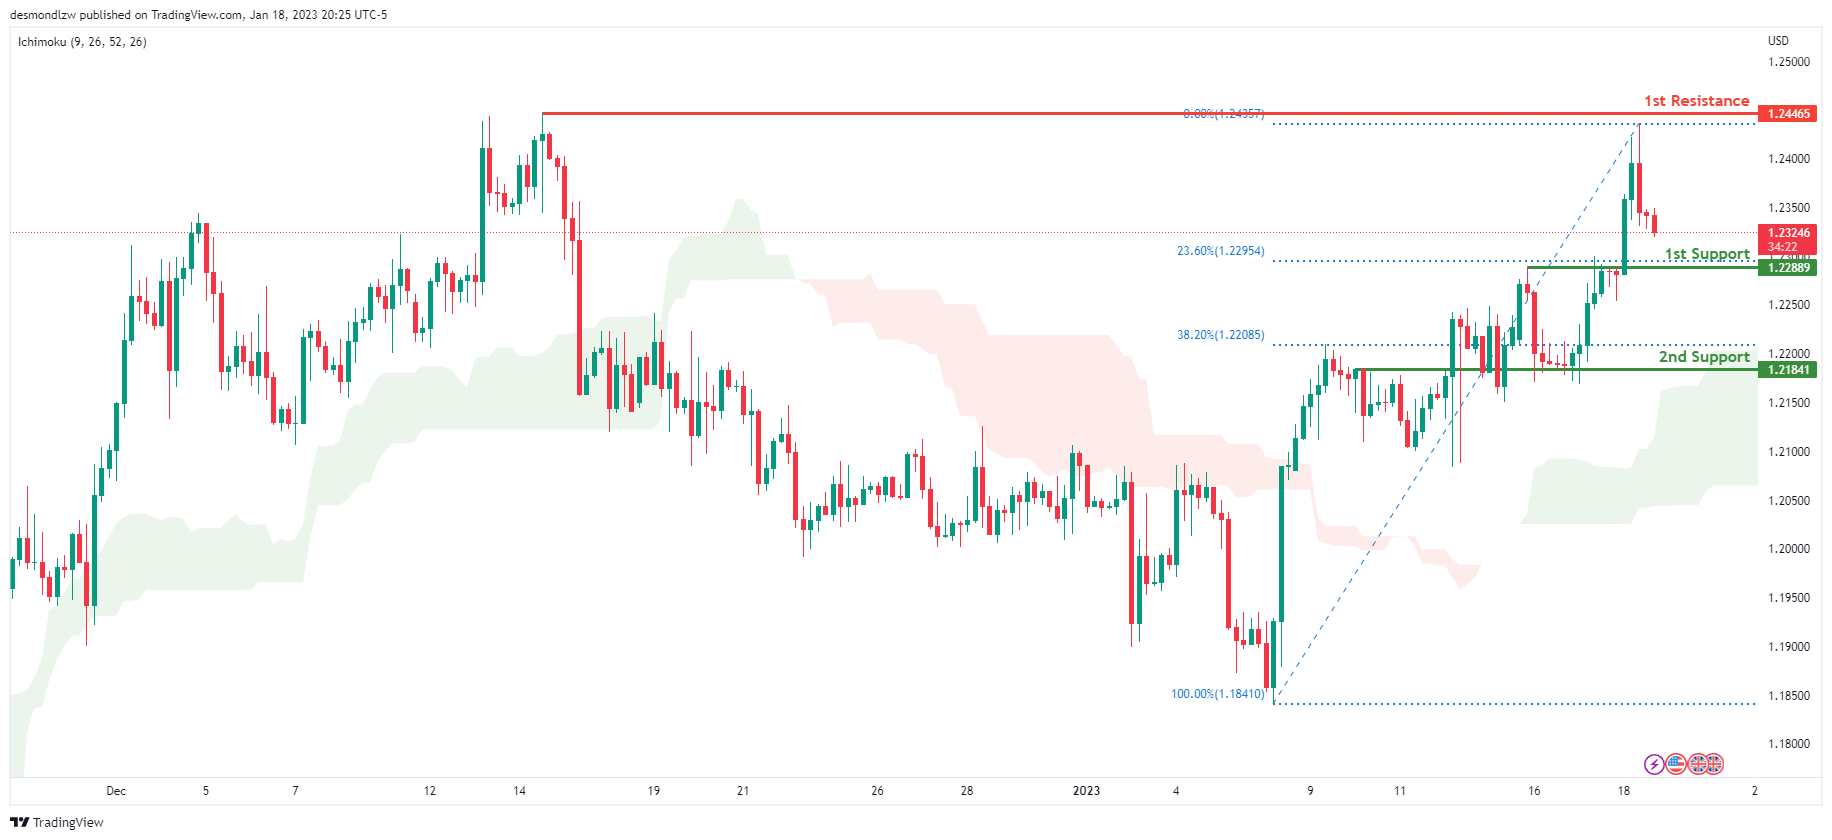
Looking at the H4 chart, my overall bias for GBPUSD is bullish due to the current price being above the Ichimoku cloud, indicating a bullish market. If this bullish momentum continues, expect price to possibly continue heading towards the 1st resistance line at 1.24465, where the previous swing high is. In an alternate scenario, price could possibly head back down and retest the 1st support at 1.22889, where the 23.6% Fibonacci line is.
Areas of consideration:
- H4 1st resistance at 1.24465
- H4 1st support at 1.22889
USD/CHF:
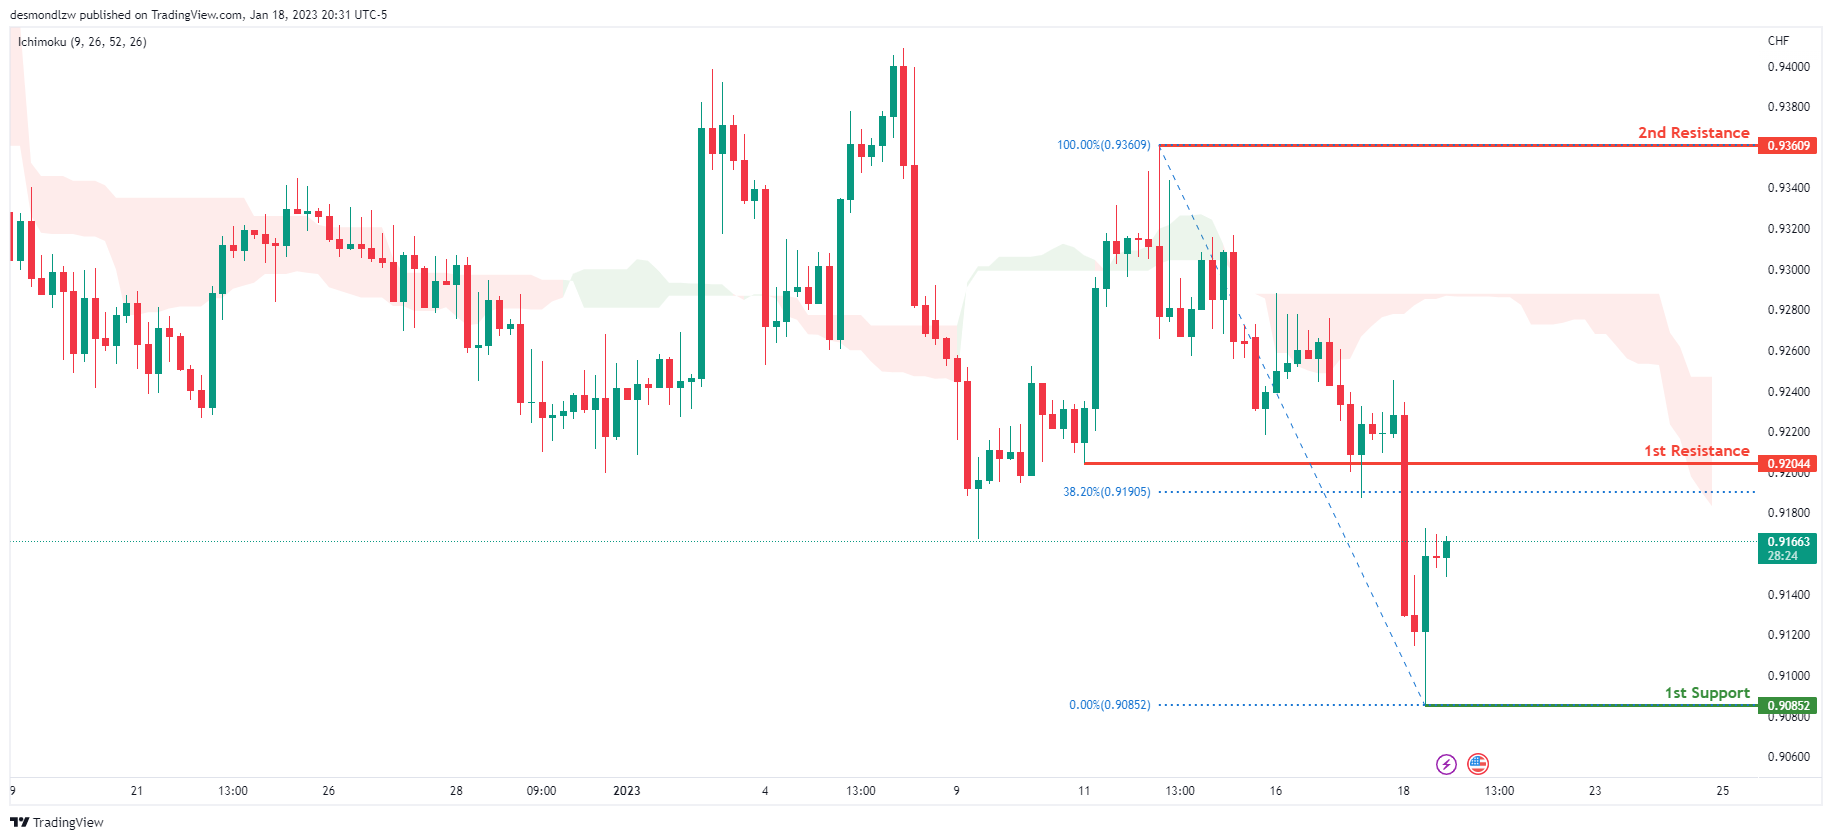
Looking at the H4 chart, my overall bias for USDCHF is bearish due to the current price crossing below the Ichimoku cloud, indicating a bearish market. If the current bearish trend continues, expect the price to possibly continue to head towards the 1st support at 0.90852, where the recent low is. In an alternative scenario, price could possibly head back up to retest the 1st resistance at 0.92044, where the 38.2% Fibonacci line is.
Areas of consideration
- H4 1st support at 0.90852
- H4 1st resistance at 0.92044
XAU/USD (GOLD):
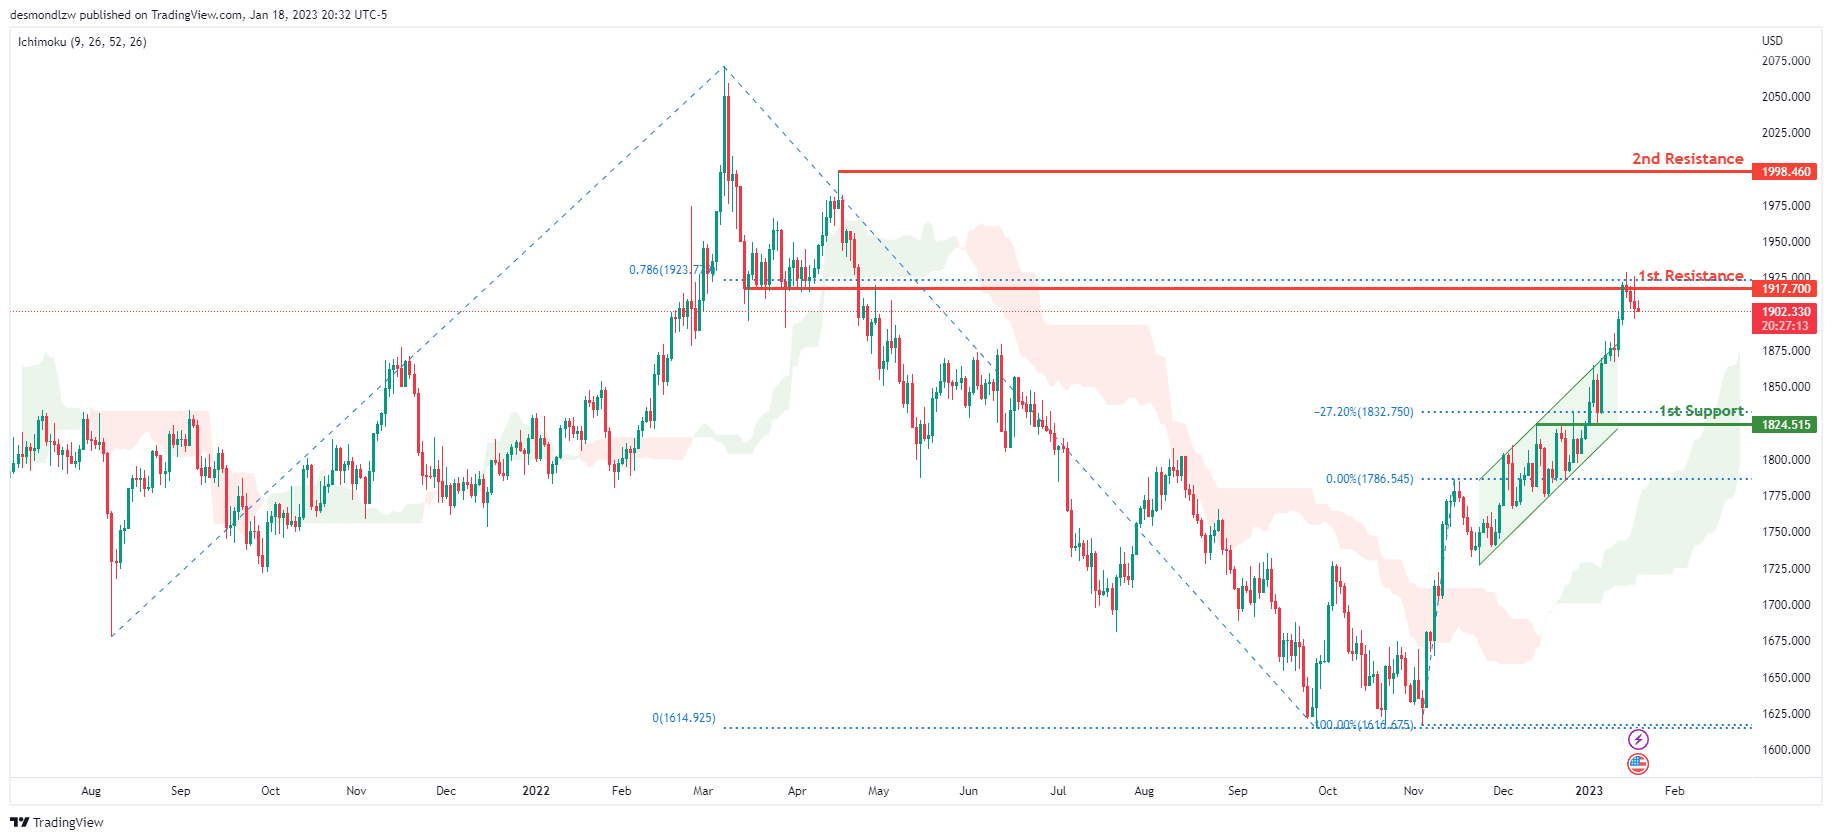
Looking at the Daily chart, my overall bias for XAUUSD is bullish due to the current price crossing above the Ichimoku cloud, indicating a bullish market. To add support to this bias, price has also broken above the bullish ascending channel. If this bullish momentum continues, expect the price to possibly break the 1st resistance at 1917.700 where the 78.6% Fibonacci projection line is, before heading towards the 2nd resistance at 1998.460, where the previous swing high is. In an alternative scenario, price could possibly head back down to retest the 1st support at 1824.515 where the -27.2% Fibonacci expansion line is.
Areas of consideration:
- H4 time frame, 1st resistance at 1917.700
- H4 time frame, 2nd resistance at 1998.460
- H4 time frame, 1st support at 1824.515
- H4 time frame, 2nd support at 1824.515
AUD/USD:
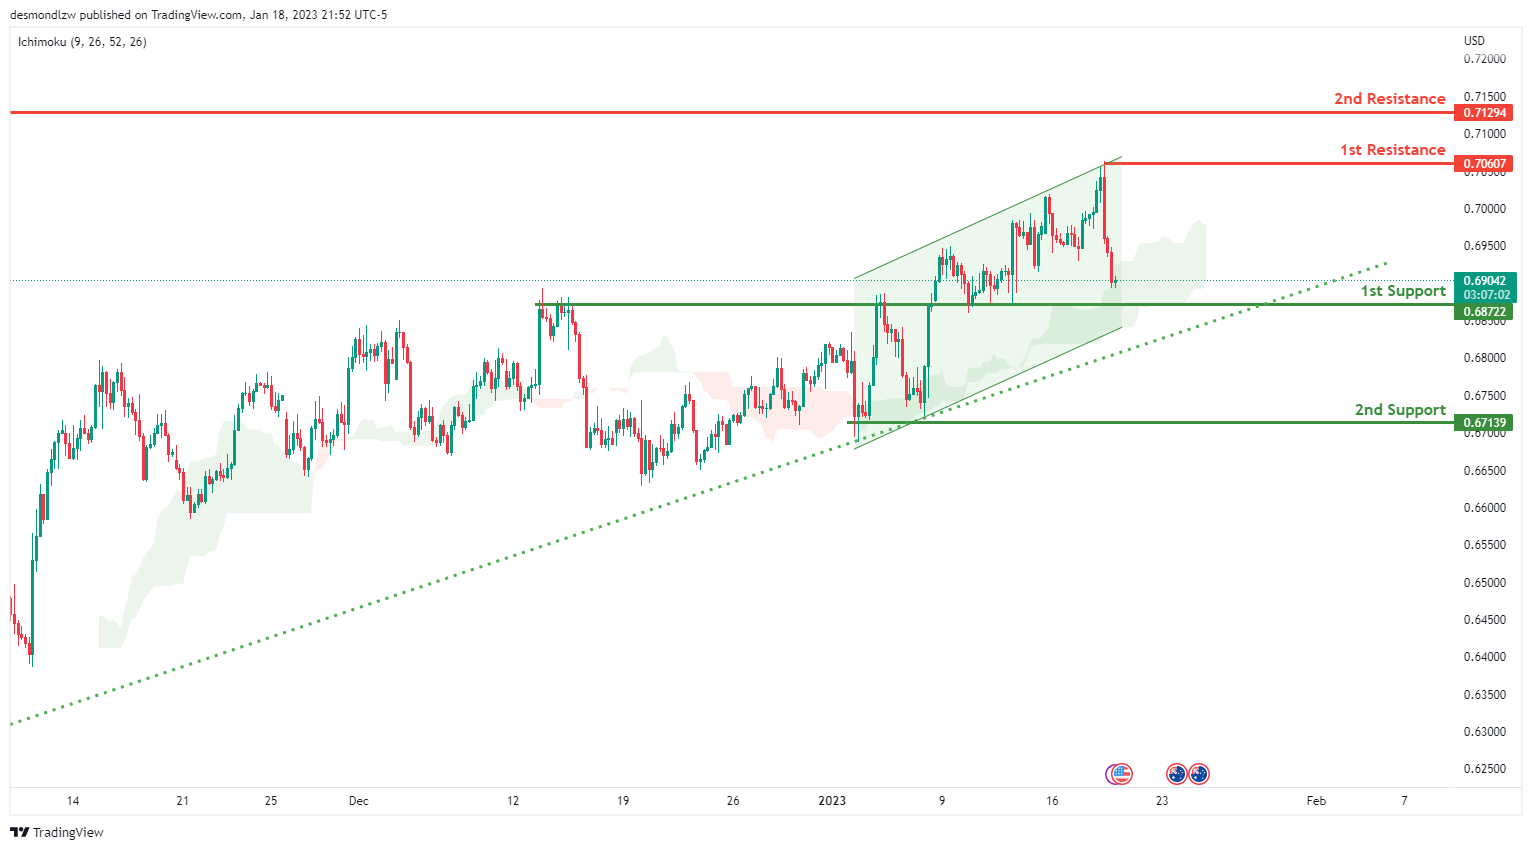
Looking at the H4 chart, we can see that the 1st support is at 0.68722 which is an overlap support. There is an ascending trend line that starts from 3rd JAN 2023 which suggests that there is bullish momentum. There is also an ascending channel. 1st resistance is at 0.70607 which is a recent swing high. 2nd resistance is slightly higher at 0.71294
Areas of consideration
- H4, 2nd resistance at 0.71294
- H2. 1st resistance at 0.70607
- H4, 1st support at 0.68722
- H4.2nd support at 0.67139
NZD/USD:
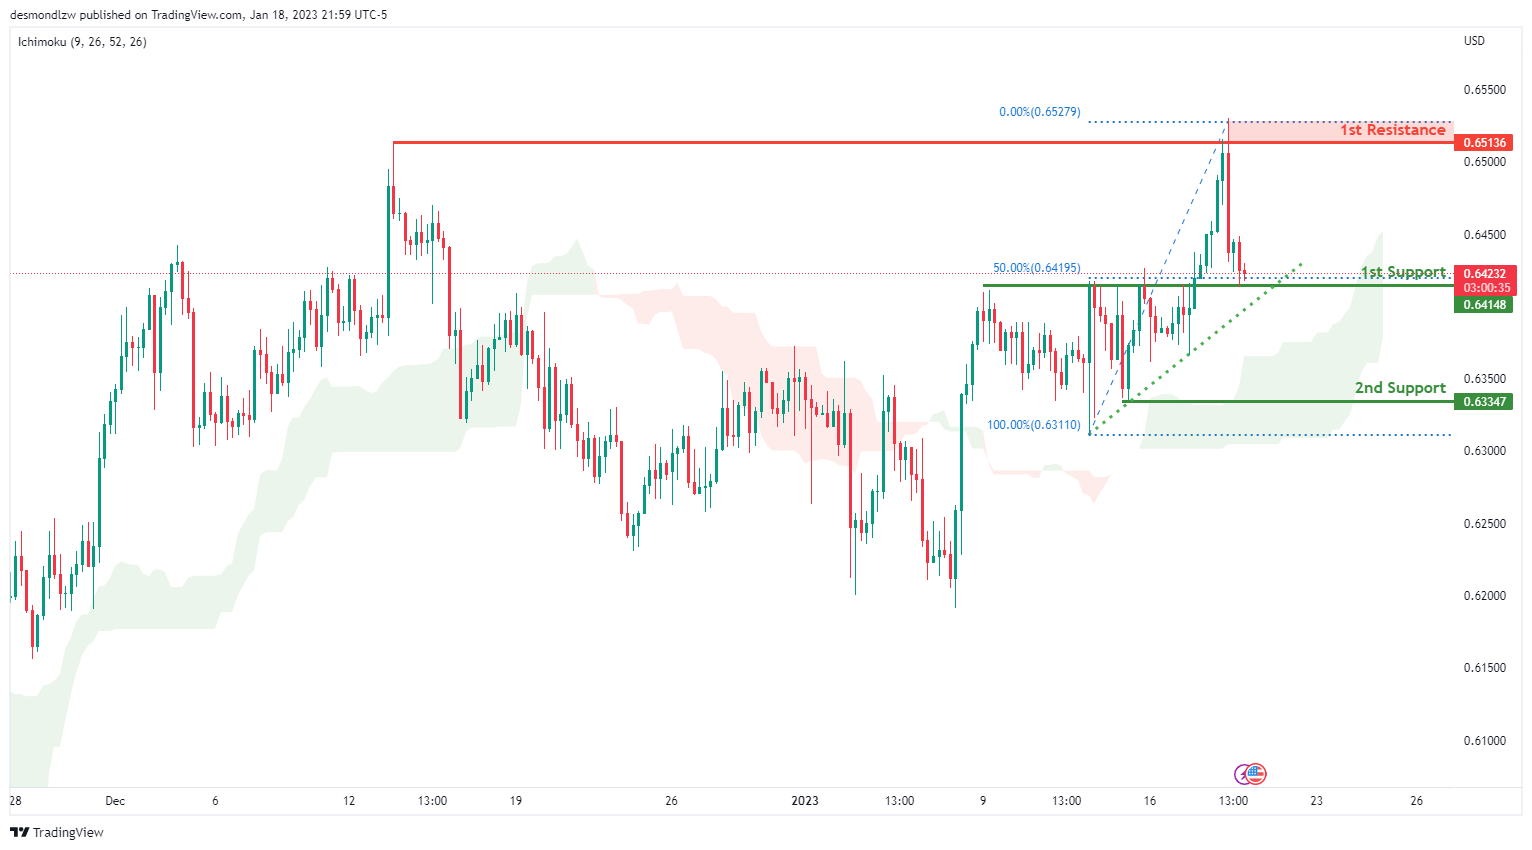
Looking at the H4 chart, we can see that the 1st support is at 0.64148 which is an overlap support which is in line with the 50% Fibonacci line. If price breaks this level, we could see it drop to 2nd support is down at 0.63347. As the current price is above the Ichimoku cloud, there is an ascending trend line , which suggests bullish momentum.
For the resistance, our 1st resistance is at 0.65136 which is a recent swing high resistance area.
Areas of consideration:
- H4 time frame, 1st resistance at 0.65136
- H4 time frame, 1st support at 0.64148
- H4 time frame, 2nd support at 0.63347
USD/CAD:
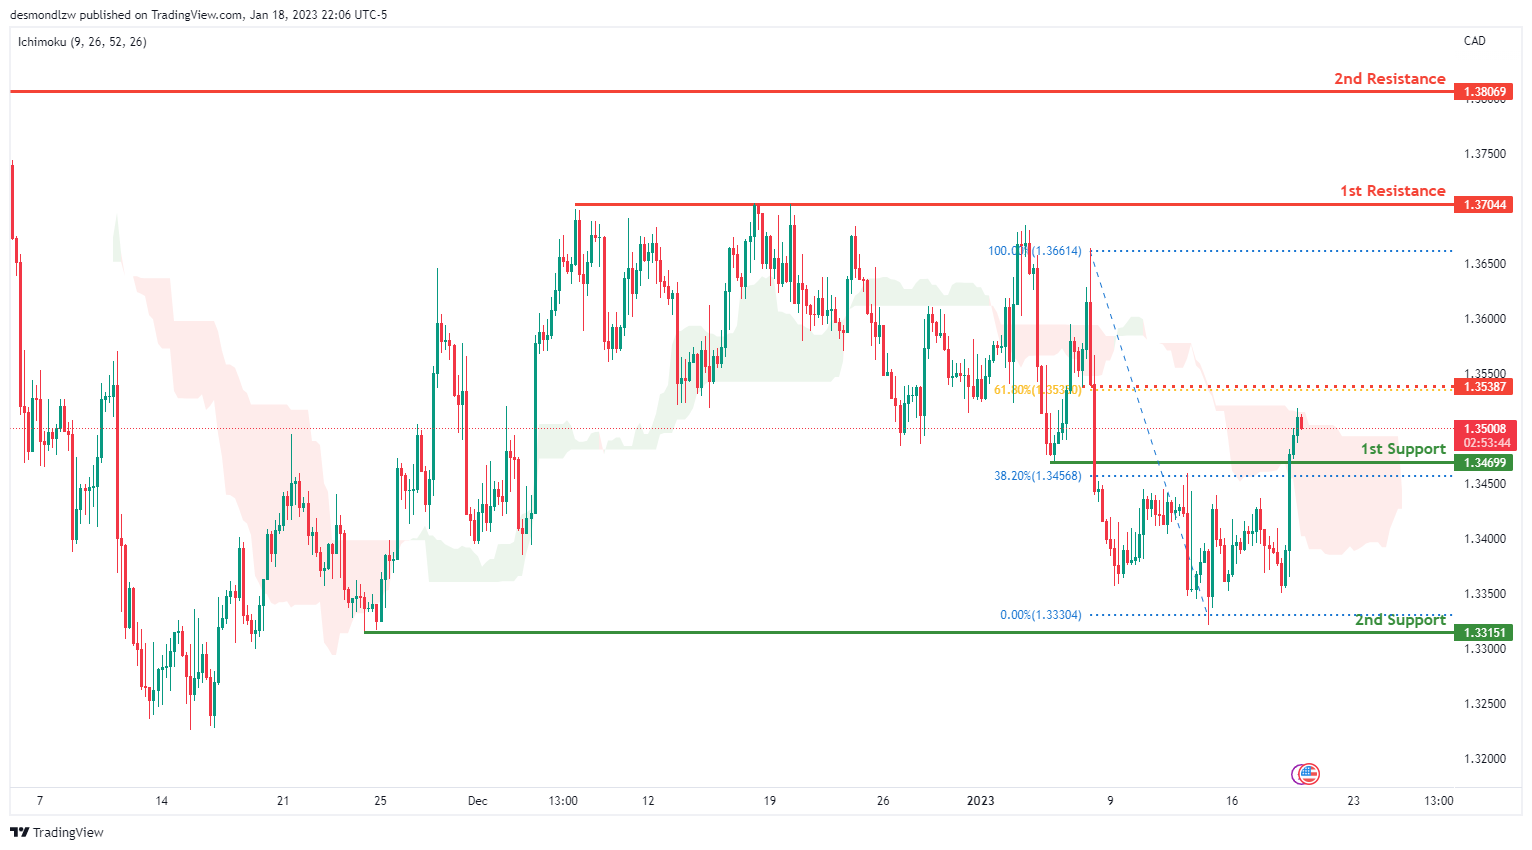
On the H4 chart, the 1st support is at 1.34699 which is an overlap support. The 1st support line also at 38.2% Fibonacci retracement. And the 2nd support 1.33151 which is the recent swing low .
In terms of resistance, the 1st resistance we can see is at 1.37044 which is the recent swing high. If the price breaks this level, it could go up to the 2nd resistance at 1.38069. There is an intermediate resistance line at 1,35387 which is in line with 61.8% Fibonacci retracement.
Areas of consideration:
- H4 time frame. 2nd resistance at 1.38069
- H4 time frame. Intermediate resistance at 1.35387
- H4 time frame, 1st resistance at 1.37049
- H4 time frame, 1st support at 1.34699
- H4 time frame, 2nd support at 1.33151
OIL:
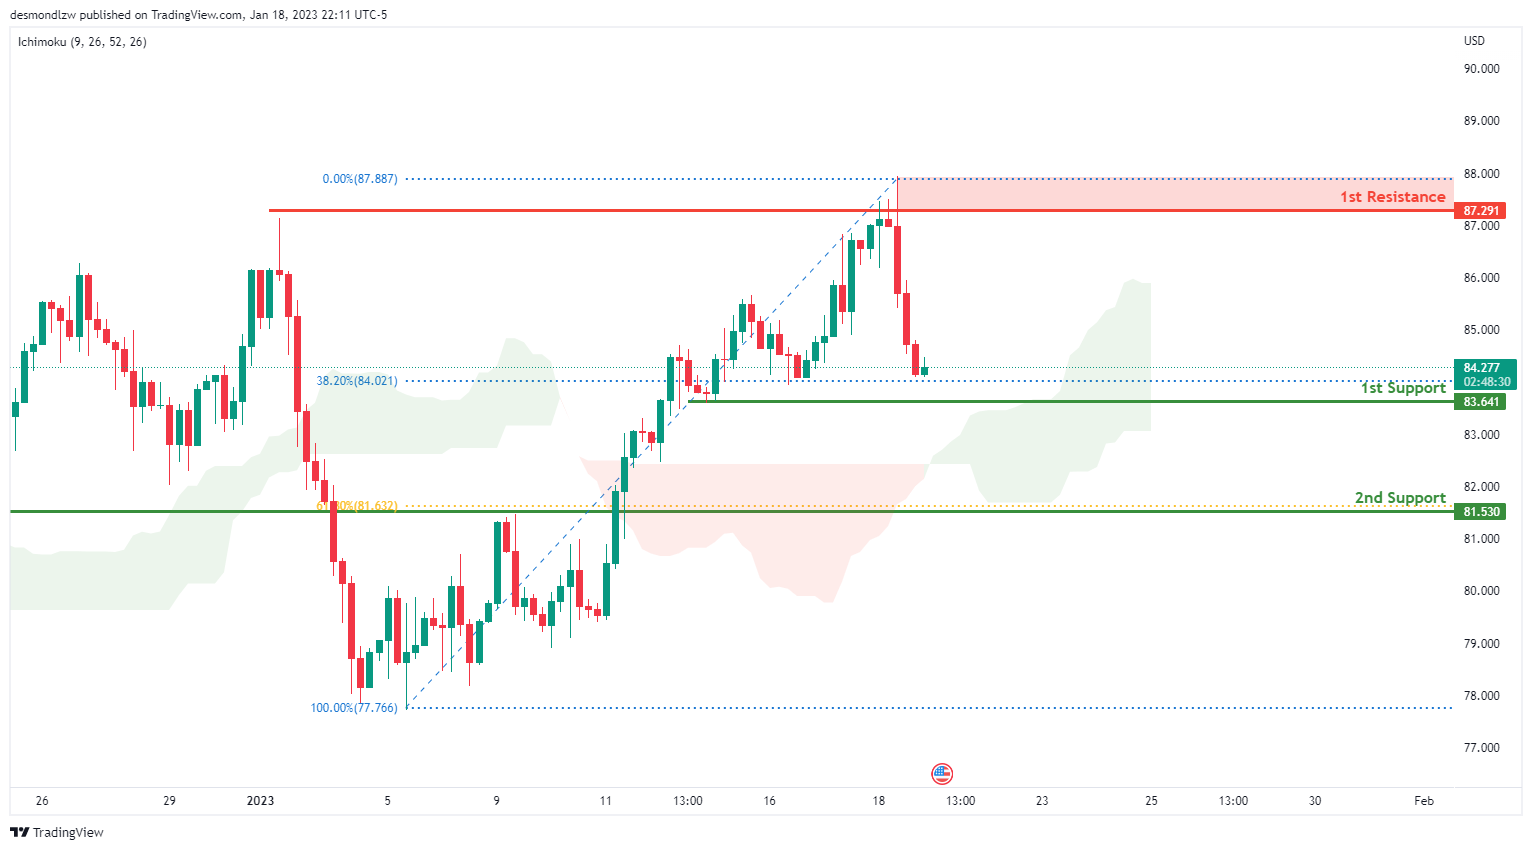
Looking at the H4 chart, we can see that the 1st resistance is at 87.291 which is an overlap area.
In terms of support, we can see our 1st support at 83.641 which is overlap support. It is also in line with 38.2% retracement. Breaking this level would trigger a further drop to our 2nd support at 81.530 where is line with 61.8% Fibonacci line.
Areas of consideration:
- H4 time frame, 1st resistance at 87.291
- H4 time frame,1st support at 83.641
- Hr time frame, 2nd support at 81.530
Dow Jones Industrial Average:
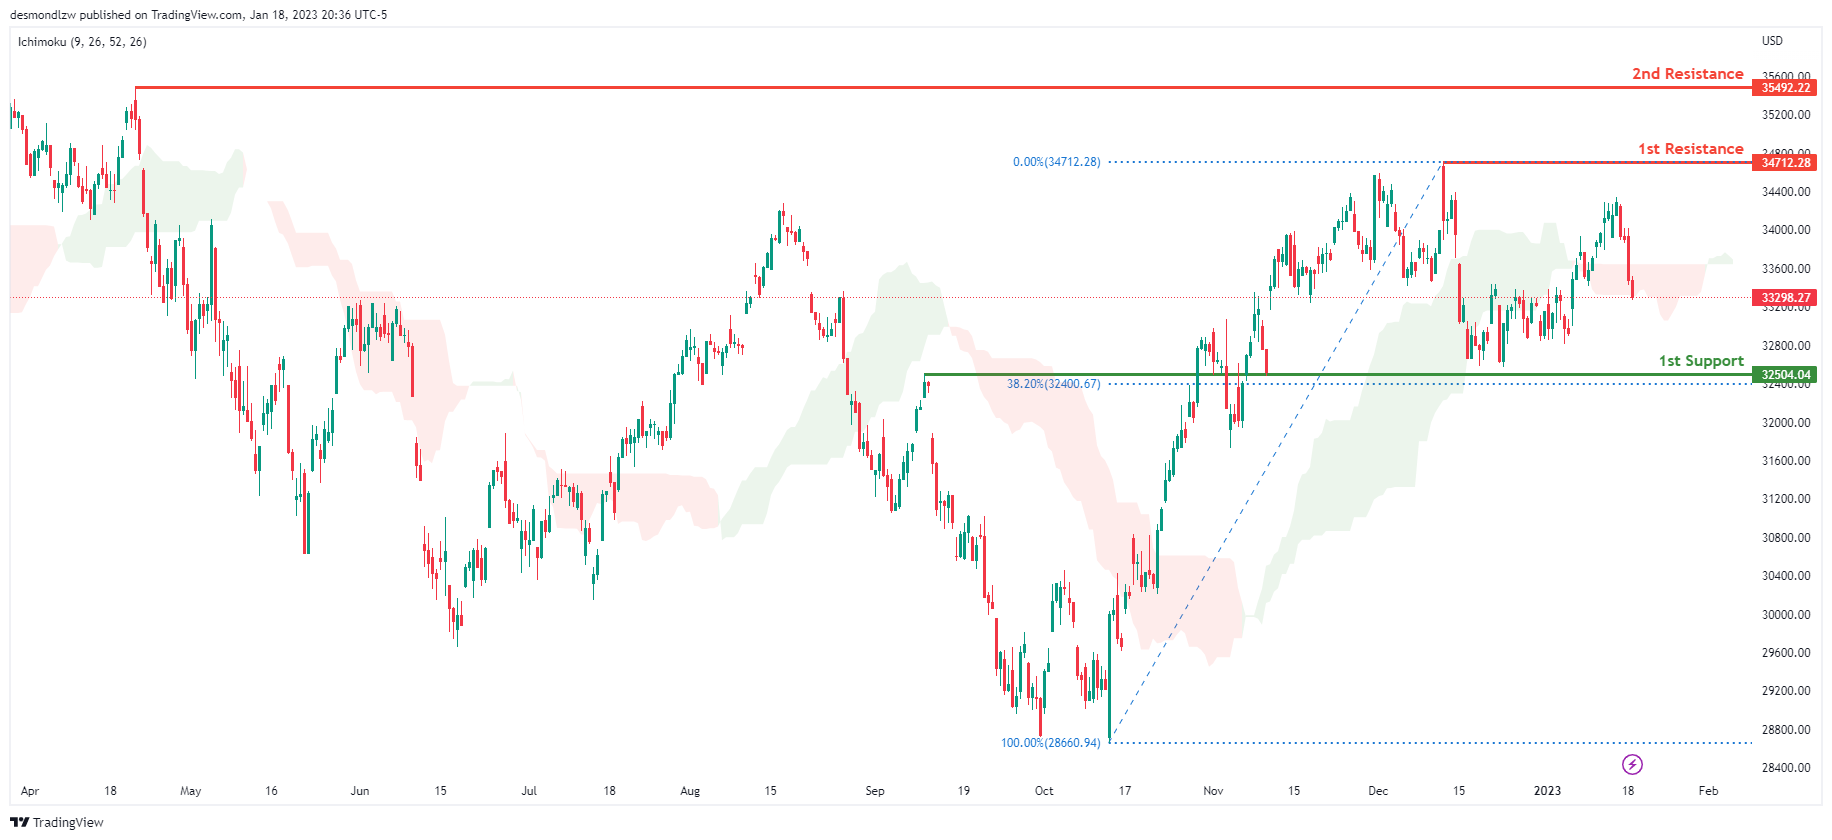
On the H4 chart, the overall bias for DJI is bullish. To add confluence to this, the price is crossing above the Ichimoku cloud which indicates a bullish market. If this bullish momentum continues, expect the price to possibly continue heading towards the 1st resistance line at 34712.28, where the recent swing high is. In an alternative scenario, price could possibly head back down towards the 1st support at 32581.97, slightly above where the 38.2% Fibonacci line is.
Areas of consideration:
- H4 time frame, 1st support at 32581.97
- H4 time frame, 1st Resistance at 34712.28
DAX:
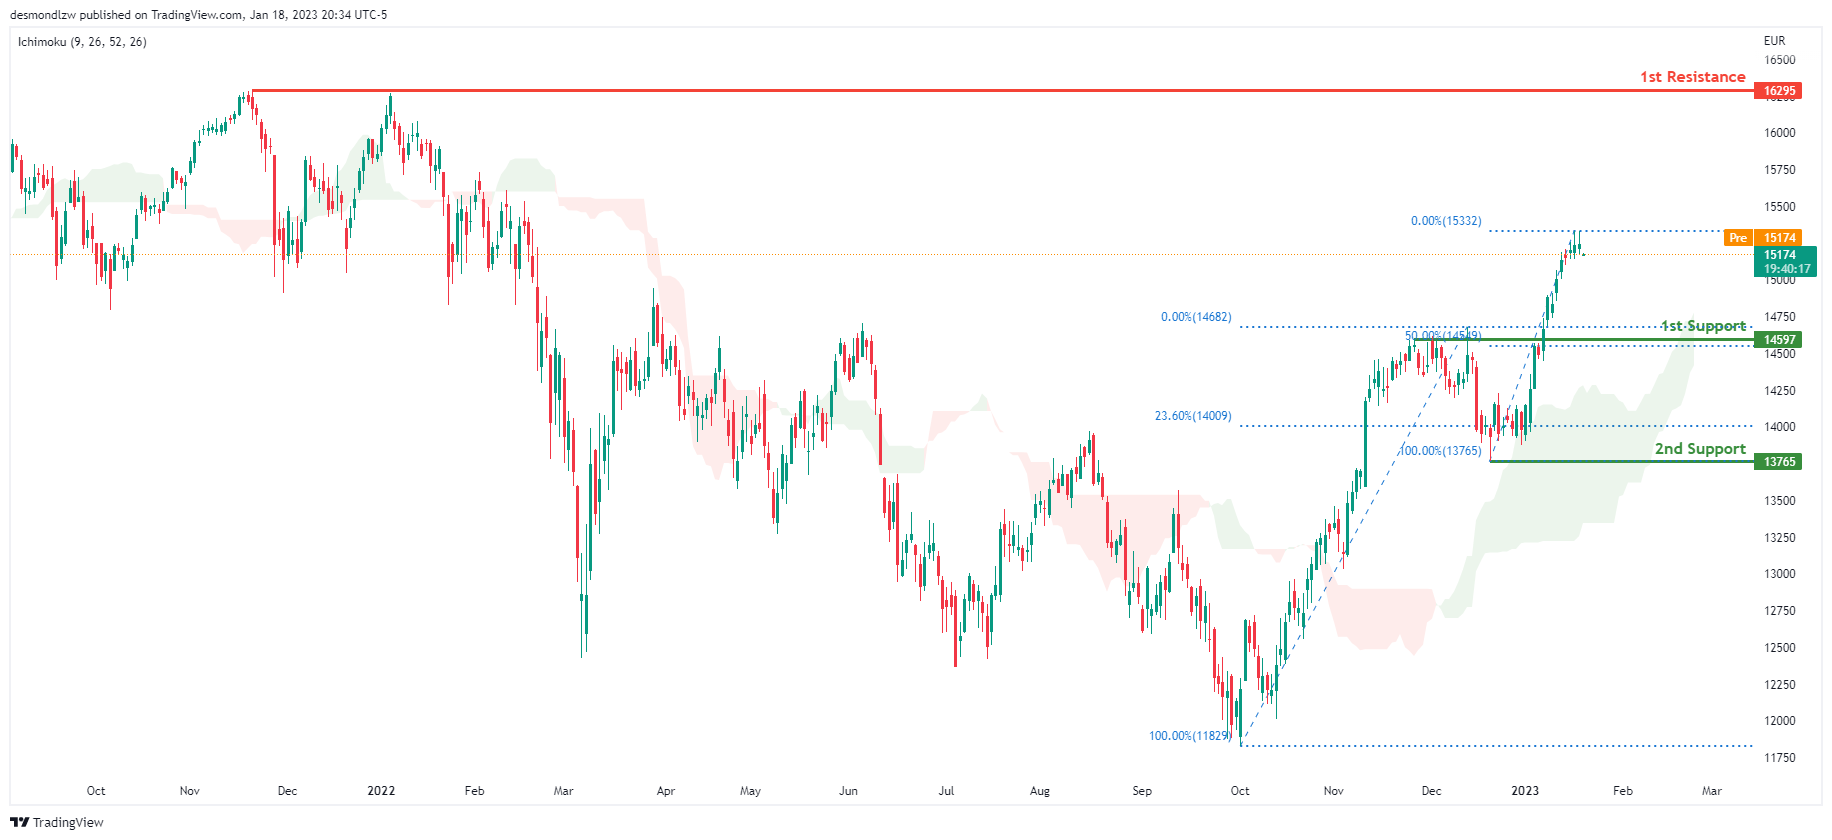
Looking at the Daily chart, my overall bias for DAX is bullish due to the current price crossing above the Ichimoku cloud, indicating a bullish market. If this bullish momentum continues, expect the price to possibly head towards the 1st resistance line at 16295, where the previous swing high is. In an alternative scenario, price could possibly head down to retest the 1st support at 14597, where the 50% Fibonacci line is.
Areas of consideration:
- H4 time frame, 1st resistance is at 16295
- H4 time frame, 1st support is at 14597
ETHUSD:
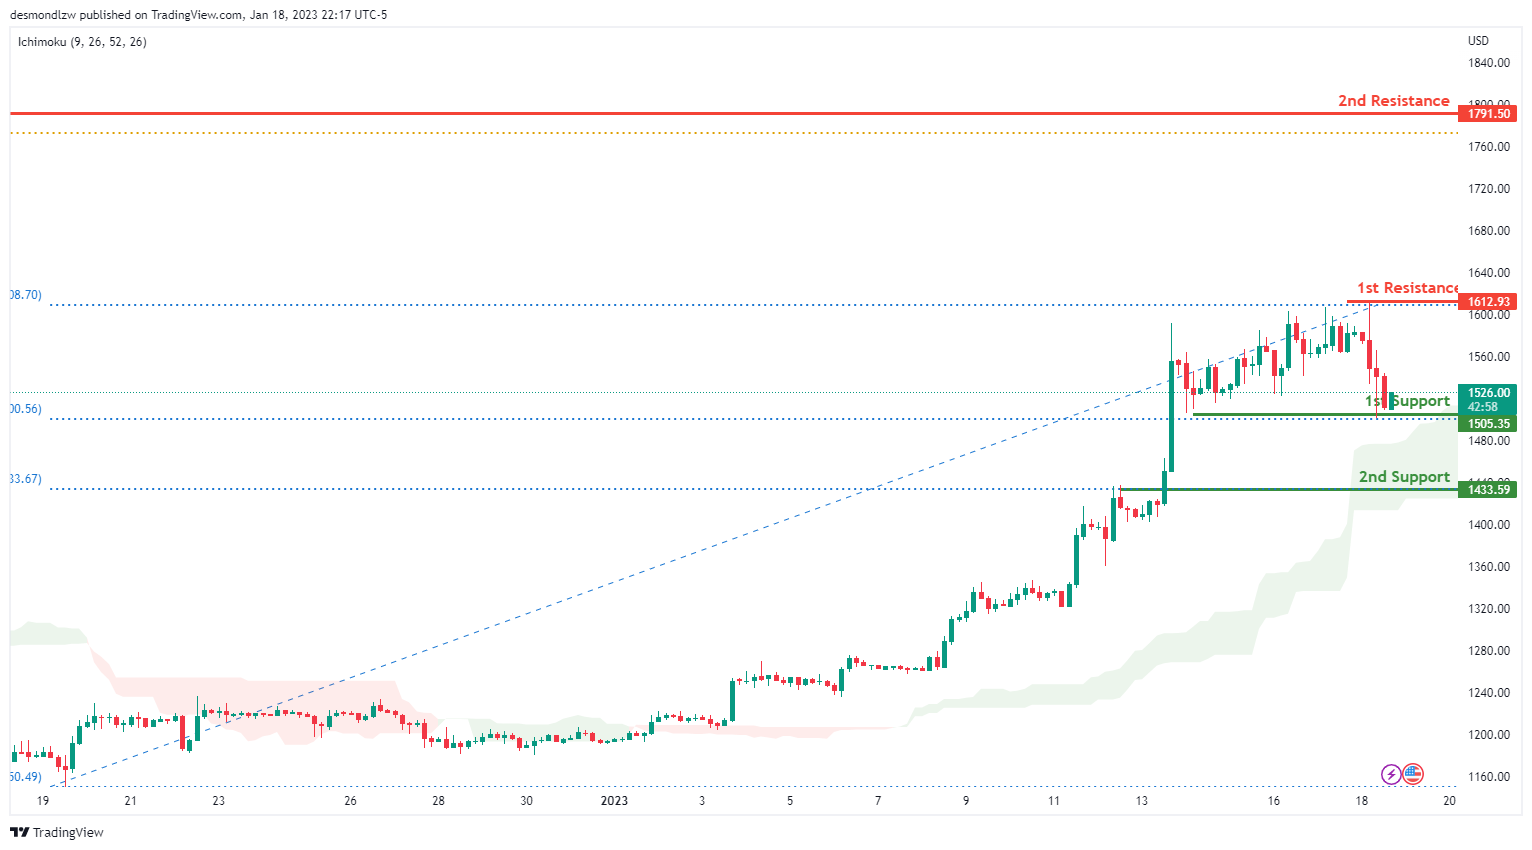
Looking at the H4 chart, my overall bias for ETHUSD is bullish due to the current price crossing above the Ichimoku cloud, indicating a bullish market. If this bullish momentum continues, expect the price move to the 1st support at 1150.49 which is recent overlap swing low. It is also in line with the 23.6% Fibonacci line And it may head to the 1st resistance at 1612.93 where the previous swing high is. In an alternative scenario, if the price break through the 1st support line, the price may further down to the 2nd support line 1433.59 where is 38.2% Fibonacci line is.
Areas of consideration:
- H4 time frame, 1st resistance of 1791.50
- H4 time frame, 1st resistance of 1612.93
- H4 time frame, 1st support at 1150.49
- H4 time frame, 2nd support at 1433.59
BTCUSD:
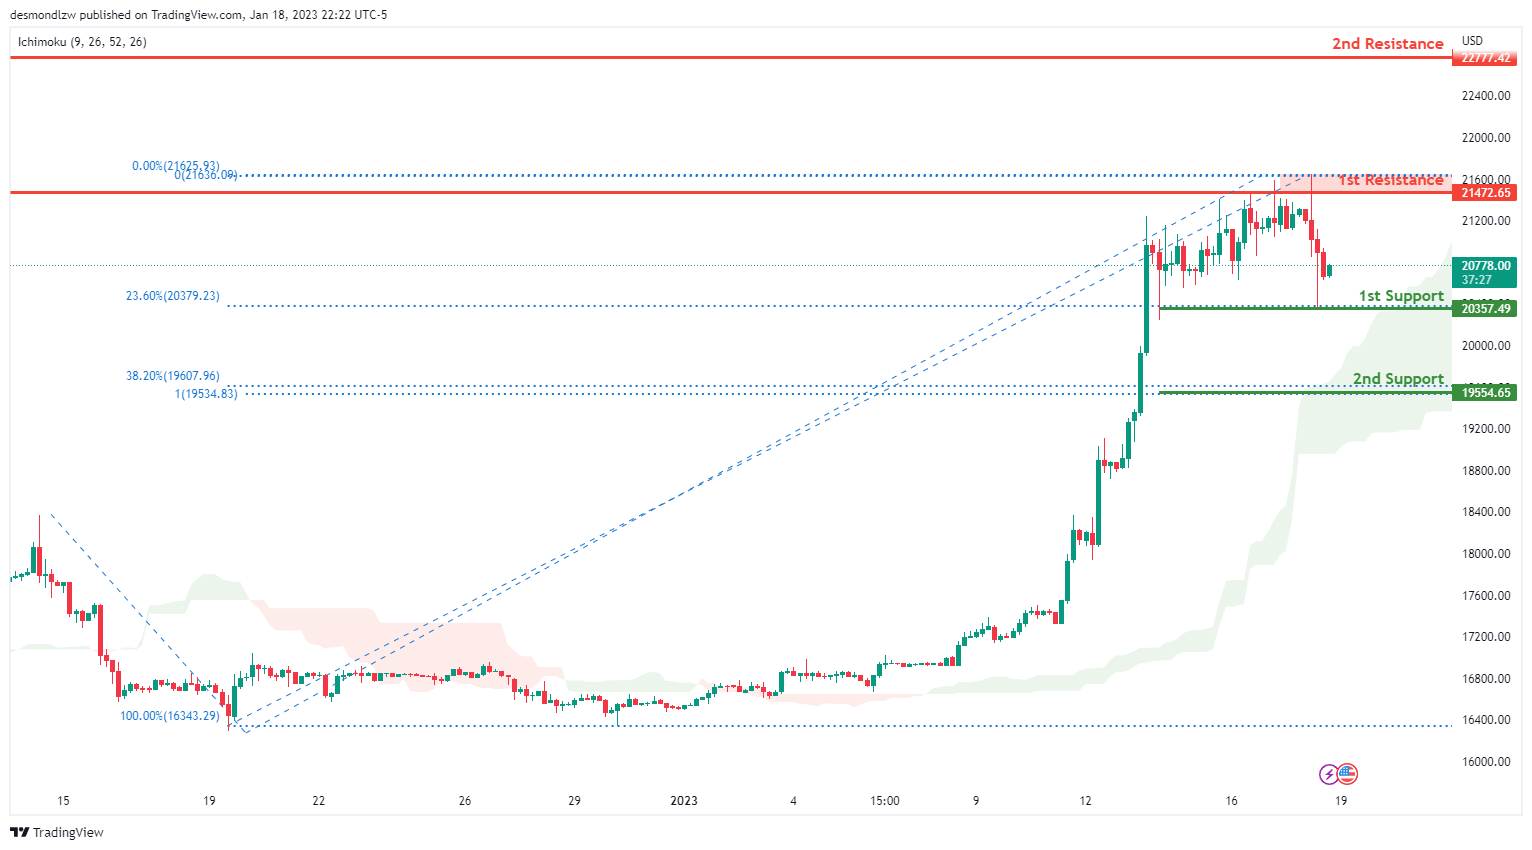
Looking at the H4 chart, my overall bias for BTCUSD is bullish due to the current price being above the Ichimoku cloud, indicating a bullish market. If this bullish momentum continues, expect the price to possibly break the 1st resistance at 21472.65 which is the recent swing high area, before heading towards the 2nd resistance at 22777.42. In an alternative scenario, the price could possibly head back down to retest the 1st support at 20357.49 where the 38.2% Fibonacci line is. The 2nd support line is at 19554.65 where 100% Fibonacci projection and 38.2% Fibonacci rertracement are.
Areas of consideration:
- H4 time frame, 2nd resistance 22777.42
- H4 time frame, 1st resistance 21670.55
- H4 time frame, 1st support at 21522.06.
- H4 time frame, 2nd support at 19554.65
S&P 500:
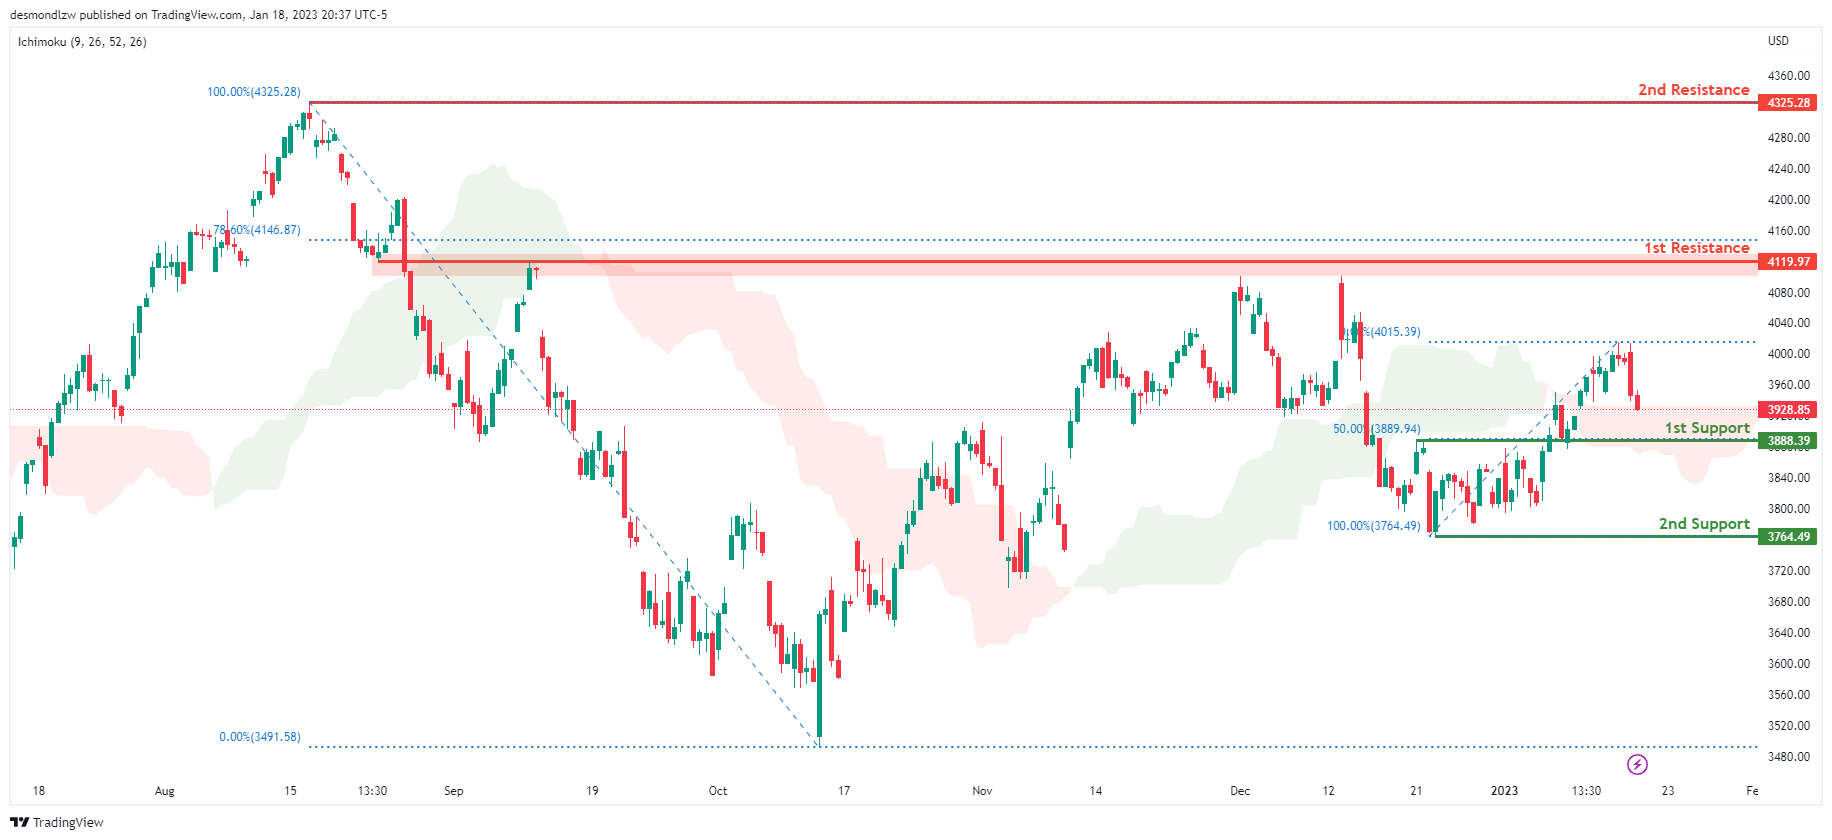
Looking at the H4 chart, my overall bias for S&P500 is bullish due to the current price being above the Ichimoku cloud, indicating a bullish market. If this bullish momentum continues, expect the price to continue heading towards the 1st resistance at 4119.97, where the 78.6% Fibonacci line is. In an alternative scenario, price could possibly head back down to retest the 1st support at 3888.39, where the 50% Fibonacci line is.
Areas of consideration:
- H4 time frame, 1st support at 3888.39
- H4 time frame, 1st resistance at 4119.97
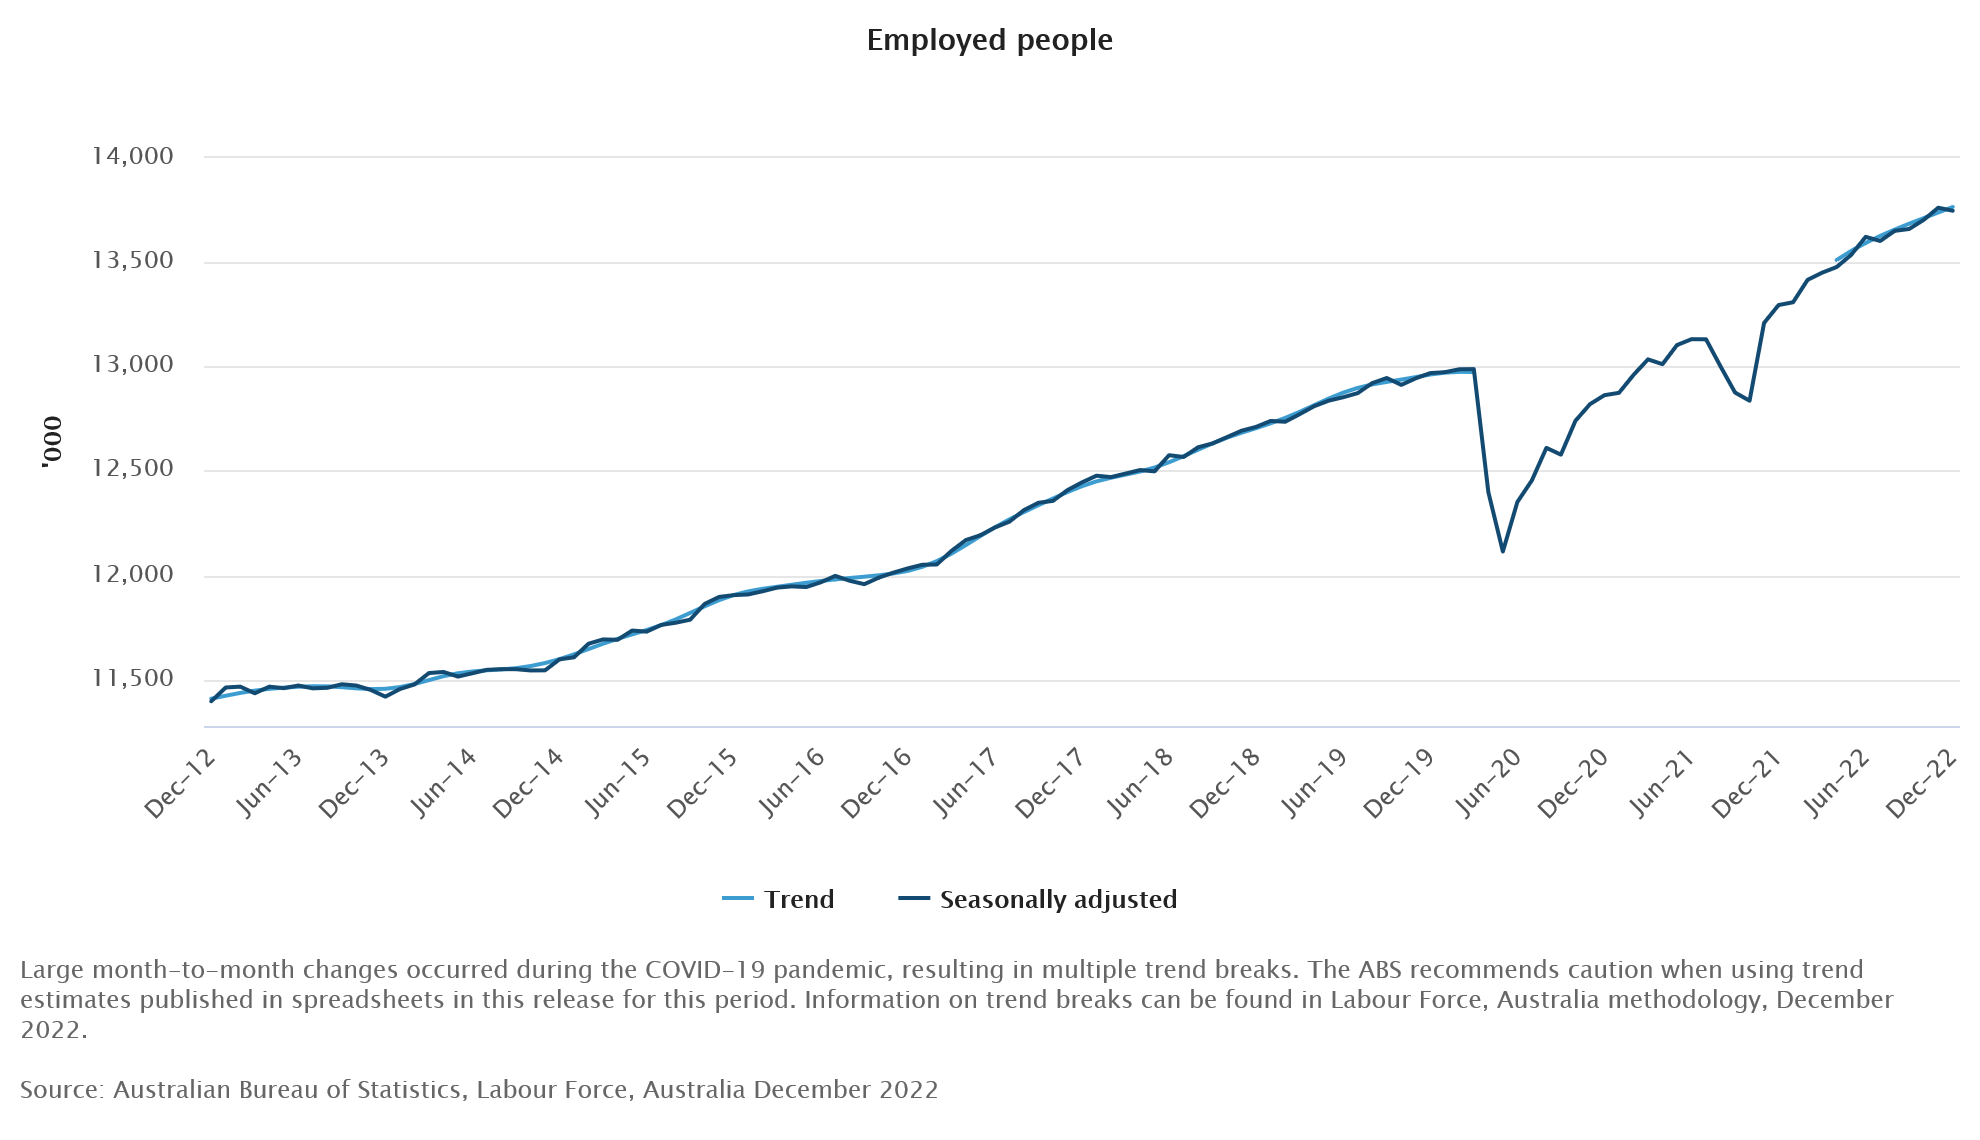
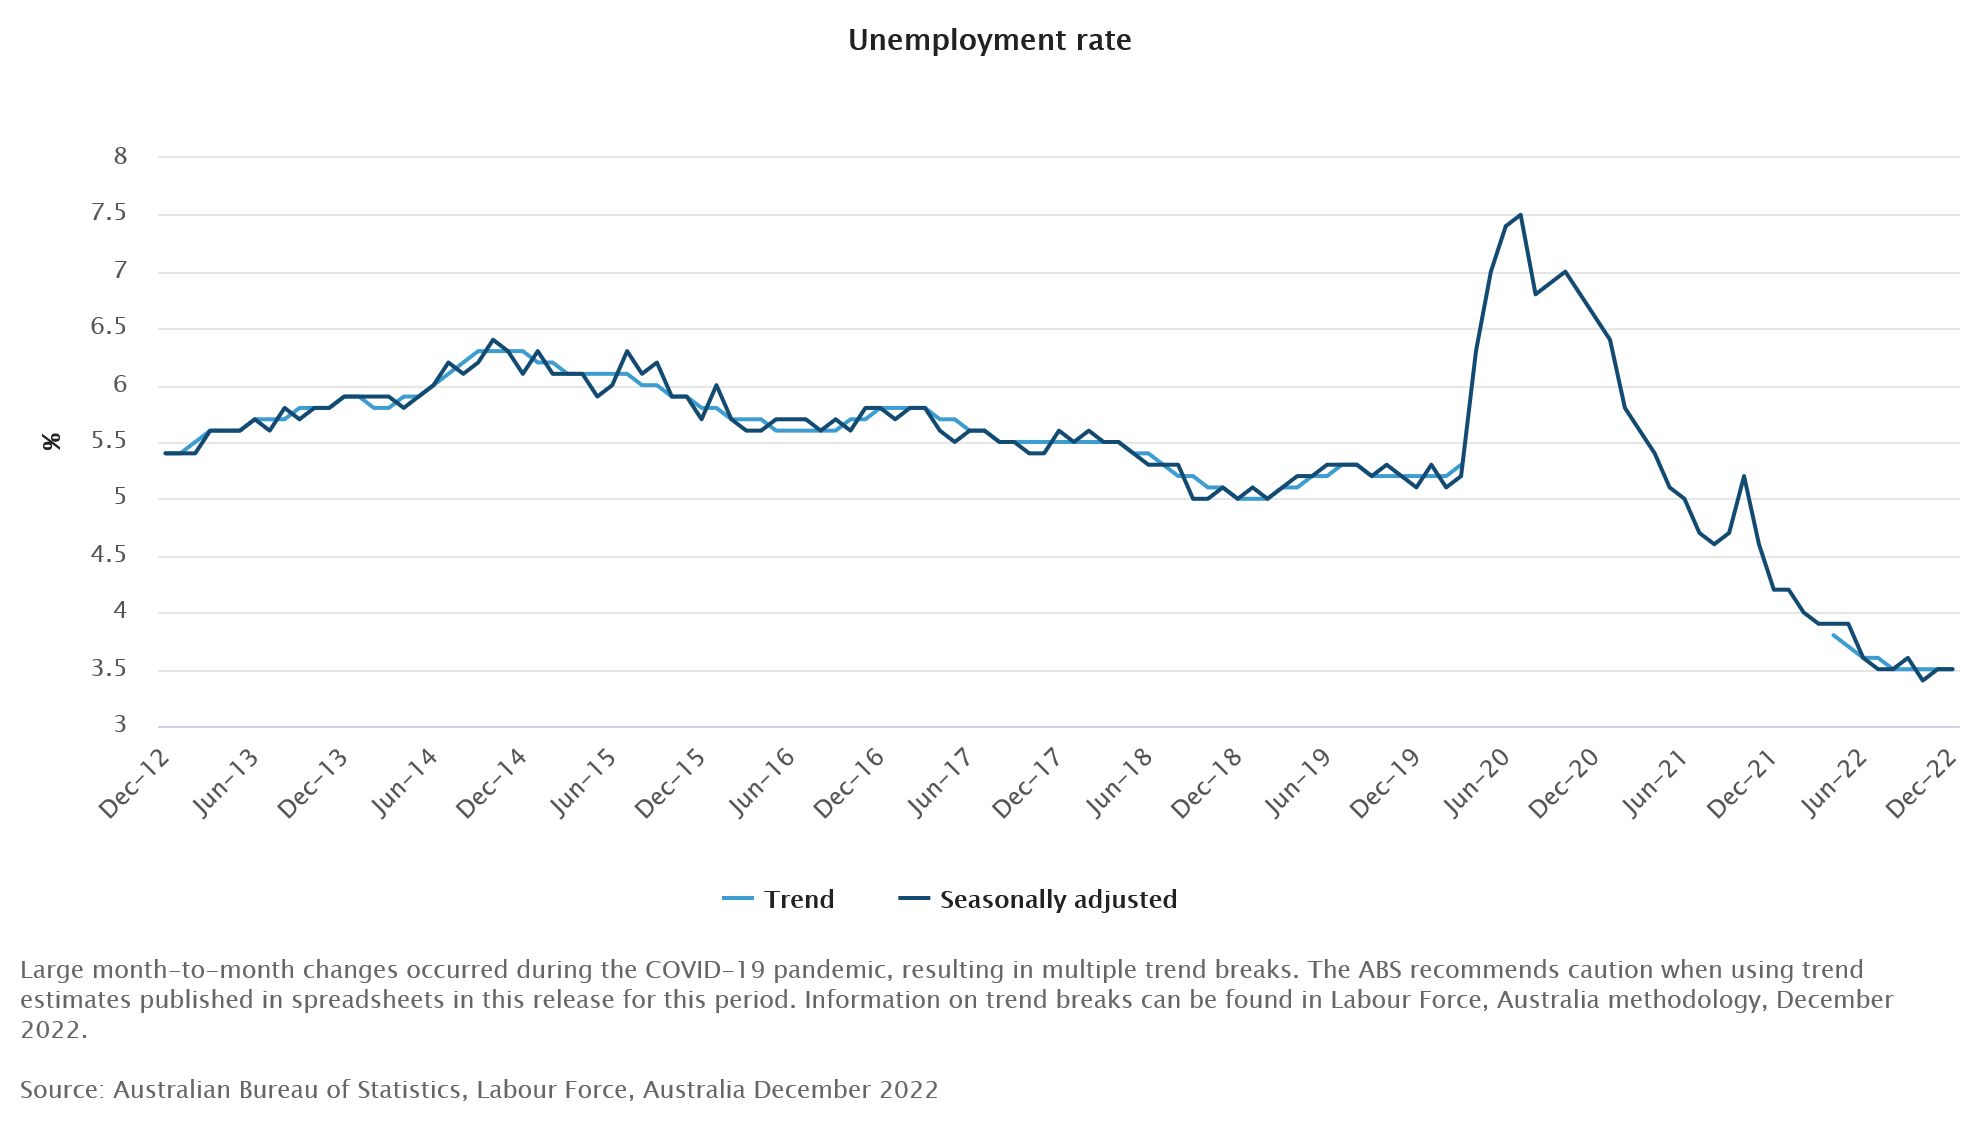
Australia employment down -14.6k in Dec, unemployment rate unchanged at 3.5%
Australia employment declined -14.6k in December, much worse than expectation of 21.2k growth. Full-time jobs rose 17.6k while part-time jobs fell -32.2k. Unemployment rate was unchanged at 3.5%. Participation rate dropped -0.2% to 66.6%. Monthly hours worked dropped -0.5%.
Lauren Ford, head of labour statistics at the ABS, said: "The falls in employment and hours worked in December followed strong growth through 2022, with an annual employment growth rate of 3.4 per cent and hours worked increasing by 3.2 per cent.
"The strong employment growth through 2022, along with high participation and low unemployment, continues to reflect a tight labour market.
"In December, we saw the number of people working reduced hours due to illness increasing by 86,000 to 606,000, which is over 50 per cent higher than we would usually see at this time of the year."
Japan exports up 11.5% yoy in Dec, imports up 20.6% yoy
In December, Japan exports rose 11.5% yoy to JPY 8787B, marking the slowest growth rate in 2022. Exports to China fell -6.2% yoy in value and down -24% yoy in volume. Imports rose 20.6% yoy to JPY 10236B, led by oil, coal and liquefied natural gas.
Trade deficit came to JPY -1.45T, extending the run of deficits to 17 months. For the whole of 2022, trade balance came in at JPY -19.97T deficit, the second straight annual shortfall, and the largest since 1979.
In seasonally adjusted term, exports dropped -3.5% mom to JPY 8352B. Imports dropped -3.4% mom to JPY 10076B. Trade deficit narrowed slightly to JPY -1.72T, larger than expectation of JPY -1.63T.
Australia December Labour Force: Disrupted by Greater than Usual Illness
Total employment: -14.6k from 58.3k (revised from 64.0k). Unemployment rate: 3.5% from 3.5% (revised 3.4%). Participation rate: 66.6% from 66.8% (unrevised 66.8%). We suspect we have now past the low in unemployment.
Total employment declined by 14.6k (0.1%) in December 2022, following an increase of 58.3k in November (revised from 64.0k) and an average monthly growth of around 40k between August and November.
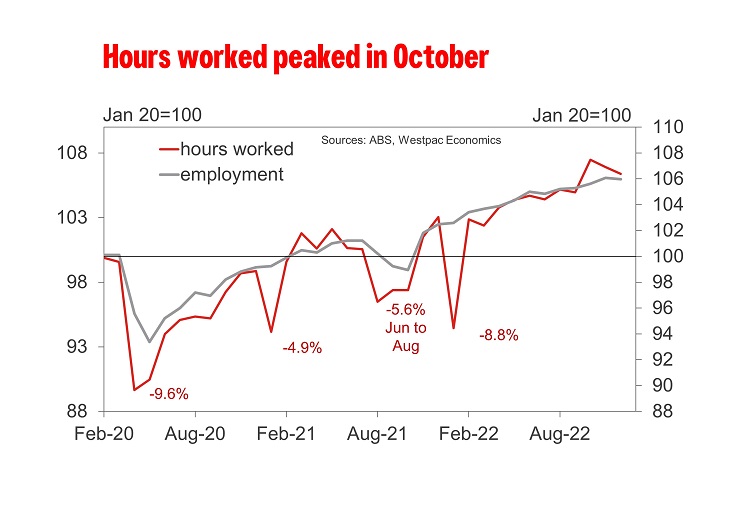
Monthly hours worked decreased by 0.5%, greater than the decline in employment, for the second consecutive month following and hours worked peak in October.
The decline in employment and hours worked in December followed strong growth in both through 2022, with an annual growth in employment of 3.4%yr and hours worked of 3.2%yr.
There appears that a lift in illness could have been a drag on employment with the number of people working reduced hours due to illness increasing by 86k to 606k which is over 50% higher than we would usually see at this time of the year.
We were surprised that the number of people working fewer hours due to annual leave, flextime or long service leave decreased 489.2k to 842.6k in December 2022. The proportion of employed people taking annual leave in December 2022 was 6.1%, slightly below the pre-pandemic December average of 6.7%. Having been the first clear summer break since the Covid pandemic we had thought that the number on leave would be higher than average in December.
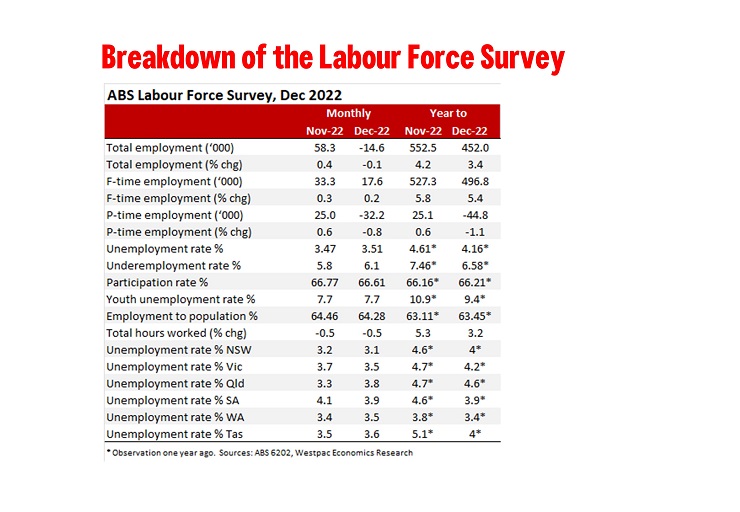
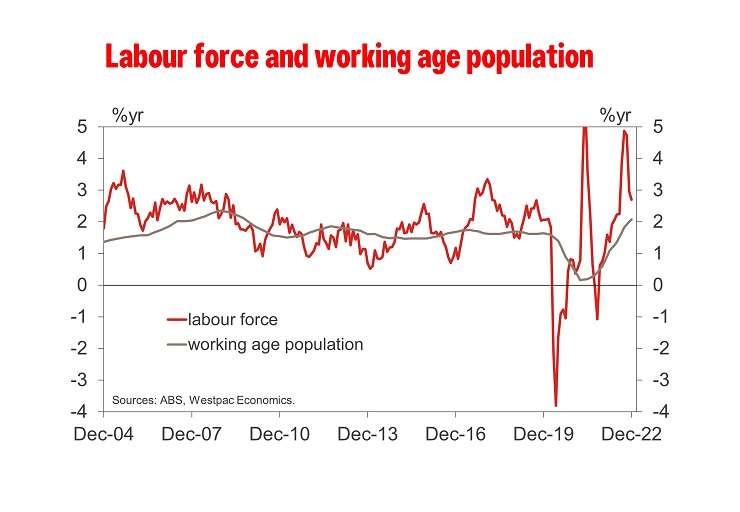
The increase in the number effected by illness may also be why there was a 0.2ppt decline in participation to 66.6%. This led to a 8.8k decline in the labour force which was enough to hold the unemployment rate flat at 3.5% (revised from 3.4%). At two decimal places there was an almost 0.1ppt rise in unemployment from 3.47% in November to 3.51% in December. It was rounding that held the unemployment rate flat at 1 decimal place.
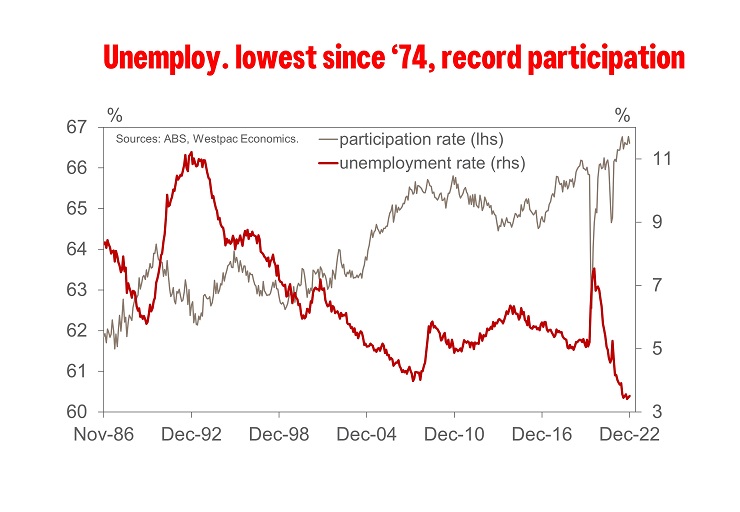
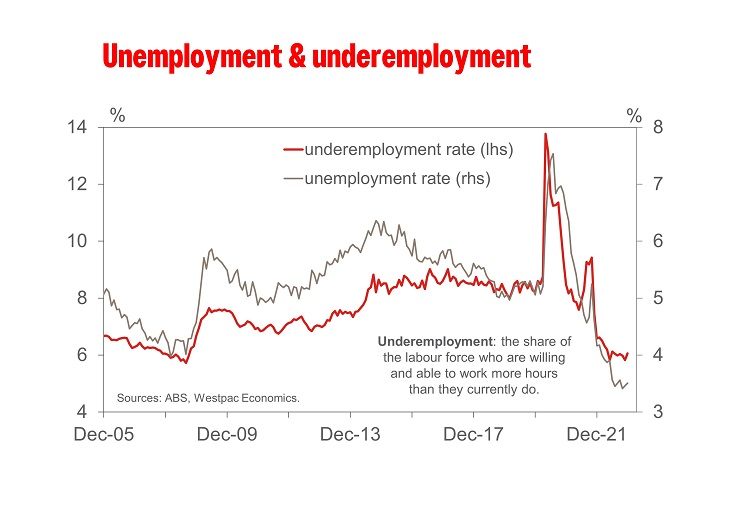
The underemployment rate lifted to 6.1% from 5.8% and is not back to where it was in June 2022. Given just how tight the labour market is it is somewhat surprising there has not been a great improvement in underemployment given just how far unemployment has fallen. Given we expect the unemployment rate to start to rise through 2023 it looks as we have past the low point for underemployment.
Employment declined in all stated except in SA and WA (both +0.3%) while NSW has the lowest unemployment rate at 3.1% (a 0.1ppt decline in the month) and SA has the highest rate for a state at 3.9% (also a 0.1ppt decline in the month).
December is always a tricky month as there is normally a last minute run up in employment (in original terms) before the Christmas/summer holidays. This December employment lifted 69.1k in original terms.
Fed Logan backs slowing down in complex environment
Dallas Fed President Lorie Logan said it's a "good idea to slow down" in "today's complex economic and financial environment".
"That's why I supported the decision last month to reduce the pace of rate increases. And the same considerations suggest slowing the pace further at the upcoming meeting," she added.
"A slower pace is just a way to ensure we make the best possible decisions," she said. "We can and, if necessary, should adjust our overall policy strategy to keep financial conditions restrictive even as the pace slows."
She added that Fed should not "lock in" on a terminal rate. "My own view is that we will likely need to continue gradually raising the fed funds rate until we see convincing evidence that inflation is on track to return to our 2 percent target in a sustainable and timely way," she said.
"The most important risk I see is that if we tighten too little, the economy will remain overheated, and we will fail to keep inflation in check," Logan said.
Fed Harker: Hikes of 25 appropriate going forward
Philadelphia Fed President Patrick Harker said yesterday, "I expect that we will raise rates a few more times this year, though, to my mind, the days of us raising them 75 basis points at a time have surely passed." "Hikes of 25 basis points will be appropriate going forward," he said. And, "let's get above 5% and sit there for a while".
While risks to inflation remain on the upside, he noted, "we are starting to see inflation come down across a spectrum of goods." He expects core inflation to decline to 3.5% this year, and 2.5% next, then get back to target in 2025. He also said the economy should grow 1% this year, without falling into recession.
Bitcoin Price Could Correct Before Fresh Increase
Key Highlights
- Bitcoin price started a fresh increase above the $20,000 resistance.
- It traded below a rising channel with support near $21,000 on the 4-hours chart.
- Gold price is consolidating gains above the $1,880 resistance.
- Crude oil price is correcting gains from the $82.40 resistance.
Bitcoin Price Technical Analysis
Bitcoin price formed a base and started a fresh increase above $18,500 resistance. BTC/USD surpassed key hurdles near $19,000 to move into a short-term positive zone.
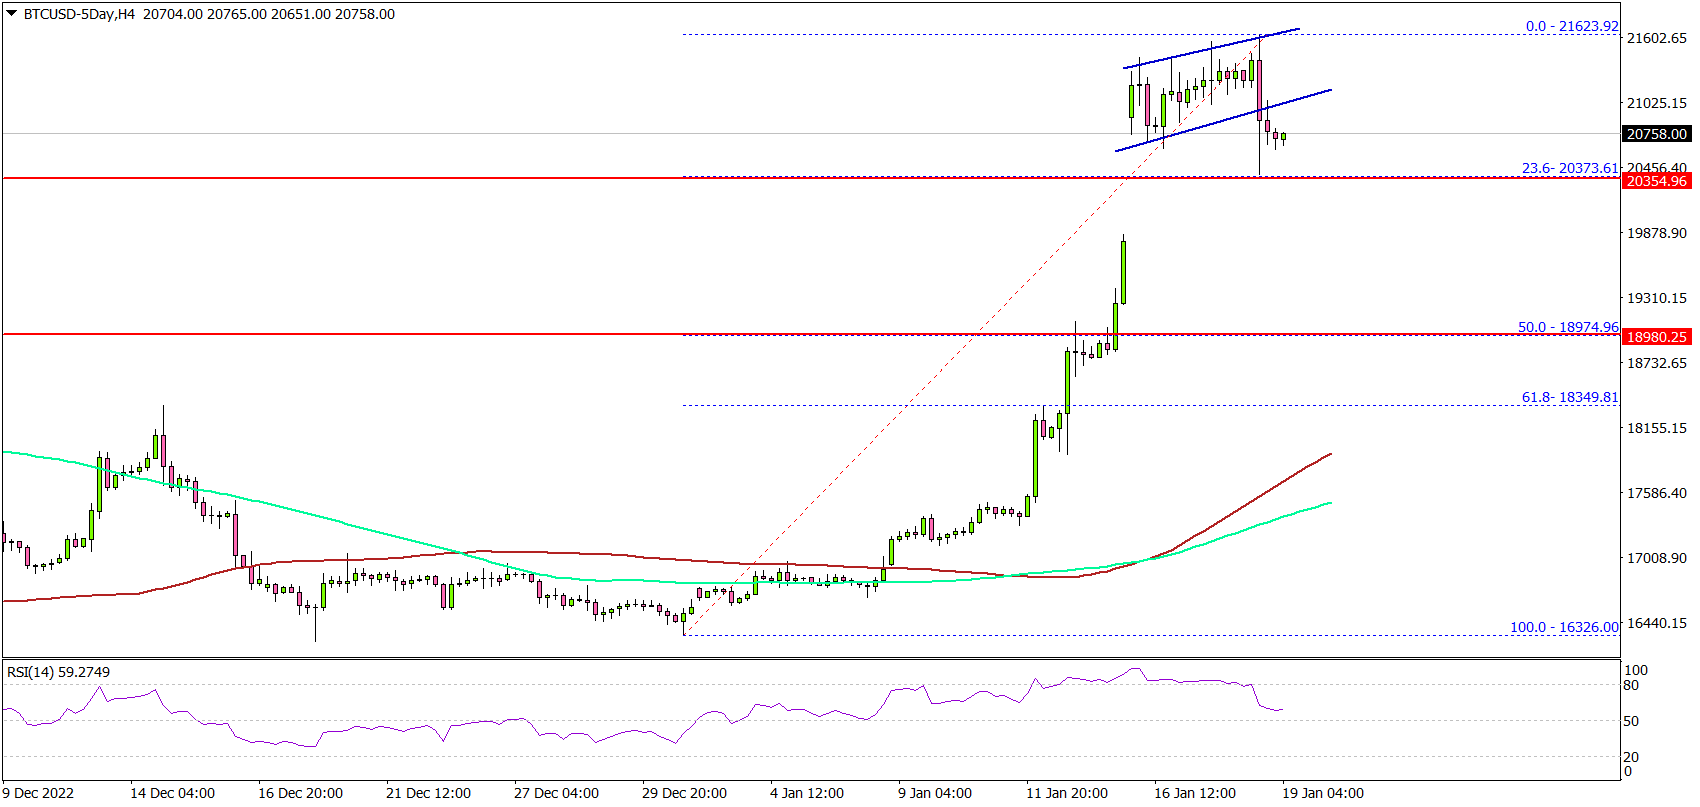
Looking at the 4-hours chart, the price traded above the $20,000 resistance, the 200 simple moving average (green, 4-hours), and the 100 simple moving average (red, 4-hours).
The price even spiked above the $21,000 level. A new multi-week high was formed near $21,623 and the price is now correcting gains. It traded below a rising channel with support near $21,000 on the same chart.
There was a test of the 23.6% Fib retracement level of the upward move from the $16,326 swing low to $21,623 high. On the downside, an initial support sits near the $20,400 level.
The main breakdown support sits near the $19,000 zone. If there is a downside break and close below $19,000, bitcoin might start another major decline in the coming days. In the stated case, it could revisit the $17,500 support or even test $17,000.
Conversely, the price might climb higher again above $21,000. The next resistance sits near the $21,500 zone. A close above the $21,500 level may perhaps start another steady increase in the coming days.
In the stated case, the price could rise towards the $22,500 level. Any more gains could set the pace for a move towards the $24,000 level.
Economic Releases
- US Initial Jobless Claims - Forecast 215K, versus 205K previous.
WTI Wave Analysis
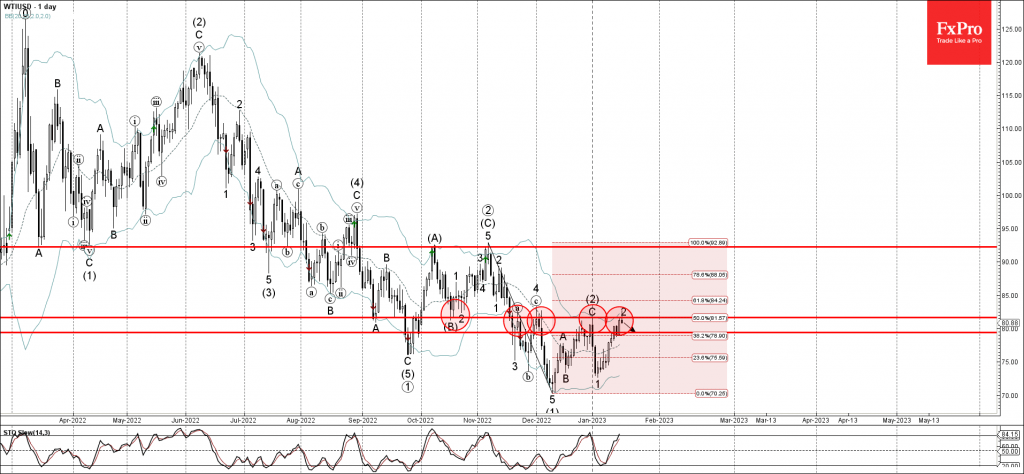
- WTI reversed from key resistance level 81.6
- Likely to fall to support level 80.00
WTI crude oil recently reversed down from the key resistance level 81.6 (former low of wave (B) from October, which has been reversing the price from November).
The resistance level 81.60 was further strengthened by the upper daily Bollinger Band and by the 50% Fibonacci correction of the downward impulse from (1) from November.
Given the overbought daily Stochastic and the strong daily downtrend, WTI crude oil can be expected to fall further toward the next support level 80.00.
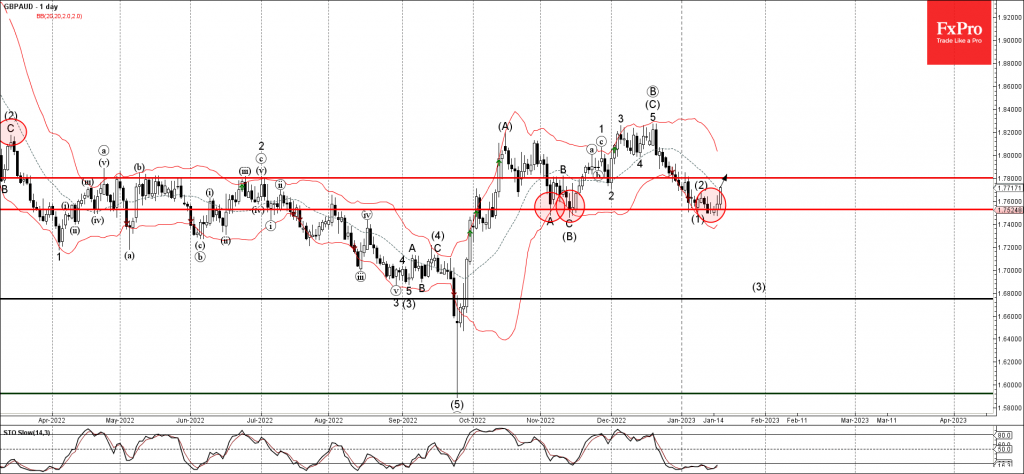
GBPAUD Wave Analysis
- GBPAUD reversed from support level 1.7525
- Likely to rise to resistance level 1.7800
GBPAUD recently reversed up from the pivotal support level 1.7525 (which stopped the previous waves A, (B) and (1)).
The upward reversal from the support level 1.7525 stopped the previous intermediate impulse wave (3) from the start of January.
Given the strongly bullish sterling sentiment and the oversold daily Stochastic, GBPAUD can be expected to rise further toward the next resistance level 1.7800.