Sample Category Title
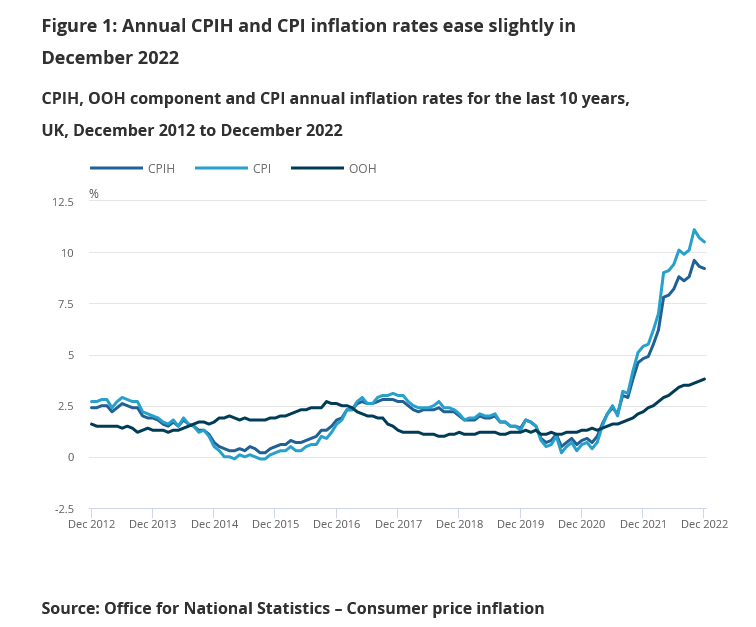
UK CPI slowed to 10.5% yoy in Dec, core CPI unchanged at 6.3% yoy
UK CPI rose 0.4% mom in December, matched expectations. In the 12 months, CPI slowed from 10.7% yoy to 10.5% yoy slightly below expectation of 10.6% yoy. CPI core was unchanged at 6.3% yoy, below expectation of 6.6% yoy. RPI rose 0.6% mom, 13.4% yoy, below expectation of 1.0% mom, 13.9% yoy.
ONS said: "The largest downward contribution to the change in both the CPIH and CPI annual inflation rates between November and December 2022 came from transport (particularly motor fuels), clothing and footwear, and recreation and culture, with rising prices in restaurants and hotels, and food and non-alcoholic beverages making the largest partially offsetting upward contributions."
Holy Bank of Japan
The Bank of Japan (BoJ) kept its below-zero interest rate and its faltering yield curve control policy unchanged. No-action sent the Japanese 10-year yield tumbling by up to 14 bp – that’s almost a 30% plunge. The dollar-yen spiked above the 131.50 level, losing more than 2.50% against the greenback.
The BoJ revised its GDP lower for this year, but kept its inflation forecast unchanged at around the 3%. And yet, the producer price inflation in Japan spiked above the 10% in December.
It feels like the BoJ doesn’t want to face the reality, and isn’t acting according to the market’s needs.
Anyway, I think that traders will continue defying the BoJ’s YCC strategy and try to break its back, but we will likely see more volatility in the yen, as the policymakers keep fighting the market – perhaps not to lose face?
On the currency front, we can’t rule out the possibility of an advance above the 133 level, the minor 23.6% Fibonacci retracement on Oct to January retreat. The negative trend in USDJPY will remain intact below the 136 level, the major 38.2% retracement level.
Yen selloff supports the dollar index
If the yen changes direction, the impact on the dollar index will also be felt – and it will be positive.
The dollar index is stronger this morning.
The EURUSD is below the 1.08 mark, and could extend losses toward the 1.0630, the lower end of the actual positive trending channel.
And yet, the ZEW data released yesterday showed that investor expectations for the German economy jumped to the highest level in almost a year and German Chancellor Olaf Scholz said that he is sure Germany will avoid recession this year, thanks to China's reopening and growing confidence that the energy-price squeeze is easing.
And now that the Euro-area economy is performing better than many anticipated in the face of record inflation and the energy crisis, the European Central Bank (ECB) is expected to raise the rates by 50bp in February and in March, and by another 25bp in May or in June. That should throw a floor under the euro weakness and may not let the euro slide too low against the dollar.
Across the Channel, Cable does particularly well, since Britain revealed a near-record pace of 6.4% in wages growth between September and November year on year. The latter will unlikely ease the anger of those striking for a better pay – headéine inflation in Britain came in at 10.5% in December, as core inflation didnt ease as expected - dwarfing the near-record pay rise. The latest numbers will only force the Bank of England (BoE) to deliver yet another rate hike next month to avert a further wage-price spiral. And that’s positive for sterling.
S&P500 struggles finding buyers above 4000
Confusion and lack of direction best described yesterday’s sentiment in the US.
US futures were pointing at a negative start, then turned higher in early trading as we heard a lot of talk about "green shoots" and "bright spots" in the economy when Chinese Vice Premier talked in Davos yesterday saying that he expects China's economy to return to normal this year.
The S&P 500 shortly traded above the 4000 level, but reality soon hit the fan with mixed earnings from Goldman and Morgan Stanley, and brought the top sellers in.
And the top sellers kept selling into the 4000 level to the end of the session. Finally, the index closed the session 0.20% lower, spot on the 2022’s down-trending channel top and above the critical 200-DMA.
But the first set of earnings doesn’t support a sustainable move above that 200-DMA level.
If we dive into the latest bank earnings, Goldman Sachs and Morgan Stanley earnings were mixed. Golman reported a 69% drop in Q4 profit as the slump in deal-making and its wealth management business weighed on Q4 results. Goldman shares closed the session almost 6.50% lower.
Morgan Stanley was also hurt by weakness in deal-making, but the wealth management and trading revenue grew. The shares closed almost 6% higher.
Note that Morgan Stanley set aside $85 mio for credit losses compared to only $5 mio a quarter ago, as proof that the bank is not optimistic about what’s to come this year, either. Therefore, the 6% rally was certainly a bit exaggerated.
Bank of Japan Keeps a Steady Hand
Market movers today
Today's focus will be on hard data from the US as we get the December PPI, retail sales and industrial production. Retail sales is the most important number, as it will be the first piece of hard data for December and will give us a sense of whether the sharp slowdown illustrated by the ISM services actually took place.
UK inflation for December out today will also be an important input ahead of Bank of England's rate decision at the beginning of February. Expectations are for further eased price pressure with headline to print 10.5% from earlier 10.7%. Also underlying inflation is expected to continue lower.
In euro area, we get the final HICP data for December, which includes more details than the flash print. On central bank calendar, ECB's Villeroy and Fed's Bostic and Harker are scheduled to speak. The Fed will also release its Beige Book.
The 60 second overview
Bank of Japan: Bank of Japan decided to keep monetary policy unchanged at its meeting overnight. The market had speculated another hike of the cap over 10Y yields could come and was left disappointed, which triggered a rally in USD/JPY above 131. We stick to our view that a policy rate hike to 0% and another hike in the yield curve control target awaits in Q2 23.
ECB: In light of the improved growth and inflation outlook, ECB sources reported yesterday that policymakers are starting to consider a slower pace of rate hikes than President Lagarde indicated in December. While the 50bp hike in February she signalled remains likely, the prospect of a smaller 25bp increase at the following meeting in March is gaining support according to officials. The news added to the European fixed income rally, with implied ECB peak rate pricing now down to 3.3% from 3.5% earlier, while EUR/USD returned below 1.08.
European economy: The euro optimism got another boost yesterday, after German ZEW expectations showed a larger than expected rebound in January, turning positive for the first time since Russia's invasion of Ukraine. The German economy has been holding up better than feared, thanks to a range of tailwinds from mild weather to a large order backlog and easing supply bottlenecks in industry. ZEW signals that the recent rebound in leading indicators could persist into Q1, suggesting that the European recession could actually be milder and shorter than we have previously anticipated. That said, the assessment of current economic conditions remains at more depressed levels and we still think challenging times await the German economy in 2023, as energy worries remain, order books are emptying and consumers will face another year of real income losses. Higher interest rates have already started to cool construction and housing market activity and downside risks remain also for the labour market. Stepped up investments in infrastructure, digitalisation and the green transition as well as positive spill-over effects from Chinese pent-up demand are upside risks to the outlook. But the German growth model remains in an adjustment phase and until the energy crisis is truly resolved, Germany is unlikely to return as the euro area's economic powerhouse anytime soon.
FI: Yesterday, European bond yields and interest rates declined significantly in the afternoon on the back of comments from ECB officials that stated that ECB would hike 50bp in February and then slow down to 25bp in March and ending with a terminal rate of 3.25%. The officials stated that the comments were "anonymous" and normally the market would ignore these kind of statements. However, this was apparently coming from ECB sources and thus the market reacted much more than usual, as this is clearly a dovish comments.
This morning Bank of Japan did not change their monetary policy and 10Y JGBs rallied 10bp.
FX: Broad EUR weakness following yesterday's ECB sources story, hinting that 25bp increments might be the way to go beyond the February meeting. EUR/USD fell almost a full big figure on the story but notably we are also seeing relative EUR weakness against Scandies as well. USD/JPY rallies back above 130 again on Bank of Japan's decision to keep monetary policy unchanged.
Credit: The Credit market is still seeing significant new issue activity which takes most of the attention. Spreads saw only small changes with iTraxx Xover 4bp wider at 411bp. Main was 1bp wider at 79bp.
Technical Outlook and Review
USD/JPY:
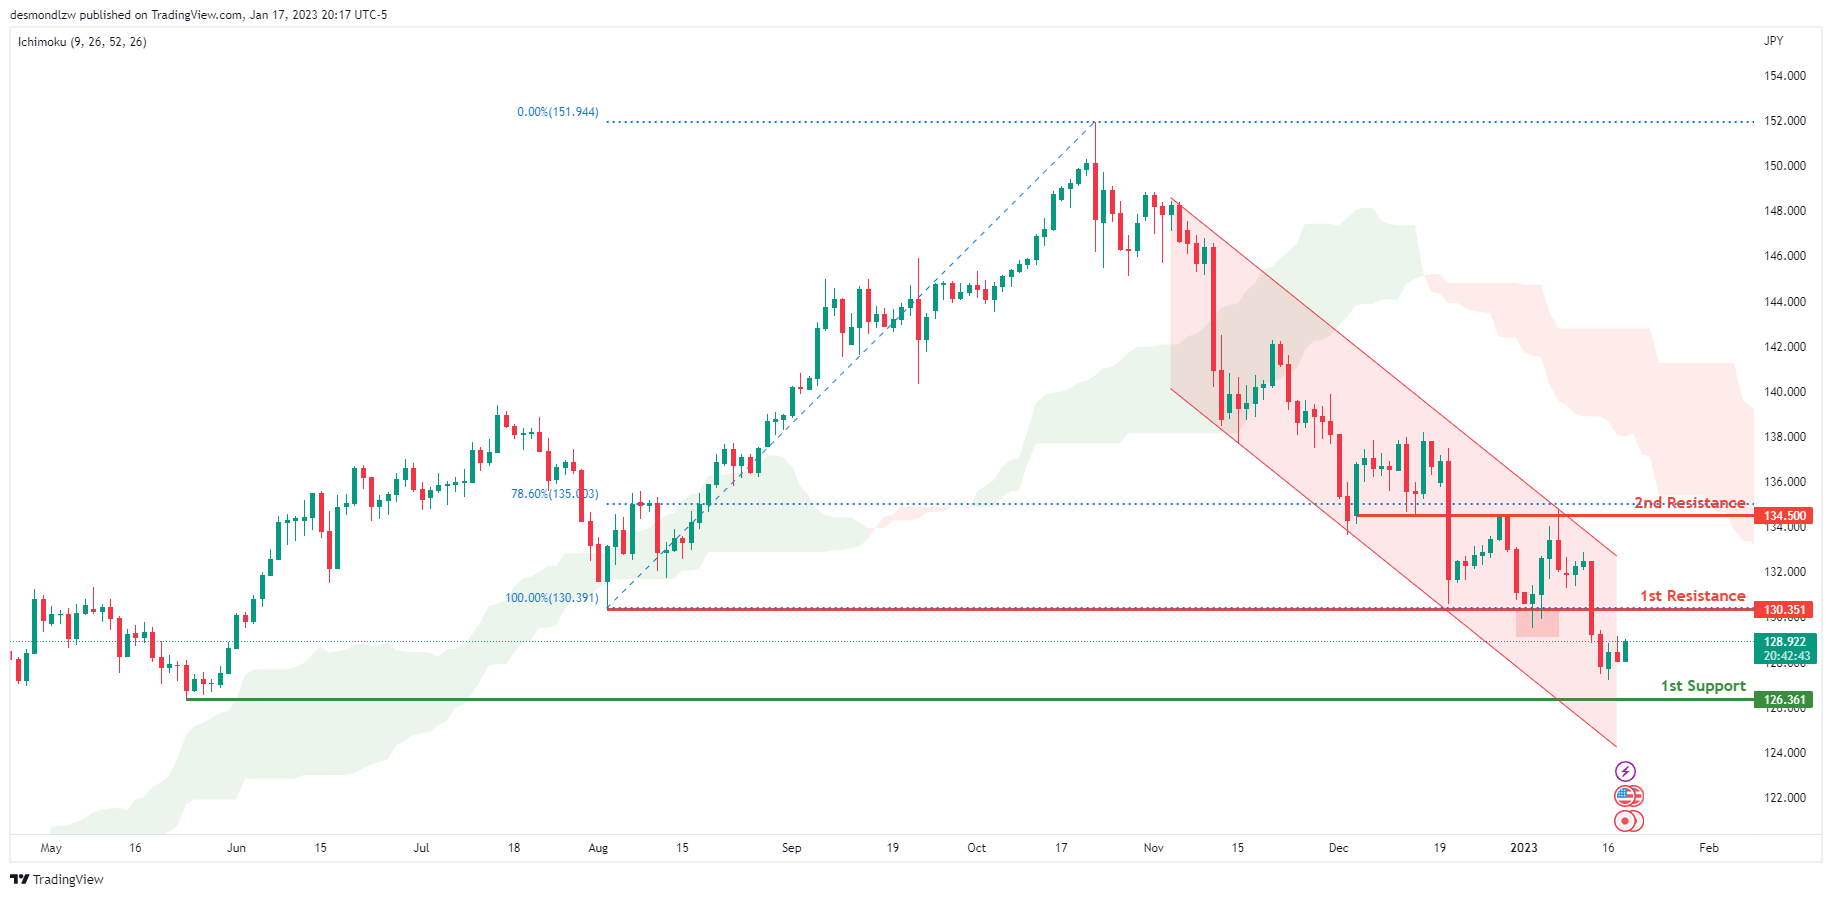
Looking at the Daily chart, my overall bias for USDJPY is bearish due to the current price being below the Ichimoku cloud, indicating a bearish market. To add confluence to this bias, price is also within a descending channel. If this bearish momentum continues, expect the price to possibly continue heading towards the 1st support level at 126.361, where the previous swing low is. In an alternate scenario, price could possibly head back up to retest the 1st resistance at 130.351, where the previous swing low is.
Areas of consideration:
- H4 time frame, 1st resistance at 130.351
- H4 time frame, 1st support at 126.361
DXY:
Looking at the Daily chart, my overall bias for DXY is bearish due to the current price being below the Ichimoku cloud, indicating a bearish market. If this bearish momentum continues, expect the price to possibly continue heading towards the 1st support at 101.300, where the previous low is. . In an alternative scenario, price could head back up to retest the 1st resistance at 103.463, where the 23.6% Fibonacci line is.
Areas of consideration:
- H4 time frame, 1st resistance at 103.463
- H4 time frame, 1st support at 101.300
EUR/USD:
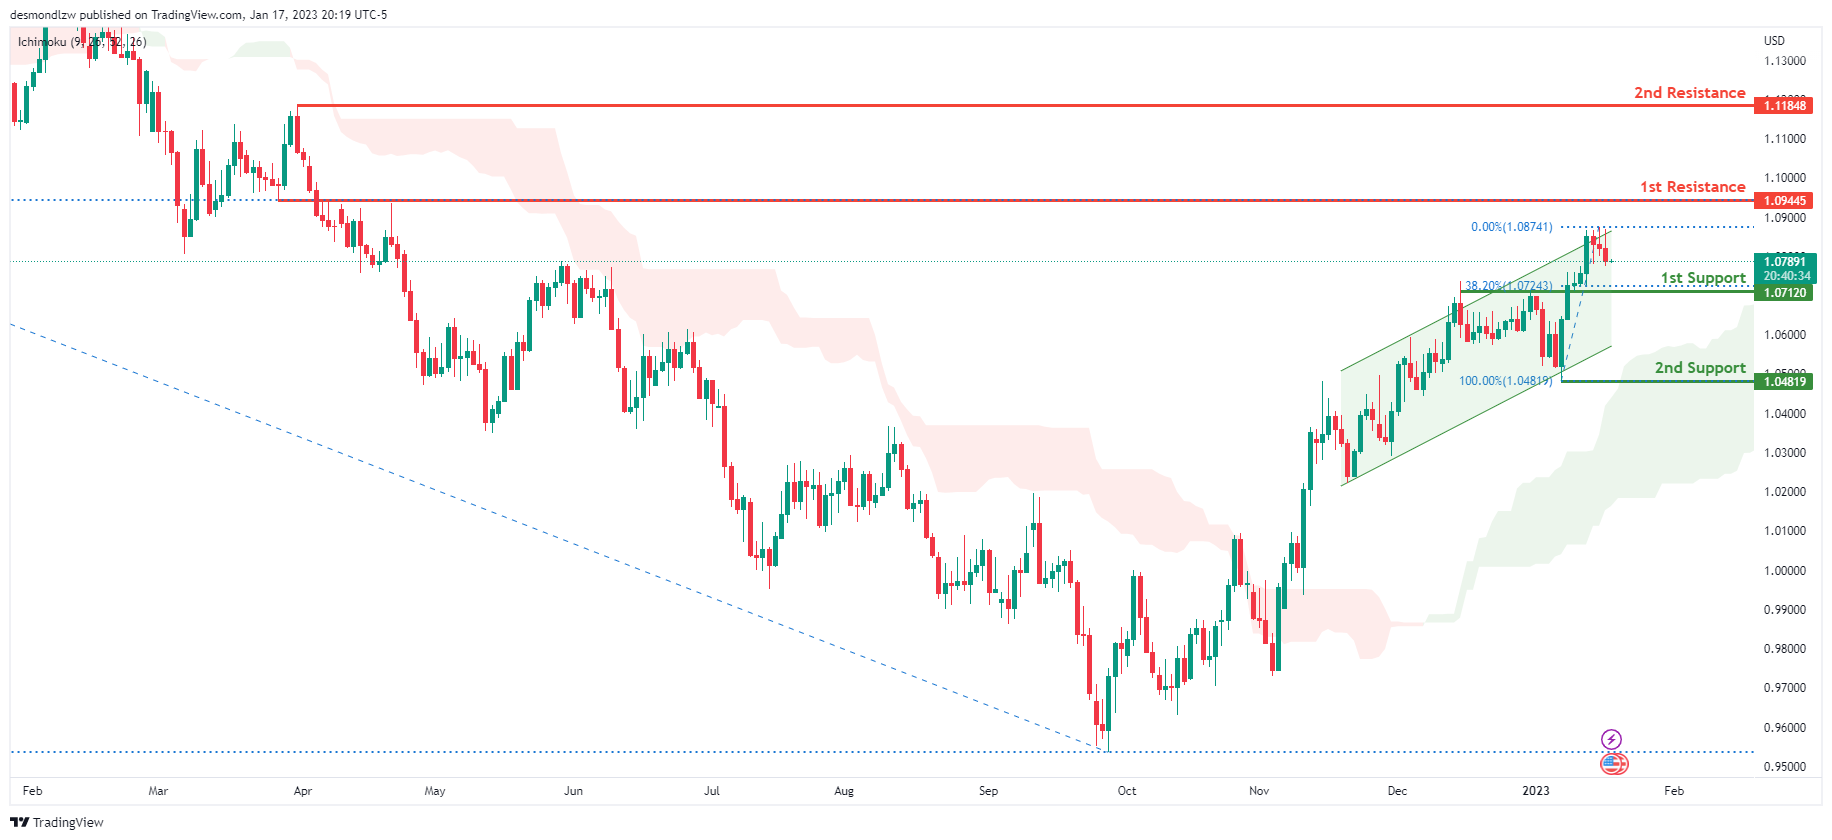
Looking at the Daily chart, my overall bias for EURUSD is bullish due to the current price being above the Ichimoku cloud, indicating a bullish market structure. To add confluence to this bias, price is also within an ascending channel. If this bullish momentum continues, expect the price to possibly continue heading towards the 1st resistance at 1.09445, where the 50% Fibonacci line is. In an alternate scenario, price could possibly head back down to retest the 1st support level at 1.07120, where the 38.2% Fibonacci line is.
Areas of consideration :
- H4 1st resistance at 1.09445
- H4 1st support at 1.07120
GBP/USD:
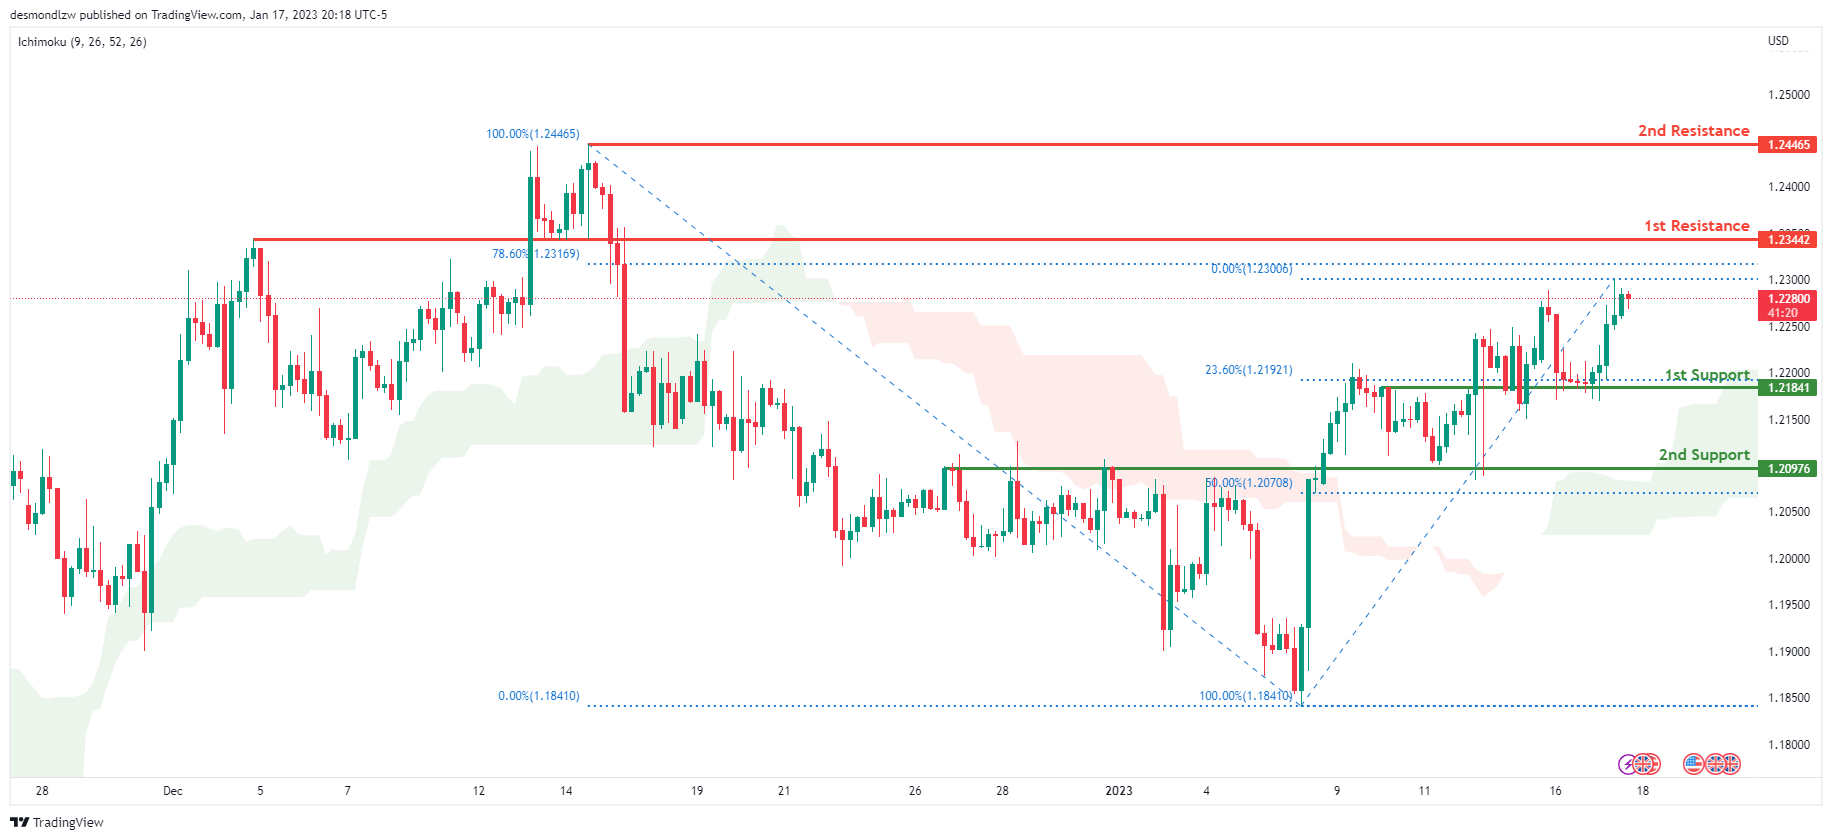
Looking at the H4 chart, my overall bias for GBPUSD is bullish due to the current price being above the Ichimoku cloud, indicating a bullish market. If this bullish momentum continues, expect price to possibly continue heading towards the 1st resistance line at 1.23442, where the 78.6% Fibonacci line is. In an alternate scenario, price could possibly head back down and break the 1st support at 1.21841, where the 23.6% Fibonacci line is, before heading towards the 2nd support at 1.20976, where the 50% Fibonacci line is.
Areas of consideration:
- H4 1st resistance at 1.23442
- H4 1st support at 1.21841
- H4 2nd support at 1.20976
USD/CHF:
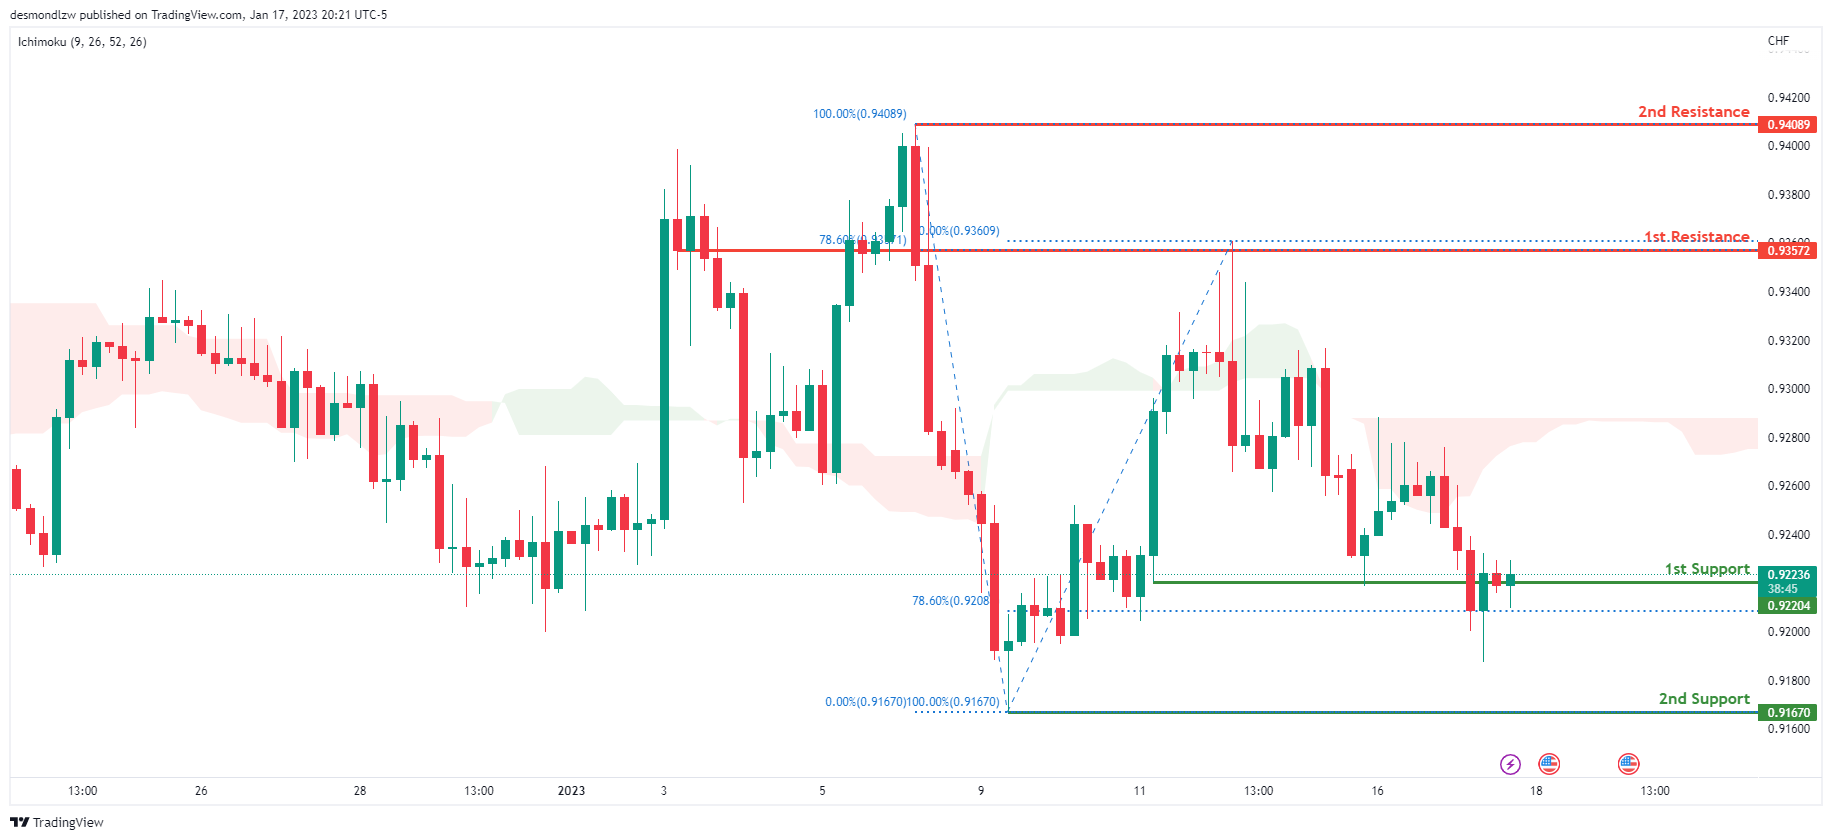
Looking at the H4 chart, my overall bias for USDCHF is bearish due to the current price crossing below the Ichimoku cloud, indicating a bearish market. If the current bearish trend continues, expect the price to possibly head back down to retest the 1st support at 0.92204, slightly above where the 78.6% Fibonacci line is. In an alternative scenario, price could possibly head towards the 1st resistance at 0.93572, where the 78.6% Fibonacci line is.
Areas of consideration
- H4 1st support at 0.92204
- H4 1st resistance at 0.93572
XAU/USD (GOLD):
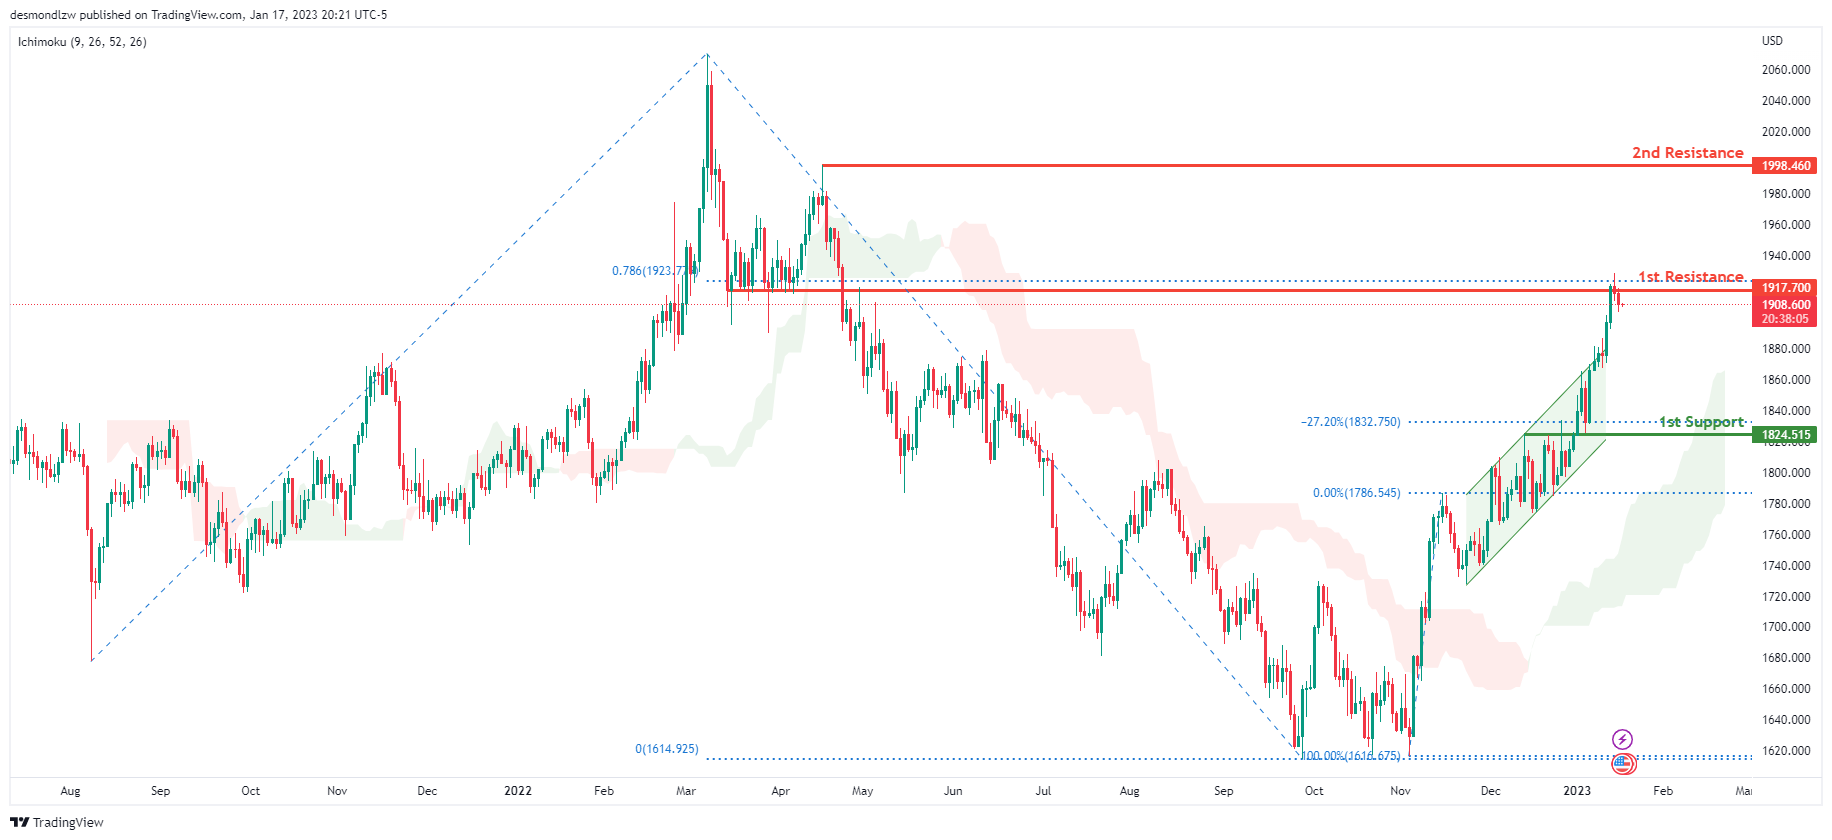
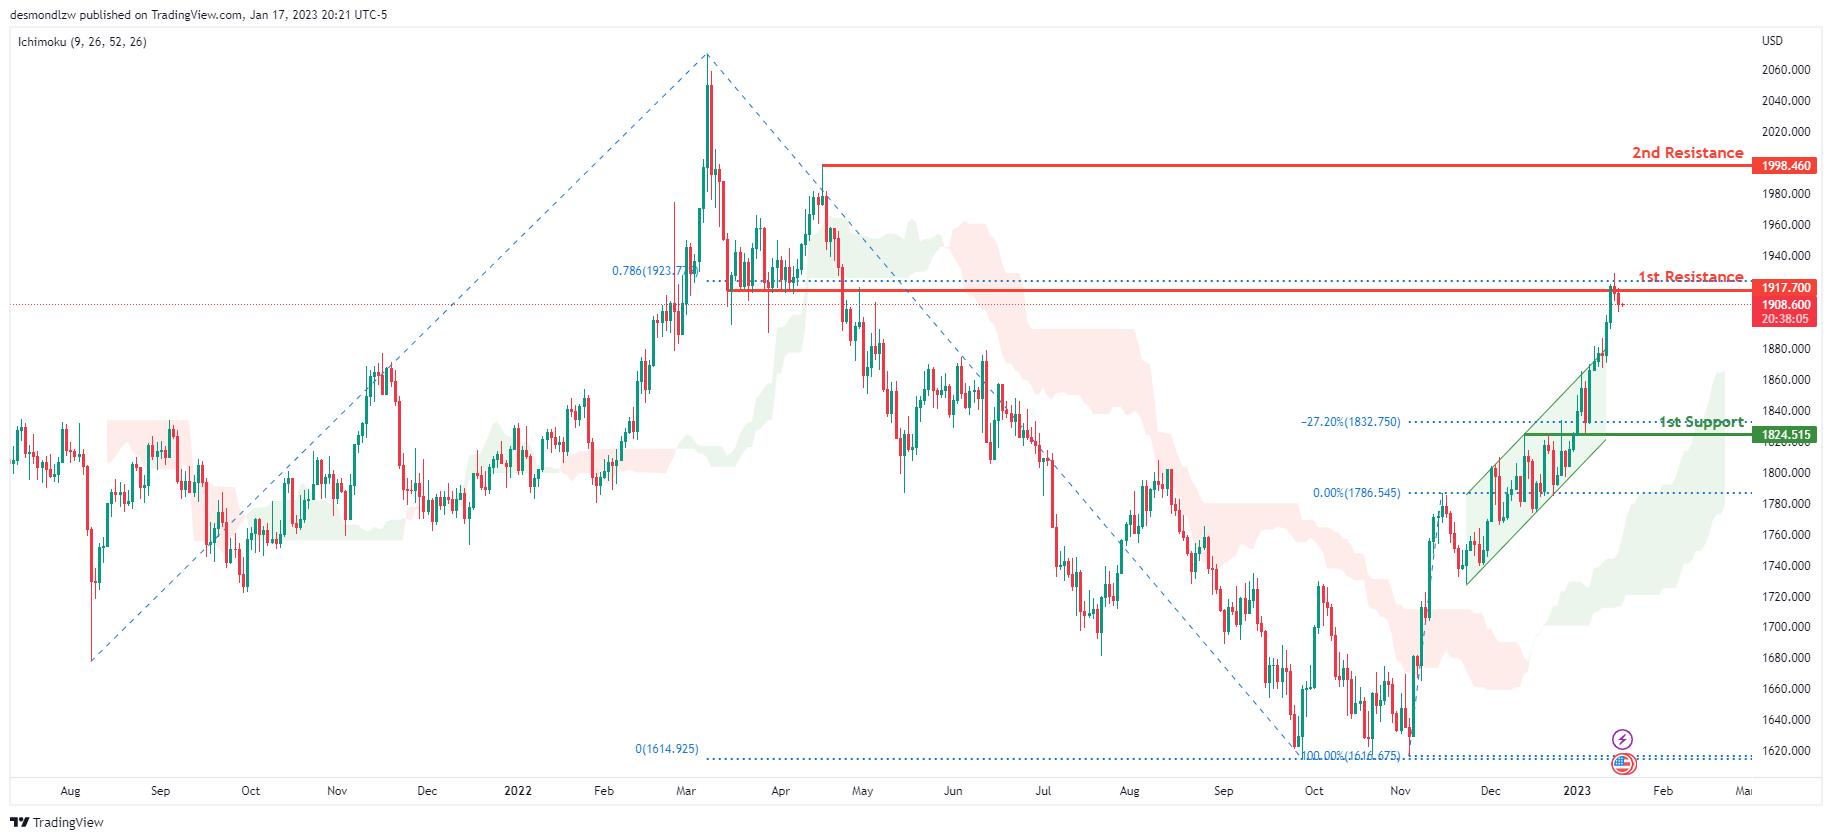
Looking at the Daily chart, my overall bias for XAUUSD is bullish due to the current price crossing above the Ichimoku cloud, indicating a bullish market. To add support to this bias, price has also broken above the bullish ascending channel. If this bullish momentum continues, expect the price to possibly break the 1st resistance at 1917.700 where the 78.6% Fibonacci projection line is, before heading towards the 2nd resistance at 1998.460, where the previous swing high is. In an alternative scenario, price could possibly head back down to retest the 1st support at 1824.515 where the -27.2% Fibonacci expansion line is.
Areas of consideration:
- H4 time frame, 1st resistance at 1917.700
- H4 time frame, 2nd resistance at 1998.460
- H4 time frame, 1st support at 1824.515
- H4 time frame, 2nd support at 1824.515
AUD/USD:
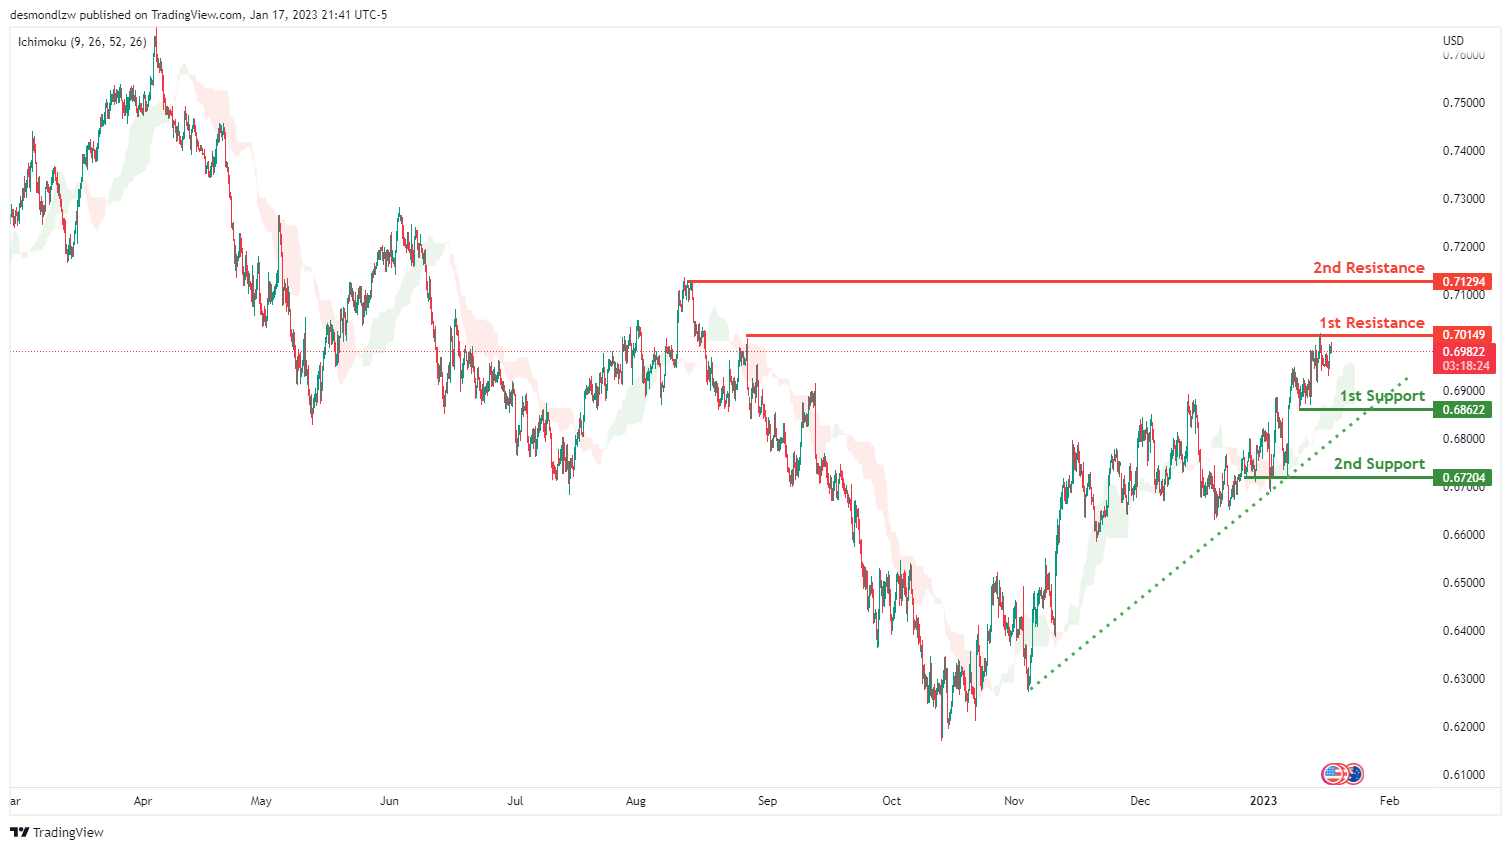
Looking at the H4 chart, we can see that the 1st support is at 0.71294 which is an overlap resistance .There is an ascending trend line that starts from 3rd JAN 2023 which suggests that there is bullish momentum. Price is also above our Ichimoku cloud suggesting further bullish momentum. 1st resistance is at 0.70149 which is an overlap resistance. 2nd resistance is slightly higher at 0.71294
Areas of consideration
- H4, 1st resistance at 0.70149
- H4, 2nd resistance at 0.71294
- H4, 1st support at 0.71294
NZD/USD:
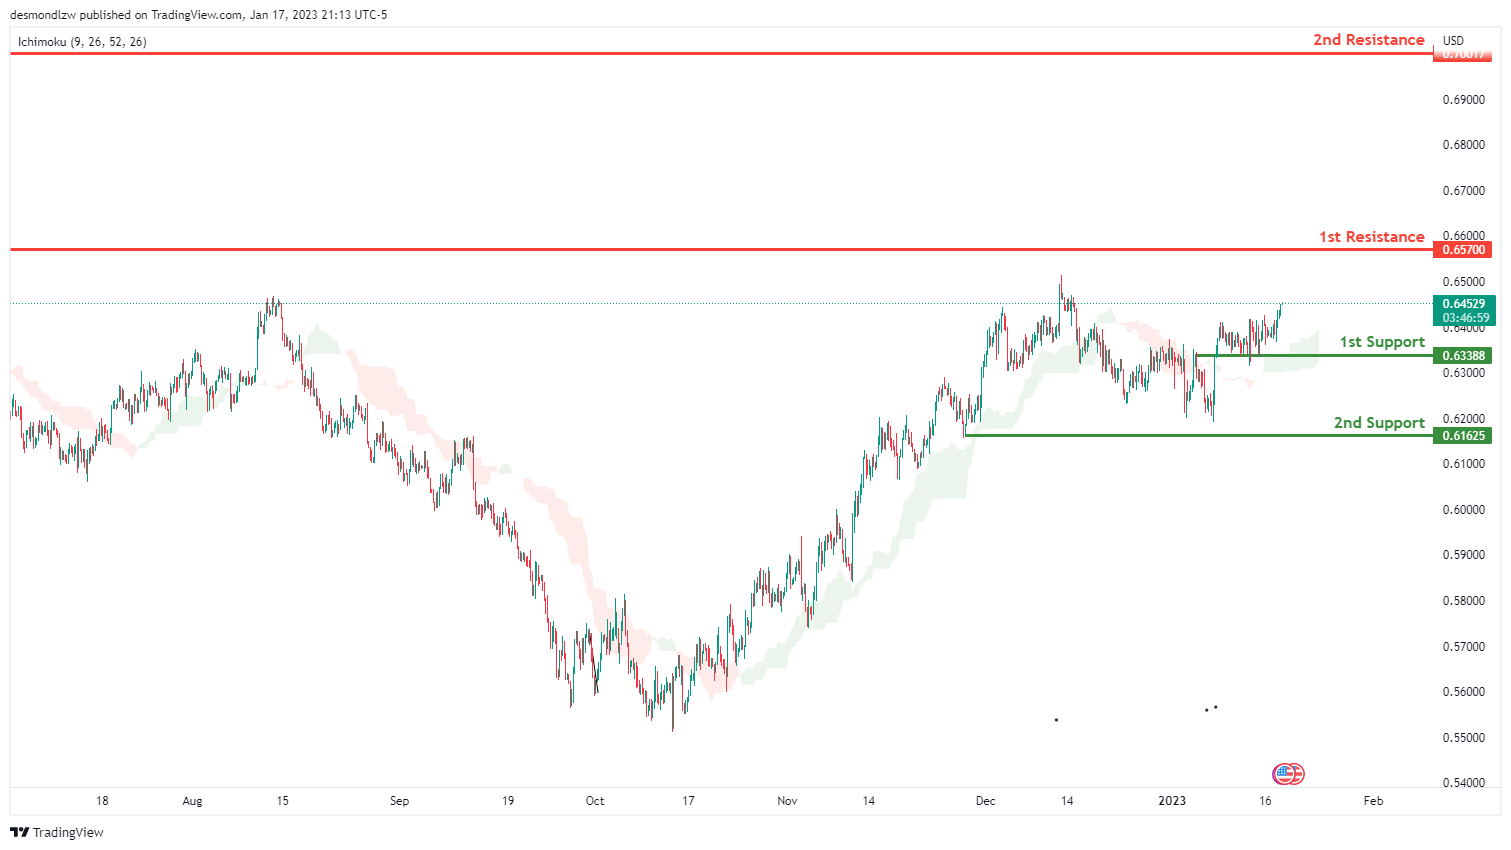
Looking at the H4 chart, we can see that the 1st support is at 0.63388 which is an overlap support. If price breaks this level, we could see it drop to 2nd support down at 0.61625.
For the resistance, our 1st resistance is at 0.65700 which is an recent swing high resistance . If price breaks this level, it could go up to the 2nd resistance at 0.70017 which is the highest price since jun 2022.
Areas of consideration:
- H4 time frame, 1st resistance at 0.65700
- H4 time frame, 2nd resistance at 0.70017
- H4 time frame, 1st support at 0.63388
- H4 time frame, 2nd support at 0.61625
USD/CAD:
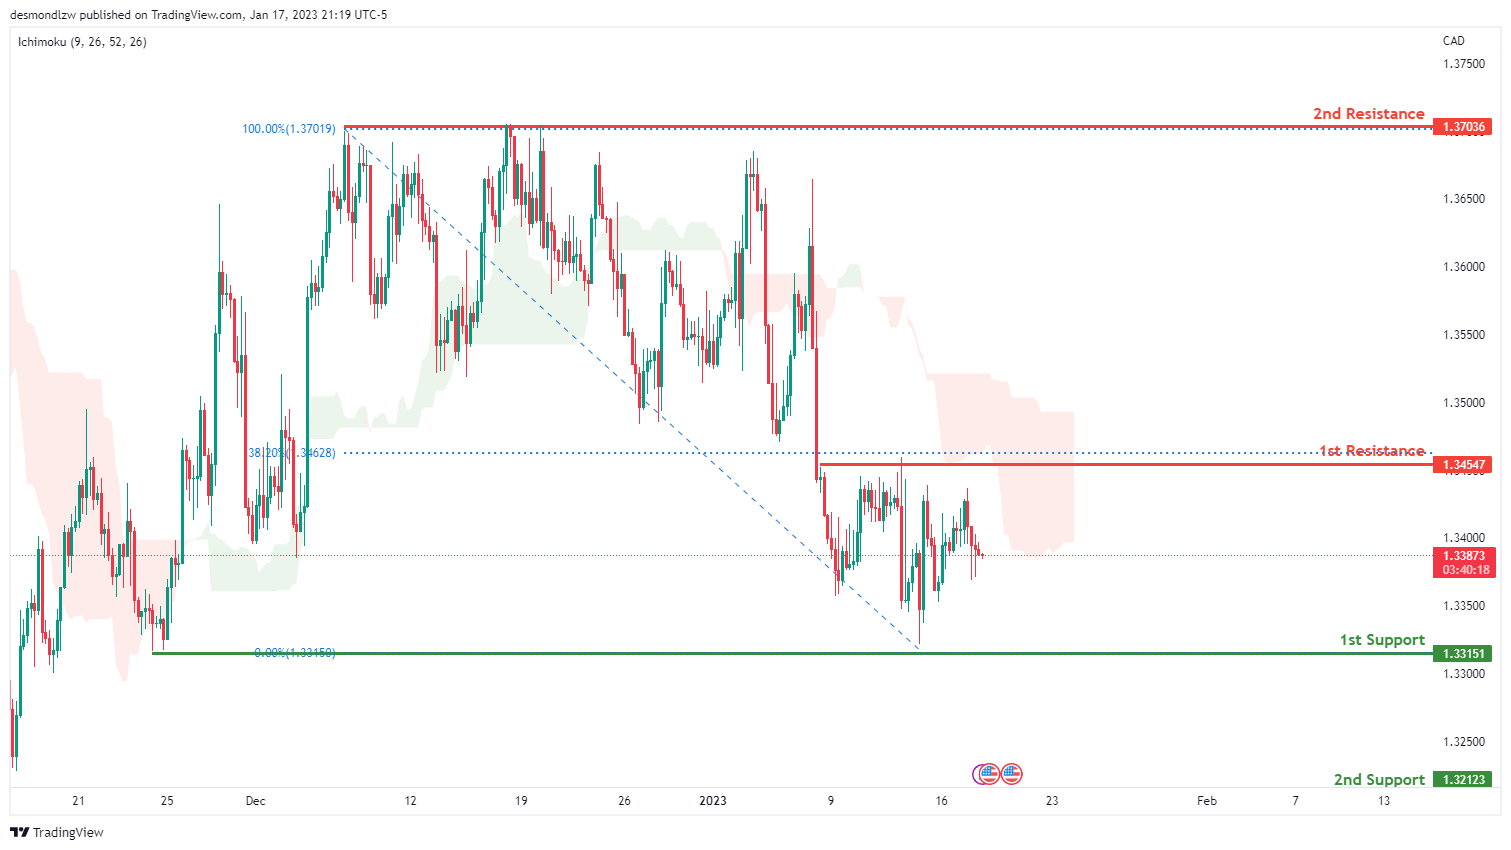
On the H4 chart, the 1st support is at 1.33151 which is the recent swing low support . And the 2nd support 1.32123 which is an overlap support. .
In terms of resistance, the 1st resistance we can see is at 1.34547 which is an overlap resistance that happens to coincide with the 38.2% fibonacci retracement. If price breaks this level, it could go up to the 2nd resistance at 1.37036 which is a recent swing high resistance
Areas of consideration:
- H4 time frame, 1st resistance at 1.34547
- H4 time frame. 2nd resistance at 1.37036
- H4 time frame, 1st support at 1.33151
- H4 time frame, 2nd support at 1.32123
OIL:
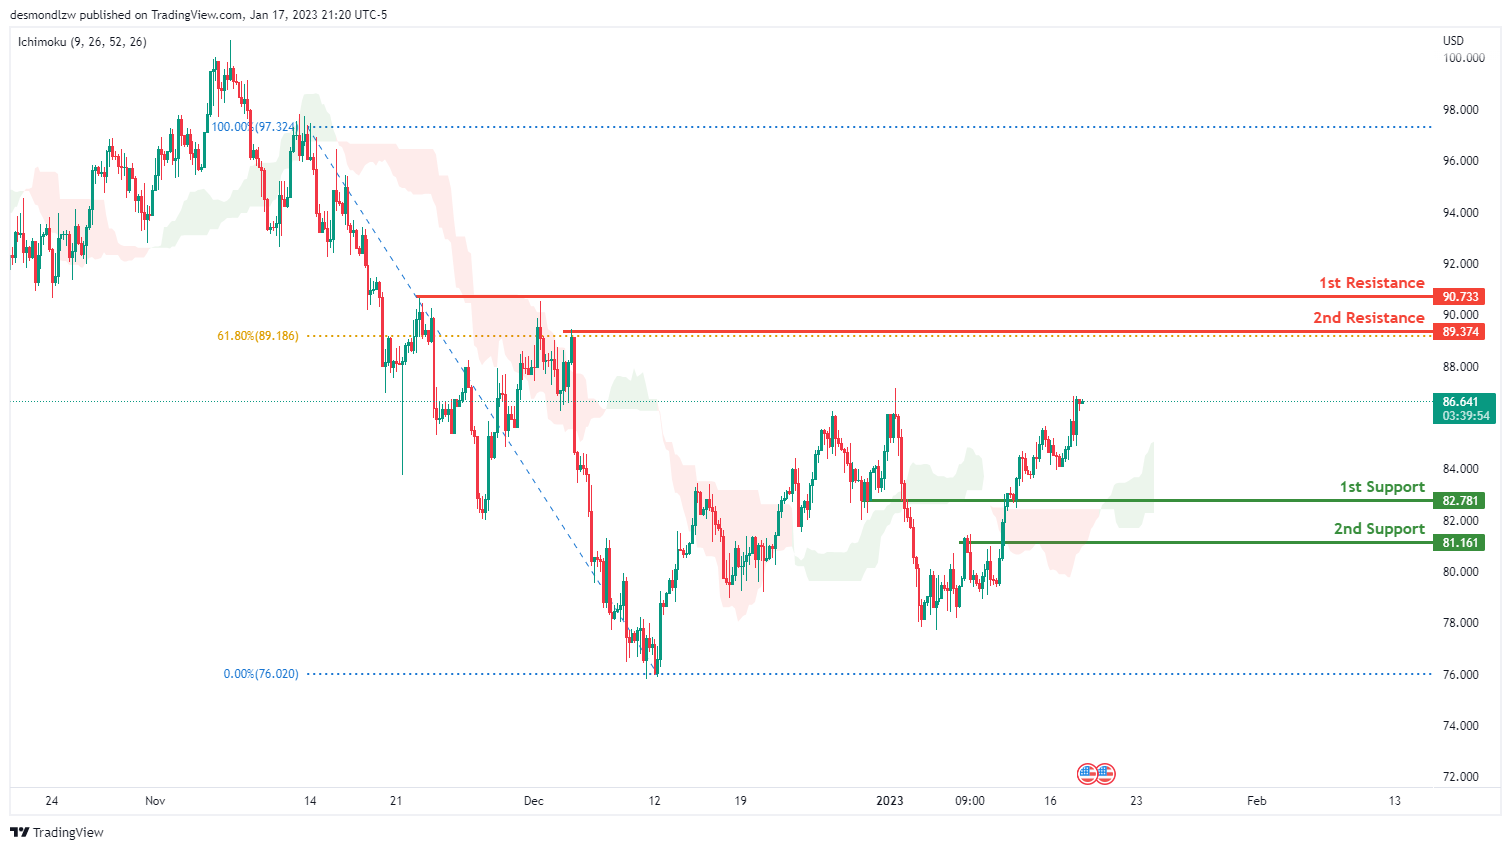
Looking at the H4 chart, we can see that the 1st resistance is at 86.289 If the price breaks this level, we could see the price head up to our 2nd resistance level at 88.676 which is in line with the 50% fibonacci retracement.
In terms of support, we can see our 1st support at 82.409 which is overlap support. Breaking this level would trigger a further drop to our 2nd support at 79.435
Areas of consideration:
- H4 time frame, 2nd resistance at 88.676
- H4 time frame, 1st resistance at 86.289
- H4 time frame,1st support at 82.409
- Hr time frame, 2nd support at 79.435
Dow Jones Industrial Average:
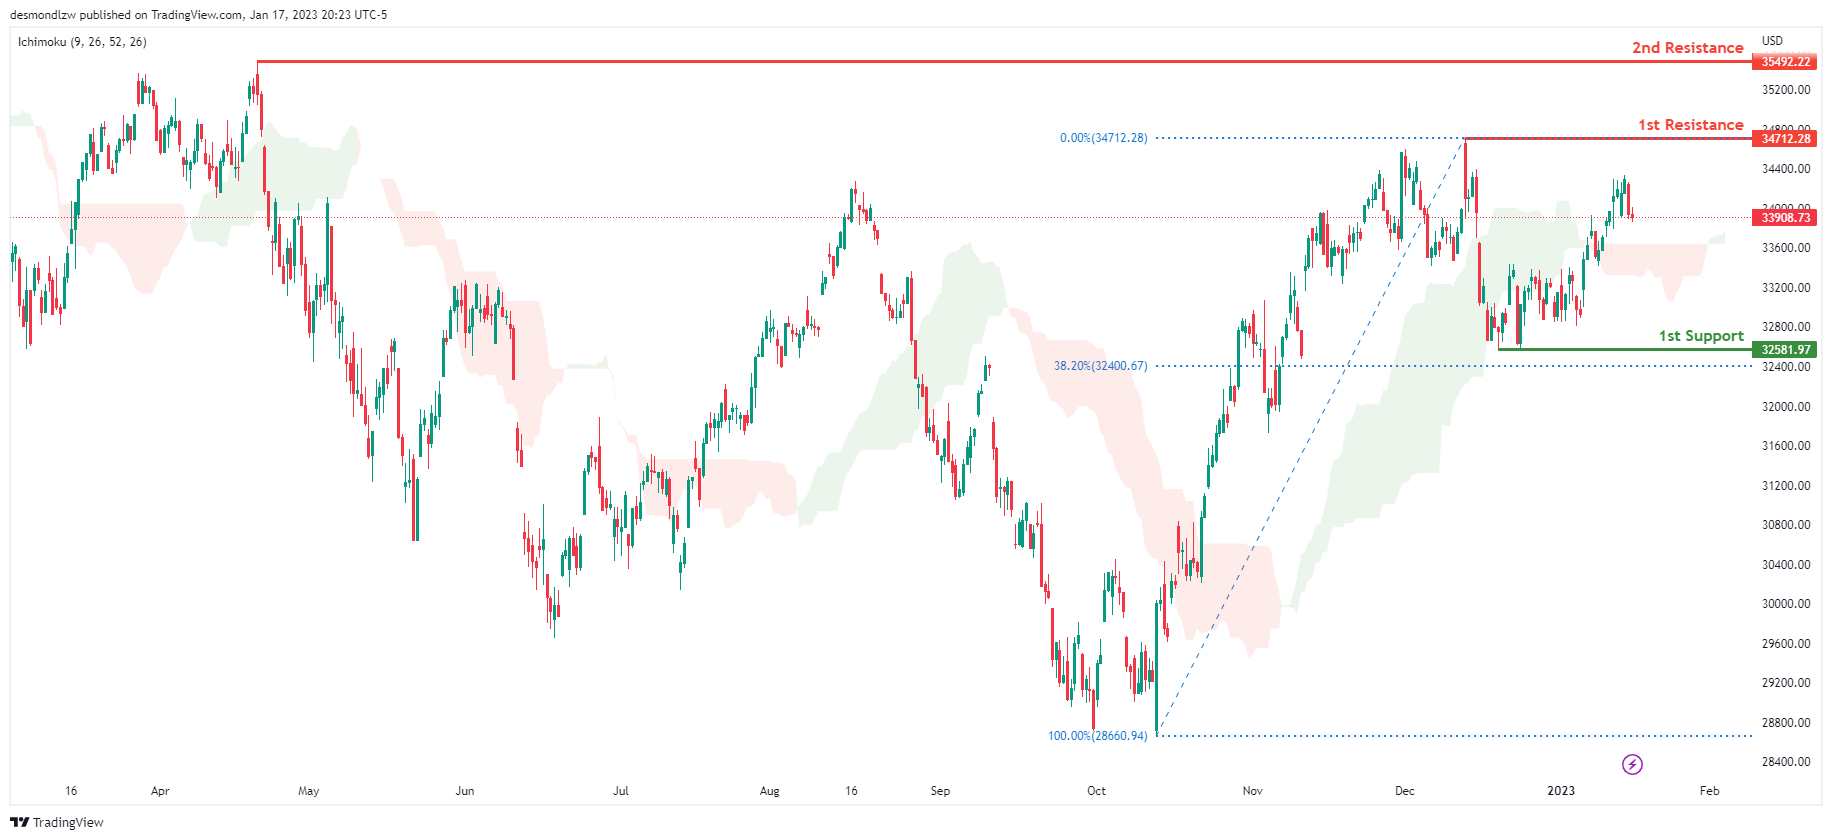
On the H4 chart, the overall bias for DJI is bullish. To add confluence to this, the price is crossing above the Ichimoku cloud which indicates a bullish market. If this bullish momentum continues, expect the price to possibly continue heading towards the 1st resistance line at 34712.28, where the recent swing high is. In an alternative scenario, price could possibly head back down towards the 1st support at 32581.97, slightly above where the 38.2% Fibonacci line is.
Areas of consideration:
- H4 time frame, 1st support at 32581.97
- H4 time frame, 1st Resistance at 34712.28
DAX:
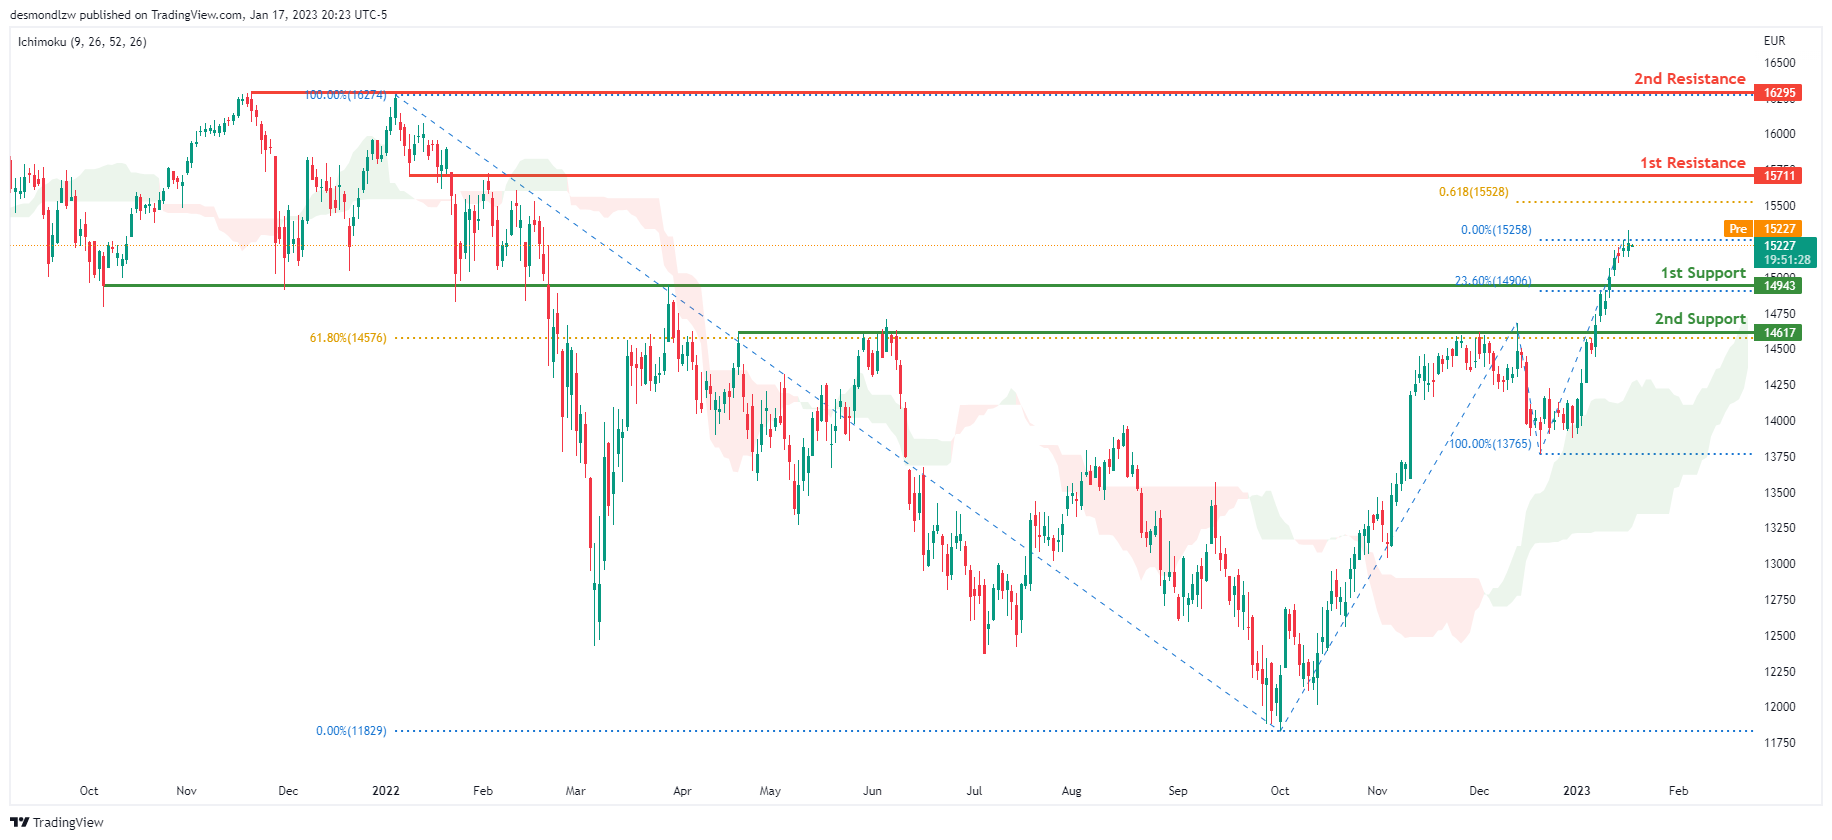
Looking at the Daily chart, my overall bias for DAX is bullish due to the current price crossing above the Ichimoku cloud, indicating a bullish market. If this bullish momentum continues, expect the price to possibly head towards the 1st resistance line at 15711, where the 61.8% Fibonacci projection line is. In an alternative scenario, price could possibly head down to retest the 1st support at 14943, where the 23.6% Fibonacci line is.
Areas of consideration:
- H4 time frame, 1st resistance is at 15711
- H4 time frame, 1st support is at 14943
ETHUSD:
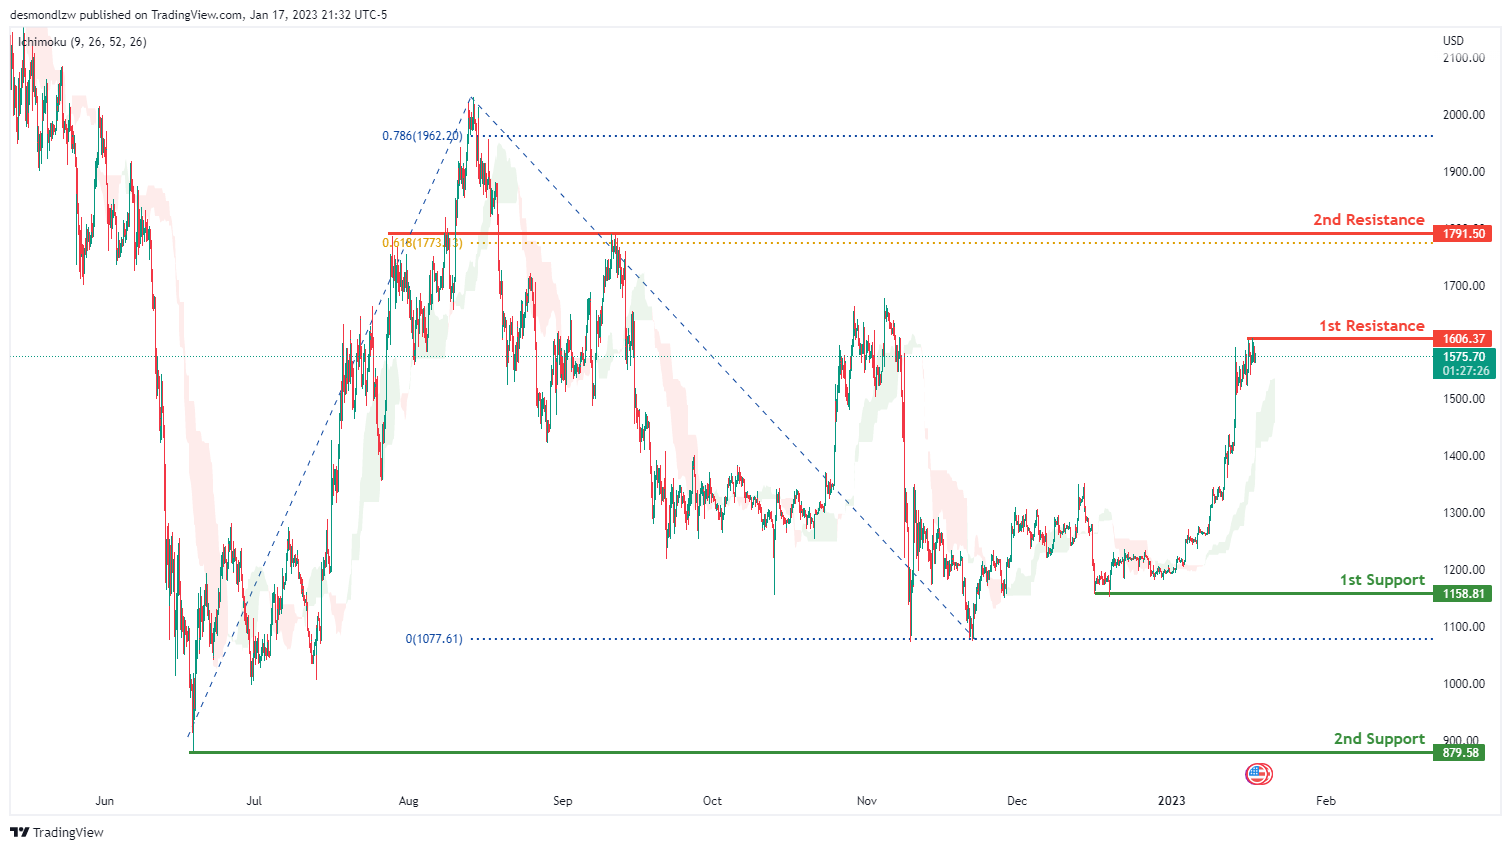
Looking at the H4 chart, my overall bias for ETHUSD is bullish due to the current price crossing above the Ichimoku cloud, indicating a bullish market. If this bullish momentum continues, expect the price to break the 1st resistance at 1606.37 and head u to the 2nd resistance at 1791.50 where the 61.8% Fibonacci projection and the previous swing high is. In an alternative scenario, the price could head back down to retest the 1st support at 1158.81. If the price break through the 1st support line, the price may further down to the 2nd support line 879.58 .
Areas of consideration:
- H4 time frame, 1st resistance of 1791.50
- H4 time frame, 1st resistance of 1606.37
- H4 time frame, 1st support at 1511.21
- H4 time frame, 2nd support at 879.58
BTCUSD:
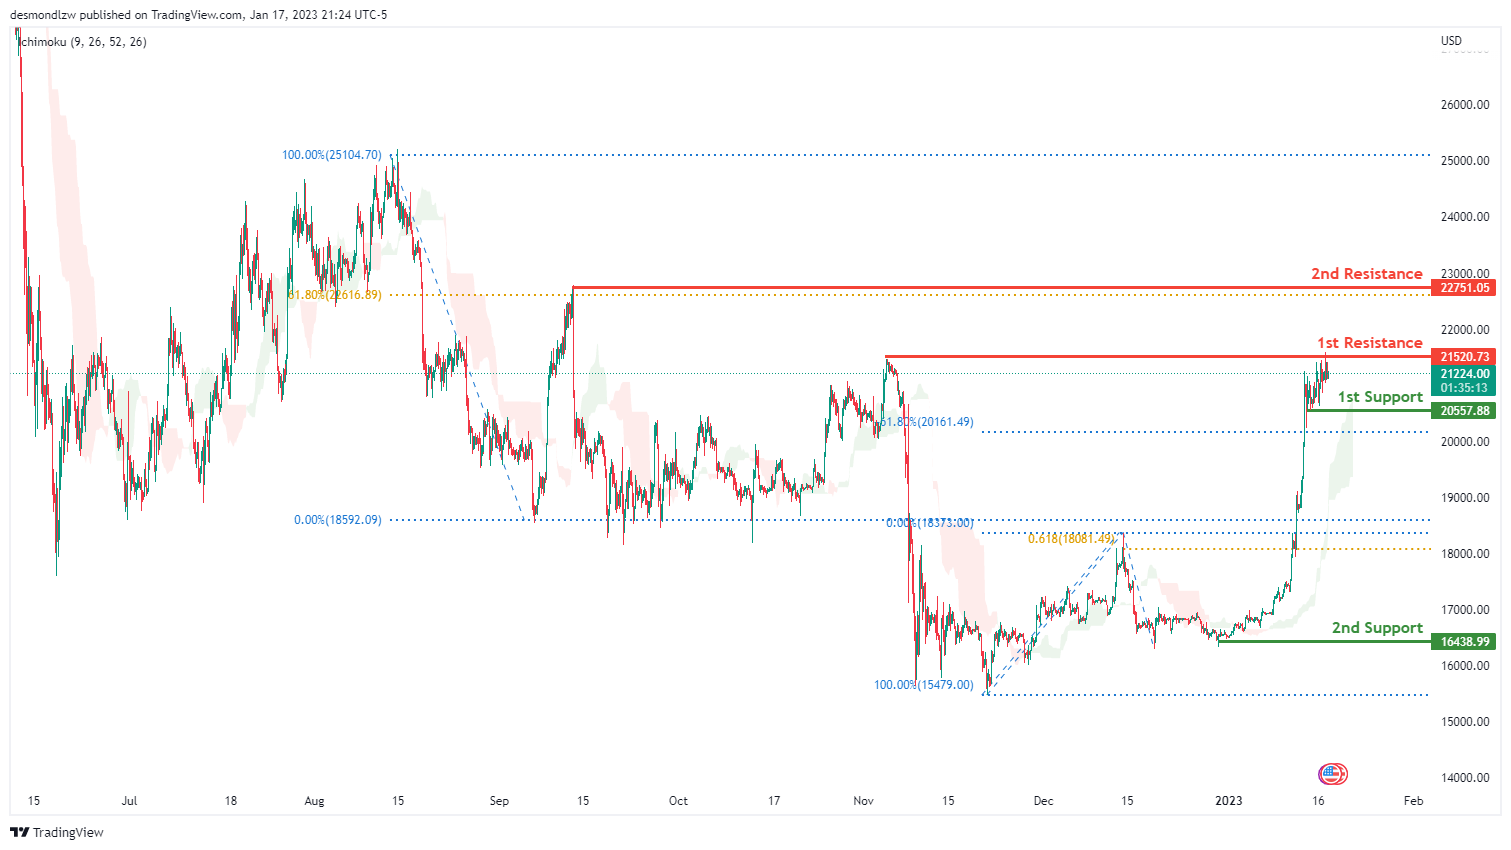
Looking at the H4 chart, my overall bias for BTCUSD is bullish due to the current price being above the Ichimoku cloud, indicating a bullish market. If this bullish momentum continues, expect the price to possibly break the 1st resistance at 21520.73, which is the key level that the price attempts to break, before heading towards the 2nd resistance at 22751.05, where the 61.8% Fibonacci line is. In an alternative scenario, the price could possibly head back down to retest the 1st support at 20557.88.
Areas of consideration:
- H4 time frame, 1st resistance 21520.73
- H4 time frame, 2nd resistance 22751.05
- H4 time frame, 1st support at 20557.88.
S&P 500:
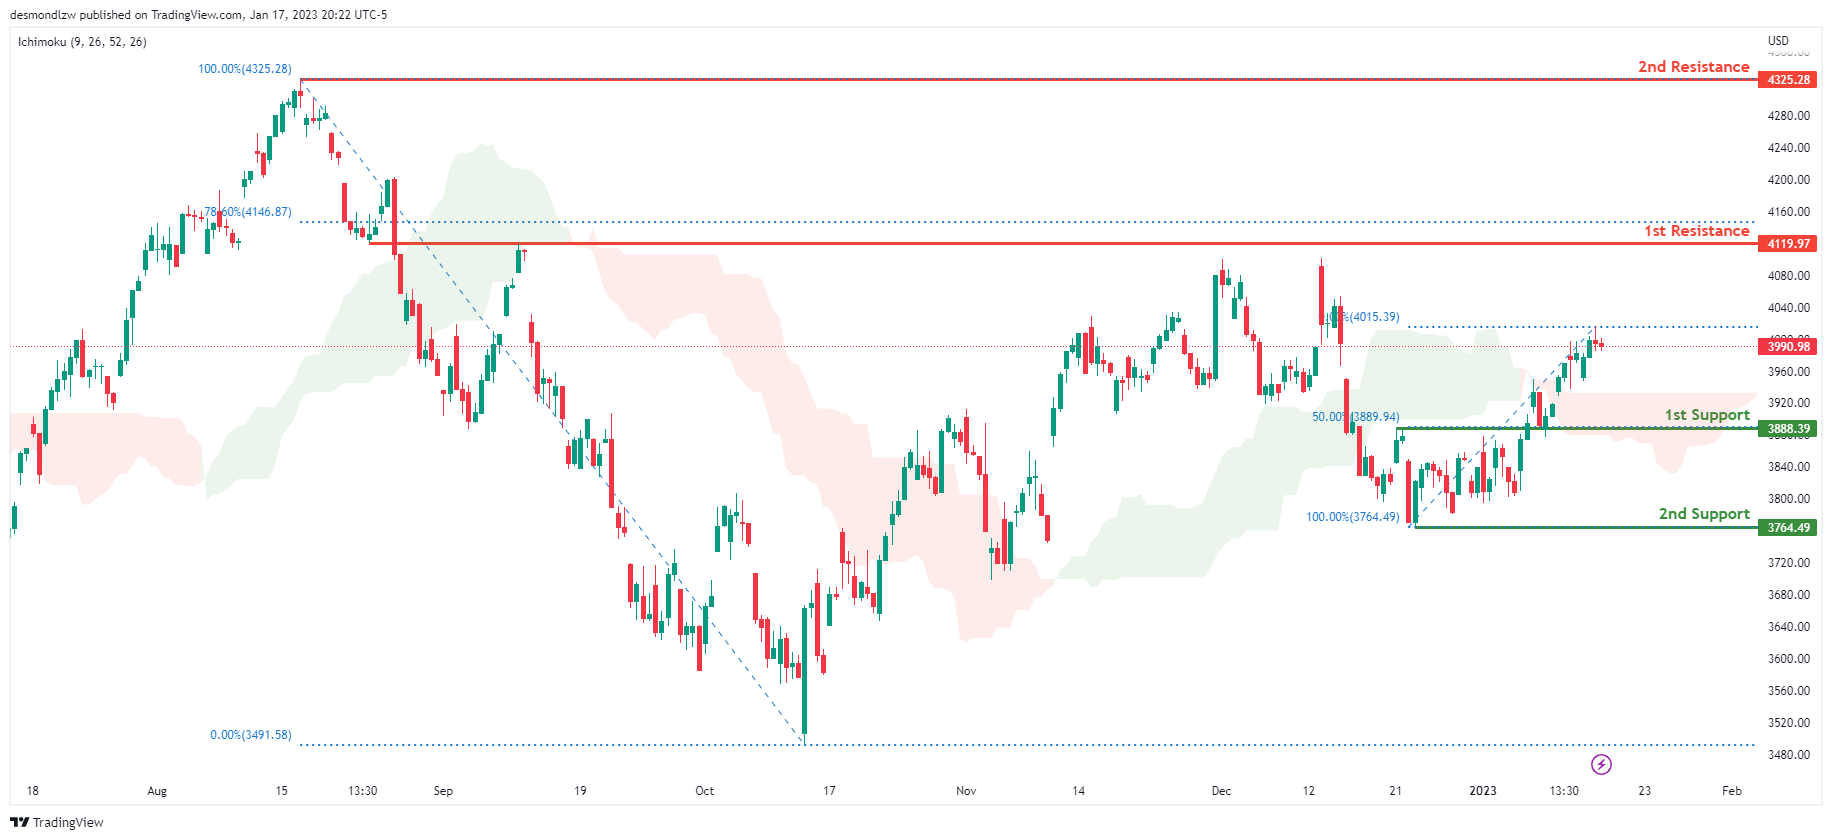
Looking at the H4 chart, my overall bias for S&P500 is bullish due to the current price being above the Ichimoku cloud, indicating a bullish market. If this bullish momentum continues, expect the price to continue heading towards the 1st resistance at 4119.97, where the 78.6% Fibonacci line is. In an alternative scenario, price could possibly head back down to retest the 1st support at 3888.39, where the 50% Fibonacci line is.
Areas of consideration:
- H4 time frame, 1st support at 3888.39
- H4 time frame, 1st resistance at 4119.97
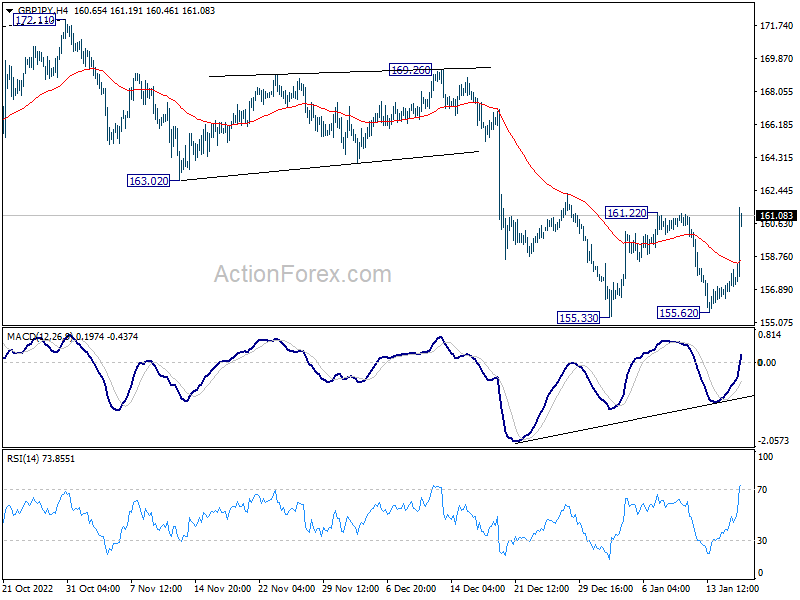
GBP/JPY Daily Outlook
Daily Pivots: (S1) 156.57; (P) 157.30; (R1) 158.22; More...
GBP/JPY's break of 161.22 resistance suggests short term bottoming at 155.33. Intraday bias is back on the upside. Sustained trading above 55 day EMA (now at 162.39) will argue that whole correction from 172.11 has completed. Further rally should then be seen back to 169.26/172.11 resistance zone. Nevertheless, rejection by 55 day EMA will retain near term bearishness for another fall through 155.33 at a later stage.
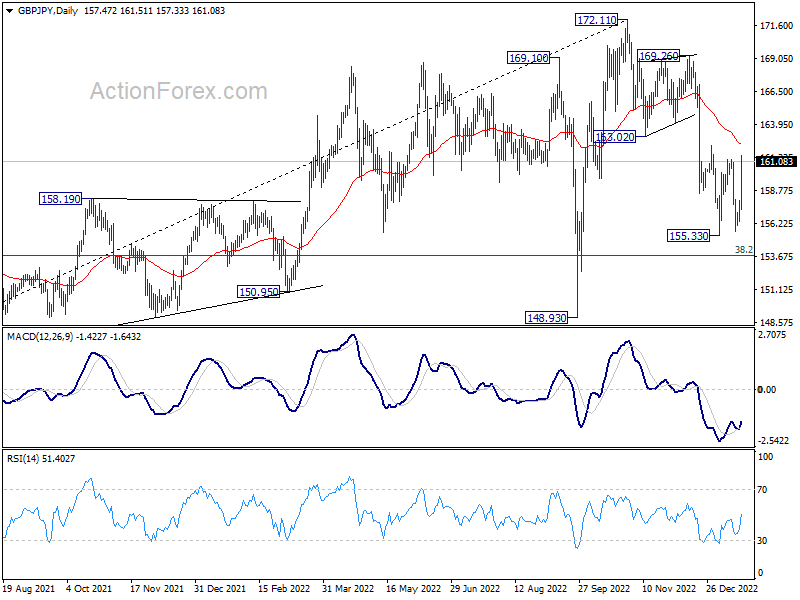
In the bigger picture, as long as 163.02 support turned resistance holds, decline from 172.11 medium term top is expected to continue to 38.2% retracement of 123.94 to 172.11 at 153.70. Sustained break there will raise the change of trend reversal and target 61.8% retracement at 142.34. Nevertheless, break of 163.02 support turned resistance will argue that the decline has completed, and retain medium term bullishness.
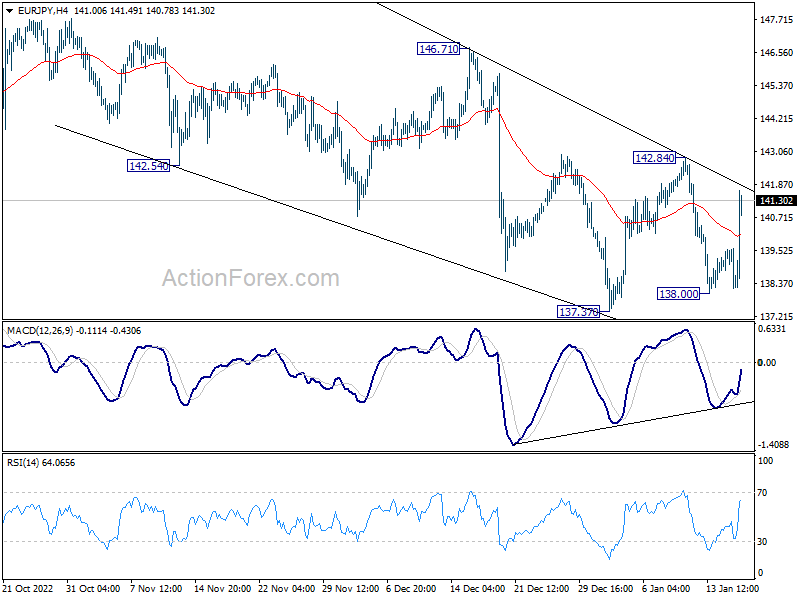
EUR/JPY Daily Outlook
Daily Pivots: (S1) 137.77; (P) 138.70; (R1) 139.19; More....
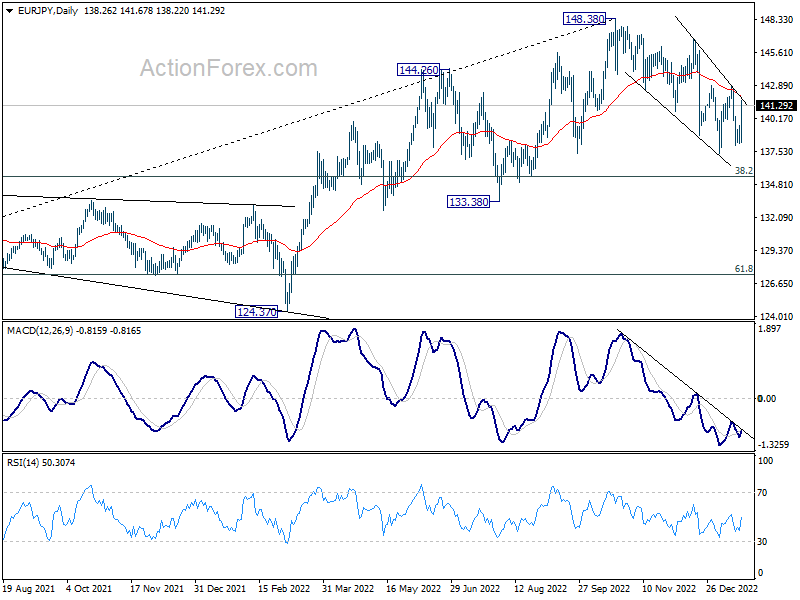
EUR/JPY rebounded strongly today but stays below 142.84 resistance. Intraday bias remains neutral first. On the downside, break of 138.00 support should resume whole decline from 148.38 to 135.40 fibonacci level next. however, firm break of 142.84 will argue that the correction from 148.38 has completed, and bring stronger rise back to 146.71 resistance.
In the bigger picture, as long as 55 week EMA (now at 138.64) holds, larger up trend from 114.42 (2020 low) is still in progress for 149.76 long term resistance. However, firm break of 55 week EMA will bring deeper fall to 38.2% retracement of 114.42 to 148.38 at 135.40. Sustained break there will raise the chance of trend reversal, and target 61.8% retracement at 127.39.
EUR/GBP Daily Outlook
Daily Pivots: (S1) 0.8743; (P) 0.8815; (R1) 0.8852; More...
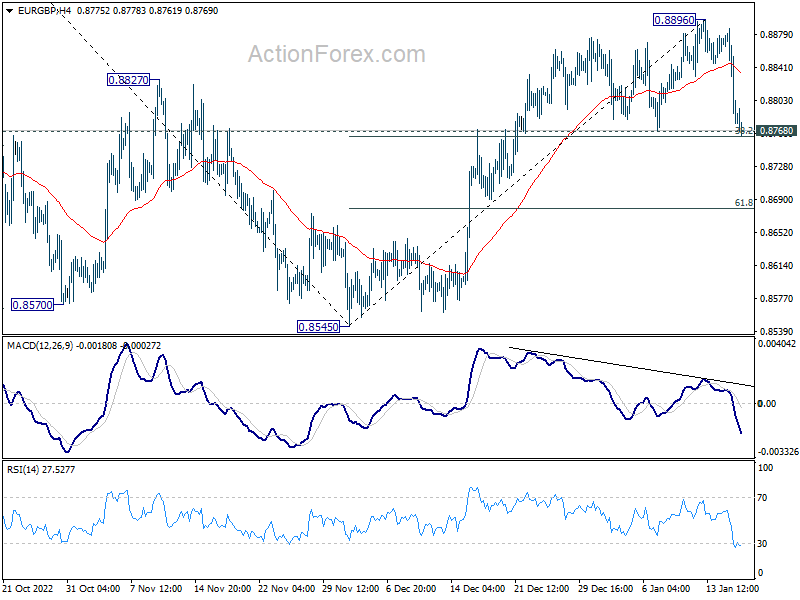
Immediate focus is now on 0.8768 support in EUR/GBP. Sustained break of 0.8768, and 38.2% retracement of 0.8545 to 0.8896 at 0.8762, will argue that whole rebound from 0.9545 has completed. Deeper fall would be seen back to 61.8% retracement at 0.8679, and possibly further to retest 0.8545 low. On the upside, break of 0.8896 will resume the rally from 0.8545 to 61.8% projection of 0.8545 to 0.8876 from 0.8768 at 0.8973.
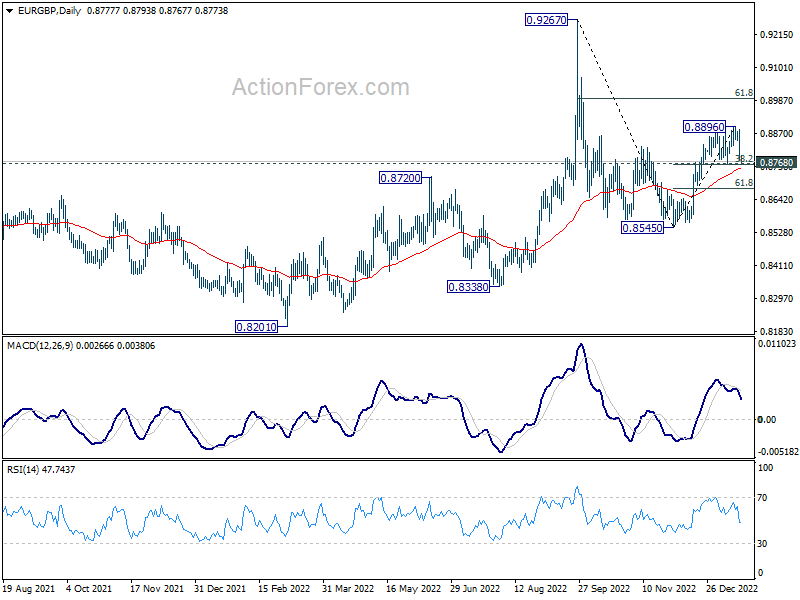
In the bigger picture, with 55 week EMA (now at 0.8618) intact, the favored case is that rise from 0.8545 is part of the whole up trend from 0.8201 (2022 low). Sustained trading above 61.8% retracement of 0.9276 to 0.8545 at 0.8997 will pave the way to retest 0.9267 high next. However, break of 0.8768 support will dampen this view and bring retest of 0.8545 low instead.
EUR/AUD Daily Outlook
Daily Pivots: (S1) 1.5372; (P) 1.5498; (R1) 1.5567; More...
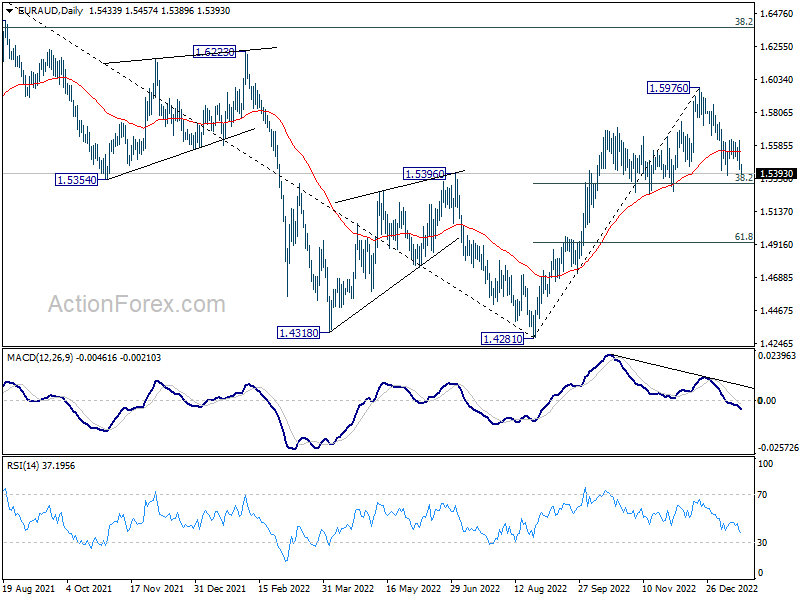
No change in EUR/AUD's outlook and intraday bias remains neutral. Another fall cannot be ruled out, but strong support could be seen from 38.2% retracement of 1.4281 to 1.5976 at 1.5329 to complete the correction from 1.5976. Firm break of 1.5614 minor resistance will turn bias back to the upside for retesting 1.5976. However, sustained trading below 1.5329 will carry larger bearish implication and target 61.8% retracement at 1.4928.
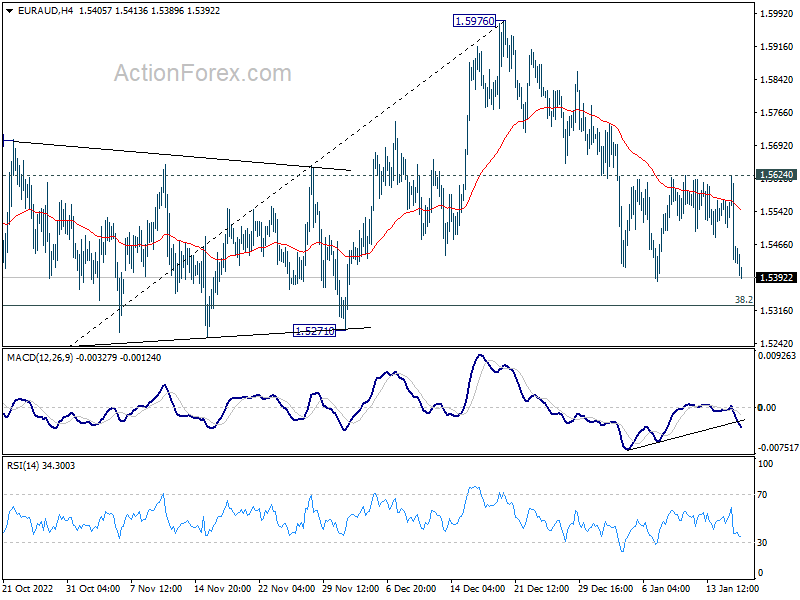
In the bigger picture, it's still early to confirm if rise from 1.4281 represents bullish trend reversal. But as long as 1.5271 support holds, such rally is in favor to continue. Break of 1.5976 will target 1.6434 key resistance next. On the other hand, firm break of 1.5271 will retain medium term bearishness instead.
EUR/CHF Daily Outlook
Daily Pivots: (S1) 0.9912; (P) 0.9970; (R1) 1.0005; More....
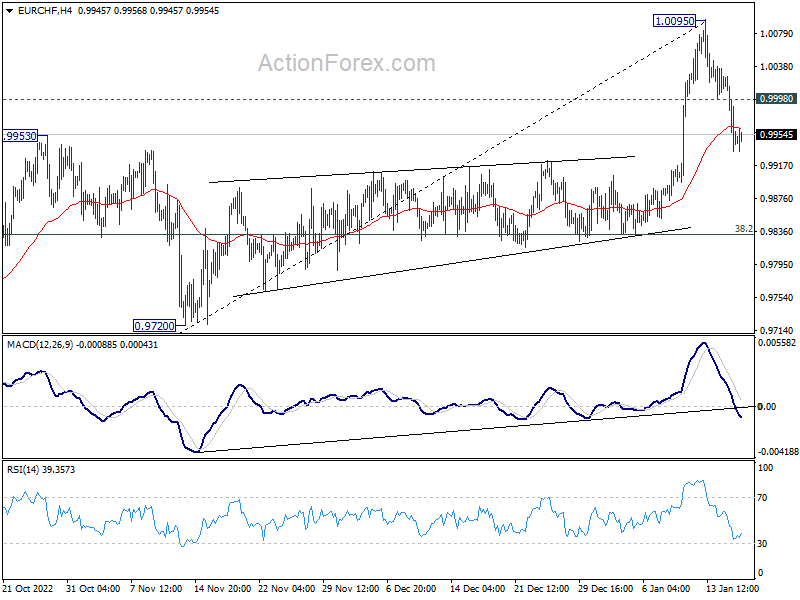
EUR/CHF's break of 0.9953 resistance turned support indicates short term topping at 1.0095. Intraday bias is mildly on the downside for 55 day EMA (now at 0.9877), or further to 38.2% retracement of 0.9407 to 1.0095 at 0.9832. On the upside, above 0.9998 minor resistance will turn bias back to the upside for retesting 1.0095 high instead.
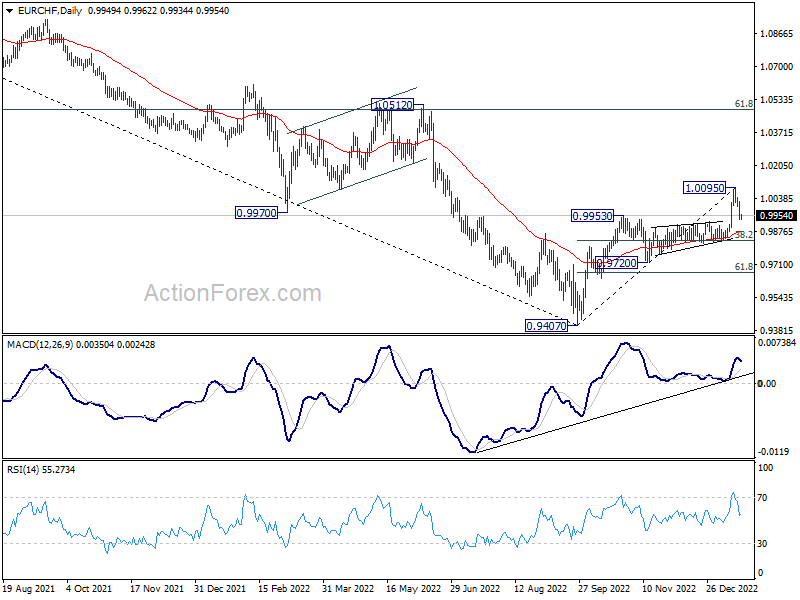
In the bigger picture, break of 38.2% retracement of 1.1149 to 0.9407 at 1.0072 and 55 week EMA (now at 1.0041) is taken as an initial sign of long term bullish reversal. Further rally is expected as long as 55 days EMA (now at 0.9866) holds. Next target is 1.0505 cluster resistance (2020 low at 1.0505, 61.8% retracement of 1.1149 to 0.9407 at 1.1484). Reactions from there should reveal long term momentum.
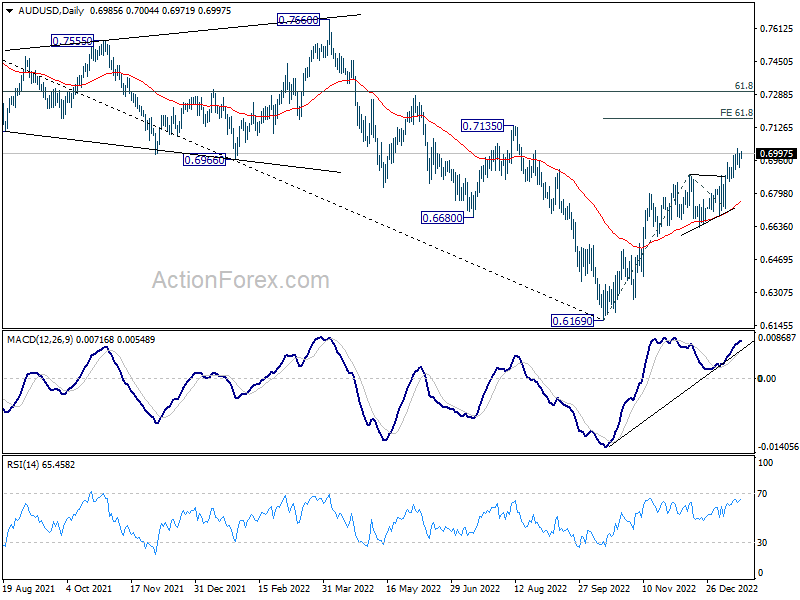
AUD/USD Daily Report
Daily Pivots: (S1) 0.6945; (P) 0.6971; (R1) 0.7013; More...
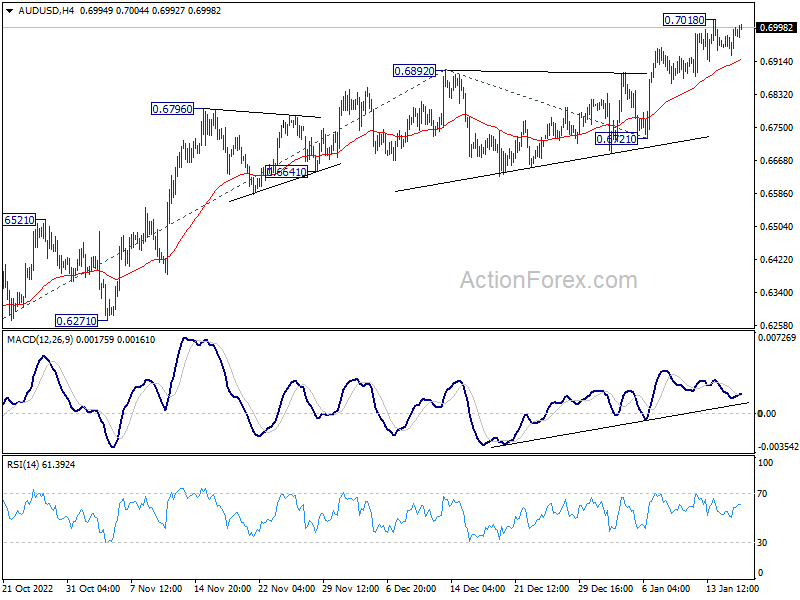
Intraday bias in AUD/USD remains neutral as consolidation continues below 0.7018. Outlook will stay bullish as long as 0.6721 support holds. Break of 0.7018 will resume larger rise from 0.6169 to 61.8% projection of 0.6169 to 0.6892 from 0.6721 at 0.7168.
In the bigger picture, corrective decline from 0.8006 (2021 high) should have completed with three waves down to 0.6169 (2022 low). Further rally should be seen to 61.8% retracement of 0.8006 to 0.6169 at 0.7304. Sustained break there will pave the way to retest 0.8006. This will now remain the favored case as long as 0.6721 support holds.