Sample Category Title
Pound Rises as Retail Sales Rebound
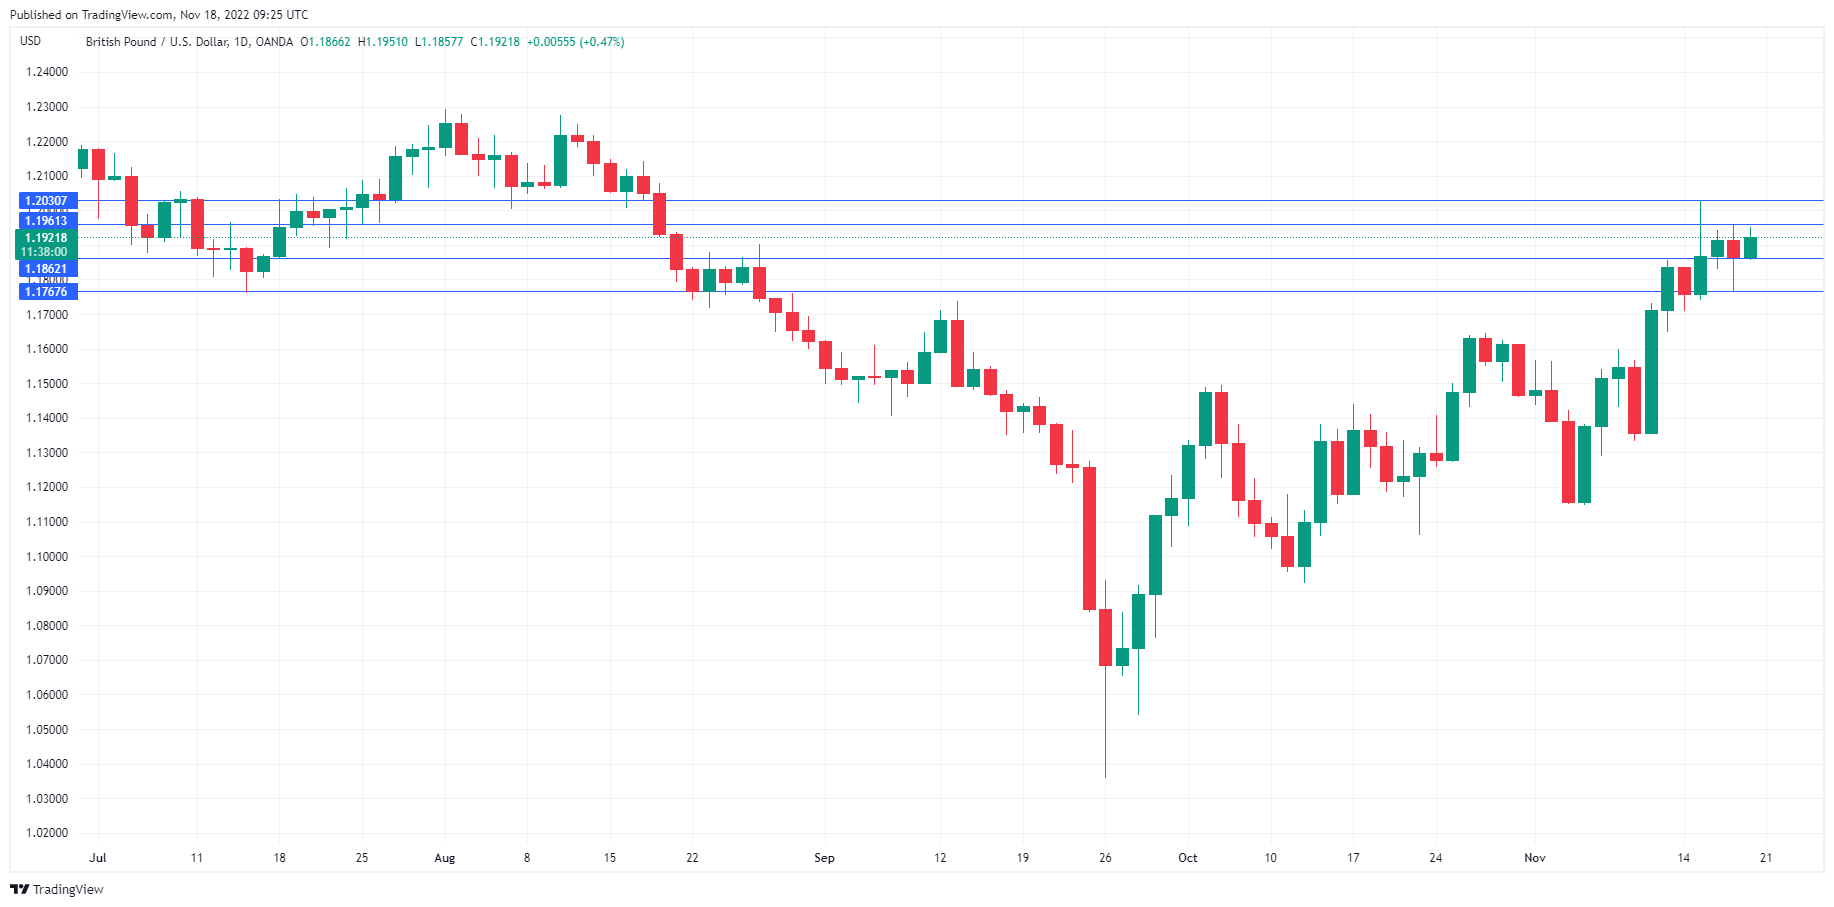
The British pound has pushed above the 1.19 line on Friday. GBP/USD is currently trading at 1.1924, up 0.49%.
Retail sales bounce back
Retail sales showed some life in October, posting a gain of 0.6% MoM. This was a strong rebound from the -1.5% reading in September and above the consensus of 0.0%. The gain is welcome news and has provided the pound with a boost today. Still, consumer spending has a long road to recovery, as retail sales came in at -6.1% YoY. This beat the September figure of -6.8% and the forecast of -6.5%, but the struggling UK economy will need a sharp turnaround in consumer spending, a key driver of economic growth. Consumer confidence remains in deep-freeze but improved slightly in October to -44, up from -49 in September.
With the UK economy in a recession, the government’s bleak Autumn Statement was no surprise. Finance Minister Hunt announced a mix of tax hikes and spending cuts. There wasn’t much for Britons to cheer about in the austerity budget, but perhaps there is a sense of relief that it is a step in the direction to restore fiscal responsibility, after the shenanigans of Liz Truss and her mini-budget caused a financial crisis.
The BoE is projecting that unemployment will rise to 6.5% and the country will experience negative growth in the second half of this year, throughout 2023 and into the first half of 2024. GDP declined by 0.2% in the third quarter, and the headwinds look formidable for the UK economy and the British pound.
The Federal Reserve has kept up its hawkish talk in an effort to dampen investor exuberance after the last inflation report fueled speculation that the Fed planned a pivot in policy. Fed member Bullard weighed in this week, urging the Fed to raise rates to at least 5%-5.25%. Bullard went even further, presenting a scenario in which the funds rate would climb as high as 7%. The message helped dampen risk appetite, sending equity markets lower and the US dollar higher.
GBP/USD Technical
- There is resistance at 1.1961 and 1.2030
- GBP/USD has broken below support at 1.1896 and 1.1786. Below, there is support at 1.1660
USDJPY: Bear-Trap Underpins But Action Remains Capped by 100DMA
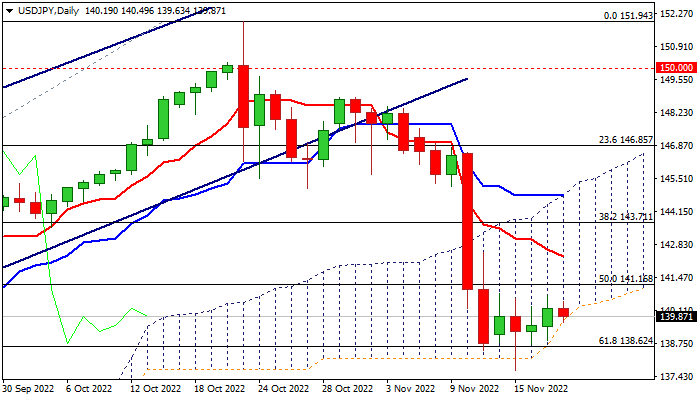
The USDJPY is holding in extended directionless mode, consolidating around 140 handle after last week’s heavy losses (the pair was down 5.7% for the week).
Sharp fall found firm ground at 138.62/14 zone (base of ascending thick daily cloud / Fibo 61.8% of 130.39/151.94 upleg).
Failure to register close below these levels generated initial signal of a bear trap, which would offer stronger support if the action managed to break above current range, capped by 100DMA (140.95).
Also, rising cloud base continues to contain and underpin the action, providing solid support and so far keeping the downside protected.
However, daily studies remain in bearish mode that keeps the downside vulnerable, especially while the action stays capped by 100DMA, keeping in play risk for renewed attack at pivotal supports (138.62/14) clear break of which would signal bearish continuation and expose target at 135.47 (Fibo 76.4%).
Alternative scenario sees sustained break of 100DMA as initial bullish signal for stronger recovery, though bulls would require more evidence (lift through 10DMA at 141.73 and daily Tenkan-sen at 142.30) for confirmation.
Res: 140.95; 141.16; 141.72; 142.30.
Sup: 139.70; 138.62; 137.67; 135.81.
Yen Calm as Inflation Rises Higher
The Japanese yen is unchanged on Friday and is trading at 14.017 in the European session.
Japan’s Core CPI beats forecast
Inflation continues to creep up in Japan. Core CPI accelerated to 3.6% in October, up from 3.0% in September and edging above the consensus of 3.5%. These levels pale in comparison to what we’re seeing in the US, the UK and elsewhere, but Japan hasn’t seen these levels of inflation in 40 years. The country has a deflationary mindset, which leads firms to absorb higher costs for fear of losing customers. However, as inflation continues to move higher, that trend is changing and consumers are feeling the pain of higher prices.
Despite rising inflation and a weak yen, the Bank of Japan is resolute in maintaining its ultra-loose policy in order to support the weak economy. The BoJ has been an outlier as it has capped interest rates while the global trend has been to raise rates, arguing that cost-push inflation is only temporary. BoJ Governor Kuroda has said that inflation should peak after hitting 3%. Kuroda might want to consult with Jerome Powell or Christine Lagarde about making assumptions about inflation peaks, as they found out to their chagrin that inflation was much stickier than they had anticipated.
Fed continues tightening talk
Ever since the last US inflation report sent the equity markets soaring and the US dollar sliding, the Fed has circled the wagons and telegraphed a hawkish message to the markets. The latest salvo came from Fed member Bullard, who urged the Fed to raise rates to 5%-5.25% at a minimum. Bullard also presented a hawkish scenario in which the funds rate would climb all the way to 7%, a message investors clearly didn’t want to hear. Retail sales and unemployment claims were better than expected, another indication that the US economy remains resilient handle further rate hikes. The Fed’s coordinated message and the solid data have quelled the stock market rally and boosted the US dollar.
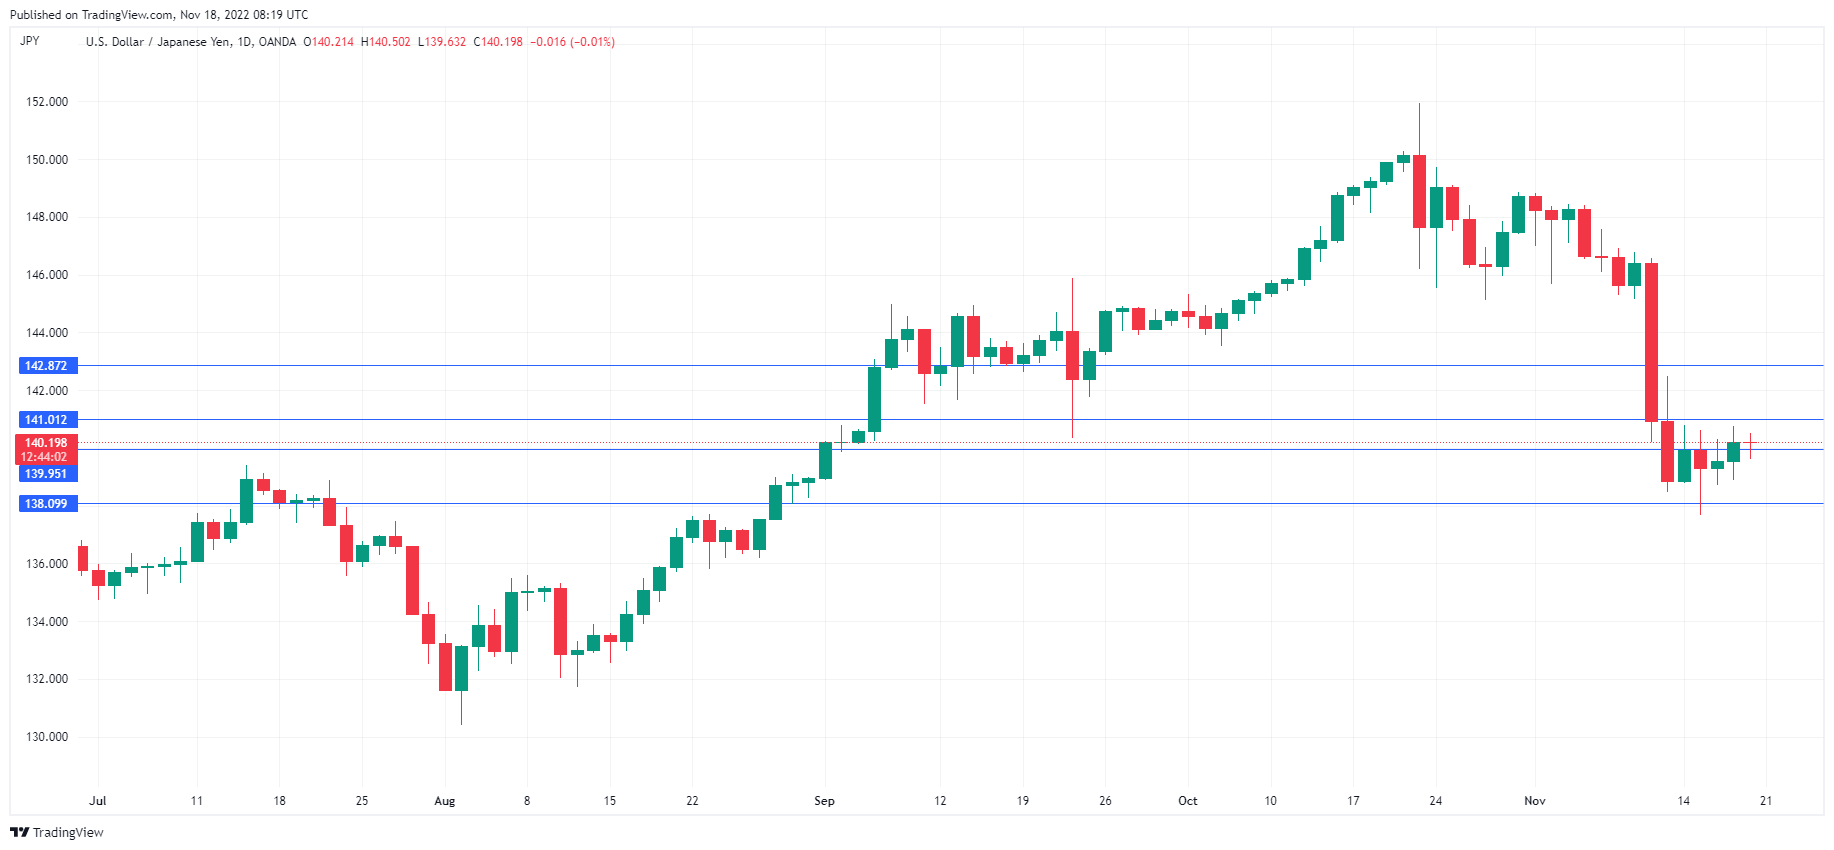
USD/JPY Technical
- USD/JPY is testing support at 139.95. Below, there is support at 138.09
- There is resistance at 141.01 and 142.87
EURGBP Lacks Bullish Mood; Support at 0.8700
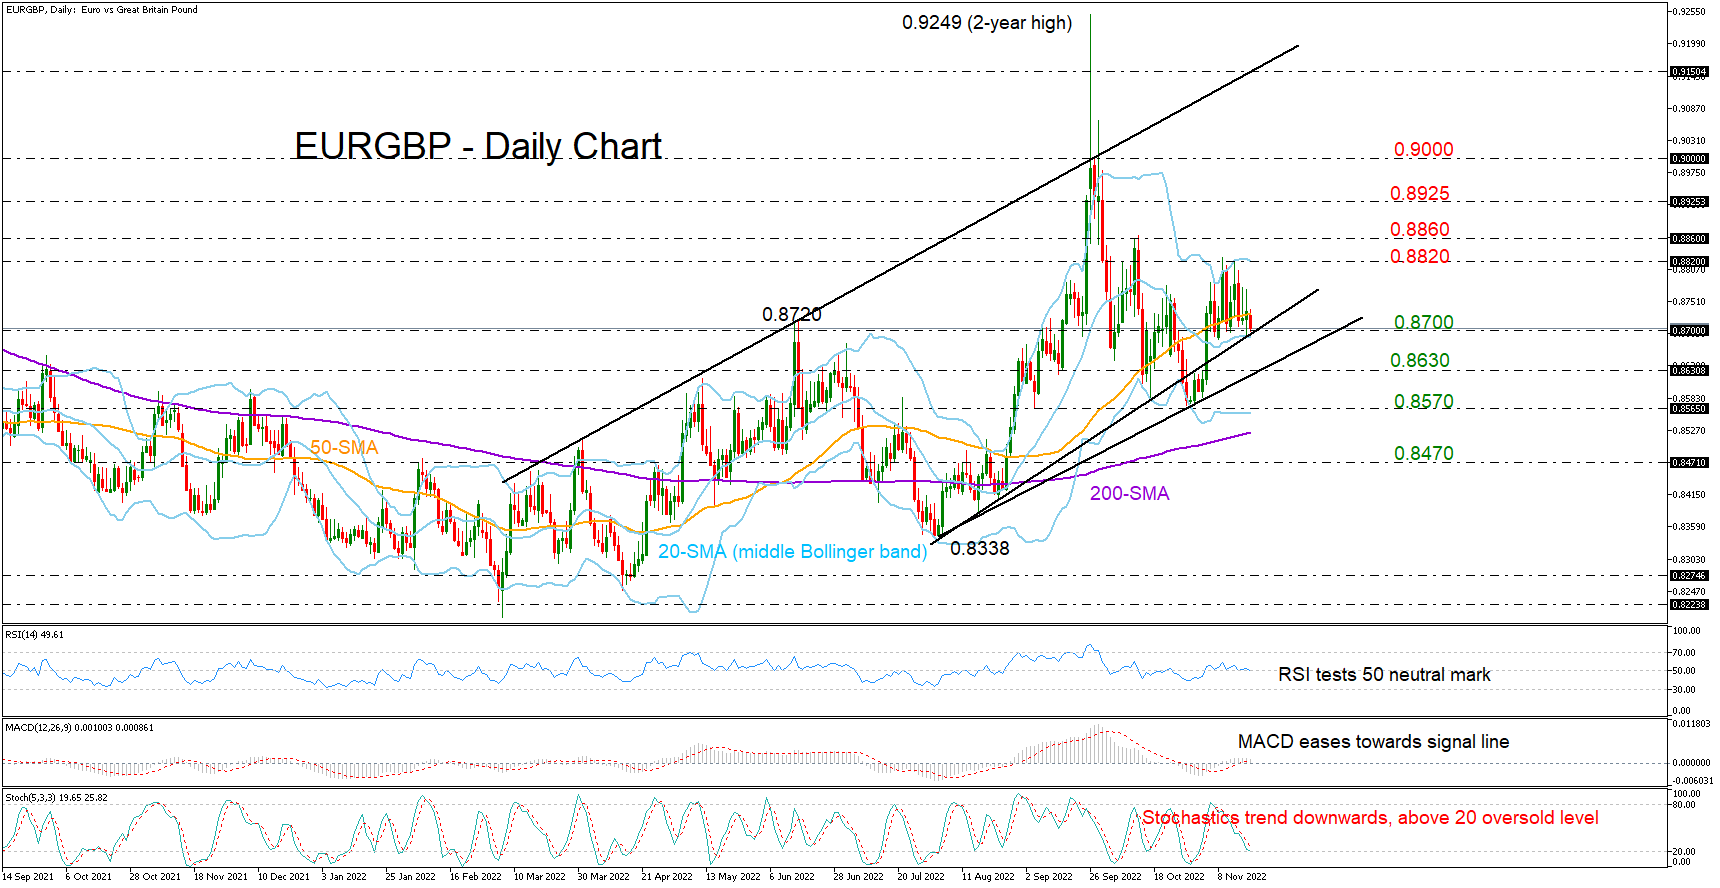
EURGBP has been in a consolidation phase over the past two weeks, maintaining a foothold above the 0.8700 level and the support trendline drawn from the August low of 0.8338.
The momentum indicators currently reflect a neutral-to-bearish bias. The RSI and the MACD have been gradually diminishing over the past week, with the former looking for a break below its 50 neutral mark and the latter flirting with its red signal line. Meanwhile, the falling stochastics have yet to enter the oversold territory below 20, suggesting that bearish pressures may persist in the short term.
Still, as long as the price keeps trading within the bullish upper Bollinger area, there is potential for an upside reversal to test the nearby 0.8820 resistance territory. A decisive close above October’s high of 0.8860 could produce another leg up to 0.8925. Even higher, the pair will attempt to re-enter the 0.9000 territory with scope to reach the March ascending trendline currently seen near 0.9150.
On the downside, a step below 0.8700 could confirm additional losses towards the lower ascending trendline at 0.8630. If that floor cracks too, the pair may revisit October’s low of 0.8570 before meeting the 200-day simple moving average (SMA) at 0.8530. Moving lower, the focus will turn to the long-term 0.8470 familiar constraining zone.
In brief, EURGBP is showing no appetite for improvement, though it may postpone selling activities if it stands firm above 0.8700.
ECB Lagarde: We expect to raise rates further
ECB President Christine Lagarde said in a speech, "the ECB will ensure that a phase of high inflation does not feed into inflation expectations, allowing too-high inflation to become entrenched."
"We have acted decisively, raising rates by 200 basis points, and we expect to raise rates further to the levels needed to ensure that inflation returns to our 2% medium-term target in a timely manner," she said.
"But if we want to rebuild our supply capacity and strengthen domestic sources of growth, other policy areas need to refocus. Most importantly, they need to direct investment towards the transitions that will define our future – and the financial sector needs to be able to actively support these transitions," she added.
WTI Oil Outlook: Bears on Track for Weekly Drop of Around 8%
WTI oil is consolidating within a narrow range in early Friday’s trading after bears accelerated on Thursday, pushing the price down nearly 4% for the day.
Oil came under fresh pressure on concerns about weakening demand in China, world’s biggest oil importer and further interest rate increases by the US Federal Reserve, which would drive the US economy into recession.
Thursday’s strong fall added to negative near-term performance as the WTI is on track for the second consecutive weekly loss, with this week’s drop being around 7.7%.
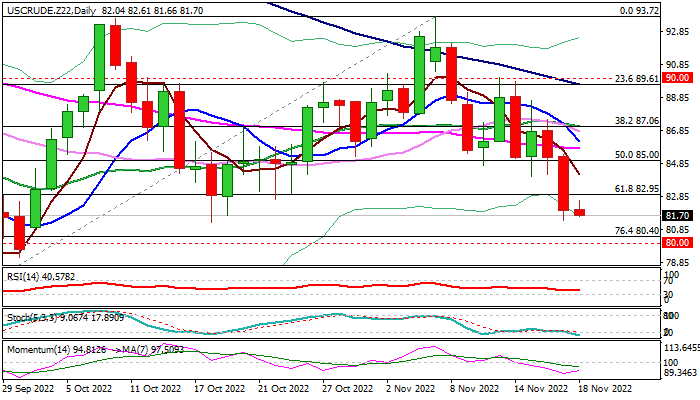
Thursday’s drop came just ticks ahead of key support at $81.29 (Oct 18 trough, reinforced by 100WMA), where bears faced headwinds.
The action may hold here for limited consolidation, as daily studies are oversold, before resuming lower as overall picture on daily chart is bearish and weekly studies are weakening that adds to negative fundamentals.
Final break through $81.29 pivot would generate fresh bearish signal on completion of a double-top pattern on daily chart ($93.60/$93.72, Oct 10 / Nov 7 peaks respectively) and open way towards targets at $80.37/$80.00 (Fibo 76.4% of $76.29/$93.72 / psychological).
Broken Fibo 61.8% ($82.95) should ideally cap and keep bulls intact, with extended upticks to stay under broken Fibo 50% ($85.00).
Res: 82.61; 82.95; 84.15; 85.00.
Sup: 81.29; 81.00; 80.40; 80.00.
USDCAD Still Flattens Above the 1.3225 Key Level
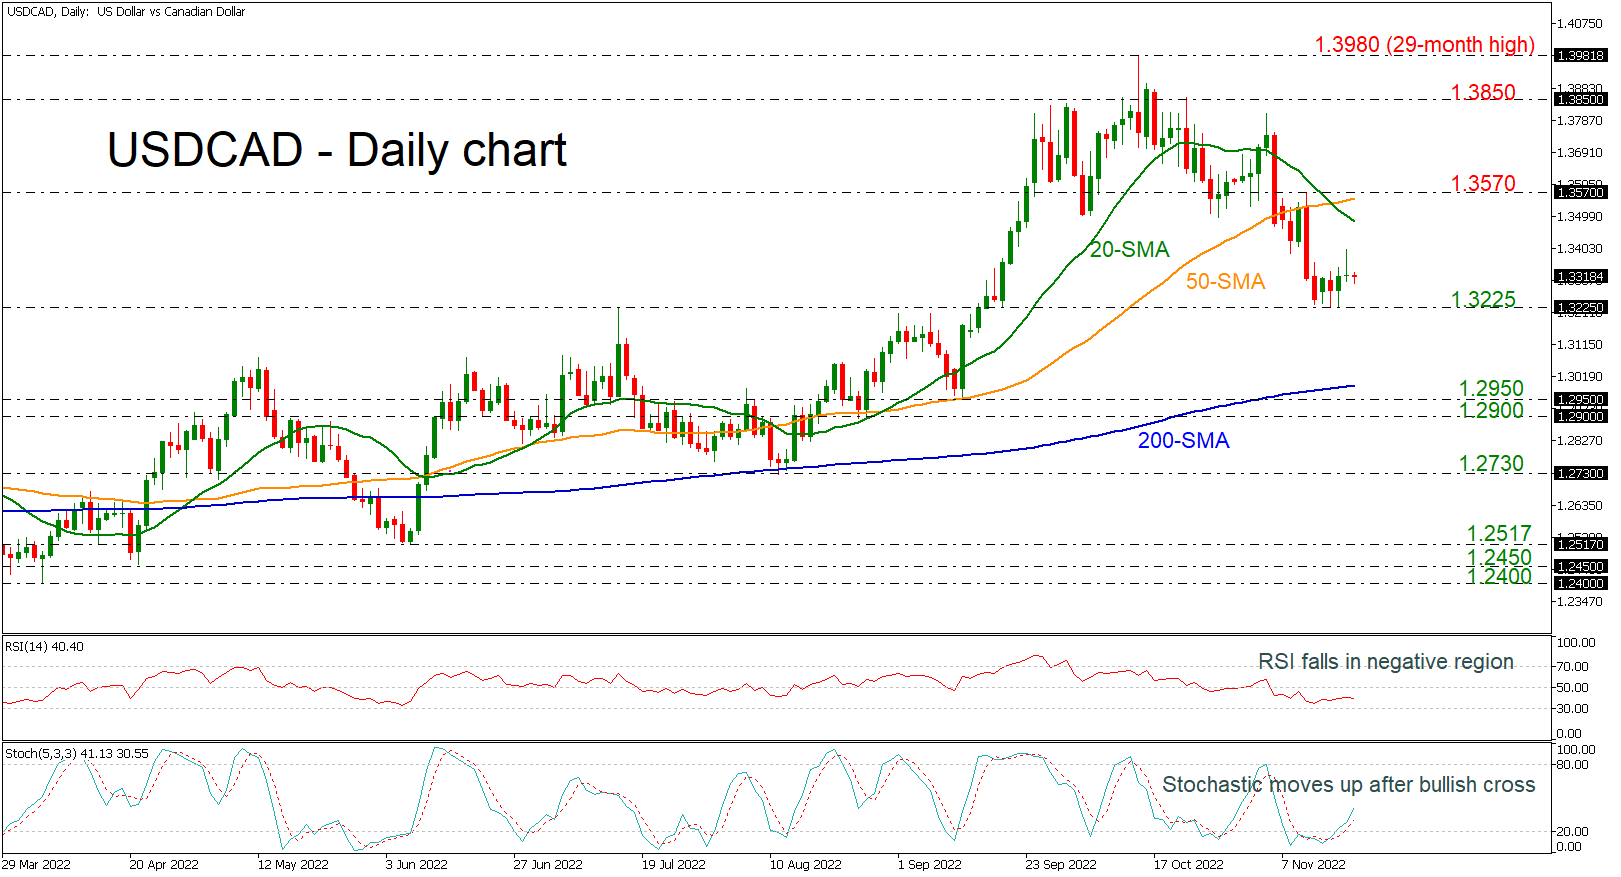
USDCAD is hovering above the 1.3300 mark after several days of trying to break the 1.3225 support level. The short-term bias is neutral to bearish as the RSI is flattening below the neutral threshold of 50; however, the stochastic is showing positive signs as the %K and the %D lines posted a bullish crossover in the oversold zone.
If the market rises, it may encounter opposition between the bearish cross of the 20-day and 50-day simple moving averages (SMAs) at 1.3530 and the 1.3570 key level. If the market staged a major rally, it might try to break over the 1.3850 resistance level on its way to retesting the 1.3980 high, which is the 29-month high.
If the pair falls below the crucial level of 1.3225, the 200-day SMA around 1.2990 may provide initial support. However, steeper drops might send the pair tumbling towards the 1.2900-1.2950 area, turning the outlook to negative.
All in all, USDCAD is failing to improve the rebound off 1.3225, so any moves below it may continue the bearish correction in the short-term.
GBP/JPY Daily Outlook
Daily Pivots: (S1) 165.59; (P) 165.98; (R1) 166.76; More...
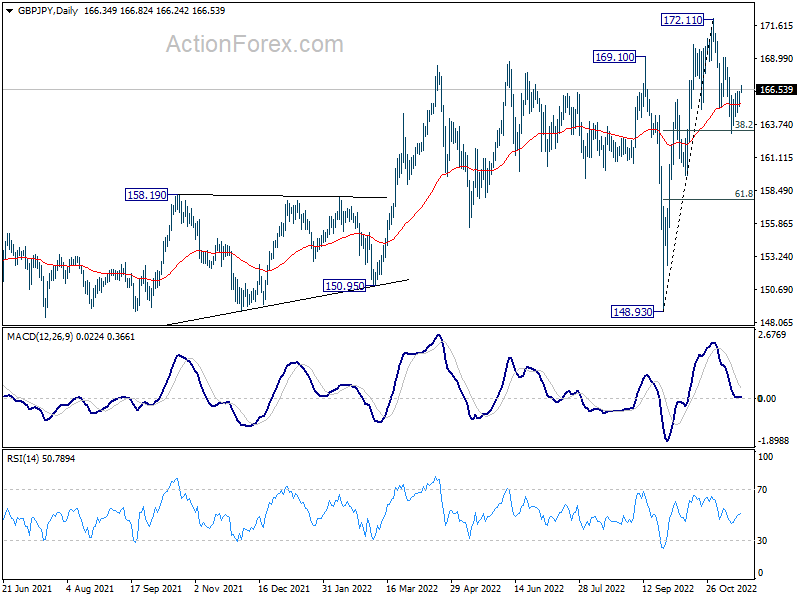
GBP/JPY's break of 166.06 minor resistance suggests that correction from 172.11 has completed with three waves down to 163.02. Intraday bias is now mildly on the upside for retesting 172.11 high. However, sustained trading below 38.2% retracement of 148.93 to 172.11 at 163.25 will bring deeper decline to 61.8% retracement at 157.78 and possibly below.
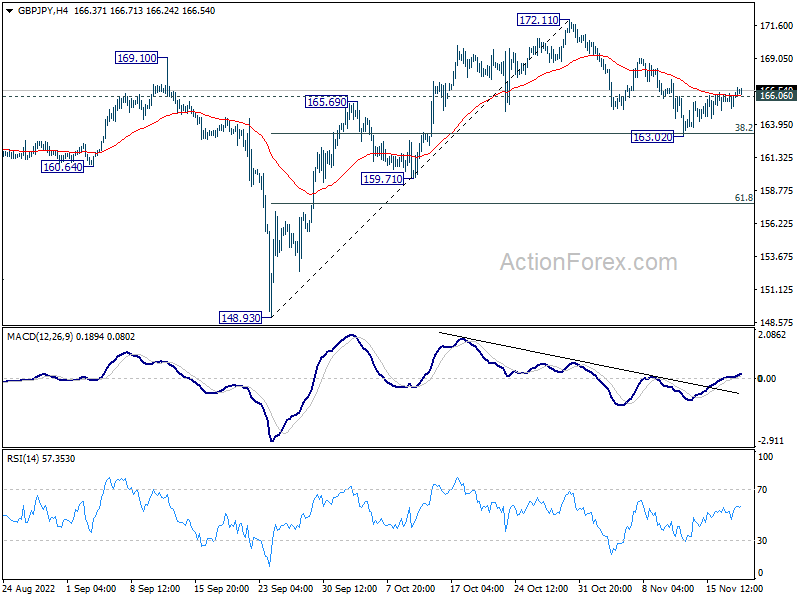
In the bigger picture, there is no clear sign of medium term topping yet. Up trend from 123.94 (2020 low) could still resume through 172.11 high at a later stage. However, firm break of 159.71 support will argue that it's already in correction to the up trend from 123.94, and deeper decline would be seen back towards 148.93 support.
EUR/JPY Daily Outlook
Daily Pivots: (S1) 144.69; (P) 145.09; (R1) 145.72; More....
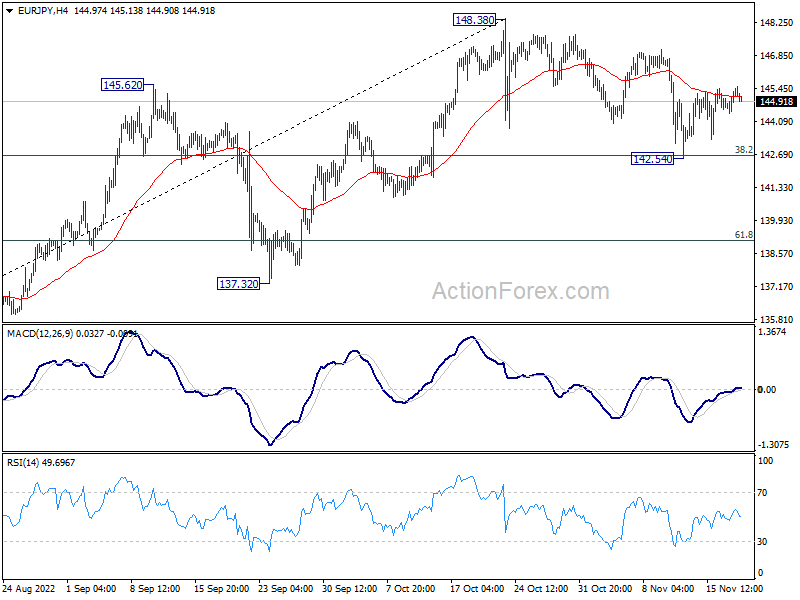
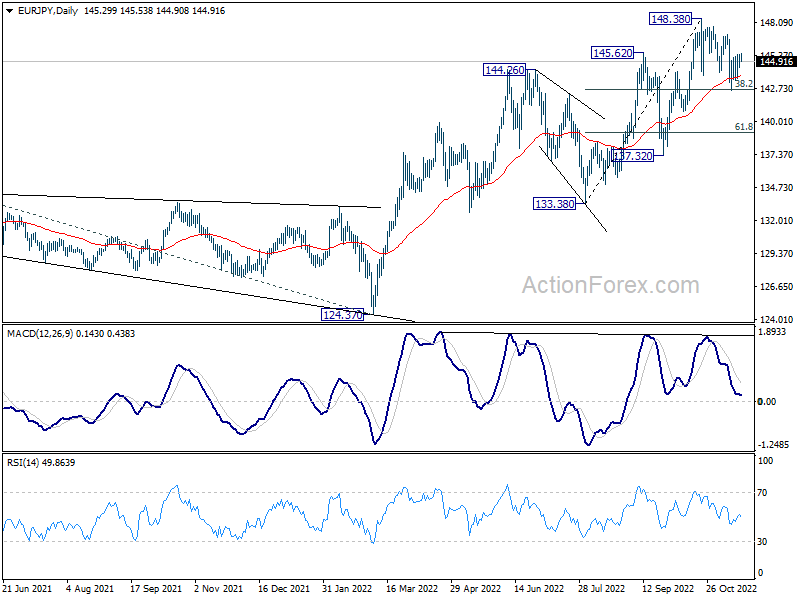
For now, intraday bias in EUR/JPY stays mildly on the upside. Correction from 148.38 might have completed at 142.54, after hitting 38.2% retracement of 133.38 to 148.38 at 142.65. Further rally would be seen to retest 148.38 high. However, on the downside, sustained break of 142.65 will bring deeper fall to 61.8% retracement at 139.11 and possibly below.
In the bigger picture, there is no clear sign of medium term topping yet. Up trend from 114.42 (2020 low) could still resume through1 48.38 to 149.76 (2014 high). However, break of 137.32 support argue that a medium term correction has already started to correct the whole up trend from 144.42.
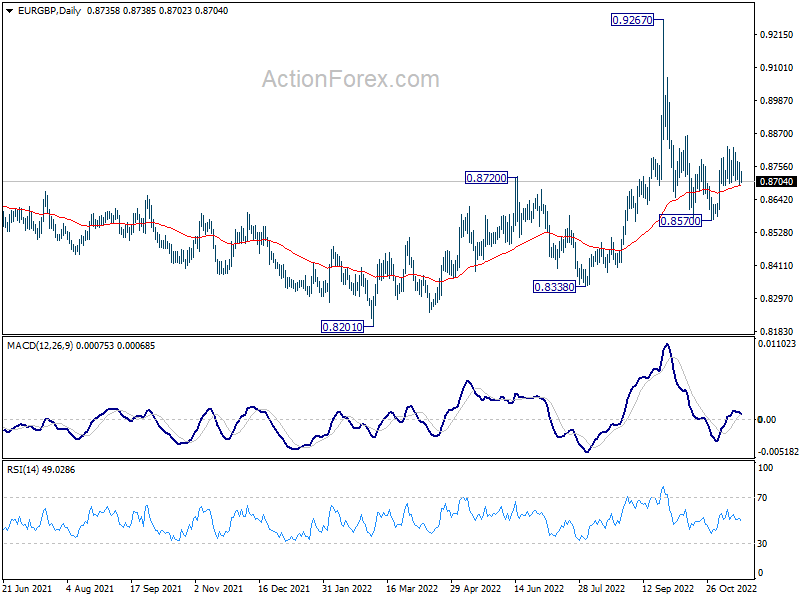
EUR/GBP Daily Outlook
Daily Pivots: (S1) 0.8696; (P) 0.8734; (R1) 0.8774; More...
Intraday bias in EUR/GBP stays neutral for the moment. On the upside, break of 0.8827 will resume the rise from 0.8570 to 0.8869. Sustained break there will pave the way back to retest 0.9267 high. On the downside, below 0.8689 minor support will turn bias back to the downside for 0.8570 instead.
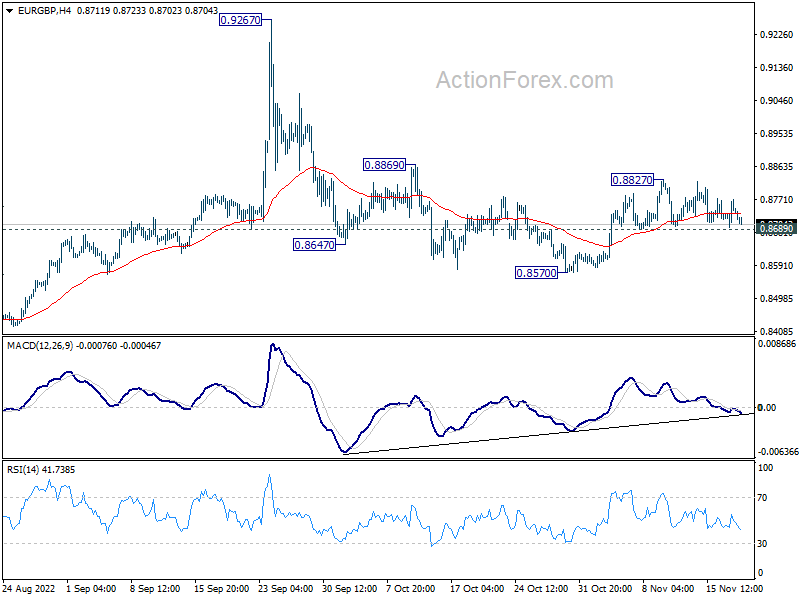
In the bigger picture, current development suggests that fall from 0.9267 is a down leg inside long term range pattern. Deeper fall could be seen towards 0.8201/8338 support zone. But strong support should be seen there to bring reversal. Nevertheless, firm break of 0.8869 resistance will turn favor to the case that such decline is merely a correction in the up trend from 0.8201. That is, further rally would be seen at a later stage through 0.9267.