Sample Category Title
GBP/USD Mid-Day Outlook
Daily Pivots: (S1) 1.0971; (P) 1.1052; (R1) 1.1181; More...
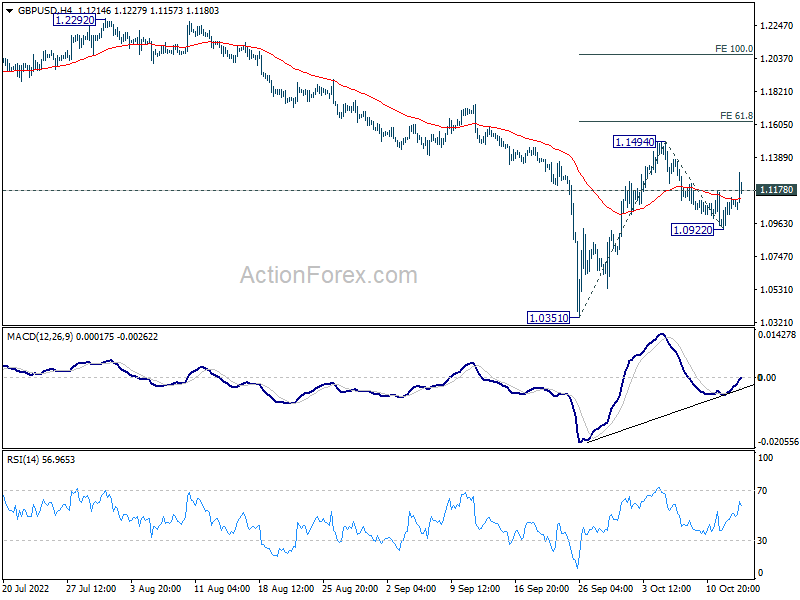
GBP/USD's recover and break of 1.1178 minor resistance argues that pull back from 1.1494 might have completed at 1.0922. Intraday bias is back on the upside for 1.1494. Break will target 61.8% projection of 1.0351 to 1.1494 from 1.0922 at 1.1628. On the downside, below 1.0922 will turn bias back to the downside for 1.0351 low instead.
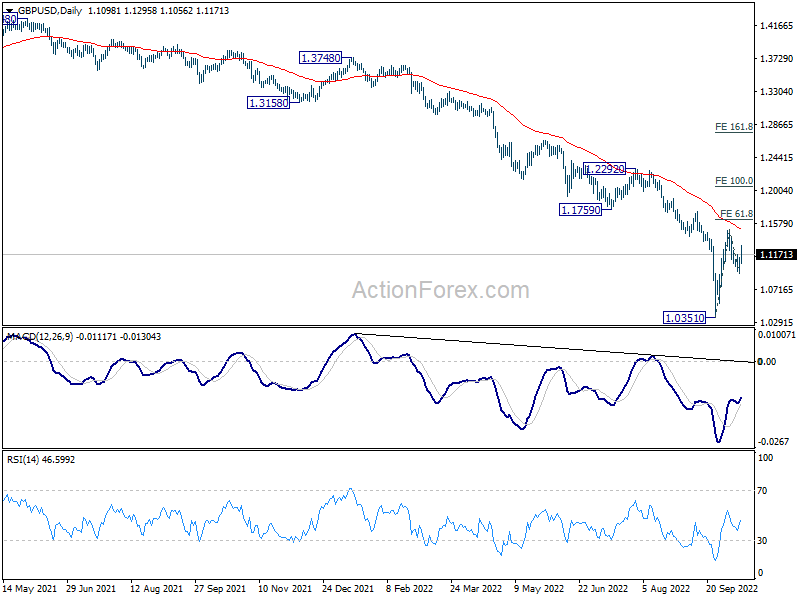
In the bigger picture, fall from 1.4248 (2018 high) is resuming long term down trend from 2.1161 (2007 high). Next target is 100% projection of 2.1161 to 1.3503 from 1.7190 at 0.9532. There is no scope of a medium term rebound as long as 1.1759 support turned resistance holds.
USD/CHF Mid-Day Outlook
Daily Pivots: (S1) 0.9938; (P) 0.9971; (R1) 1.0011; More...
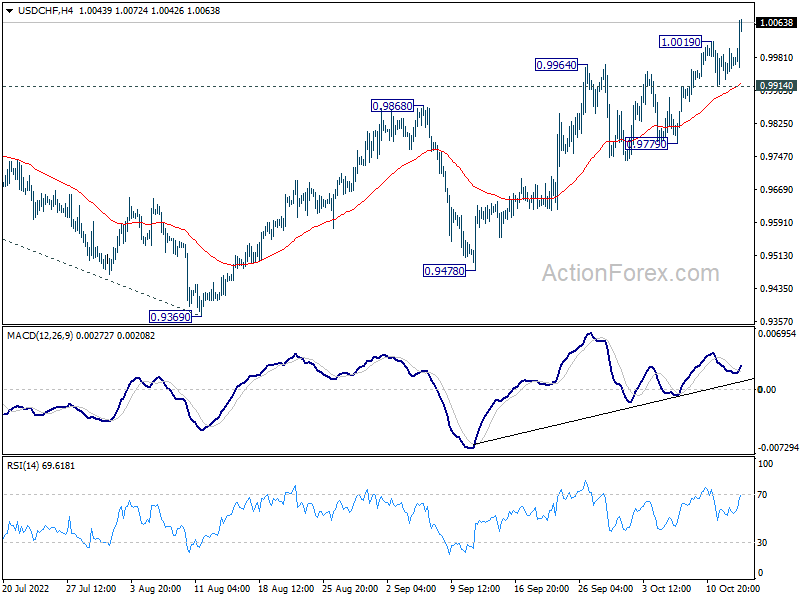
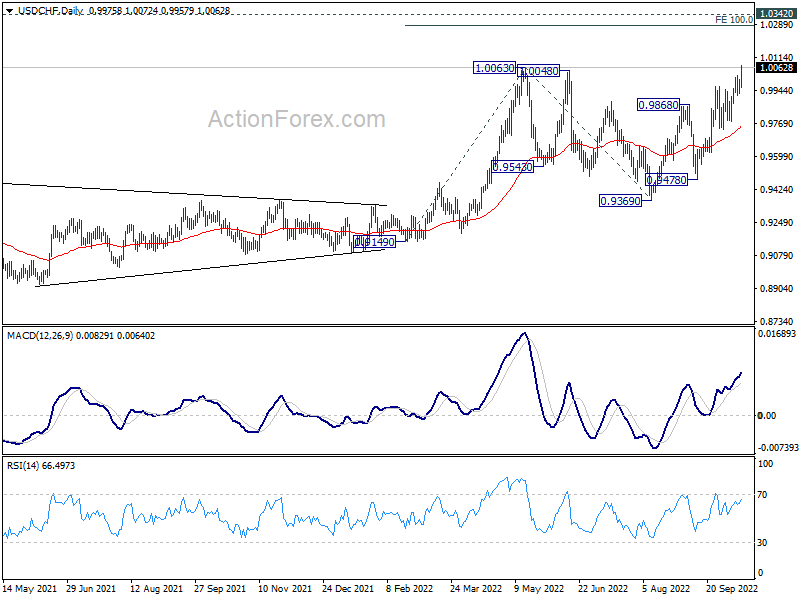
USD/CHF's rally resumed after brief consolidation and intraday bias is back on the upside. Decisive break of 1.0063 will confirm larger up trend resumption. Next target is 1.0283 projection level. On the downside, below 0.9914 minor support will turn neutral bias neutral again first. But outlook will stay bullish as long as 0.9779 support holds.
In the bigger picture, current development suggests that up trend from 0.8756 (2021 low) is still in progress. Sustained break of 1.0063 will target 100% projection of 0.9149 to 1.0063 from 0.9369 at 1.0283, and then 1.0342 (2016 high). For now, this will remain the favored case as long as 0.9369 support holds, even in case of deep pull back.
USD/JPY Mid-Day Outlook
Daily Pivots: (S1) 146.09; (P) 146.53; (R1) 147.33; More...
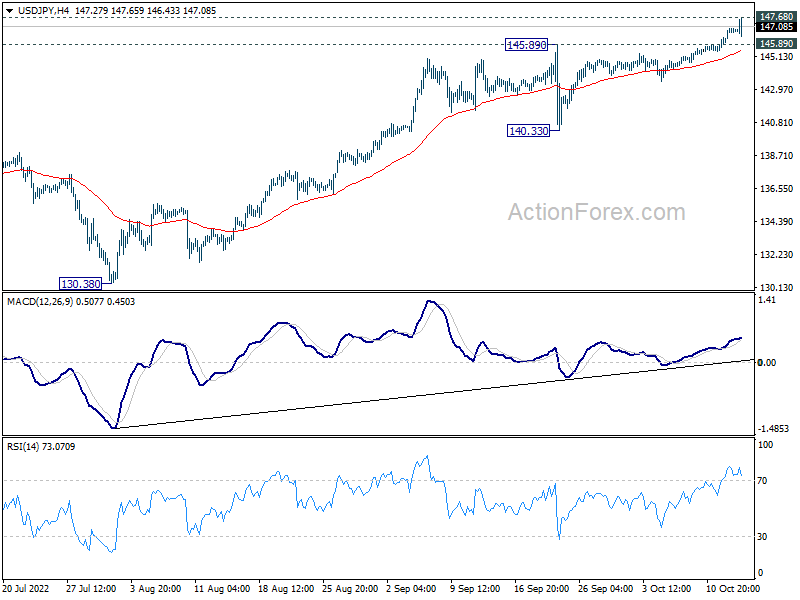
USD/JPY's rally continues and is in proximity to 147.68 long term resistance. Break there will target 149.26 projection, and possibly to 150 psychological level. nevertheless, break of 145.89 support could be an indication that Japan has stepped in for intervention again, and turn bias back to the downside for deeper pull back.
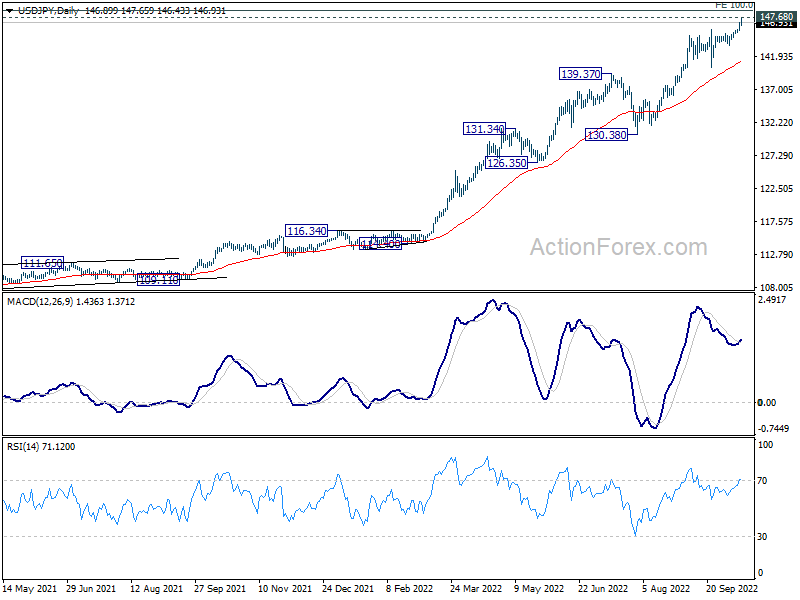
In the bigger picture, up trend from 101.18 is still in progress, as part of the whole up trend from 75.56 (2011 low). Further rise should be seen to 147.68 (1998 high), and possibly to 100% projection of 75.56 (2011 low) to 125.85 (2015 high) from 98.97 at 149.26, For now, break of 130.38 support is needed to be the first indication of medium term topping. Otherwise, outlook will stay bullish even in case of deep pull back.
USD/CAD Mid-Day Outlook
Daily Pivots: (S1) 1.3775; (P) 1.3803; (R1) 1.3845; More...
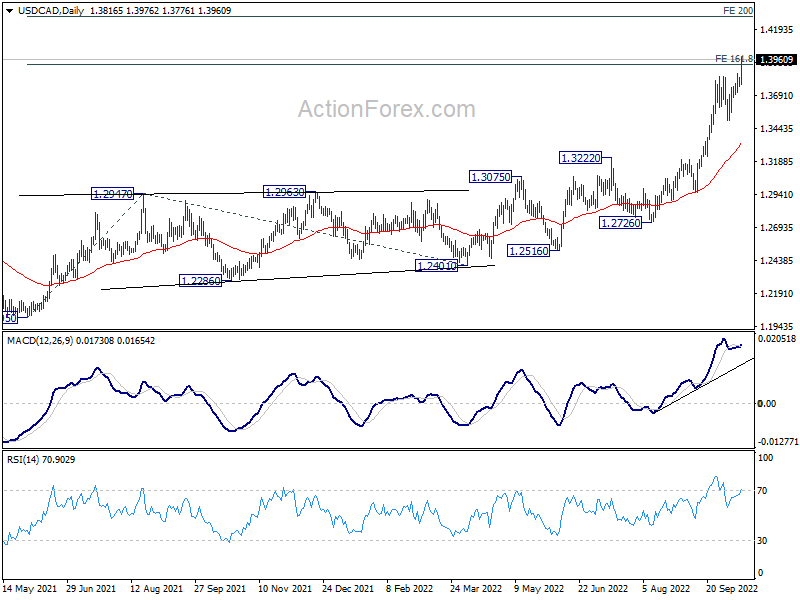
USD/CAD's rally re-accelerates again and met 161.8% projection of 1.2005 to 1.2947 from 1.2401 at 1.3925. Initial bias stays on the upside. Sustained trading above 1.3925 will pave the way to 200% projection at 1.4285. On the downside, below 1.3776 minor support will turn intraday bias neutral first. But outlook will remain bullish as long as 1.3501 support holds.
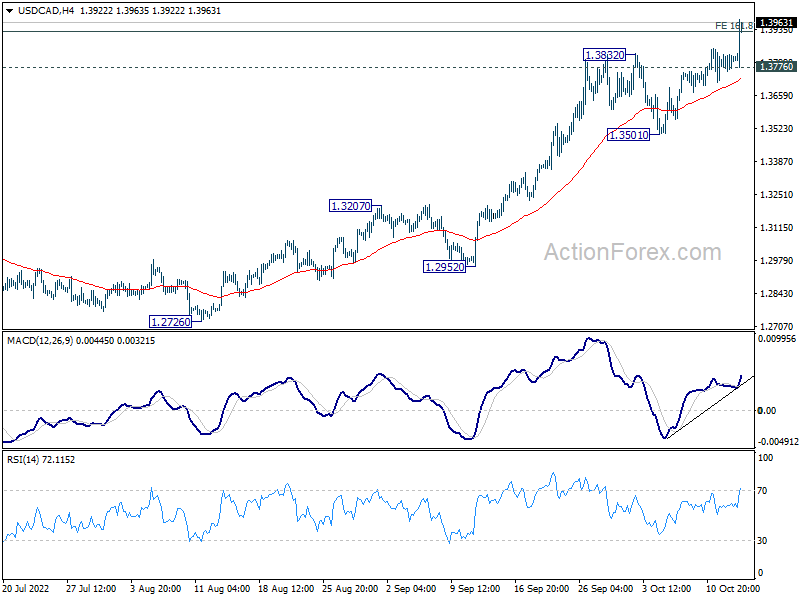
In the bigger picture, up trend from 1.2005 (2021 low) is still in progress. Based on current impulsive momentum, it could be resuming long term up trend from 0.9056 (2007 low). Whether it is or it isn't, retest of 1.4689 (2016 high) should be seen next. This will now remain the favored case as long as 1.3222 resistance turned support holds.
AUD/USD Mid-Day Report
Daily Pivots: (S1) 0.6242; (P) 0.6271; (R1) 0.6305; More...
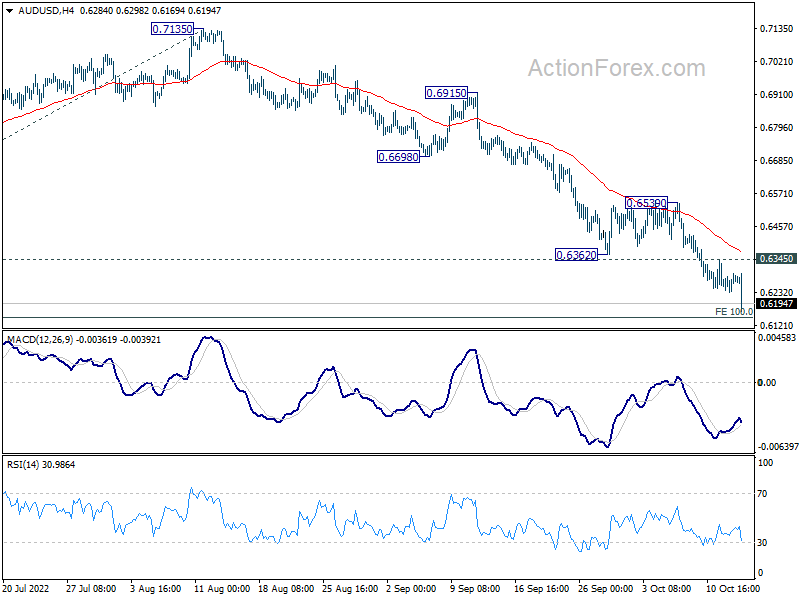
AUD/USD's decline extends today and intraday bias remains on the downside. Next target is 100% projection of 0.7660 to 0.6680 from 0.7135 at 0.6155. Firm break there will pave the way to 0.5781. On the upside, above 0.6345 minor resistance will turn intraday bias neutral first. But outlook will stay bearish as long as 0.6539 resistance holds.
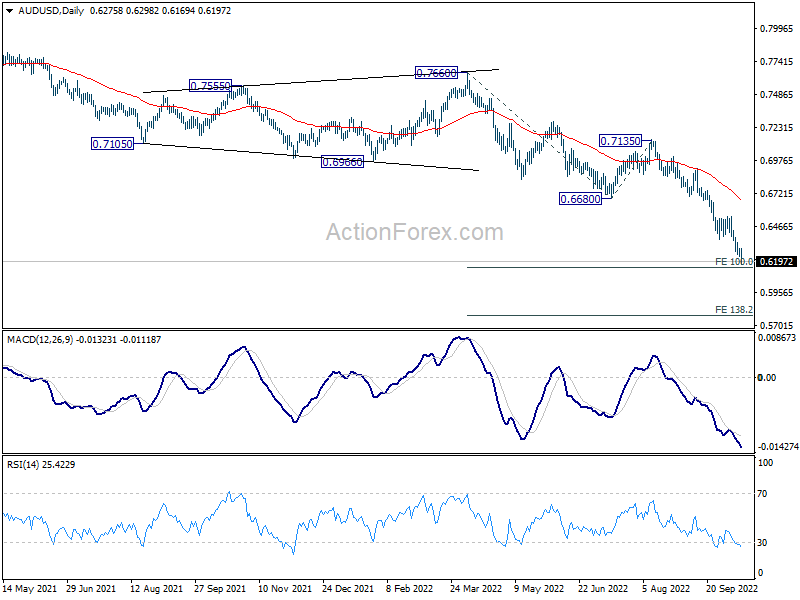
In the bigger picture, down trend form 0.8006 (2021 high) is expected to continue as long as 0.6680 support turned resistance holds. Next target is 0.5506 low. Medium term momentum will now be closely monitored to gauge the chance of break of 0.5506.
Dollar Soars On Strong CPI Again, But Sterling Overwhelms
Dollar soars broadly in early US session after stronger than expected consumer inflation reading. Futures tumble while 10-year yield is back pressing 4% handle. Nonetheless, the greenback is overwhelmed by Pound on rumors that UK Prime Minister Liz Truss is going to further backtrack on the mini-budget. The eventual near term fate of Sterling will still depend on the extent Truss is retreating. Australian Dollar is leading commodity currencies lower, followed by Euro and Swiss Franc. Yen is steady overall, except versus Dollar of course.
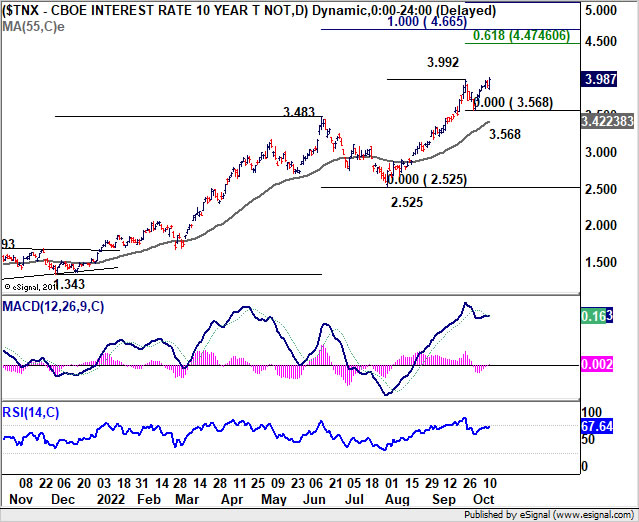
Technically, 10-year yield is resuming recent up trend. A big question is whether it could stay firm above 4% handle and close the week above there. If that happens, there is prospect of further upside acceleration until FOMC rate decision and release of new economic projection in early November. 61.8% projection of 2.525 to 3.992 from 3.568 at 4.474 is a bit far. But never say never.
In Europe, at the time of writing, FTSE is down -1.40%. DAX is down -0.71%. CAC is down -1.32%. Germany 10-year yield is up 0.079 at 2.391. Earlier in Asia, Nikkei dropped -0.60%. Hong Kong HSI dropped -1.87%. China Shanghai SSE dropped -0.30%. Singapore Strait Times dropped -1.39%. Japan 10-year JGB yield dropped -0.0034 to 0.251.
US CPI slowed to 8.2% yoy in Sep, but core CPI rose to 6.6% yoy
US CPI rose 0.4% mom in September, above expectation of 0.2% mom. Core CPI (all item less food and energy) rose 0.6% mom, above expectation of 0.5% mom. Energy index dropped -2.1% mom, with gasoline down 4.9%. Food index rose 0.8% mom.
For the 12 months ending September, CPI slowed from 8.3% yoy to 8.2% yoy, above expectation of 8.1% yoy. Core CPI, on the other hand, accelerated from 6.3% yoy to 6.6% yoy, above expectation of 6.5% yoy. Energy index slowed from 23.8% yoy to 19.8% yoy. Food index was up 11.2% yoy.
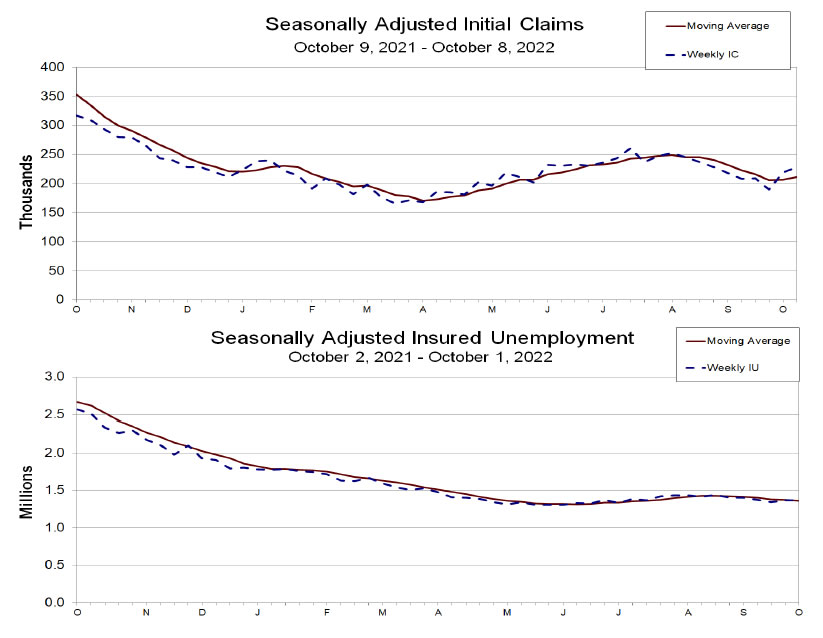
US initial jobless claims rose to 228k, slightly above expectations
US initial jobless claims rose 9k to 228k in the week ending October 8, slightly above expectation of 225k. Four-week moving average of initial claims rose 5k to 212k.
Continuing claims rose 3k to 1368k in the week ending October 1. Four-week moving average of continuing claims dropped -8k to 1364k.
Mid-Day
Daily Pivots: (S1) 0.6242; (P) 0.6271; (R1) 0.6305; More...
AUD/USD's decline extends today and intraday bias remains on the downside. Next target is 100% projection of 0.7660 to 0.6680 from 0.7135 at 0.6155. Firm break there will pave the way to 0.5781. On the upside, above 0.6345 minor resistance will turn intraday bias neutral first. But outlook will stay bearish as long as 0.6539 resistance holds.
In the bigger picture, down trend form 0.8006 (2021 high) is expected to continue as long as 0.6680 support turned resistance holds. Next target is 0.5506 low. Medium term momentum will now be closely monitored to gauge the chance of break of 0.5506.
Economic Indicators Update
| GMT | Ccy | Events | Actual | Forecast | Previous | Revised |
|---|---|---|---|---|---|---|
| 23:01 | GBP | RICS Housing Price Balance Sep | 32% | 48% | 53% | 51% |
| 23:50 | JPY | Bank Lending Y/Y Sep | 2.30% | 2.20% | 1.90% | |
| 23:50 | JPY | PPI Y/Y Sep | 9.70% | 8.80% | 9.00% | 9.40% |
| 00:00 | AUD | Consumer Inflation Expectations Oct | 5.40% | 5.40% | ||
| 06:00 | EUR | Germany CPI M/M Sep F | 1.90% | 1.90% | 1.90% | |
| 06:00 | EUR | Germany CPI Y/Y Sep F | 10.00% | 10.00% | 10.00% | |
| 12:30 | USD | Initial Jobless Claims (Oct 7) | 228K | 225K | 219K | |
| 12:30 | USD | CPI M/M Sep | 0.40% | 0.20% | 0.10% | |
| 12:30 | USD | CPI Y/Y Sep | 8.20% | 8.10% | 8.30% | |
| 12:30 | USD | CPI Core M/M Sep | 0.60% | 0.50% | 0.60% | |
| 12:30 | USD | CPI Core Y/Y Sep | 6.60% | 6.50% | 6.30% | |
| 14:30 | USD | Natural Gas Storage | 126B | 129B | ||
| 15:00 | USD | Crude Oil Inventories | 0.9M | -1.4M |
US initial jobless claims rose to 228k, slightly above expectations
US initial jobless claims rose 9k to 228k in the week ending October 8, slightly above expectation of 225k. Four-week moving average of initial claims rose 5k to 212k.
Continuing claims rose 3k to 1368k in the week ending October 1. Four-week moving average of continuing claims dropped -8k to 1364k.
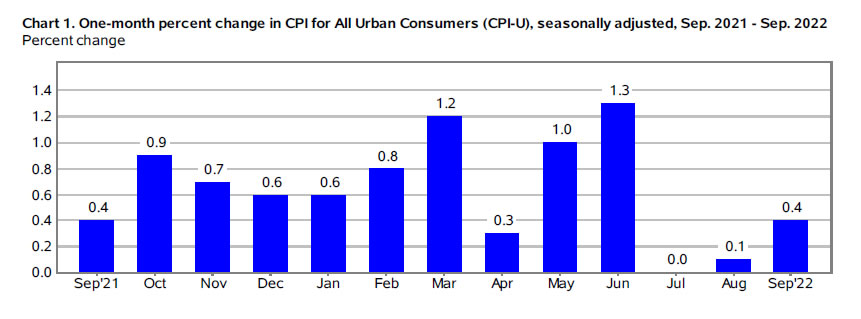
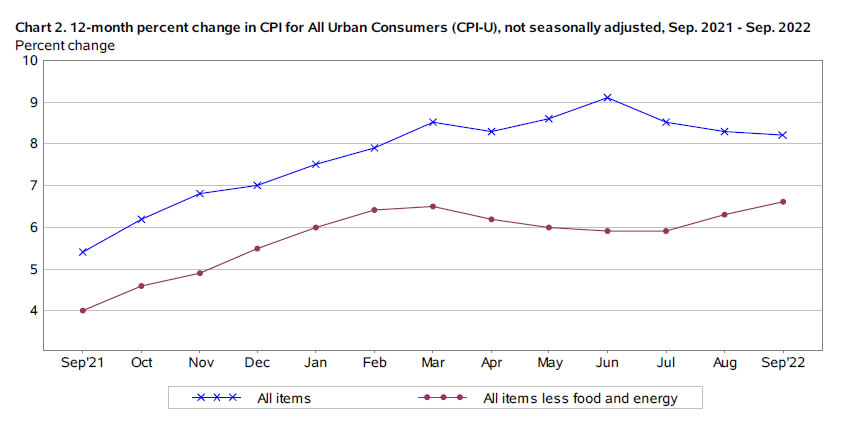
US CPI slowed to 8.2% yoy in Sep, but core CPI rose to 6.6% yoy
US CPI rose 0.4% mom in September, above expectation of 0.2% mom. Core CPI (all item less food and energy) rose 0.6% mom, above expectation of 0.5% mom. Energy index dropped -2.1% mom, with gasoline down 4.9%. Food index rose 0.8% mom.
For the 12 months ending September, CPI slowed from 8.3% yoy to 8.2% yoy, above expectation of 8.1% yoy. Core CPI, on the other hand, accelerated from 6.3% yoy to 6.6% yoy, above expectation of 6.5% yoy. Energy index slowed from 23.8% yoy to 19.8% yoy. Food index was up 11.2% yoy.
GBP/USD: Cable in a Mixed Mode on Conflicting UK Fundamentals, Awaiting US Inflation Data
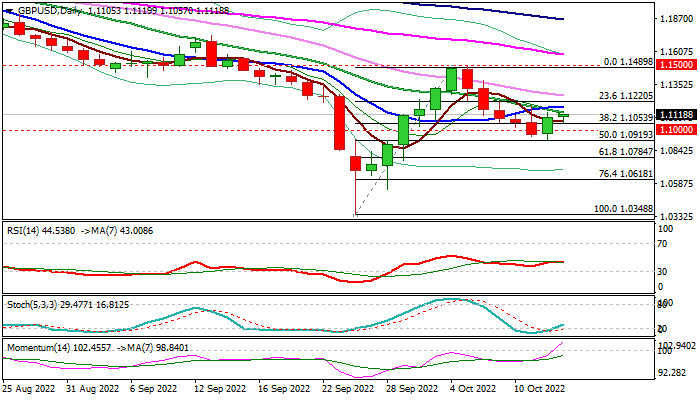
Cable is consolidating above two important supports at 1.1053/50 (Fibo 38.2% of 1.0348/1.1490 / psychological) following a short-lived dip below these levels and a quick rebound on Wednesday.
Near-term sentiment is mixed, as the Bank of England’s emergency bond buying program is scheduled to end on Friday, but the central bank signaled it could extend purchases if market conditions demand it.
On the other side, data released on Wednesday showed that Britain’s economy unexpectedly contracted in August, but economists still expect the BoE to continue to raise interest rates, in fighting the red-hot inflation, with wide expectations for 0.75% hike and 1% raise also being on the table.
Mixed fundamentals are complemented by conflicting daily studies, daily MA’s are in bearish setup but positive momentum is rising, with potential bear-trap under 1.10 to offer additional support.
Traders focus on today’s release of the US inflation data for September, which are expected to provide fresh direction signal.
According to forecasts, US consumer prices are expected to ease to 8.1% in September from 8.3% month, with release at / below consensus likely to cool expectations for very aggressive Fed in Nov 2 policy meeting and deflate dollar that would be supportive for sterling.
In such scenario, cable needs to rise and close above 1.1140 (20DMA / Fibo 38.2% of 1.1490/1.0922), to boost existing positive signal from Wednesday’s bullish engulfing pattern.
Conversely, pound would come under fresh pressure on higher than expected inflation figure and risk renewed probe below 1.10 zone that would signal continuation of a bear-leg from 1.15 double-top.
Res: 1.1139; 1.1209; 1.1276; 1.1360.
Sup: 1.1053; 1.1000; 1.0919; 1.0784.
AUDUSD Slumps to 29-Month Low as Outlook Deteriorates
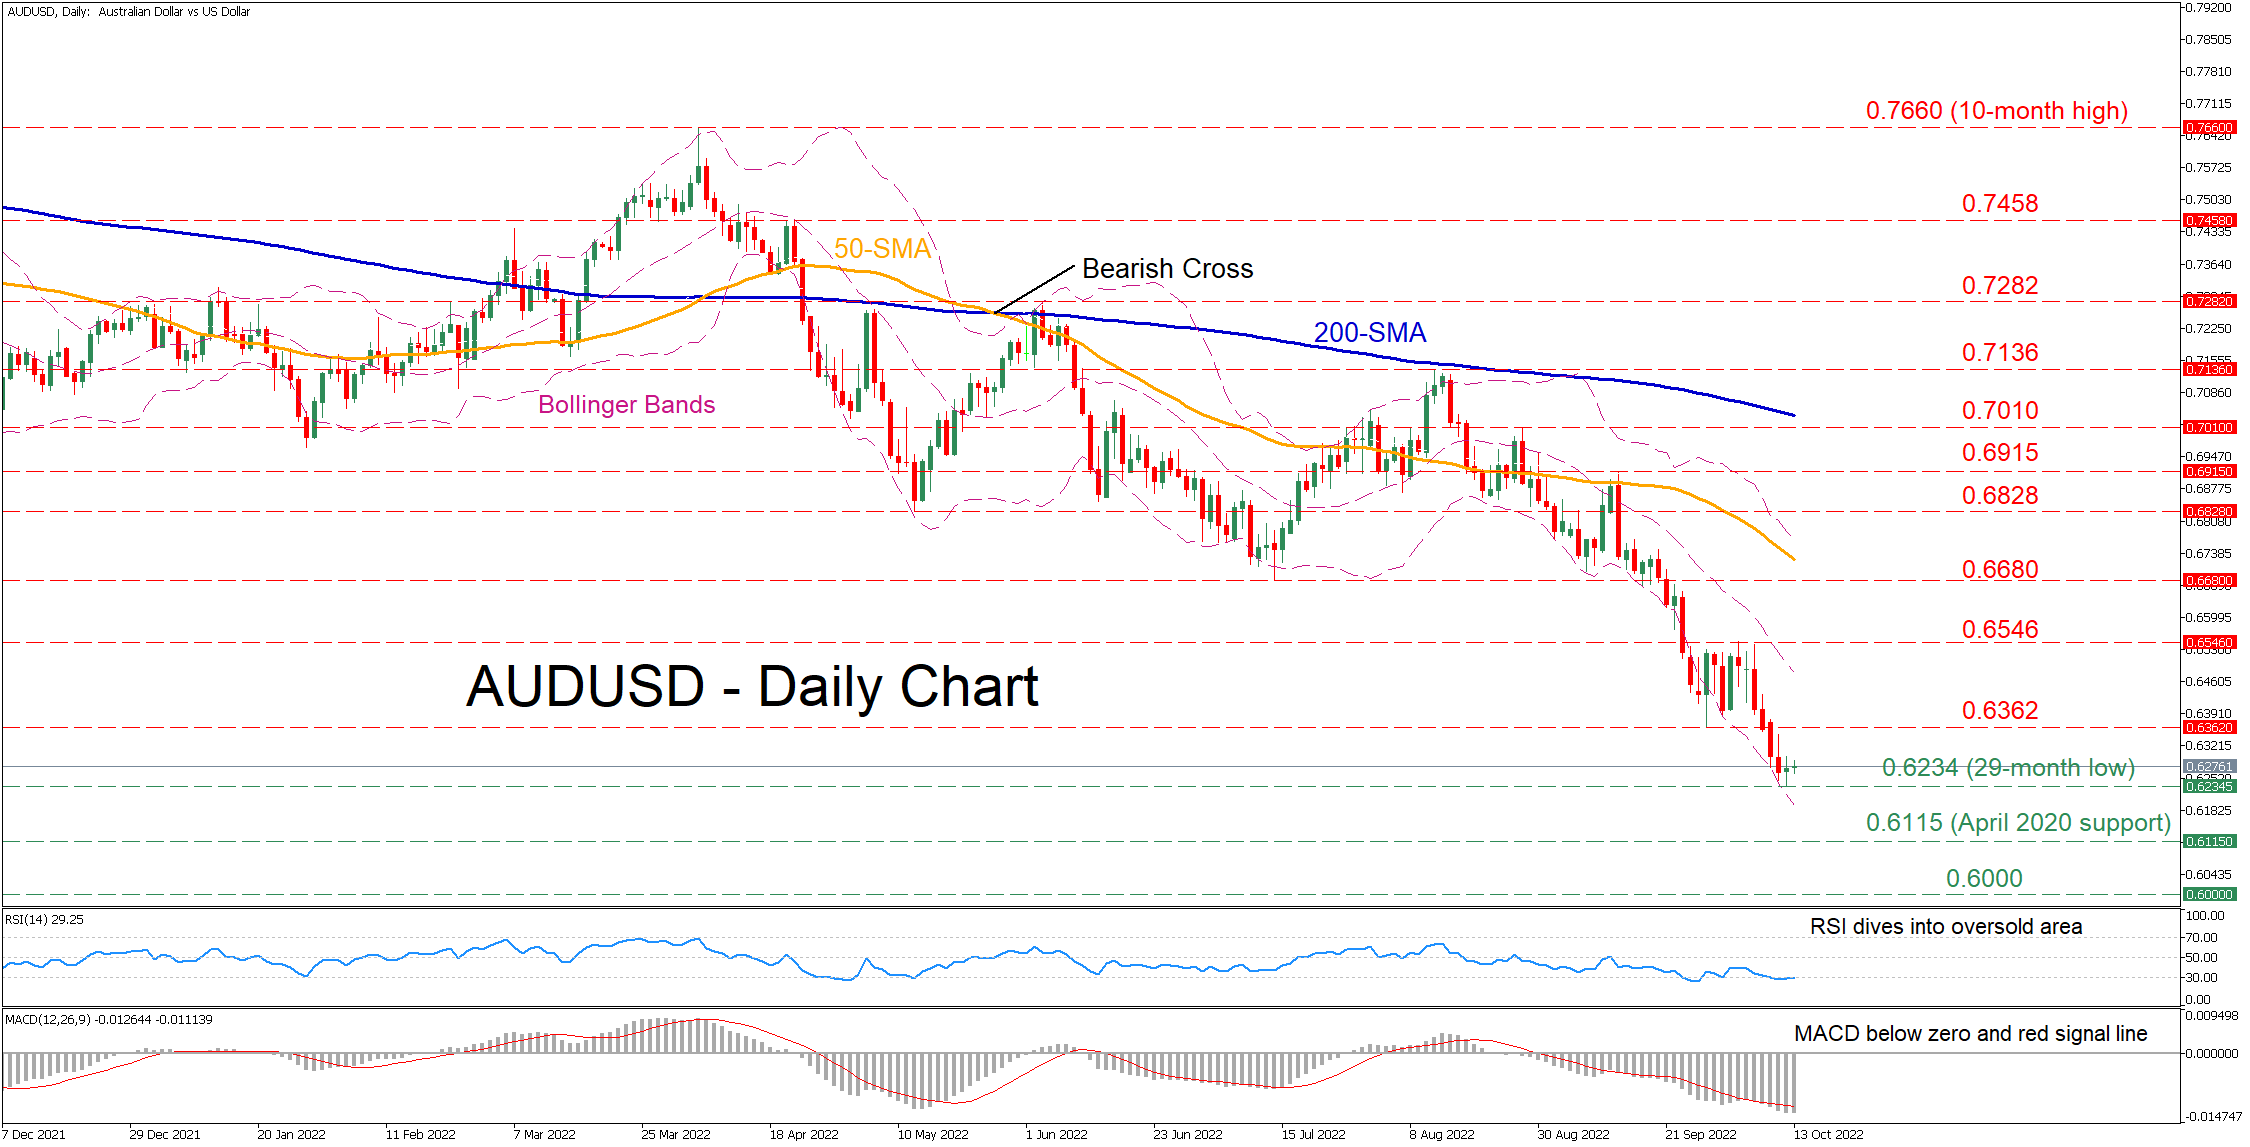
AUDUSD has been in a steep downtrend since early March, generating a profound structure of lower highs and lower lows. Although the pair managed to find its feet and traded sideways during the past week, it soon broke the pattern to the downside to form a fresh 29-month low of 0.6234.
The short-term oscillators are endorsing this bearish near-term bias. Specifically, the RSI is hovering within its 30-oversold zone, while the MACD histogram has retreated further below its red signal line in the negative territory.
Should selling pressures intensify, the pair could initially challenge the 29-month low of 0.6234. Dipping beneath that region, the price would descend towards its pandemic lows, where the April 2020 support could act as the next downside barrier. Failing to halt there, the spotlight may turn to the crucial psychological mark of 0.6000.
On the flipside, bullish actions could propel the price towards its recent support region of 0.6362, which might now act as resistance. Conquering this barricade, the bulls could then aim for 0.6546, with the latter being the upper boundary of its recent sideways pattern. If this barricade fails, the price may edge higher to test the July low of 0.6680.
Overall, even though AUDUSD has come under tremendous downside pressure, the momentum indicators currently suggest that the market has reached oversold levels. Therefore, an upside correction could be on the cards.