

Sample Category Title
AUDUSD Slumps to 29-Month Low as Outlook Deteriorates
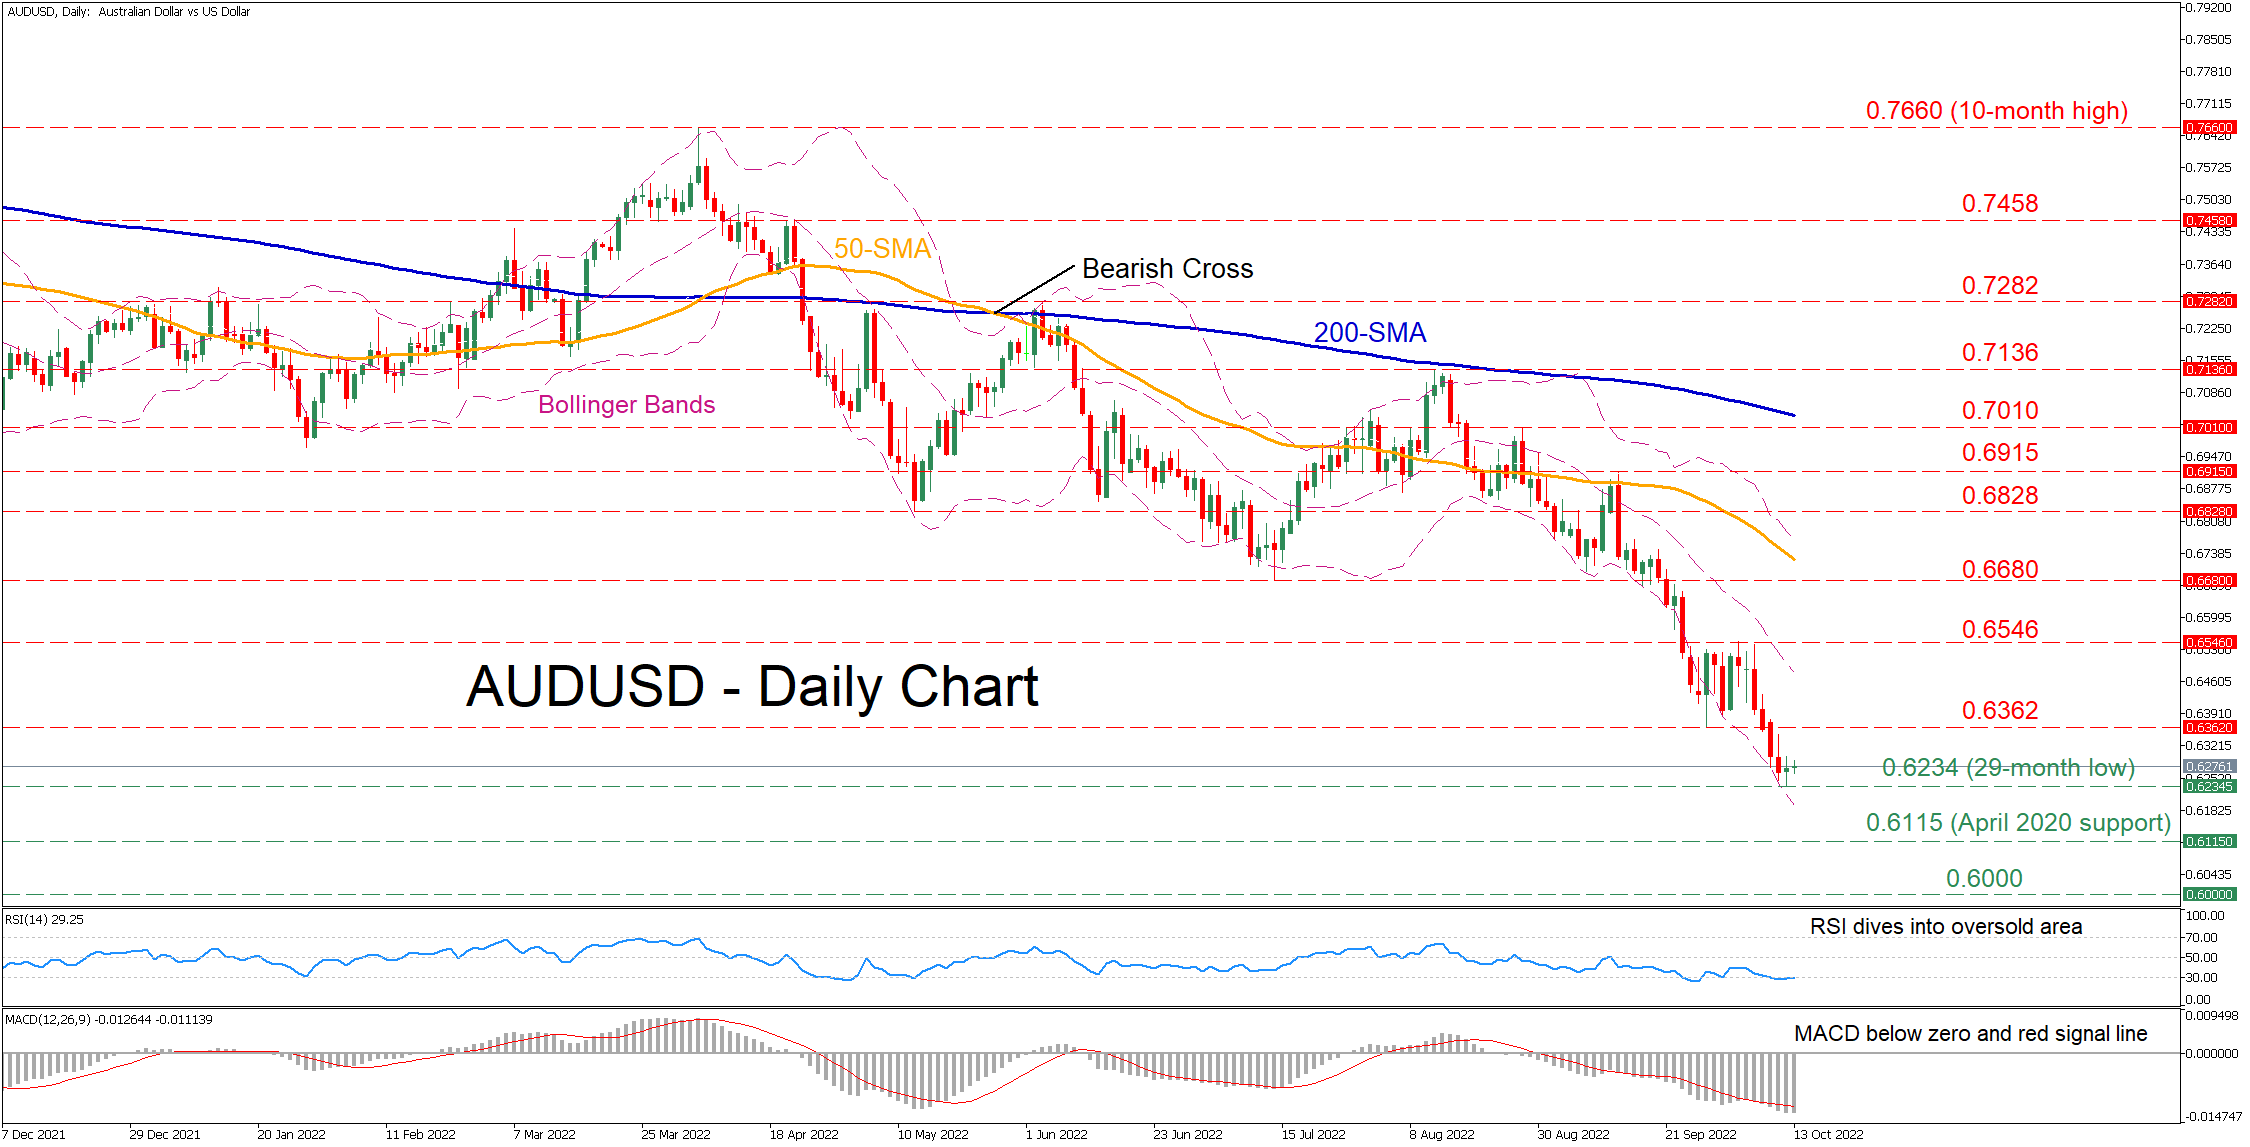
AUDUSD has been in a steep downtrend since early March, generating a profound structure of lower highs and lower lows. Although the pair managed to find its feet and traded sideways during the past week, it soon broke the pattern to the downside to form a fresh 29-month low of 0.6234.
The short-term oscillators are endorsing this bearish near-term bias. Specifically, the RSI is hovering within its 30-oversold zone, while the MACD histogram has retreated further below its red signal line in the negative territory.
Should selling pressures intensify, the pair could initially challenge the 29-month low of 0.6234. Dipping beneath that region, the price would descend towards its pandemic lows, where the April 2020 support could act as the next downside barrier. Failing to halt there, the spotlight may turn to the crucial psychological mark of 0.6000.
On the flipside, bullish actions could propel the price towards its recent support region of 0.6362, which might now act as resistance. Conquering this barricade, the bulls could then aim for 0.6546, with the latter being the upper boundary of its recent sideways pattern. If this barricade fails, the price may edge higher to test the July low of 0.6680.
Overall, even though AUDUSD has come under tremendous downside pressure, the momentum indicators currently suggest that the market has reached oversold levels. Therefore, an upside correction could be on the cards.
GBPAUD Wave Analysis
- GBPAUD reversed from resistance zone
- Likely to fall to support level 1.7400
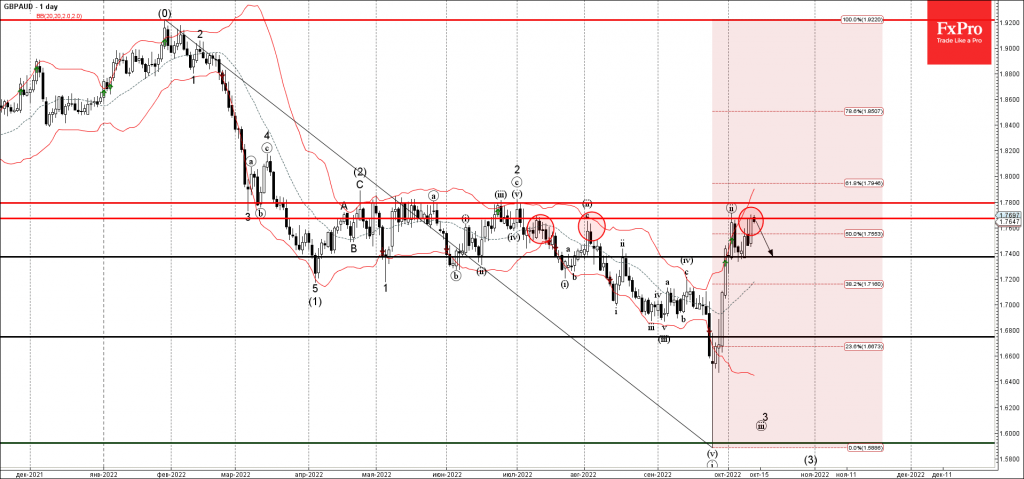
GBPAUD currency pair recently reversed down from the resistance zone lying between the strong resistance level 1.7650 (which has been reversing the pair from July) and the upper daily Bollinger Band.
The downward reversal from this resistance zone is aligned with the active short-term impulse waves (iii) and 3.
Given the clear daily downtrend, GBPAUD can be expected to fall further toward the next support level 1.7400.
Silver Wave Analysis
- Silver reversed from resistance area
- Likely to fall to support level 18.20
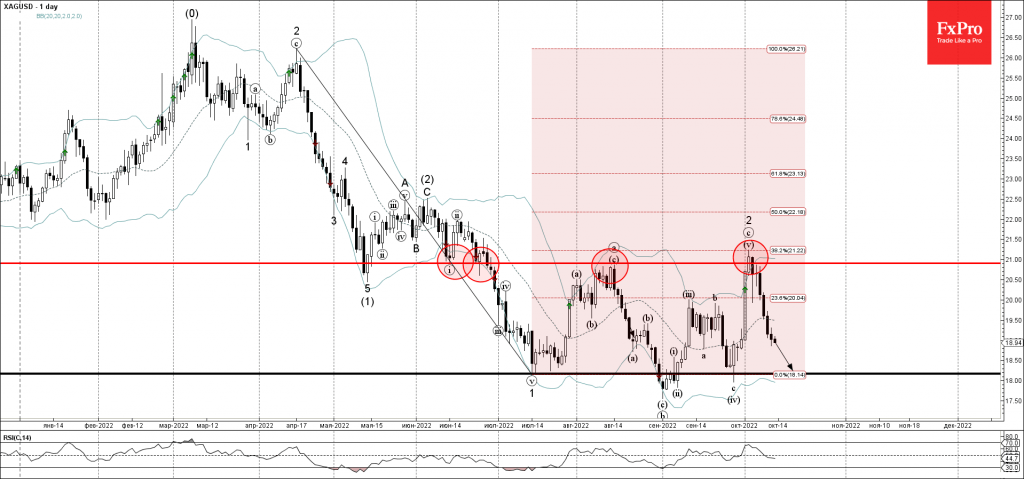
Silver recently reversed down from the resistance area located between the key multi-month resistance level 21.00 (which has been reversing the price from June) and the upper daily Bollinger Band.
This resistance area was further strengthened by the 38.2% Fibonacci correction of the earlier downward impulse from April.
Given the strong daily downtrend, Silver can be expected to fall further toward the next support level 18.20 (which has been reversing the pair from July).
USD/JPY Breaking Higher ahead of US CPI
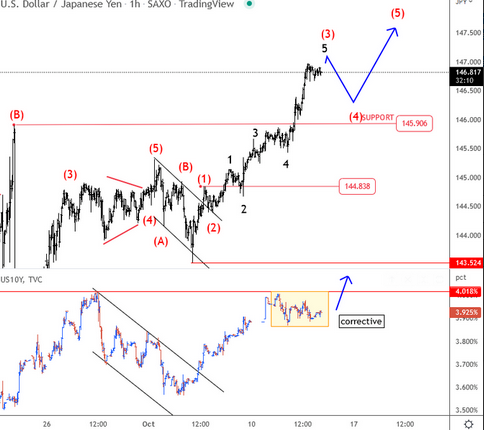
USDJPY is coming higher, making an extension as expected within an impulsive recovery that may not be over yet as US yeilds are still trading below September highs. When this one breaks, recovery on USDJPY may resume, especially if dollar will stay in bullish mode after the US CPI report later today. Any intraday pullback on USDJPY can stop at 145.90, that was the previous swing high.
From a more mid-term perspective, keep in mind that this run up on USDJPY is the final leg of a higher degree trend that can stop at 148.00 area; it was resistance back from 1998. Also, we see hear warnings from Japanese policymakers against investors selling off the Japanese currency, raising speculation about the second round of intervention.
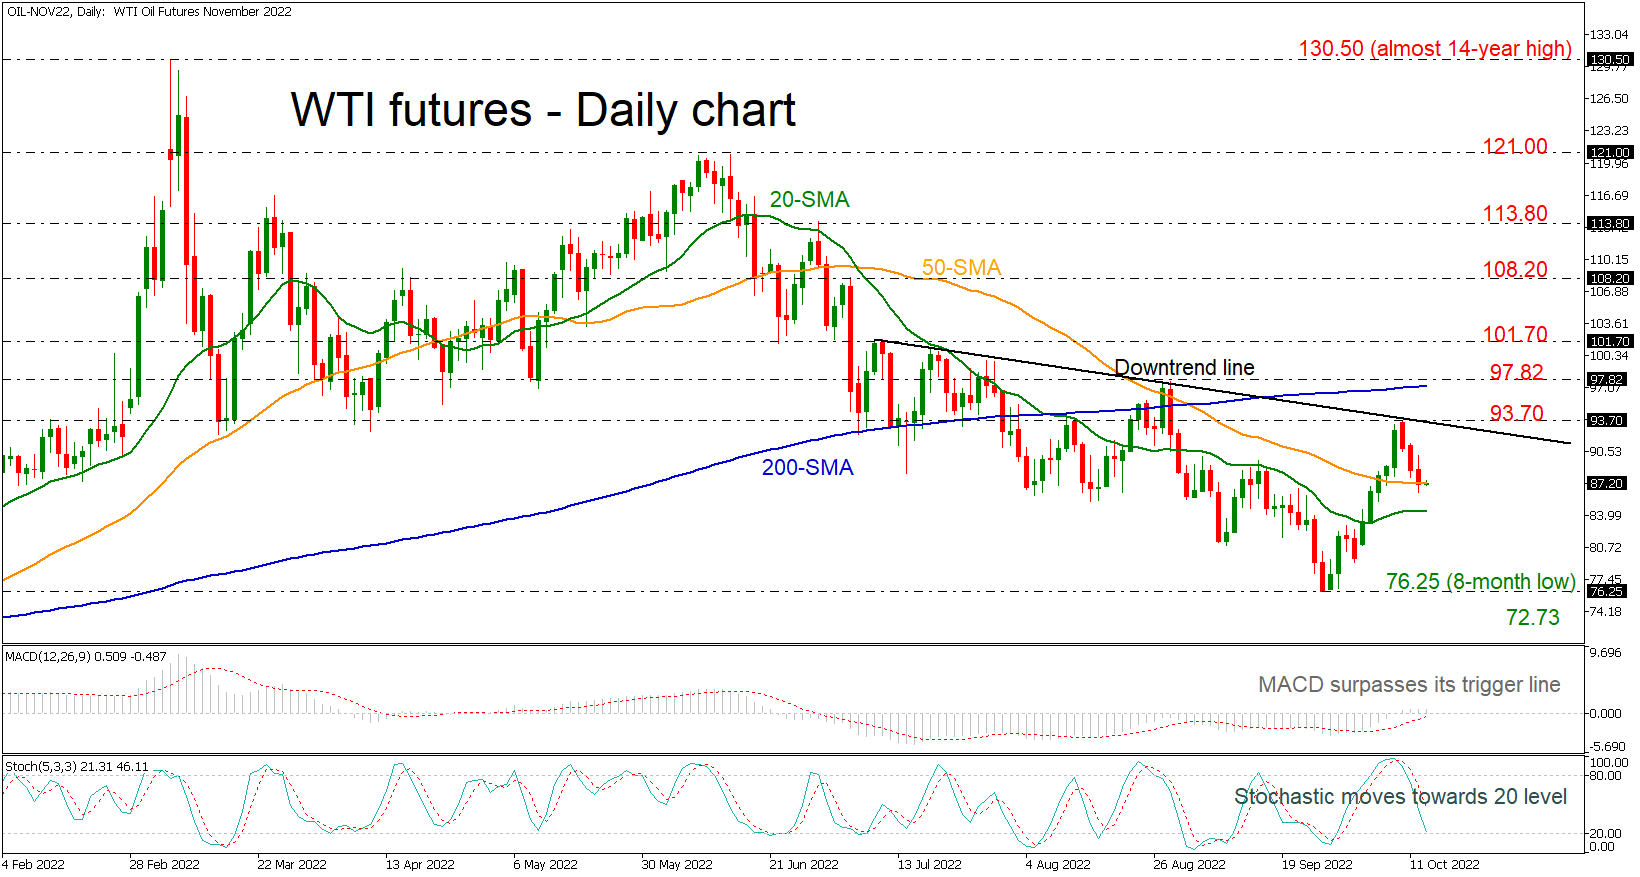
WTI Crude Oil Finds Resistance at Downtrend Line, Meeting 50-Day SMA
WTI crude oil futures found strong resistance near the medium-term descending trend line at 93.70, sliding towards the 50-day simple moving average (SMA) in the aftermath. The MACD oscillator is still standing above its trigger and zero lines; however, the stochastic is diving towards the oversold territory, suggesting more losses in the market.
Should prices decline further, immediate support could be found around the 20-day SMA at 84.40. Then, a leg below that level could meet the eight-month trough of 76.25, before the focus shifts to 65.90, registered in December 2021.
However, if the market manages to regain positive momentum, the strong obstacle of 93.70, which coincides with the downtrend line, could offer nearby resistance ahead of the 200-day SMA at 97.14 and the 97.82 barrier. A significant close above the latter could raise chances for more increases.
In the medium-term, the outlook remains negative since the price holds below the downtrend line and the 200-day SMA. Only a close above those boundaries will switch the outlook to positive.
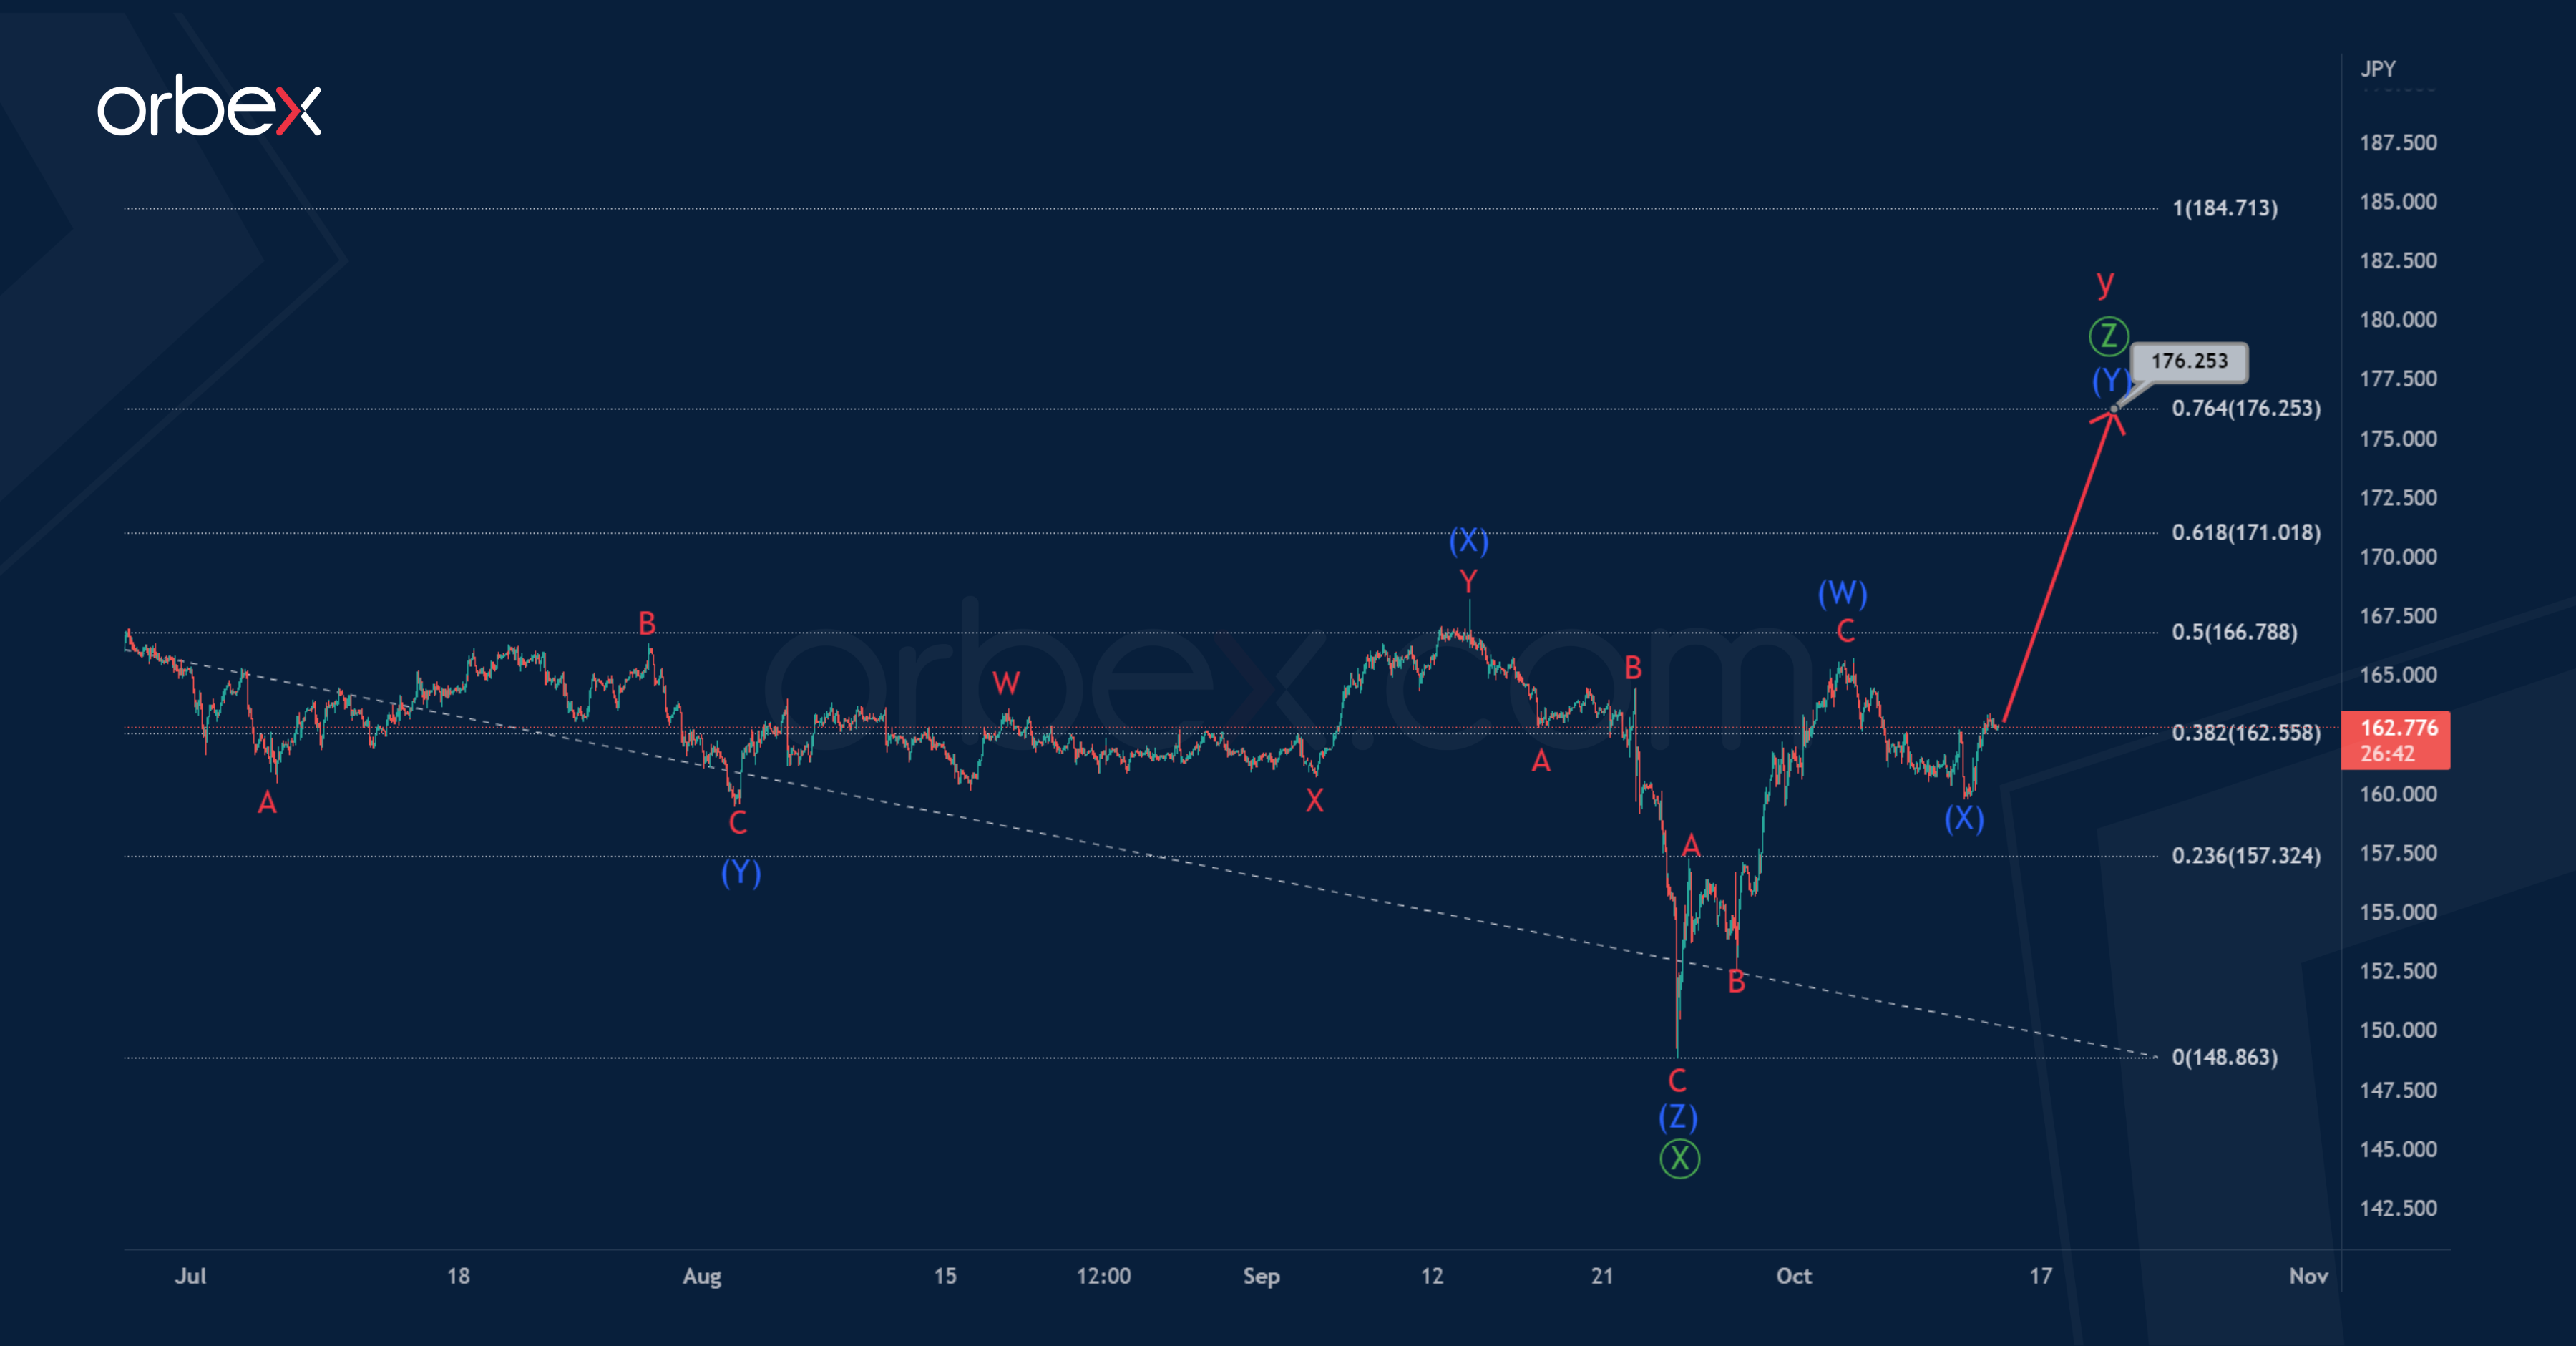
GBP/JPY: Intermediate Double Zigzag Likely to Complete Cycle Trend Near 176.25
GBPJPY seems to be forming a global corrective trend, taking the form of a double zigzag. On the 1H timeframe, the final part of this trend is visible - the actionary wave y of the cycle degree.
It seems that the wave y takes the form of a triple zigzag Ⓦ-Ⓧ-Ⓨ-Ⓧ-Ⓩ of the primary degree, which may soon be fully completed. After the end of the second intervening wave Ⓧ, which took the form of a triple combination, the price began to move up.
Most likely, the wave Ⓩ takes the form of a double zigzag, in which the first two parts look finished. In the next coming trading weeks, growth is expected within the final intermediate wave (Y).
The completion of the entire wave Ⓩ is possible at 176.25. At that level, wave Ⓩ will be at 76.4% of wave Ⓨ.
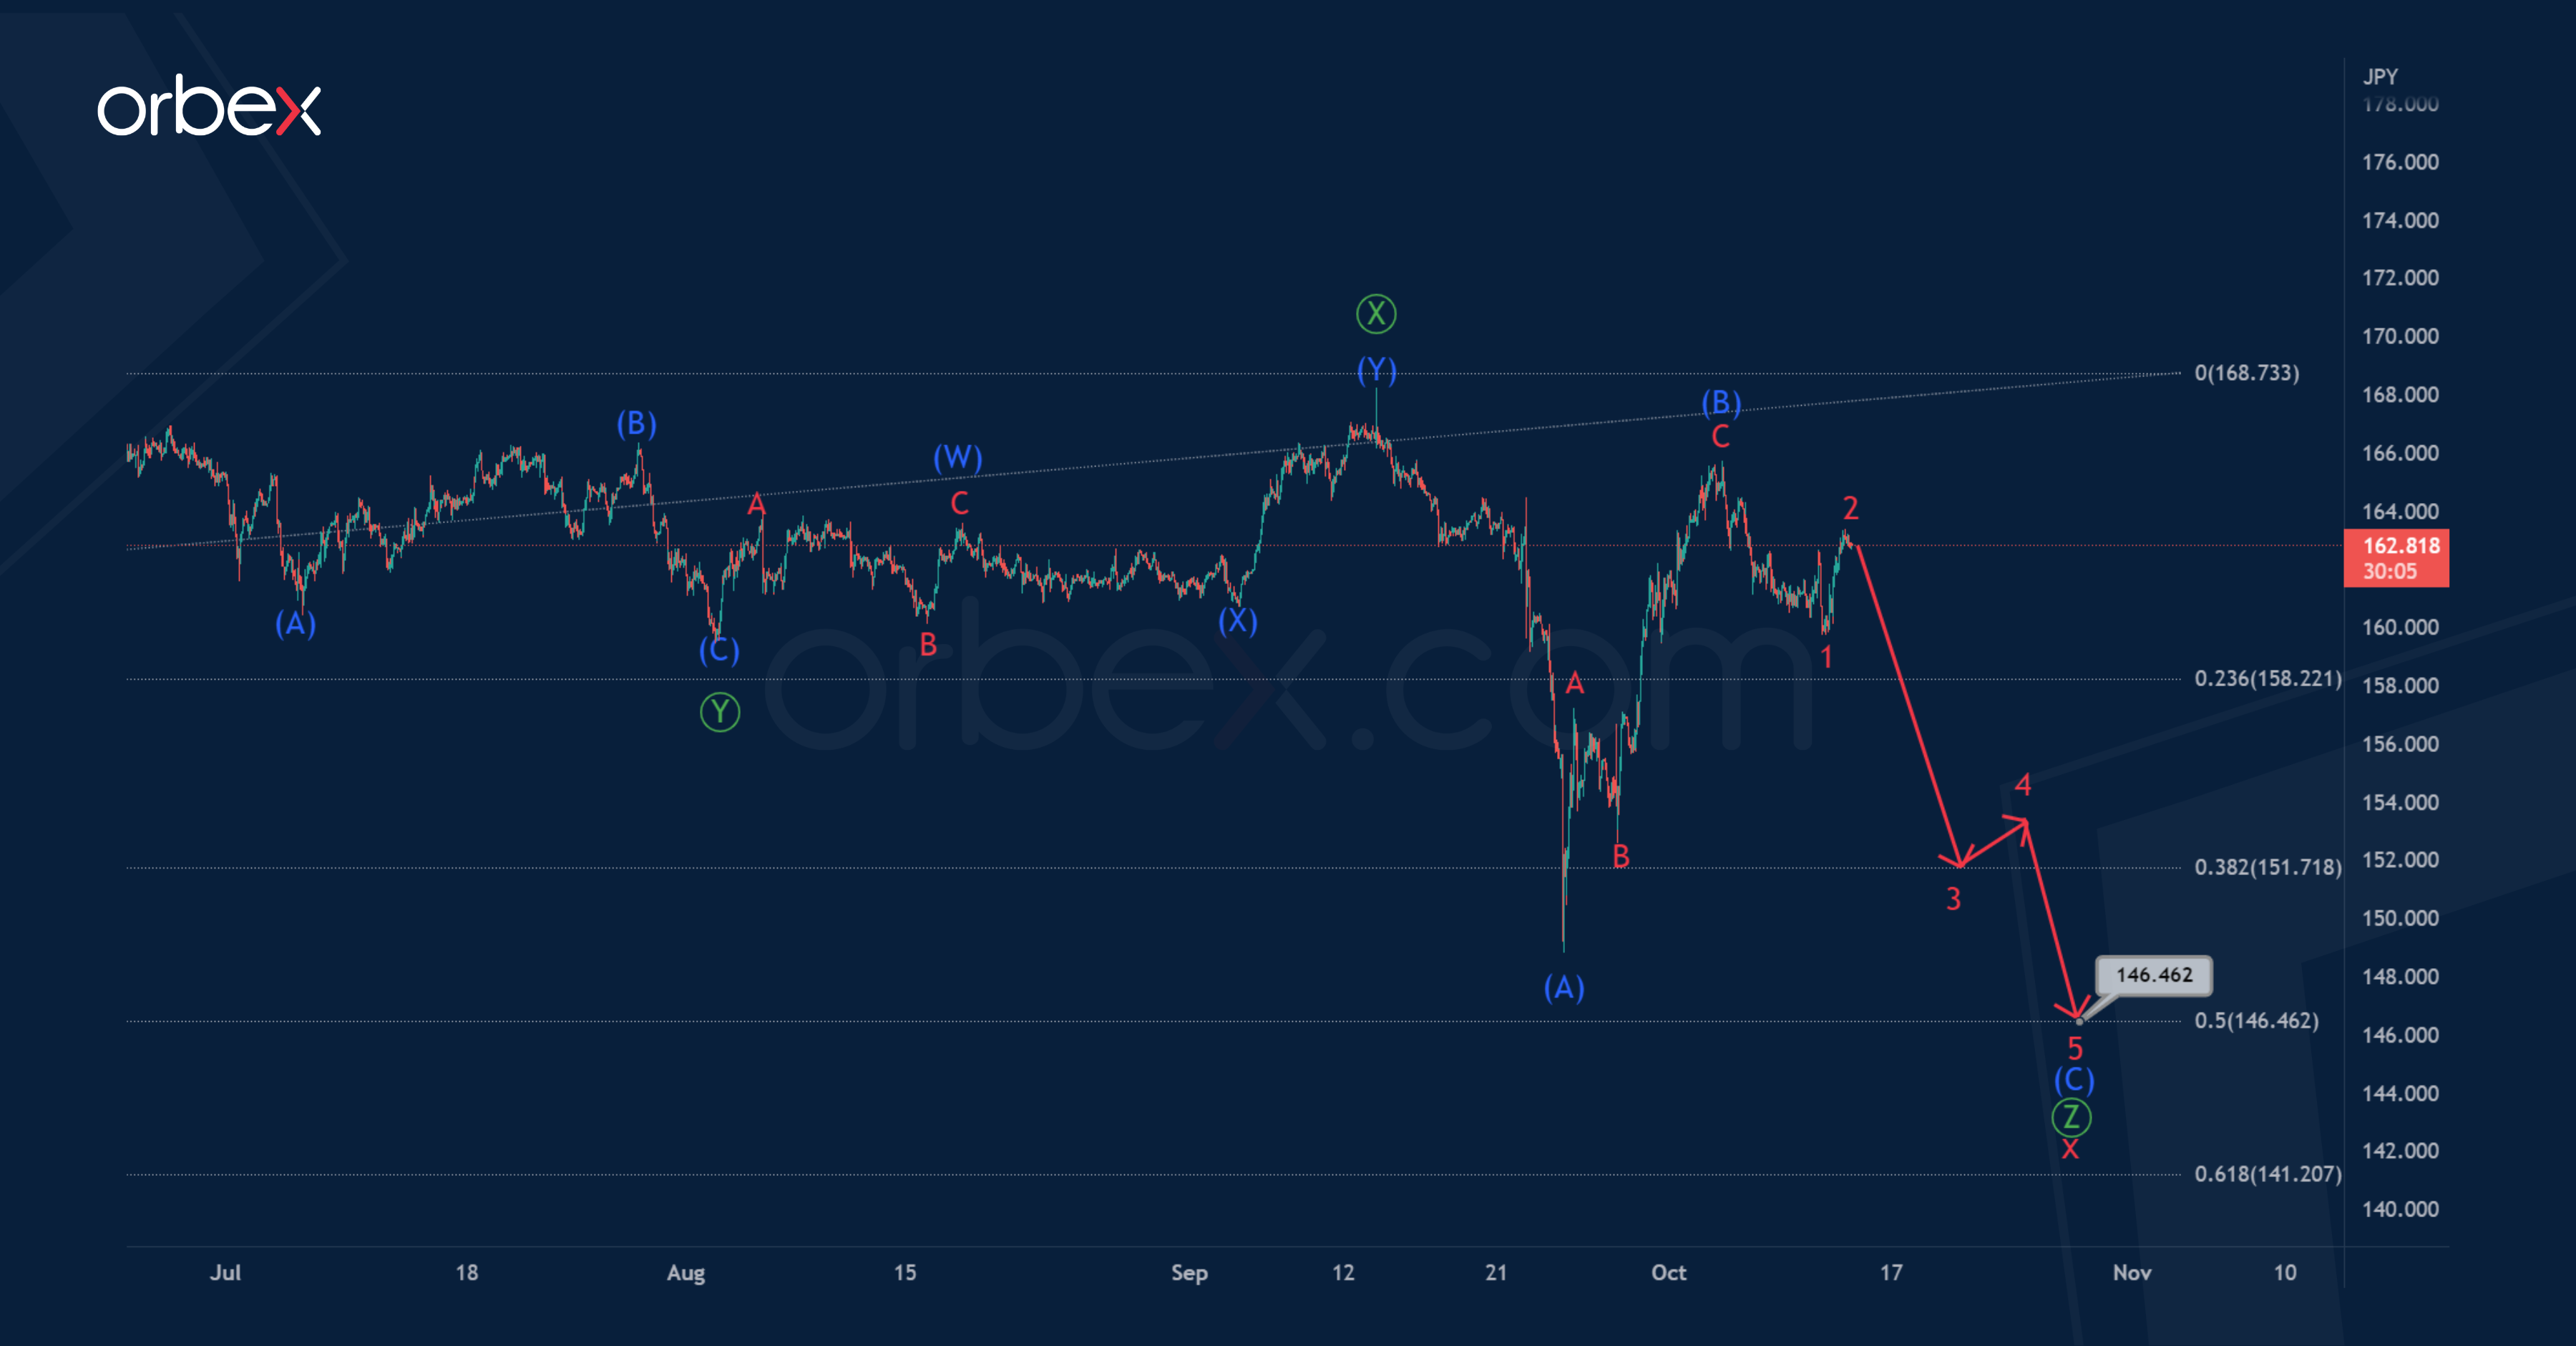
In the second variant, the market builds not a double, but a triple zigzag w-x-y-x-z of the cycle degree. And now its fourth part is being formed.
Thus, in the last section of the chart, we see a corrective movement in the cycle wave x. This wave, judging by its structure, may take the form of a triple zigzag Ⓦ-Ⓧ-Ⓨ-Ⓧ-Ⓩ.
It is possible that the market will fall in the last wave Ⓩ to 146.46. At that level, cycle wave x will be at 50% along the Fibonacci lines of actionary wave y.
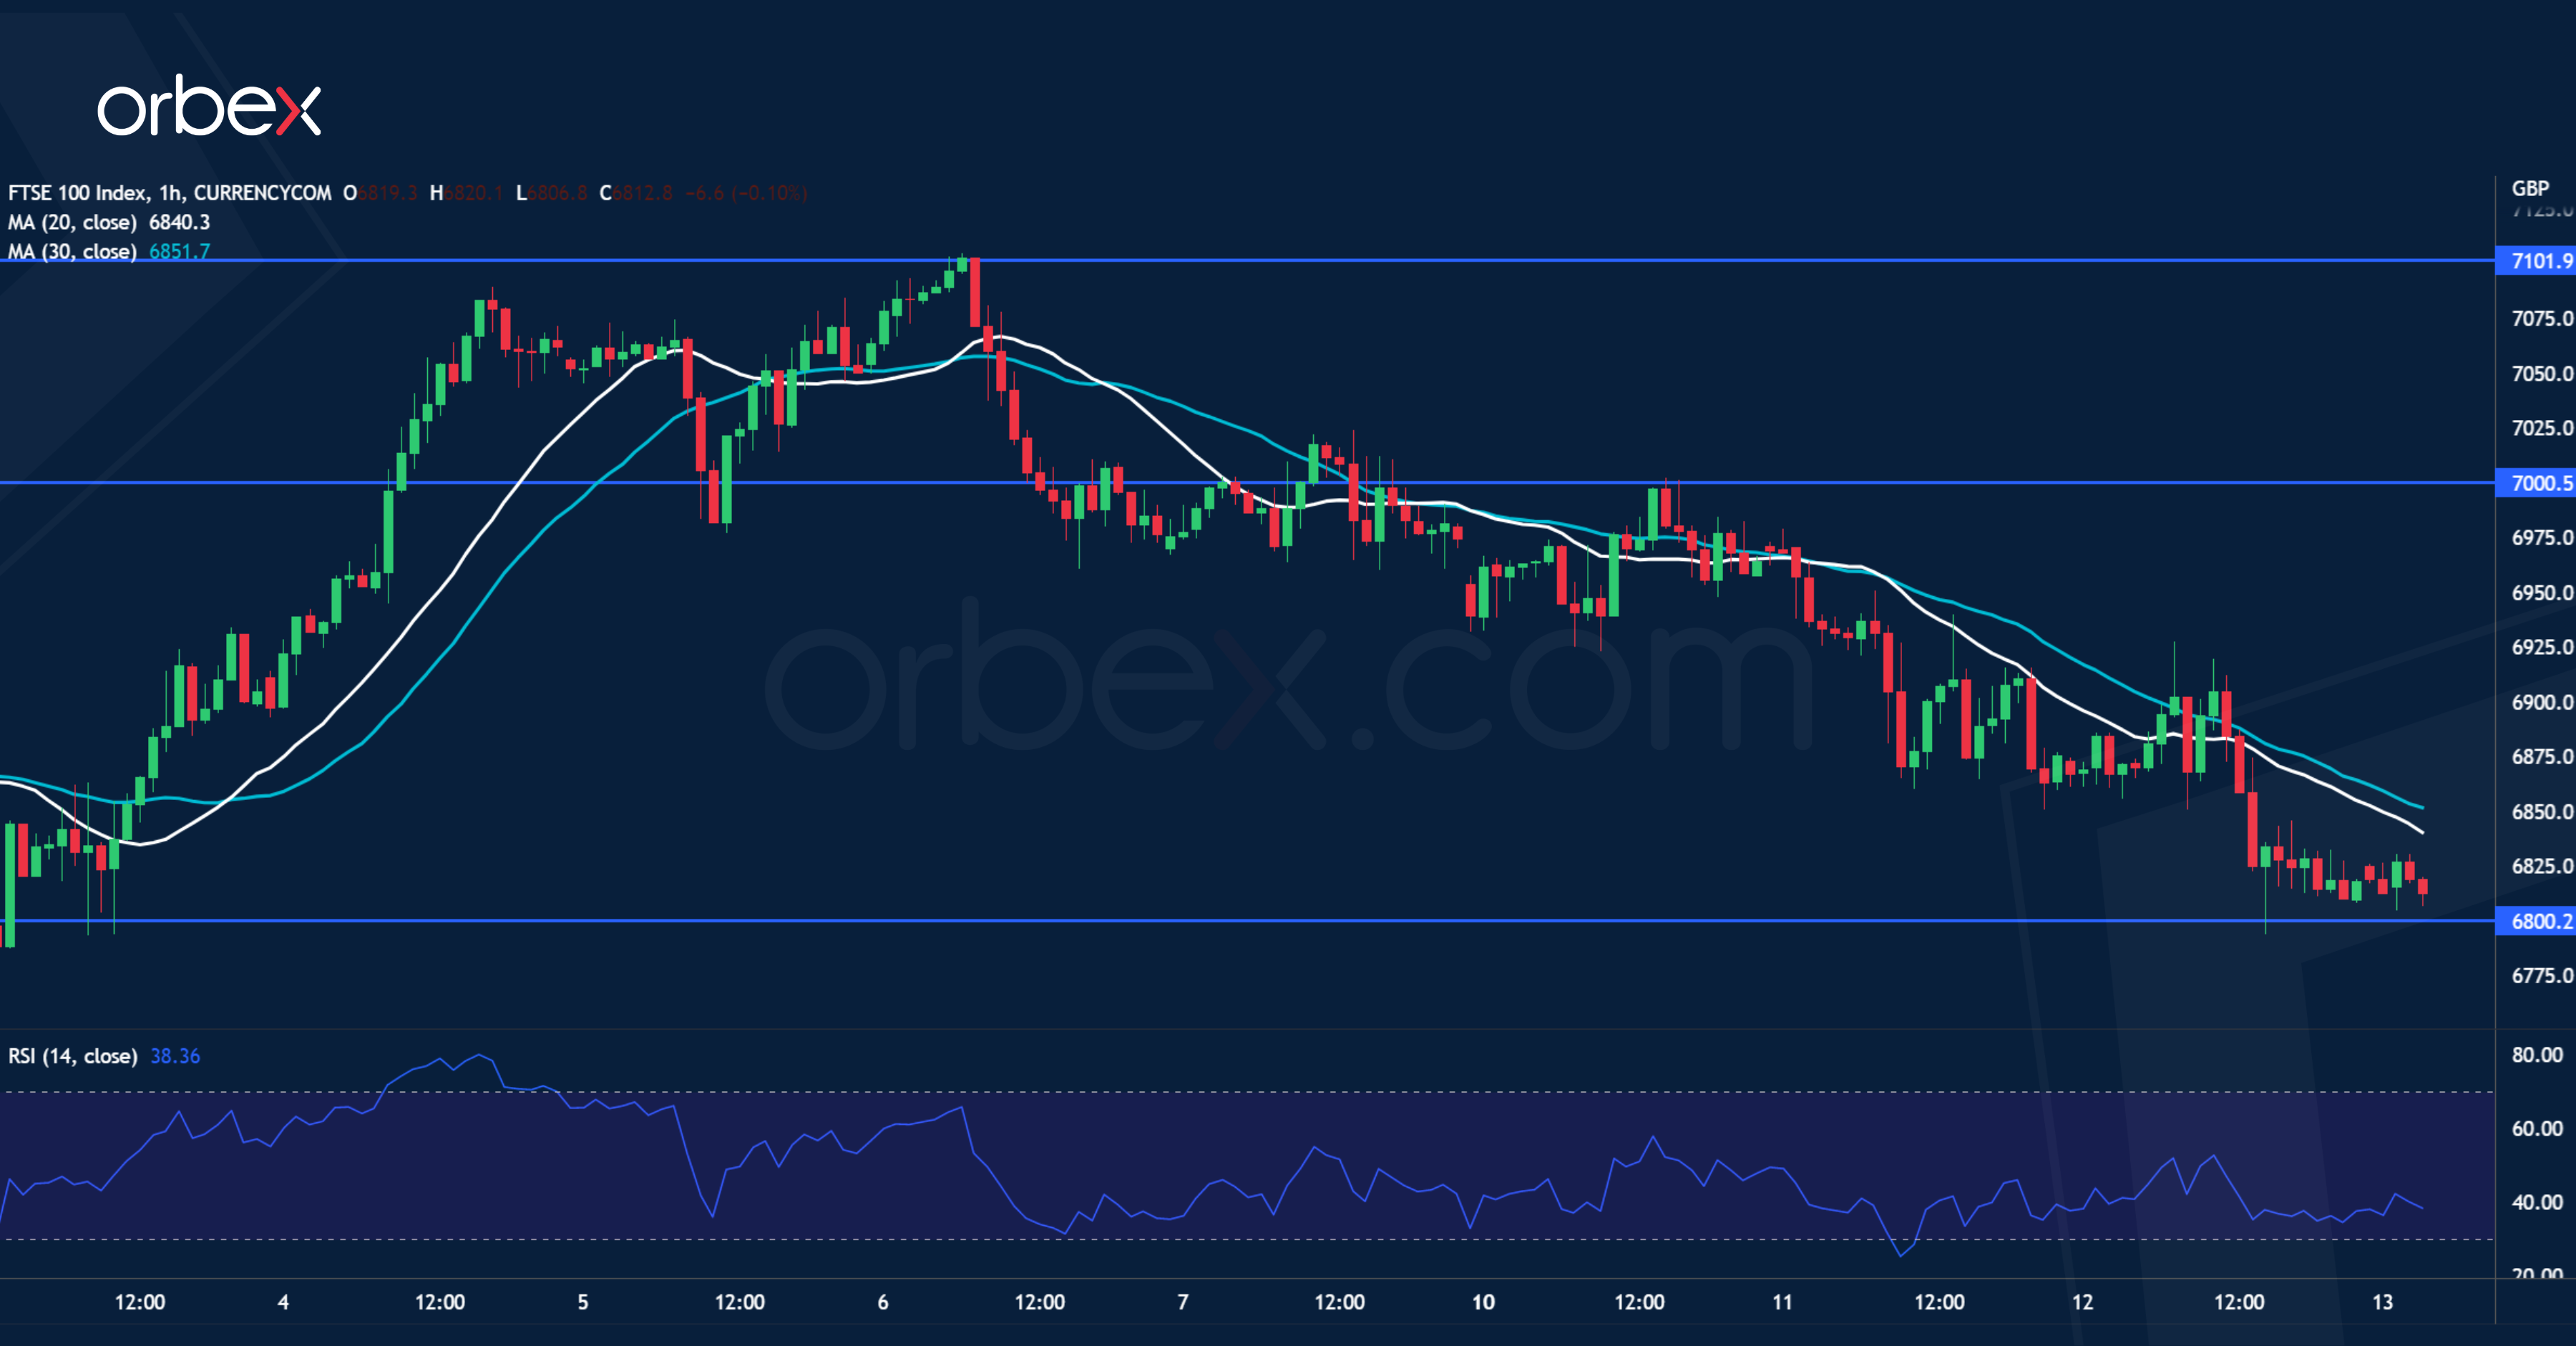
FTSE 100 Tests Critical Floor
The FTSE 100 fell due to the spillover of the UK gilt market’s liquidity crisis. The index came under pressure at 7100 on the 20-day moving average. A lack of follow-up support indicates that the bearish mood still prevails and the bulls are wary of a dead cat bounce. They will need to lift 7000 to retain some foothold. On the downside, 6800 is a critical bottom not only from the latest bounce but also last March’s lows. A breakout could trigger momentum selling to 6620 and signal a bearish market in the medium-term.
USD/JPY Climbs Along Trendline
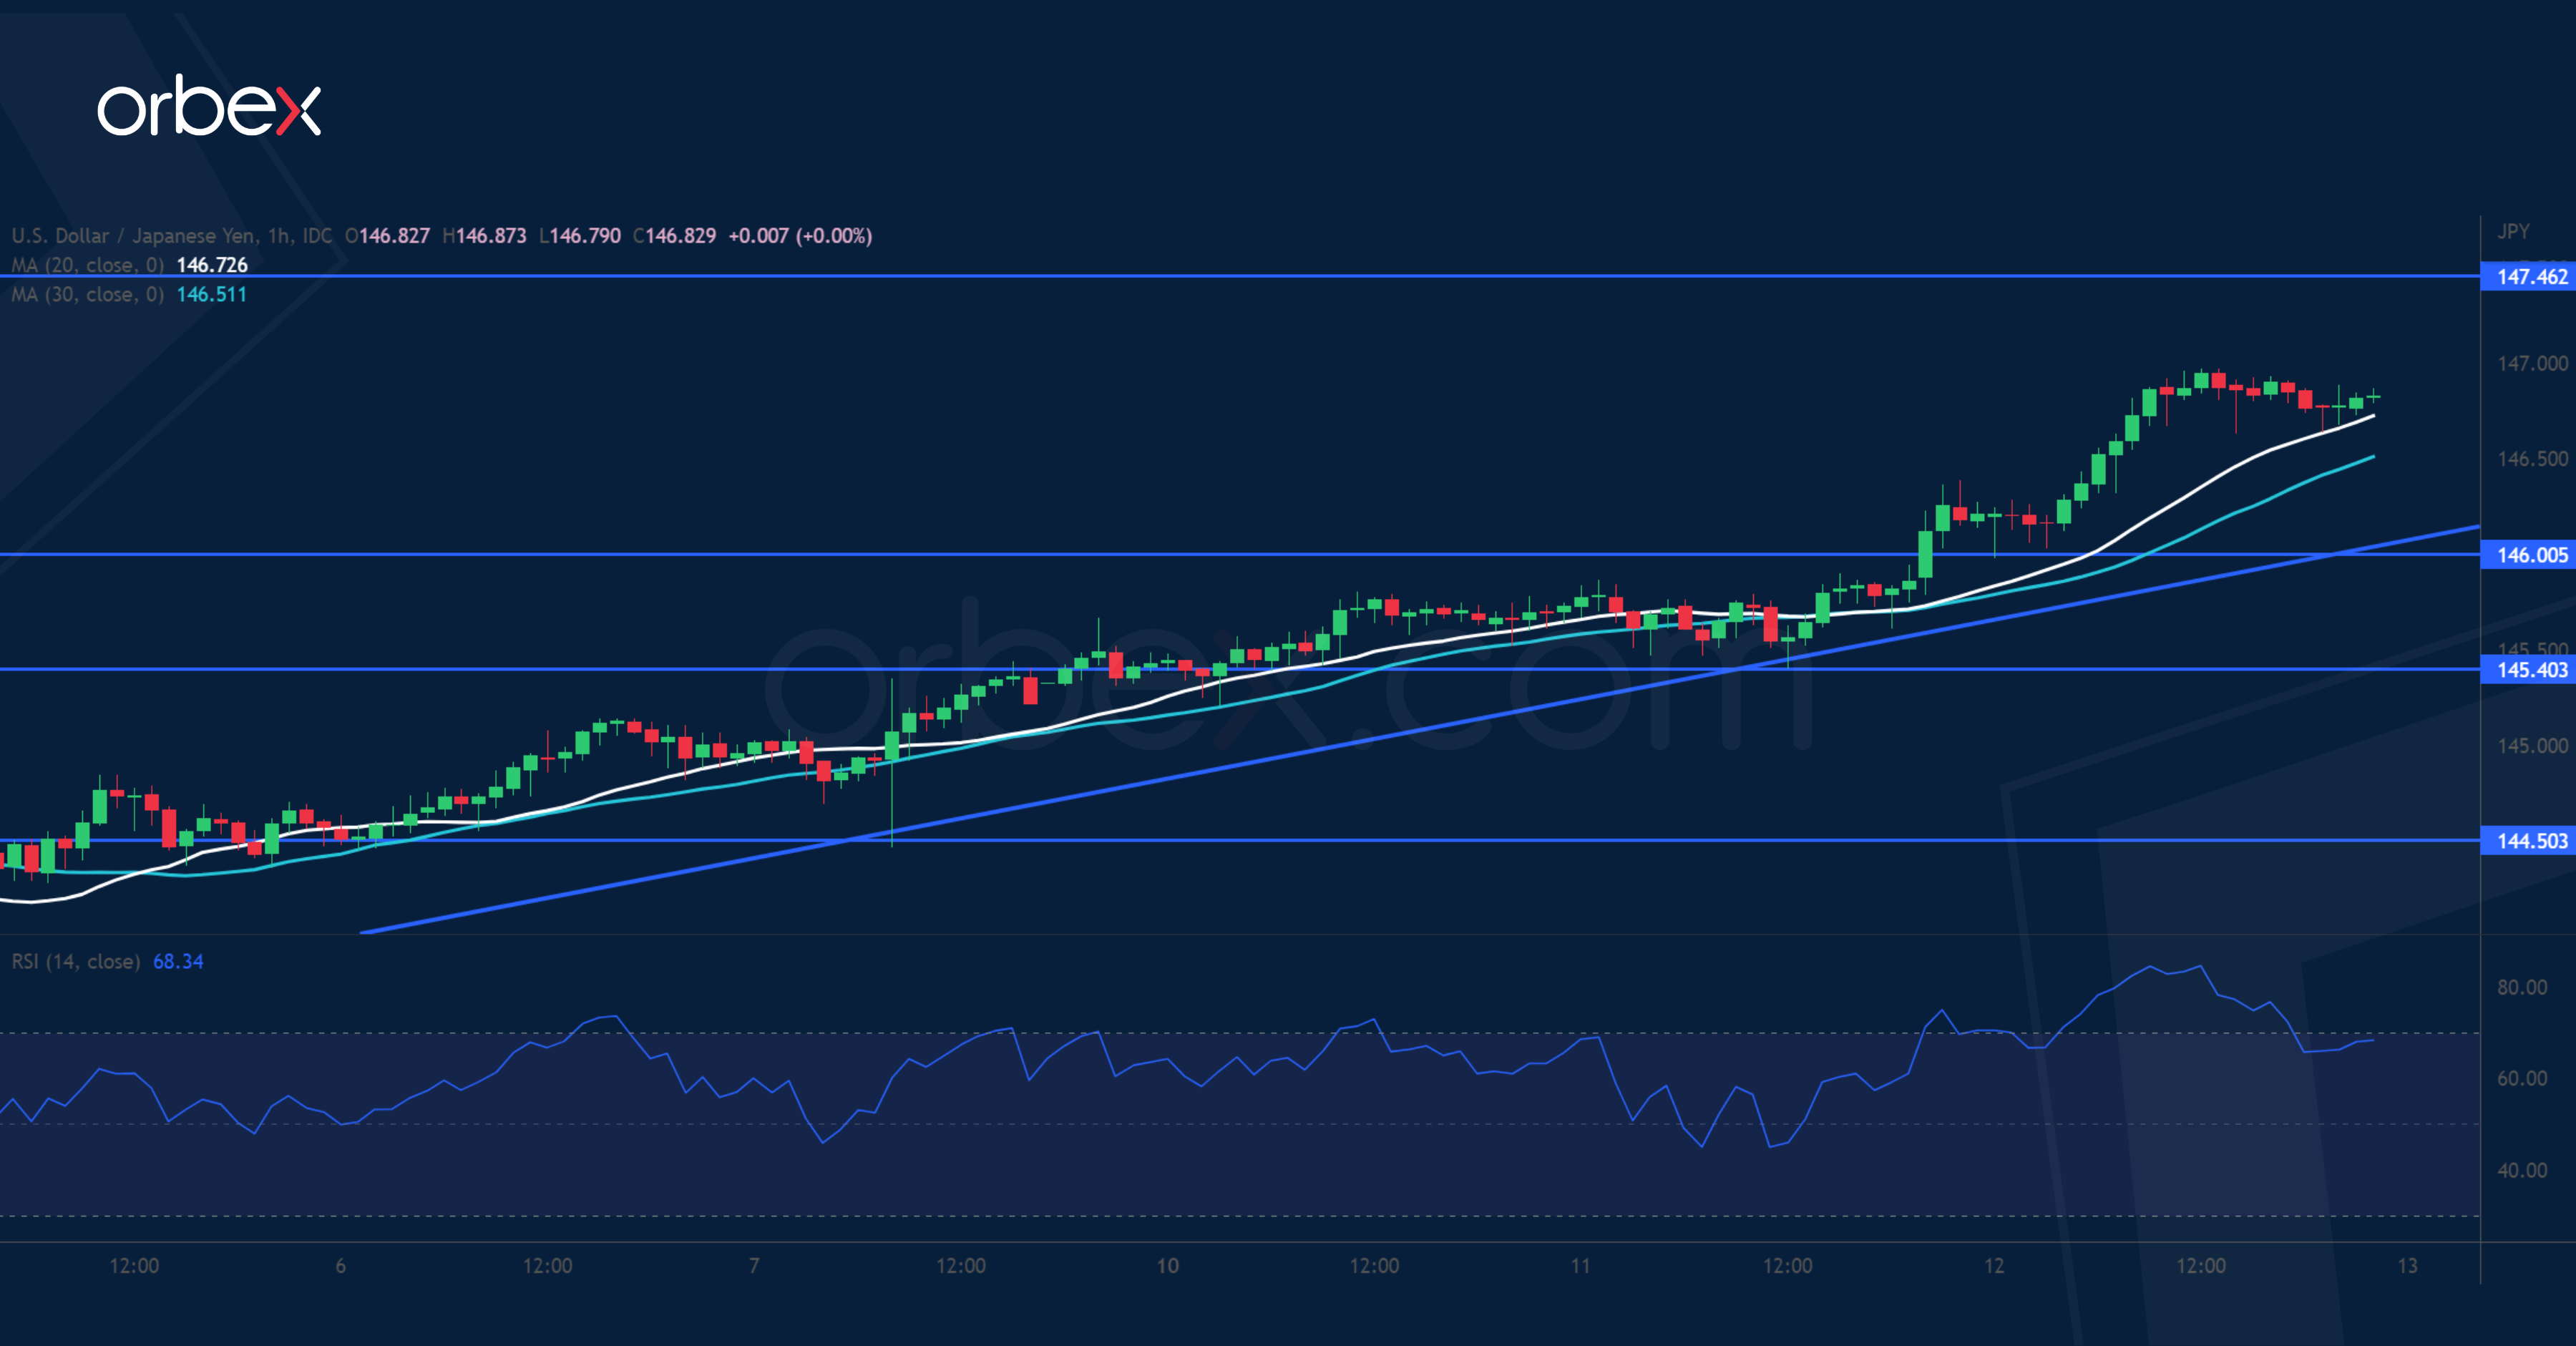
The US dollar steadied after the Fed minutes showed some consideration to the recession risk. The rally gained momentum after the greenback cleared the peak at 145.80. The rising trendline confirms that the uptrend has resumed. A lack of selling would carry the pair to its 24-year high at 147.50. As the RSI shot into the overbought zone, the dollar could use some breathing room. The psychological level of 146.00 on the trendline is the first support and 145.40 at the base of the breakout the bulls’ second line of defence.
AUD/USD Struggles to Bounce
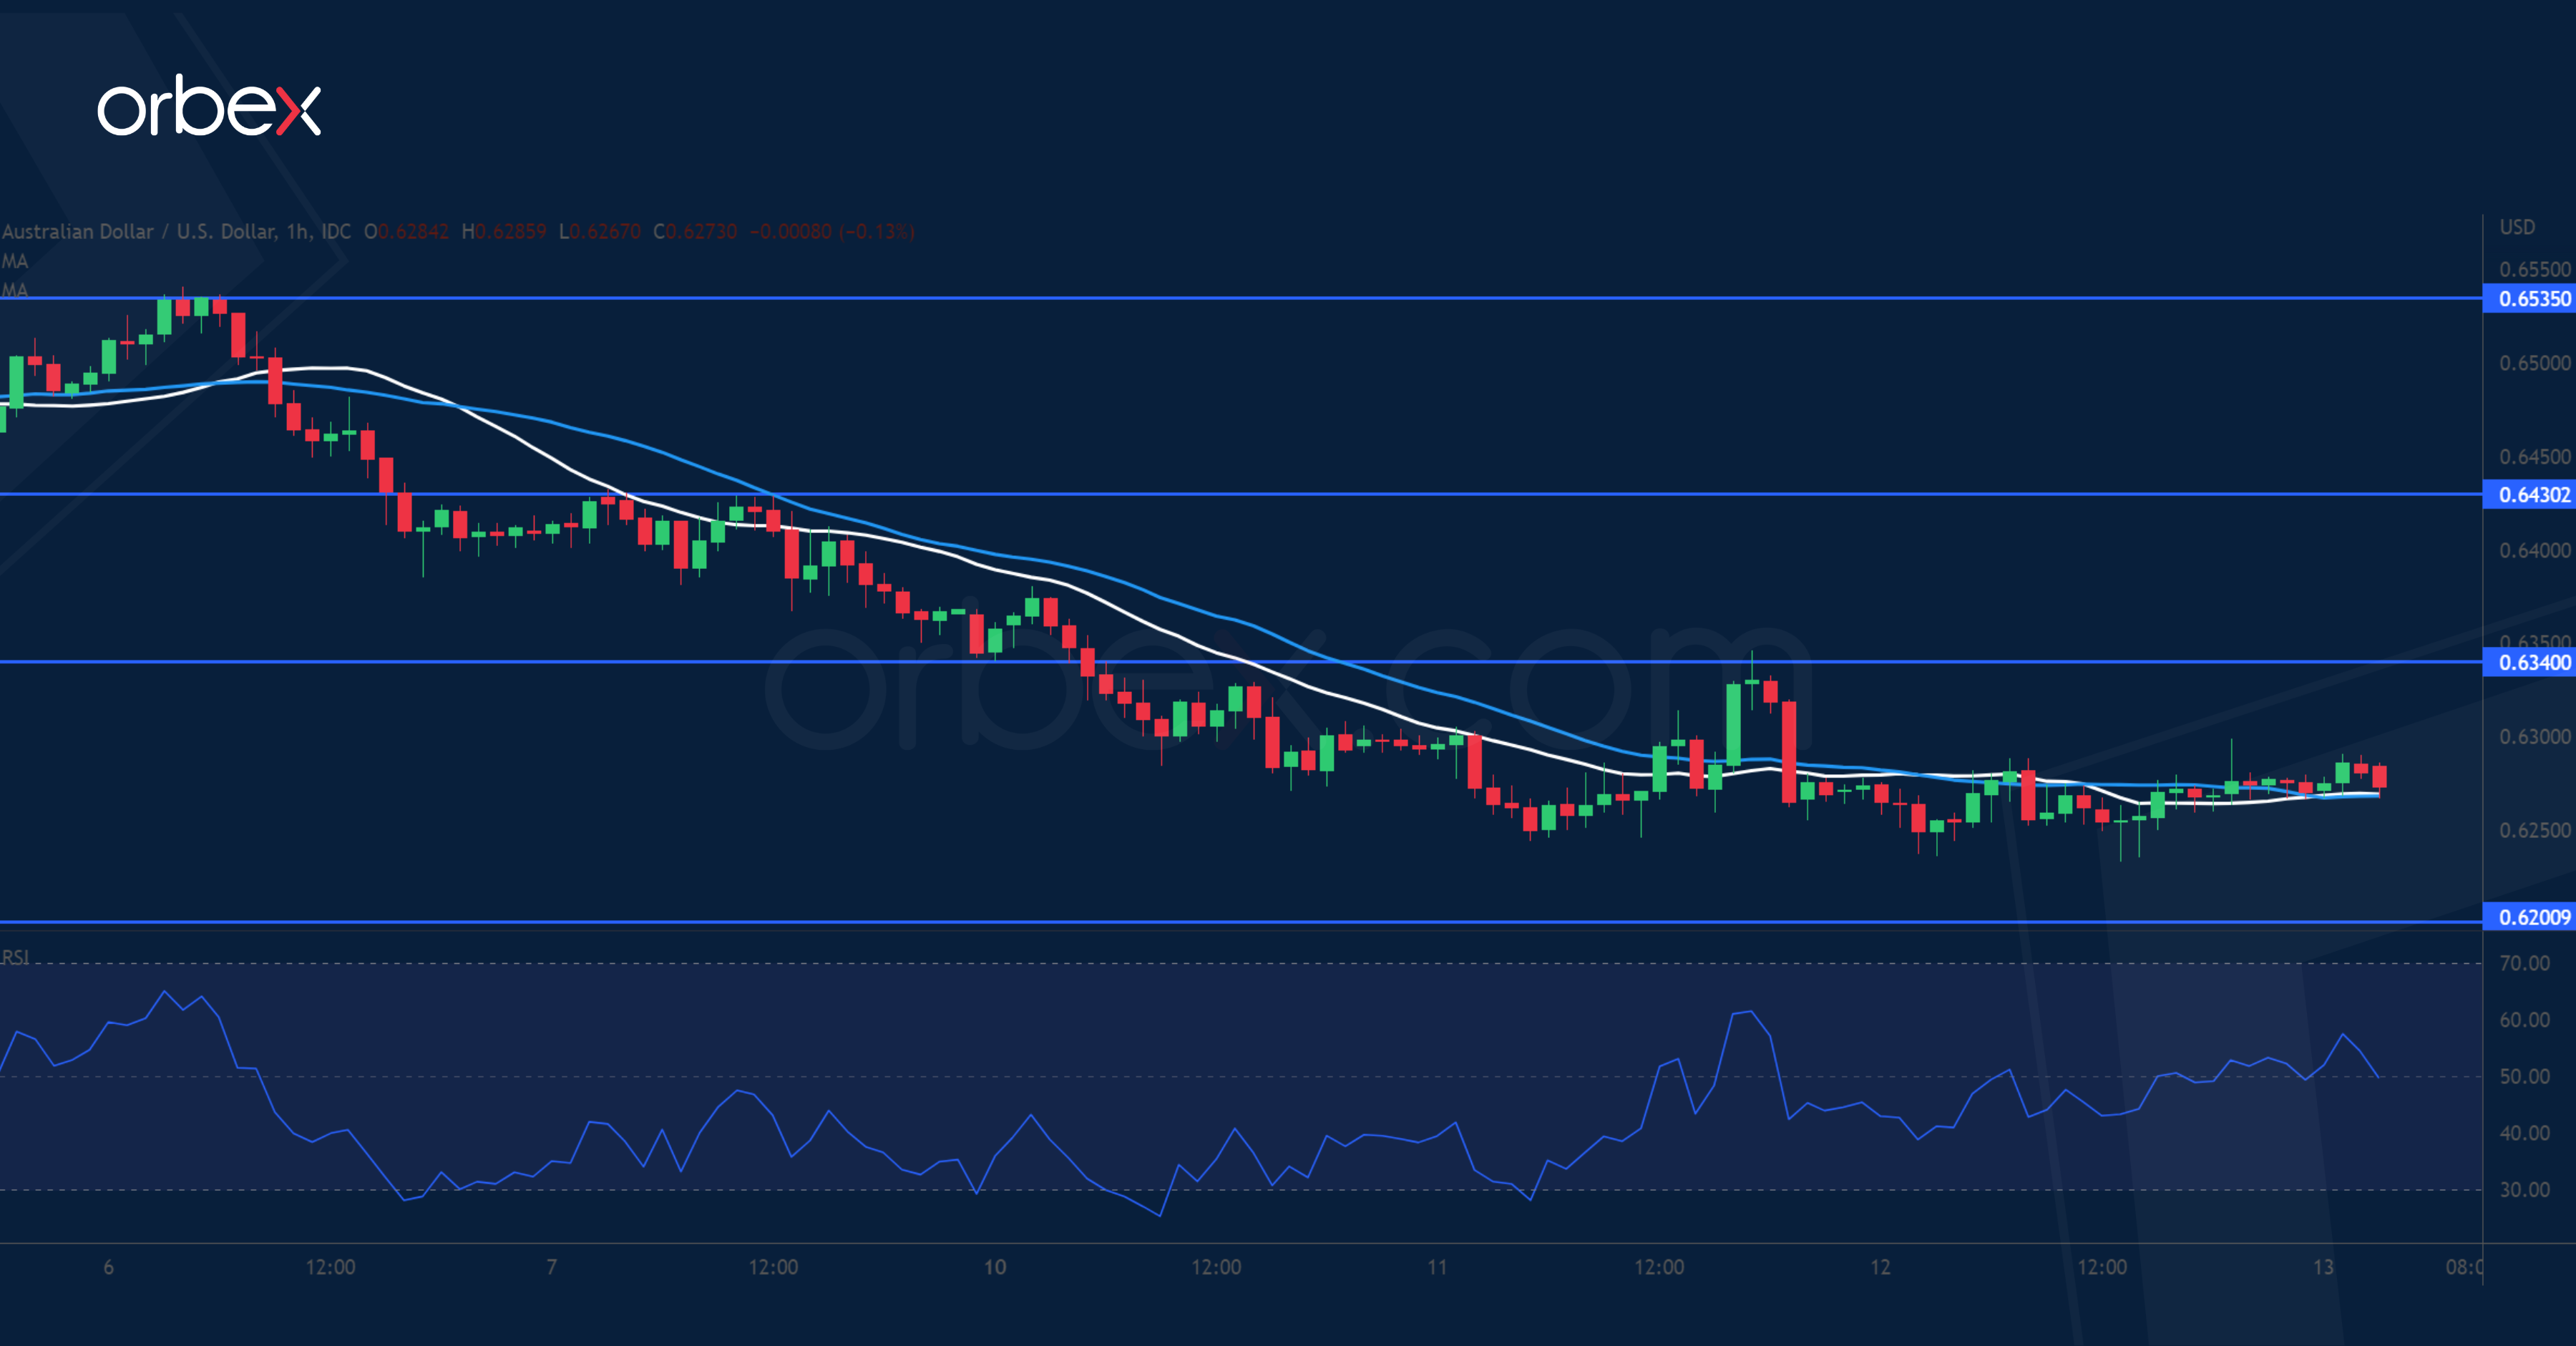
The Australian dollar struggles over downbeat inflation expectations. The downtrend accelerated after the aussie cut through the demand area around 0.6400. An oversold RSI caused a rebound as intraday traders started to take profit. Still, the directional bias remains down and the bears could be waiting to double down at a better price. 0.6340 is the first hurdle and 0.6430 a congestion area from the previous brief consolidation. On the downside, a fall below 0.6200 would open the door to April 2020’s low at 0.6000.
Keen to See Market Reaction in Case of In-line/Softer than Expected CPI
Markets
Daily changes in European and US interest rate markets were modest compared to what we got used to of late. US yields eased between 1.5 bps (2-y) and 5.25 bps (5-y). Investors clearly didn’t want to place big directional bets ahead of today’s key US inflation report. A $32bn 10-y Treasury auction tailed substantially, suggesting only mediocre investor interest. Still the impact on markets remained modest. The Minutes of the September Fed policy meeting indicated that most Fed officials agreed that the cost of doing too little could turn out much higher further down the road. At the same time, some more dovish oriented members advocated to calibrate the pace of rate hikes as risks are mounting. An earlier rise in EMU/German yields with especially longer tenors setting new cycle peak levels also evaporated. German yields finally eased about 1 bp of maturities up to 10-y. The 30-y yield maintained a gain of 5.5 bps. On the UK bond market, there was a remarkable decline of short-term yields (2-y -27,4 bps). Yields at longer maturities were little changed as the Bank of England bought the biggest amount of LT bonds (including inflation linked bonds, total amount £4.56 bn). Even so, the tensions/conflicts of interest between the BoE and the government persists. The BoE’s Bailey apparently wants the temporary buying scheme to end this week. At the same time, UK Fin Min Kwarteng warned the BoE will be responsible for market volatility after the end of the program. Despite this stalemate/collision course between the BoE and the government, sterling yesterday rebounded. EUR/GBP dropped from the 0.885 area to close near 0.874. On the broader FX market, the dollar maintained recent gains against most majors (close DXY 113.3, EUR/USD 0.9705). USD/JPY was the exception to the rule. Only a whisker away from the 147 big figure, the pair again nears the 1998 peak, with markets looking for new MOF interventions to block further yen losses.
US CPI inflation evidently takes center stage today. For the headline figure, a modest easing from 8.3% to 8.1% Y/Y is expected. However, the dynamics of core inflation is expected to stay elevated at 0.4% M/M and 6.5% Y/Y (from 6.3%) with rent probably a key driver. Last month, an upward surprise only confirmed the Fed’s case to bring monetary policy clearly in restrictive territory, reinforcing a the established up-leg in yields. However, given recent hawkish Fed communication, this message should already to a large extent be discounted by markets. An upward surprise for sure will cause additional volatility. However, we are especially keen to see the market reaction in case of an in-line/softer than expected figure. Is there any room for consolidation after the recent rally in core yields and the dollar? This is especially the case as US (e.g 2-y & 10-y) yields are testing key technical resistance levels.
News Headlines
The ECB is eyeing a decision at its next policy meeting on changing the rules on TLTRO’s. The central bank wants to by-pass that cheap loans it has granted during previous crisis years to kickstart the economy get rerouted to its own deposit facility which all of a sudden looks very attractive following back-to-back large rate hikes (with more to come). Sources suggest that three possible options remain. The first and most simple one is unilaterally changing the terms of the TLTRO’s so that cash from the operations parked at the ECB would not be remunerated at the deposit rate. A second possibility consists out of treating TLTRO cash in the same way as minimum reserves, which are currently remunerated at 0.5%, below the 0.75% deposit rate. The final solution is some sort of reverse tiering that would allow for a more favourable remuneration up to a certain threshold, after which a lower rate would apply.
Russian President Putin suggested to transfer to the Black Sea the lost Nord Stream volumes that used to be transited across the Baltic Sea. The comments came ahead of a meeting with Turkish President Erdogan with Russia considering building more subsea natural gas pipelines to Turkey. An extra gas hub could be used to supply Europe, Putin suggested. He also hinted at using the Nord Stream 2 pipeline which is blocked from entering service by Germany.