Sample Category Title
USD/JPY Rallies To New Multi-Year High, Bulls Aim 150.00
Key Highlights
- USD/JPY rallied further and traded to a new multi-year high above 147.00.
- A major bullish trend line is forming with support at 146.50 on the 4-hours chart.
- Gold and oil came under pressure after the US CPI report.
- The US CPI increased 8.2% in Sep 2022 (YoY), more than the forecast of 8.1%.
USD/JPY Technical Analysis
The US Dollar started a fresh increase above the 145.00 resistance against the Japanese Yen. USD/JPY traded to a new multi-year high and even cleared the 147.00 level.
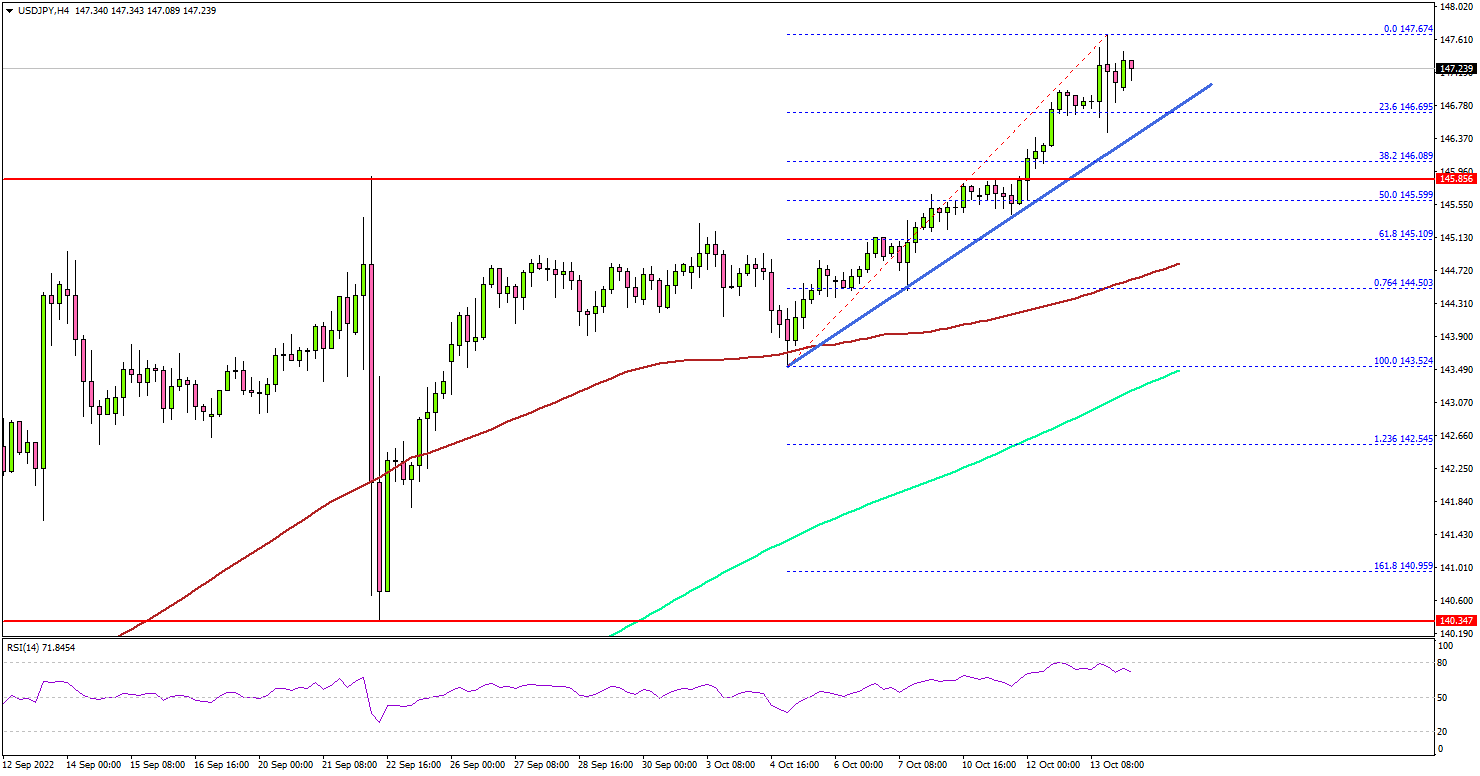
Looking at the 4-hours chart, the pair settled well above the 145.00 level, the 100 simple moving average (red, 4-hours), and the 200 simple moving average (green, 4-hours).
There was a clear move above the 147.00 and 147.20 resistance levels. Besides, the pair spiked higher after the US CPI data was released. The market forecast was +8.1% in Sep 2022, compared with the same month a year ago.
However, the CPI increased 8.2% in Sep 2022, less than the last 8.3%. The pair spiked higher and cleared the 147.50 level to set a new multi-year high.
If the bulls remain in action, the pair may perhaps rise above the 148.00 level. The next major resistance is near the 148.50 level. A clear move above the 148.50 level might send the pair towards the 150.00 level. The next major hurdle could be near the 152.00 level.
On the downside, an initial support is near the 146.20 level. The main support sits at the 145.50 level. There is also a major bullish trend line forming with support at 146.50 on the same chart. A downside break below the 145.50 zone might send the pair towards the 144.20 level.
Looking at gold price, there was a sharp bearish reaction after the US CPI data and the price declined below the $1,650 support zone, but later recovered.
Economic Releases
- US Import Price Index for Sep 2022 (MoM) – Forecast -1.1%, versus -1.0% previous.
- US Export Price Index for Sep 2022 (MoM) – Forecast -1.0%, versus -1.6% previous.
- US Retail Sales for Sep 2022 (MoM) – Forecast +0.2%, versus +0.3% previous.
Some Unintended Consequences of the RBA’s Pivot
The Westpac Melbourne Institute Index of Consumer Sentiment only fell by 0.9% from 84.4 to 83.7 in the October Survey.
The Index remains in deeply pessimistic territory but could have been much weaker.
As discussed when we released the results of the survey we examined the two samples over the four day period.
The first sample (covering the responses on day 1 of the survey) preceded the RBA's decision to raise the cash rate by 25 basis points. The second sample covered responses which followed the rate decision.
The first sample (sample of 476) showed a Sentiment Index of 77.4 – down 8.3% from the September print of 84.4.
But the Index for the second sample (a sample of 724) printed an Index of 88.7 (up 5.1% on the September print). The difference between the two surveys represented a turnaround of 14.7%.
The turnaround in housing market confidence was even more spectacular. The first sample measure for the Westpac Melbourne Institute Index of House Price Expectations showed a 16% fall in the Index while the second sample showed a lift of around 8% relative to the September print.
This spectacular change in the Index is very likely attributable to the Reserve Bank's decision to raise the cash rate by "only" 25 basis points despite market pricing that gave a probability of around 90% to an increase of 50 basis points.
In my 30 years following RBA policy and markets I cannot recall the RBA moving against market expectations when the probabilities have been so high.
The key indicator for the Sentiment survey was the media reports which took the lead from market pricing and signalled a very confident expectation to the public that a further 50 basis point move was to be expected.
We can congratulate the Board for a courageous decision while pointing out some likely unintended consequences.
Westpac had expected a 25 basis point move until we were obliged to lift our forecast for the terminal federal funds rate by 125 basis points to accommodate a much more aggressive guidance from the FOMC and upside surprises on US inflation.
In lifting our forecast for "global rates" by 125 basis points we lifted our terminal rate for the RBA cash rate by 25 basis points to 3.6%, with the upward adjustment coming in October – a 50 basis point move instead of our earlier preference for 25 basis points.
Because the Australian economy is much more sensitive to the cash rate than is the US economy to the federal funds rate it is not appropriate to follow the full lift in FOMC pricing.
The major adjustment came in our AUD/USD forecast with a US7¢ cut in the likely exchange rate by end 2022 to USD0.65.
With the surprise 25 basis point move the market lowered its terminal cash rate by around 50 basis points. Central banks like to see the markets doing their job for them so a fall in the fixed rates only adds to the task of easing demand pressures.
From our perspective that price response was a surprising reaction to the decision from the RBA and an unintended consequence of the decision.
We observe from the confidence turnaround in the Sentiment survey the RBA decision has provided a short term boost to confidence that is likely to delay the slowdown in demand which will be necessary to constrain demand and inflation pressures.
The key for central banks at this stage of the inflation cycle is to slow demand overall including the demand for labour so that businesses question whether their recent successes in raising their prices, particularly to restore margins, can be sustained or whether they can proceed with plans to increase prices.
Without that hesitation the RBA will fail to wring the inflation pressures out of the system.
Questioning the sustainability of demand will also be consistent with questioning the need to boost employment plans – this is at a time when the labour market is the tightest in 50 years. Currently, labour supply cannot adjust quickly enough to contain wages pressures – thus labour demand needs to slow.
Tight labour market conditions emerged during the pandemic, associated with the national border "closure" – with restrictions on the inflow of people (labour supply) more stringent than those for the outflow. Net immigration averaged around plus 240,000 before Covid and over the two years during the pandemic Australia experienced outflows of around 120,000 – a net loss of around 600,000 people. This was at a time when fiscal and monetary stimulus was boosting demand exacerbating the employment shortfall.
The third unintended consequence of the RBA surprise has been an unexpected further collapse in the AUD to around USD0.625 from USD0.65 before the announcement.
That can be expected to heap further pressure on inflation, adding upside risks to the RBA's current forecast of 7.75% by end 2022 and, potentially, its 2023 forecast.
And the fourth unintended consequence is that a decision to speed up rate increases back to 50 basis points would now be particularly dangerous.
Just as we saw an overreaction in confidence from a positive shock the impact of a larger tightening than expected is likely to be too damaging from the RBA's perspective.
The RBA has not ruled out returning to "50's" should the data so demand although we think the hurdle to going by 50 now will be very high.
At the time of the announcement, we interpreted these likely unintended consequences as justifying no change to our terminal rate of 3.6% but extending the length of the tightening cycle.
We have extended our estimate of the end of the tightening cycle from February to March.
As discussed, that would be consistent with activity holding up for longer given the boost to confidence of the policy pivot.
Consequently, we now expect 25 basis point moves in November; December; February (no meeting in January) and March.
We still expect that achieving a terminal rate of 3.6% will be sufficient to slow growth in the economy from 3.4% for 2022 to 1.0% in 2023.
Activity may hold up a little better in the first half of 2023, given a little more momentum in 2022, resulting from the lower rate profile, to be followed by a more rapid slowdown in the second half.
Any risks of consecutive negative growth quarters would centre on the second half of 2023 rather than the first half, although that "recession" scenario is not our central case.
If our four percentage point down swing in inflation in 2023 does not appear to be materialising (and that has to be a central risk) then we expect that the RBA will have to raise the terminal rate even further – certainly a more likely scenario than trying to fine tune inflation with a more benign rate cycle and a stronger growth outcome.
The Role of the Neutral Rate
Our view has been that the "handbook" for central banking is, when it becomes necessary to contain an inflation shock at the same time policy is clearly stimulatory the strategy is to quickly return the cash rate to "neutral" and then move more slowly.
In previous speeches the RBA Governor has identified "neutral" to be at least zero real, where the nominal component is best assessed as long term inflationary expectations- around the policy target of 2.5%.
The guideline we have been working with is minimum neutral is 2.5%.
The cash rate is now 2.6% so policy is just now in the neutral region.
On October 12, RBA Assistant Governor (Economic) Ellis delivered an important speech on measures of neutral.
She nominates a range of "neutral" from negative 0.5% real to positive 2.0% real - with her various models indicating a central tendency of around 1% real, (or 3.5% nominal).
But neutral is described in terms of the long term. It is the rate which is consistent with the economy holding at trend growth and inflation at the inflation target.
Ellis concludes "The neutral rate is an important guide rail for thinking about the effect policy might be having. It is not necessarily a prescription for what policy should do."
This indicates that neutral is a long term concept whereas actual policy will be buffeted by short term shocks.
It is a similar approach to when Chairman Greenspan was asked where he saw neutral. He answered along the lines of "I will tell you when we are there" or even after we have been there.
Nevertheless, it does now seem that the Bank has a concept of neutral that is likely to be around where we are today if not a little higher.
For other reasons we discussed above that points to the shift to 25 basis point moves being the most likely outcome.
Cliff Notes: The Enduring Nature of Inflation and Interest Rate Risks
Key insights from the week that was.
Global inflation and its consequences for real income and interest rates were (yet again) the near sole focus of market participants this week. For Australia, the lens was our own Westpac-MI consumer sentiment survey. For the world, it was the latest IMF World Economic Outlook and, of course, the September US CPI report.
Beginning in Australia, despite a smaller than expected increase in the cash rate this month by the RBA (25bps instead of 50bps), Westpac-MI Consumer Sentiment remained deeply pessimistic in October, falling 0.9% to 83.7 – a historically-weak outcome. The available split of pre and post-RBA responses highlights that consumers viewed the smaller increase by the RBA as a material positive, with sentiment amongst those surveyed after the decision almost 15% higher. Nonetheless, with Westpac still expecting the cash rate to peak at 3.60% in March 2023, it is clear that interest rates will continue to place significant pressure on consumer sentiment for an extended period, particularly their views on family finances and housing. This headwind is in addition to the loss of real discretionary spending capacity from historic inflation.
Chief Economist Bill Evans provided a detailed discussion of these themes and other salient consumer sentiment trends in his video update this week; sentiment is also a key area of discussion in Westpac Economics’ latest Market Outlook in Conversation podcast.
In contrast to those facing the consumer, conditions remain highly supportive for Australian firms, NAB’s latest business survey reports. Up 3pts to +25 in September, the strength in conditions is broadly based across states and industries. And, with capacity utilisation still at historically strong levels, activity looks to have been resilient through Q3. Business confidence did however ease in September, down 5pts to +5, to be roughly in line with the long-run average. Constructive to the inflation outlook was the gradual easing in upstream cost pressures, although they remain at very elevated levels, having reached a peak in July.
The September overseas arrivals and departures release meanwhile continued to reflect a robust recovery, with each component having posted strong seasonally adjusted gains since the June/July travel season (+31k and +36k). The key highlight though was centred on net arrivals of travellers on ‘temporary work’ visas, an estimated +19k in September and +12k in August, marking significant progress in reducing visa processing backlogs. As grants continue to flow, the return of foreign labour should, in time, go some way towards alleviating Australia’s labour supply constraints.
Turning then to the US, where CPI inflation again surprised to the upside in September as headline prices rose 0.4% and the core measure (ex food and energy) gained 0.6%. Interestingly, while above market expectations and a multiple of the FOMC’s 2.0%yr medium-term target, the underlying detail of this report differed to recent reports with similar headline outcomes that sparked market alarm. Most notably, core goods prices were flat in the month, having averaged a 0.5% gain the past five months. Food inflation meanwhile looks to have peaked, admittedly at a very high level; and, albeit with less certainty, the same could be said of shelter. In our view, the overarching messages from this report is that support for inflation from demand looks to be fading quickly and, while stubborn, supply-side factors are topping out. For the FOMC, this should be a pleasing sign, although it is too early to slow the pace of tightening.
Westpac continues to expect another 75bp hike at the November FOMC meeting followed by 50bps in December and a final 25bp move at their January/ February meeting, leaving the fed funds rate at 4.625% at peak. Given the FOMC’s recent rhetoric, and the stubbornness of supply-side pressures, it is appropriate for the market to continue pricing modest upside risk to the peak level of fed funds and, more significantly, the length of time the fed funds rate will be held at peak. As discussed in Market Outlook in Conversation, the underlying trends evident in the inflation data along with the clear loss of momentum in domestic demand and job creation give us confidence that US interest rates will move lower from 2023, with term yields to front-run 200bps of cuts in the fed funds rate through 2024 and the first half of 2025 to a more neutral 2.625% at June 2025.
Finally to the IMF’s latest WEO. Unsurprisingly, the IMF’s global growth forecasts highlighted lost momentum and downside risks. At 3.2% and 2.7% for 2022 and 2023 respectively, the IMF are still more optimistic for the current year but pessimistic on 2023 than we are (Westpac 3.0% and 3.3% respectively). Regarding 2023, our more constructive view comes as a result of a stronger showing by developing economies, particularly in Asia as a result of their easier financial conditions; ability to stimulate; global tourism’s re-opening; the region’s ongoing economic development; and, for China, a progressive exit from domestic COVID-zero restrictions. These factors should allow the region to be materially stronger in 2023 than 2022, also supporting the currencies of the region against the US dollar, with flow-on benefit for Australia’s dollar. For interested readers, WEO provides considerable detail on the impact of inflation and tighter financial conditions on the global economy as well as assessments of past high-inflation periods and the lessons for today.
Can China Make Big Changes?
On Sunday, October 16, the 20th Congress of the Communist Party of China will take place. This rare event occurs every five years and plays a significant role in the world’s second largest economy. Let’s discuss why this event is worth following.
About the event
The 20th National Congress of the Communist Party of China (CCP) is convened on Sunday in Beijing. The event, which occurs every five years and usually lasts a few days, includes announcements and resolutions and eventually unveils a new Standing Committee, a small group of 25 core leaders in the Politburo. Traditionally, the top leadership is chosen at the party congress, including the General Secretary and Prime Minister.
The main questions that the party will discuss are:
- Economic issues and future policy.
- The analysis of top leaders’ results.
- The domestic policy prospects.
The decisions that the party will end up with can also influence other spheres.
What is expected?
The main thing that people are waiting for is the news about Xi Jinping’s leadership. It’s believed that he will be re-elected for a 3rd term in office. Under his leadership, many complex problems were solved that remained unresolved for a long time. For example, a the significant success was achieved in the fight against corruption, which was consolidated everywhere.
Then, the party should discuss several economic issues. Economic growth has been hampered by an intensifying trade and ideological battle with the United States that sometimes threatens to escalate into actual conflict. Also, due to the Russian-Ukrainian conflict, big Chinese businessmen and bankers are willing to occupy the niches in Russian businesses that have opened up after the departure of Western firms. However, they act cautiously, fearing falling under secondary US and EU sanctions.
Another essential problem to discuss is Covid-19. Many of the Chinese hope that China will move away from the "COVID zero" policy as it dramatically delays supply and production. Top management is aware of the economic costs but so far, it has been reluctant to change course. The Chinese government mentioned overall planning, which coordinates COVID-19 epidemic prevention and economic and social development but also insisted on normalizing China's measures to combat COVID pretty strictly. However, the past year has shown that these goals directly contradict each other, and continuing the current course of epidemic prevention will inevitably sacrifice economic stability and development.
What about the Chinese Yuan?
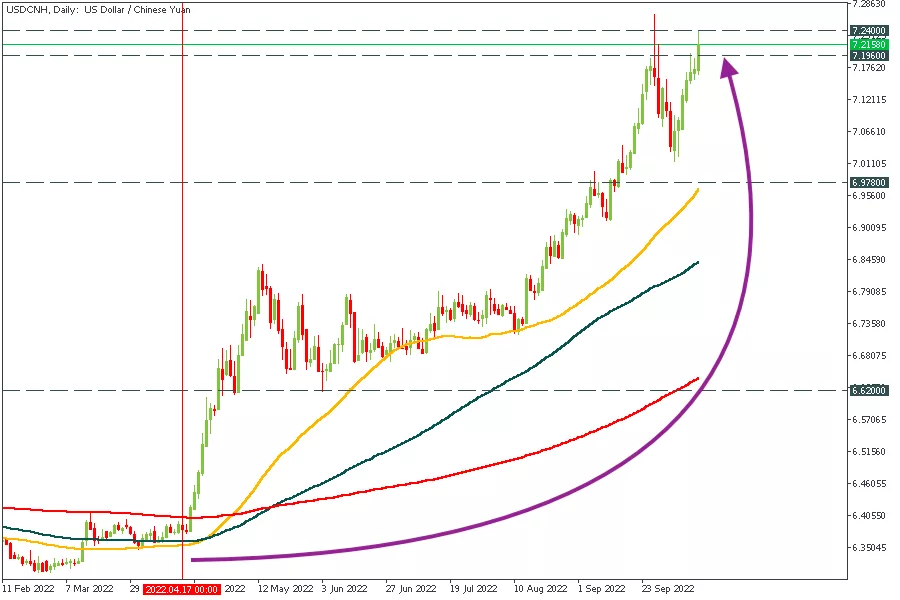
Possible changes in domestic policy can significantly affect the national currency. The yuan has also been under pressure from the rising dollar lately and has reached highs in the past six months. USDCNH broke through the psychologically impressive level of 7, marking a significant technical development for the currency pair.
Conclusion
This rare event may be a dark horse in today’s world situation, as changes in Chinese politics can influence CNH pairs and stocks. Follow it, and gain fundamental analysis skills.
Sunset Market Commentary
Markets
With no important data in the EMU, global markets held a wait-and-see approach going into the key US September inflation release. Once again UK markets were the exception to the rule. The BoE yesterday buying the biggest amount of long term and inflation linked bonds (combined £ 4.6 bln) eased market stress. The move was supported by (unconfirmed) rumours that the government was discussing how to scale back the amount unfunded tax cuts. Gilt yields early in afternoon trading at some point declined between 25 bps + (2-y) up to 35 bps (+) 30-y. Easing tensions on the gilt market to some extent also supported sterling. Cable (temporarily) regained the 1.125 handle. EUR/GBP dropped to test last week’s correction low near 0.8650. However, the rally on UK markets gradually slowed as the market focus turned going into to the US CPI release (cf infra).
After recent sharp rise in yields investors apparently assumed that the hurdle for a further hawkish repricing might have become rather high. US and German yields eased a few basis points going into the CPI data release. Unfortunately, market hopes for US (core) inflation topping out once again proved very premature. US headline inflation (8.2%) slowed less than expected. The dynamic in core inflation was even more worrisome. Prices excluding food and energy rose 0.6% M/M to 6.6% Y/Y, the fastest pace since 1982 (cf infra). In a logical curve inversion move US yields are rising between 22 bps (2-y) and 10 bps (30-y). The US 2-y yield set a new cycle top above 4.5%. The 10/30y yield are breaking/testing the 4.0% barrier. After another 75 bps Fed hike in November, markets now see a 2/3 chance of a similar additional step in December. EMU yields joined the US. Earlier EMU yield declines were reversed with German yields currently gaining between 12 bps (2-y) and 4 bps (30-y). In an interview (before the US CPI release), ECB’s Wunch said he wouldn’t be surprised to see the ECB policy rate exceeding 3.0% as he assumes the ECB has to go for a positive real policy rate at some point. The US upward CPI release evidently wasn’t good news for risk assets. The EuroStoxx50 is losing 2.0%, nearing last week’s cycle lows. US indices are ceding between 1.6 % (Dow) and 3.0% (Nasdaq) equally setting new YTD lows. UK bond markets keep a big part of their outperformance.
The higher than expected CPI reversed an intra-day US setback, but gains for the US currency could have been even bigger. DXY trades at 113.65 (open 113.2). EUR/USD (currently 0.965 ) lost a full big figure but is holding above the cycle low (0.9536). USD/JPY jumped to exactly test the 1998 top of 147.66. The likes of the Aussie dollar (AUD/USD 0.618), the kiwi dollar (0.553) and the loonie (USD/CAD 1.395) are all setting new cycle lows. Remarkably, Cable (USD/GBP 1.12) even maintains part of this morning’s gains. EUR/GBP trades near 0.8650.
News Headlines
Swedish inflation accelerated in September from 9.8% to 10.8% (1.4% m/m), the first 10%+ reading in four decades. Using a fixed interest rate (CPIF), prices rose 9.7% y/y and 1.1% m/m. CPIF excluding energy, the Swedish central bank’s preferred gauge, came in at a three-decade high of 7.4%. The numbers are exactly in line with the Riksbank’s own forecast and make a strong case for further, aggressive tightening, especially combined with the persistently weak Swedish currency. Back in September, the central bank hiked by 100 bps to 1.75%. Any rate hike less than 50 bps at the final policy meeting of the year (Nov 24) would be a major surprise. EUR/SEK trades unchanged following today’s release, testing the 11 big figure - the weakest SEK level since the pandemic - extensively.
Oof! US September CPI delivered a nasty surprise on all accounts. Starting with headline inflation, prices rose 0.4% m/m to be up 8.2% y/y. That’s less of a decline than the already tiny drop (from 8.3% to 8.1%) markets and analysts were hoping for. Core inflation accelerated more than expected. Monthly dynamics showed the same sharp increase as in August (0.6%), bringing the yearly figure higher from 6.3% to 6.6% (6.5% expected). Among the rare decliners last month were energy (-2.1% m/m) and used cars & trucks (-1.1%). Shelter (+0.7%), food (+0.8%) and airline fares and medical care (both 0.8%) were the main contributors.
US: Another Upside Surprise from the CPI Report in September, Keeping Pressure on the Fed
Consumer price inflation registered +0.4% month-on-month (m/m) in September, following August's 0.1% increase. On a year-over-year (y/y) basis, headline inflation edged down by 0.1 percentage points (pp) from August (8.3%), slowing to 8.2%.
Energy prices fell by 2.1% m/m, as gasoline prices pulled back 4.9% m/m. Unfortunately, the decline in gasoline was partially offset by rising electricity and natural gas prices. Food prices rose 0.8% m/m (the same as in August), and are up 11.2% y/y.
Core inflation (excludes volatile items such as food & energy) was 0.6% m/m – equal to August's gain. Relative to last September, core prices are up 6.6% – 0.3 pp higher than last month.
Price growth across core services (+0.8% m/m) accelerated from last month's gain of 0.6% m/m. Shelter costs (+0.7% m/m) were again a meaningful contributor, with rent of primary residence and owner's equivalent rent both rising 0.8% m/m. Other categories including medical (1.0% m/m), transportation (1.9% m/m) and recreation (0.2% m/m) were also higher on the month. Price growth in education and communication services was unchanged (0.2% m/m) in August.
In a piece of good news, core goods prices (0.0% m/m) decelerated in September and resumed their downward year-over-year trajectory. Slowing price growth was seen across all categories as household furnishings (+0.6% m/m), apparel (-0.3% m/m), recreational (0.0% m/m), and transportation (-0.2% m/m) goods all decelerated. Price declines in transportation were led by a 1.1% m/m decline in used vehicle prices as new vehicle prices rose 0.7% m/m.
Key Implications
Ouch! Another month and another disappointing CPI report. Both the headline and core figures surprised to the upside and show that August's report was not a one-off. Looking forward, shelter costs will continue to underpin strong services inflation. So, despite multi-decade high mortgage rates and cracks emerging in the housing market, inertia in rents and homeownership costs will take time to moderate and be reflected in the CPI data. The good news is that the downward trajectory in core goods prices has resumed as price gains slowed to 6.6% in September from 7.1% in August.
Persistently strong core price inflation in September is going to keep the pressure on the Fed to keep the rate hikes coming. We continue to expect that the official policy rate will rise to 4.5% by early next year.
EUR/GBP Mid-Day Outlook
Daily Pivots: (S1) 0.8693; (P) 0.8780; (R1) 0.8831; More...
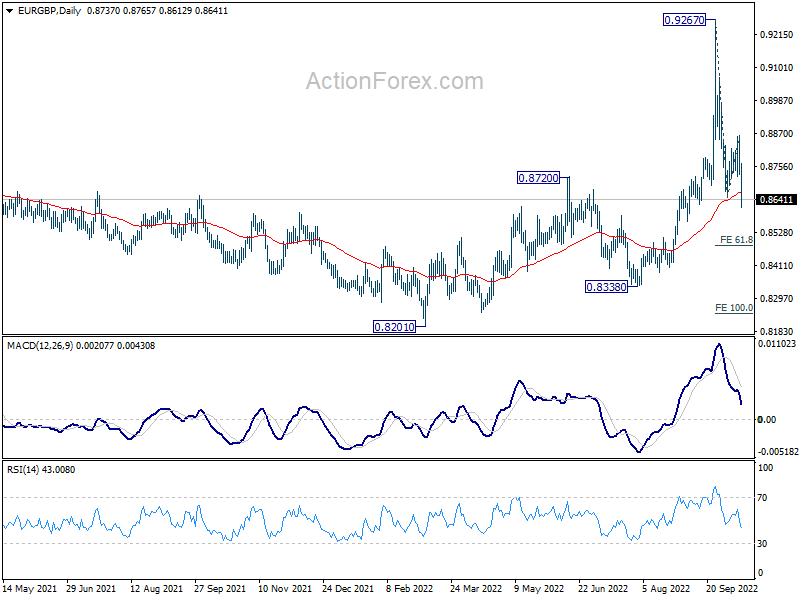
EUR/GBP's decline from 0.9267 resumed by breaking 0.8647 support. Intraday bias is back on the downside for 61.8% projection of 0.9267 to 0.8647 from 0.8869 at 0.8486. Such decline is seen as part of a long term range pattern. Deeper fall is now in favor as long as 0.8869 holds, in case of recovery.
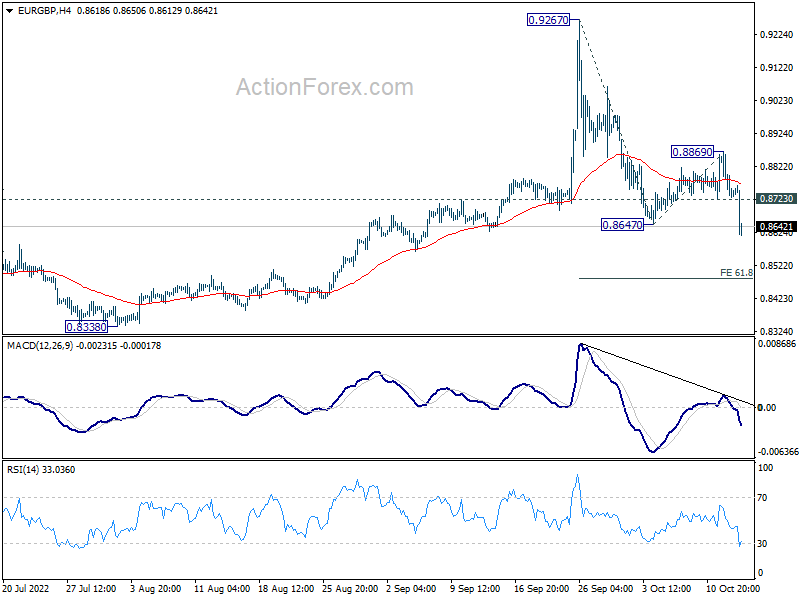
In the bigger picture, as long as 0.8720 resistance turned support holds, rise from 0.8201 is seen as resuming larger up trend from 0.6935 (2015 low). Break of 0.9499 (2020 high) should be seen at a later stage. However, firm break of 0.8720 will argue that sideway pattern from 0.9499 is extending with another falling leg instead.
EUR/AUD Mid-Day Outlook
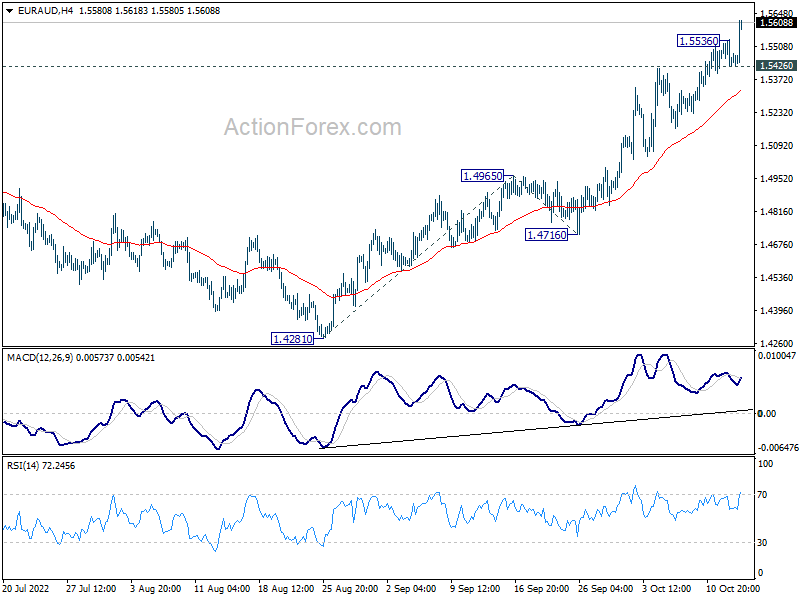
Daily Pivots: (S1) 1.5415; (P) 1.5477; (R1) 1.5526; More...
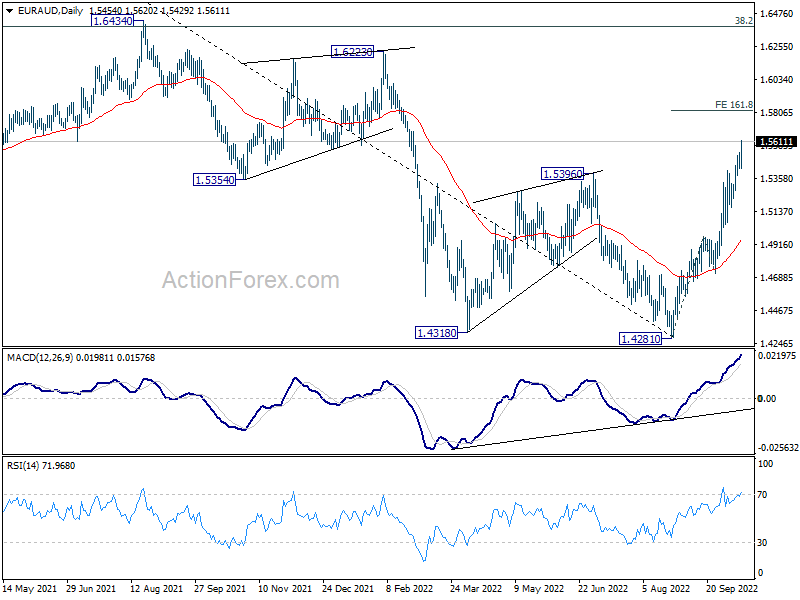
EUR/AUD's rally resumed after brief retreat and intraday bias is back on the upside. Current rally should target 161.8% projection of 1.4281 to 1.4965 from 1.4716 at 1.5823. On the downside, below 1.5426 minor support will turn intraday bias neutral and bring consolidations, before staging another rally.
In the bigger picture, a medium term bottom should be in place at 1.4281, on bullish convergence condition in daily MACD. Further rise would be seen back to 1.6434 key resistance next. Break of 1.4965 resistance turned support is needed to indicate reversal. Otherwise, further rally will remain in favor.
EUR/USD Mid-Day Outlook
Daily Pivots: (S1) 0.9669; (P) 0.9702; (R1) 0.9735; More...
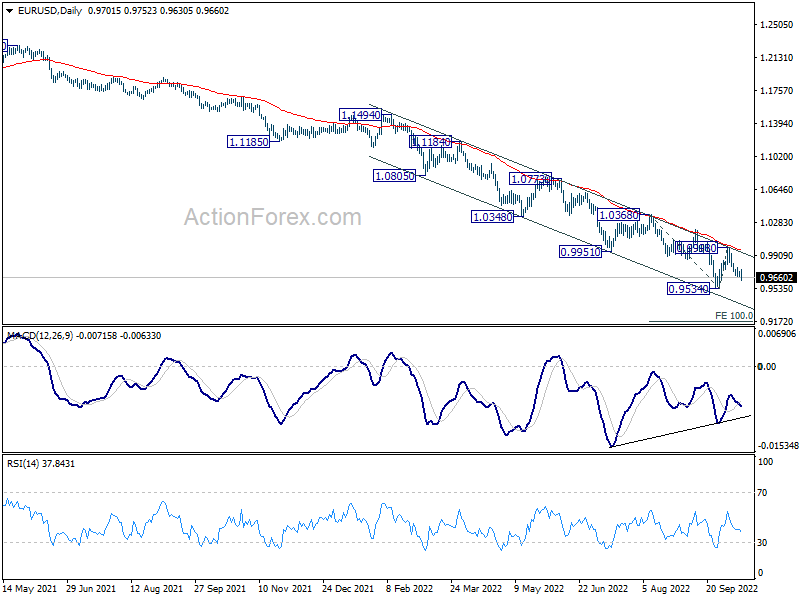
Intraday bias in EUR/USD remains on the downside for retesting 0.9534 low. Firm break there will resume larger down trend for 100% projection of 1.0368 to 0.9534 from 0.9998 at 0.9163. On the upside, above 0.9773 minor resistance will turn intraday bias neutral first.
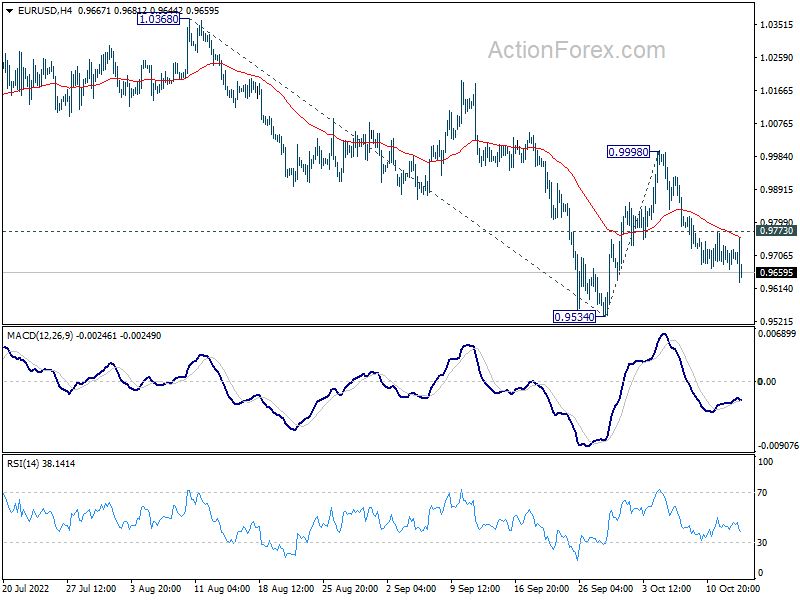
In the bigger picture, down trend from 1.6039 (2008 high) is still in progress. Next target is 100% projection of 1.3993 to 1.0339 from 1.2348 at 0.8694. In any case, break of 0.9998 resistance is needed to be the first sign of medium term bottoming. Otherwise, outlook will stay bearish even with strong rebound.