Sample Category Title
GBPUSD Gives Up Some Ground ahead of UK PM’s Press Conference
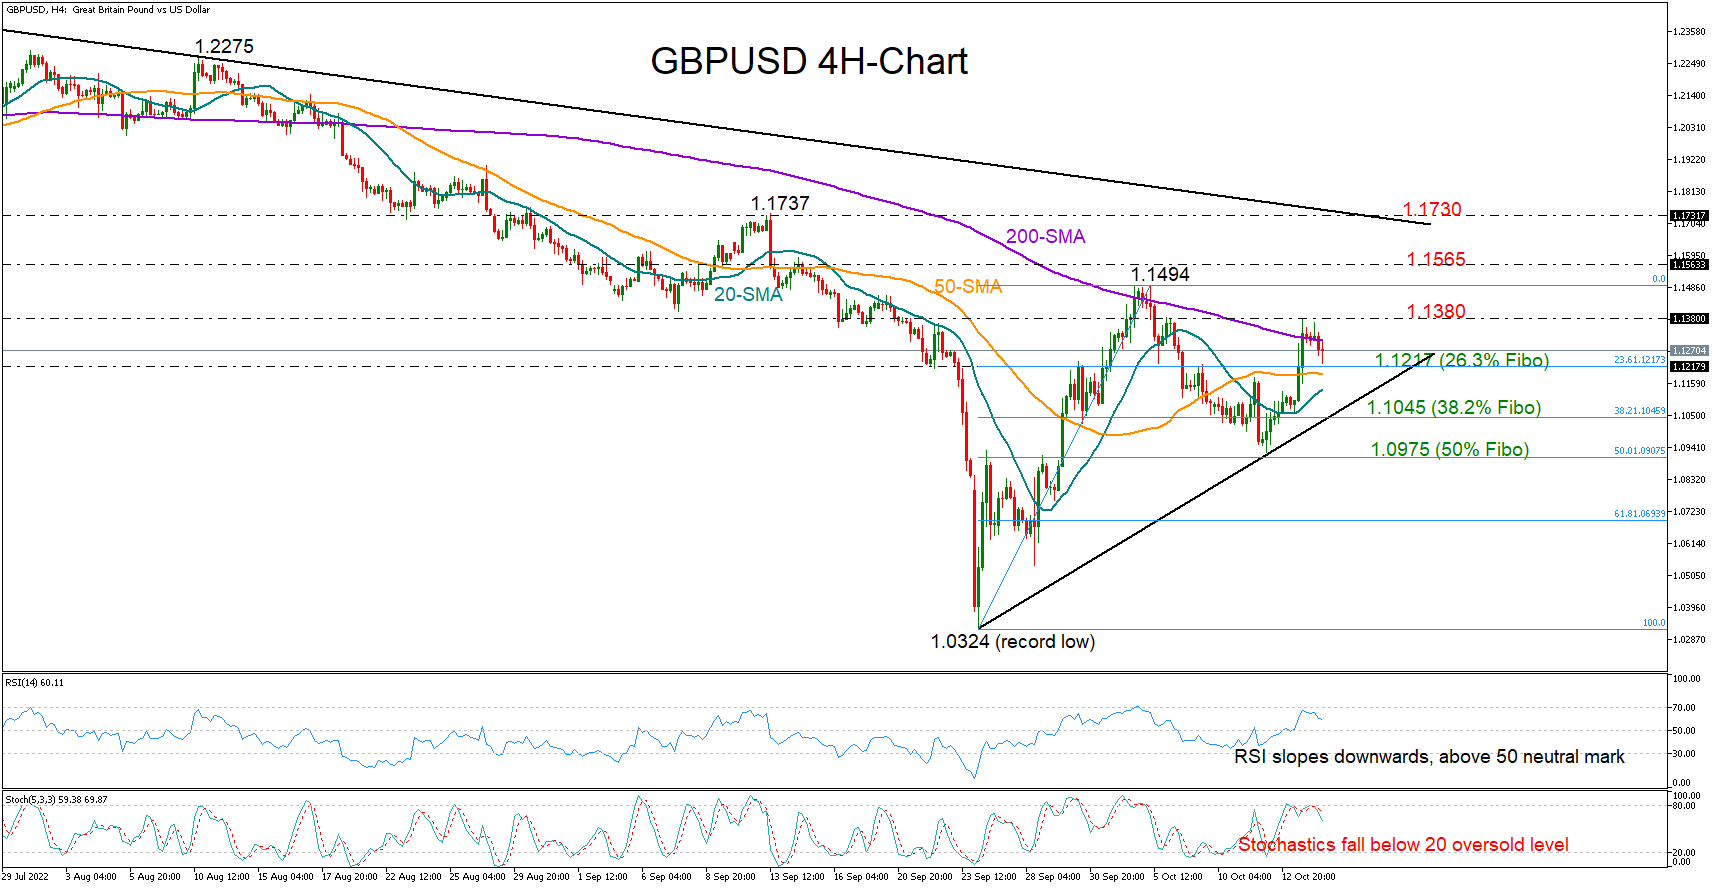
GBPUSD shifted to the sidelines after Thursday’s quick advance halted marginally near the 200-period simple moving average (SMA) at 1.1300 as it did earlier this month.
The stochastics have exited the overbought territory, while the RSI, although above 50, has a negative slope, both reflecting a weakening market sentiment as investors await more details on a potential budget U-turn by the UK prime minister.
Sellers, however, may not take charge unless the price slips below the 23.6% Fibonacci retracement of the 1.0324 – 1.1494 upleg at 1.1217. If that happens, the pair may next visit the 38.2% Fibonacci of 1.1045, which is currently intersecting the tentative ascending trendline drawn from the record low of 1.0324. Snapping that border, it will then head for the 50% Fibonacci of 1.0975.
In case downside pressures fade immediately, the price may push for a close above the 1.1300–1.1380 resistance region. If it succeeds, the door will open for October’s peak of 1.1494. Though only a decisive extension above the 1.1565 barrier would bring the long-term tentative descending trendline from March 2022 under examination at 1.1730.
Summarizing, GBPUSD seems to be struggling to sustain buying momentum despite its latest upturn. Nevertheless, a bounce off the 1.1217 level could provide another opportunity for the pair to recoup some lost ground.
US Dollar Index: Dollar Takes a Breather But Remains Robust as Fed Stays on Aggressive Path
The dollar index edged higher in European trading on Friday, regaining traction after Thursday’s 0.7% drop.
Unexpected drop was sparked by revived risk appetite, despite the latest report showed US inflation rose above expectations in September that adds to expectations for another aggressive action from Fed in the next policy meeting.
Markets widely expect another 0.75% hike, which will be the fourth in a row, with conditions of persisting red-hot inflation, keeping in play the bets for possible 1% rate hike, although the expectations for such action are so far only at 10%.
From the fundamental side, the overall situation remains very supportive for the dollar, as increased safe-haven flows on global political and economic uncertainty continue to inflate the currency.
In addition, revised view for the US monetary policy signals that the Fed is likely to increase the size and pace of tightening and that interest rate would top at 5% by March 2023, overshooting the latest forecasts.
The cocktail of positive factors leaves a little space for a deeper correction, although some price adjustments can not be ruled out.
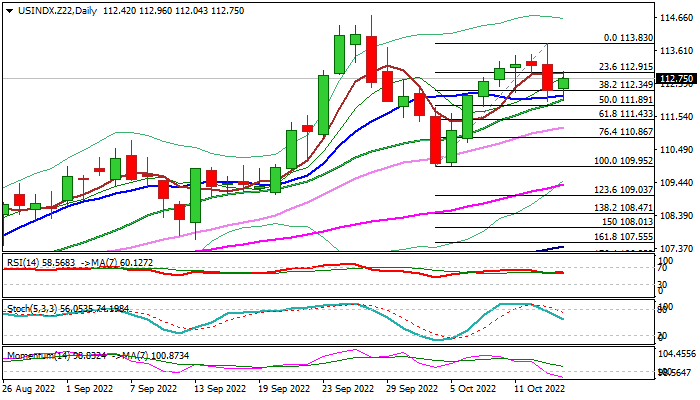
The picture on daily chart is mixed as 14-d momentum is in negative territory and heading south, but moving averages are in full bullish setup.
Immediate supports lay at 112.34/19 (Fibo 38.2% of 109.95/113.83 upleg/10DMA) and so far keep the downside protected.
Break here would risk test of next pivot at 111.89 (50% retracement, reinforced by daily Tenkan-sen), loss of which would weaken near-term structure and allow for deeper pullback towards 111.43/18 (Fibo 61.8%/daily Kijun-sen).
Conversely, weekly close above 10 DMA would keep in play hopes for renewed attack at Thursday’s post-CPI data peak (113.83) and unmask key barrier at 114.72 (20-year high posted on Sep 28) on break.
Res: 112.96; 113.83; 114.42; 114.72.
Sup: 112.34; 112.19; 111.89; 111.43.
Oil Price Moved into a Short-Term Positive Zone above $87.50
Crude oil price started a fresh increase after it formed a base above the $84.50 level against the US Dollar. The price broke the $85 resistance zone to move into a short-term positive zone.
The price gained pace for a move above the $87 level and the 50 hourly simple moving average. There was a break above a major bearish trend line with resistance near $86.50 on the hourly chart. It is now consolidating gains above the $87.50 level.
However, the price is struggling to gain pace above the $88.50 resistance. The next key resistance is near the $90.00 level, above which the price might rise steadily towards the $92 resistance level.
If not, the price might decline towards the $86.50 support. If there is a downside break below $86.50, the price might accelerate lower to $85.00 on FXOpen. Any more losses might call for a test of $82.00.
USD/JPY Creeping Higher
USD/JPY continues to move edge higher and is up 1.6% this week. In the European session, USD/JPY is trading at 147.67, up 0.25%.
The Japanese yen is once again on a downswing, after hugging the key 145 line. The dramatic intervention by Japan’s Ministry of Finance (MoF) in September stemmed the yen’s bleeding, but this move by Tokyo appears to have had a very short shelf-life, as the yen fall to new 24-year lows.
Intervention anyone?
The burning question is with the yen currently lower than when the MOF stepped in, will it again intervene to prop up the Japanese currency? The first intervention clearly didn’t achieve its desired effect of stabilizing the yen below 145 and Japan’s foreign reserves fell by a record amount in September, around 2.8 trillion yen. The game of cat-and-mouse between the MOF and speculators betting against the yen continues, and another currency intervention could be in the works, but it would likely have to be much larger than the first intervention.
The MOF could try to send a stronger warning to the markets, but it’s questionable whether unilateral action by Japan will be enough to change the yen’s downtrend. The Bank of Japan has no intention of capping JGB yields and with the Fed likely to deliver another oversize rate hike in November, the US/Japan rate differential will continue to widen and likely weigh on the Japanese yen.
The US posted another hot inflation report for September. Headline inflation ticked lower to 8.2%, down from 8.3% but above the consensus of 8.1%. Core inflation rose to 6.6%, up from 6.3% and higher than the forecast of 6.5%. Inflation clearly is yet to peak despite monetary policy becoming restrictive, and the inflation data cements expectations for a 75 basis point hike at the November meeting.
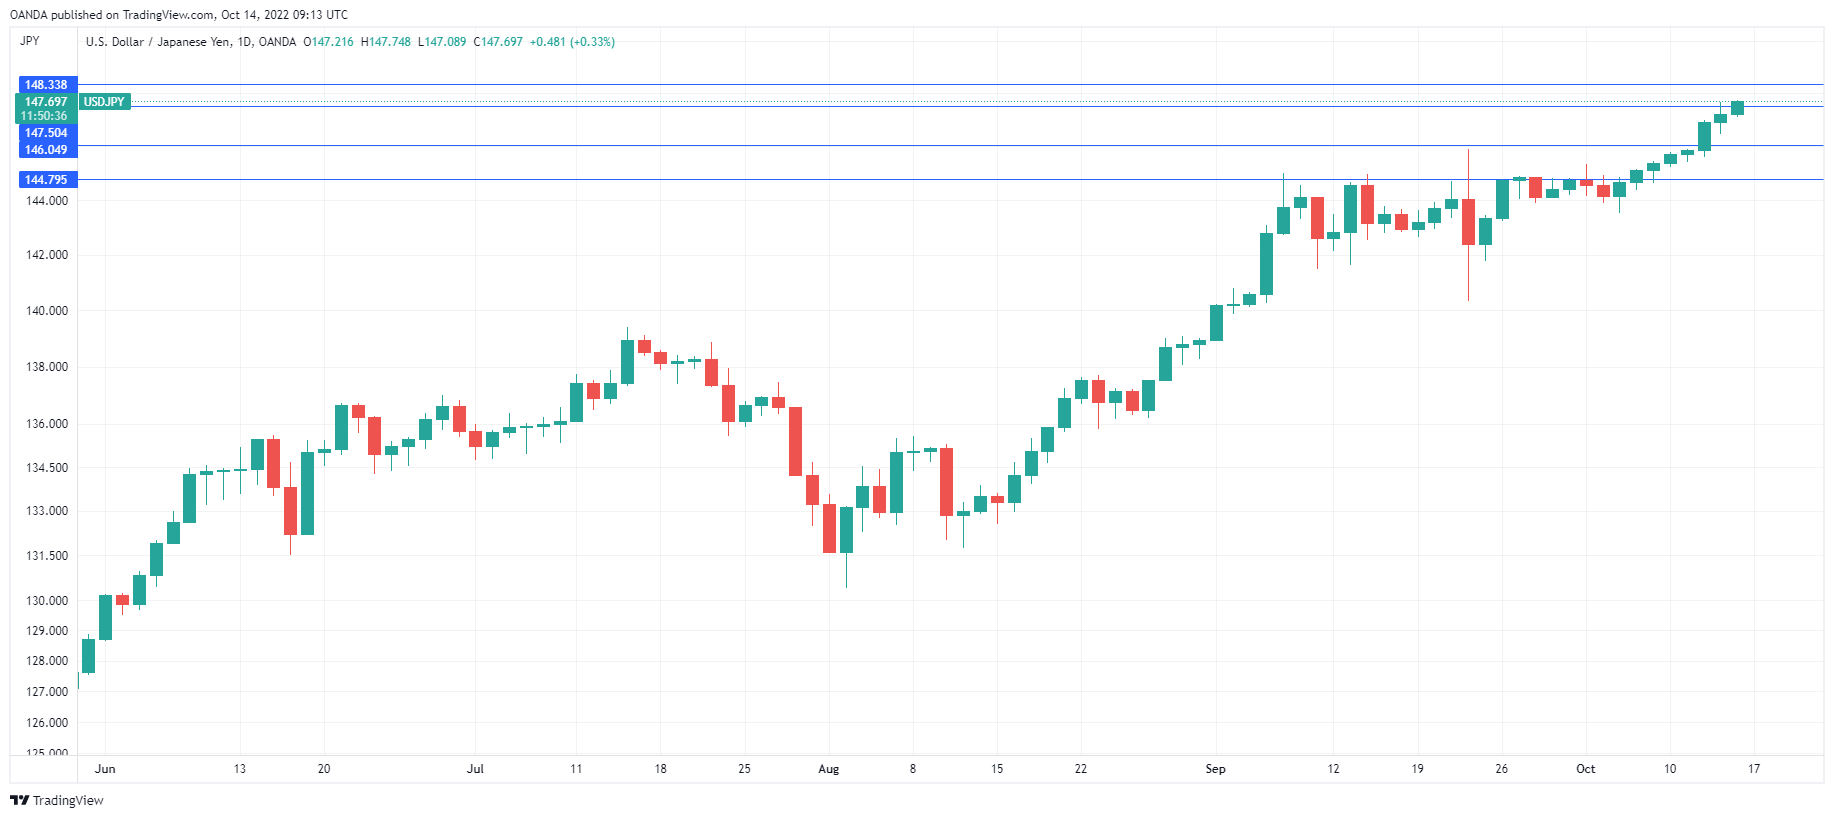
USD/JPY Technical
- USD/JPY is testing resistance at 147.50. Above, there is resistance at 148.32
- There is support at 147.50 and 146.04
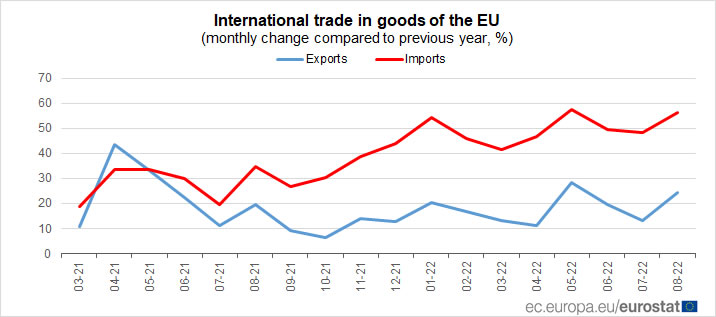
Eurozone exports rose 24.0% yoy in Aug, imports rose 53.6% yoy
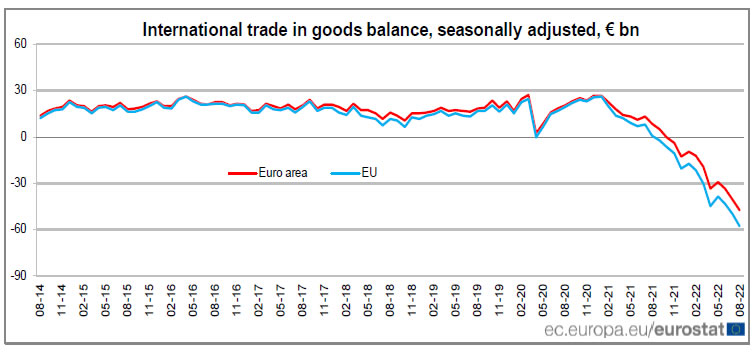
Eurozone exports of goods rose 24.0% yoy to EUR 231.1B in August. Imports rose 53.6% yoy to EUR 282.1B. Trade deficit came in at EUR -50.9B. Intra-Eurozone trade rose 34.8% yoy to EUR 210.5B.
In seasonally adjusted term, exports rose 3.5% mom to EUR 245.5B. Imports rose 5.5% mom to EUR 292.8B. Trade deficit widened from EUR -40.5B to EUR -47.3B, much larger than expectation of EUR -40.0B. Intra-Eurozone trade rose from EUR 230.9B to EUR 239.2B.
USDCAD Retraces after Hitting Fresh 29-Month High
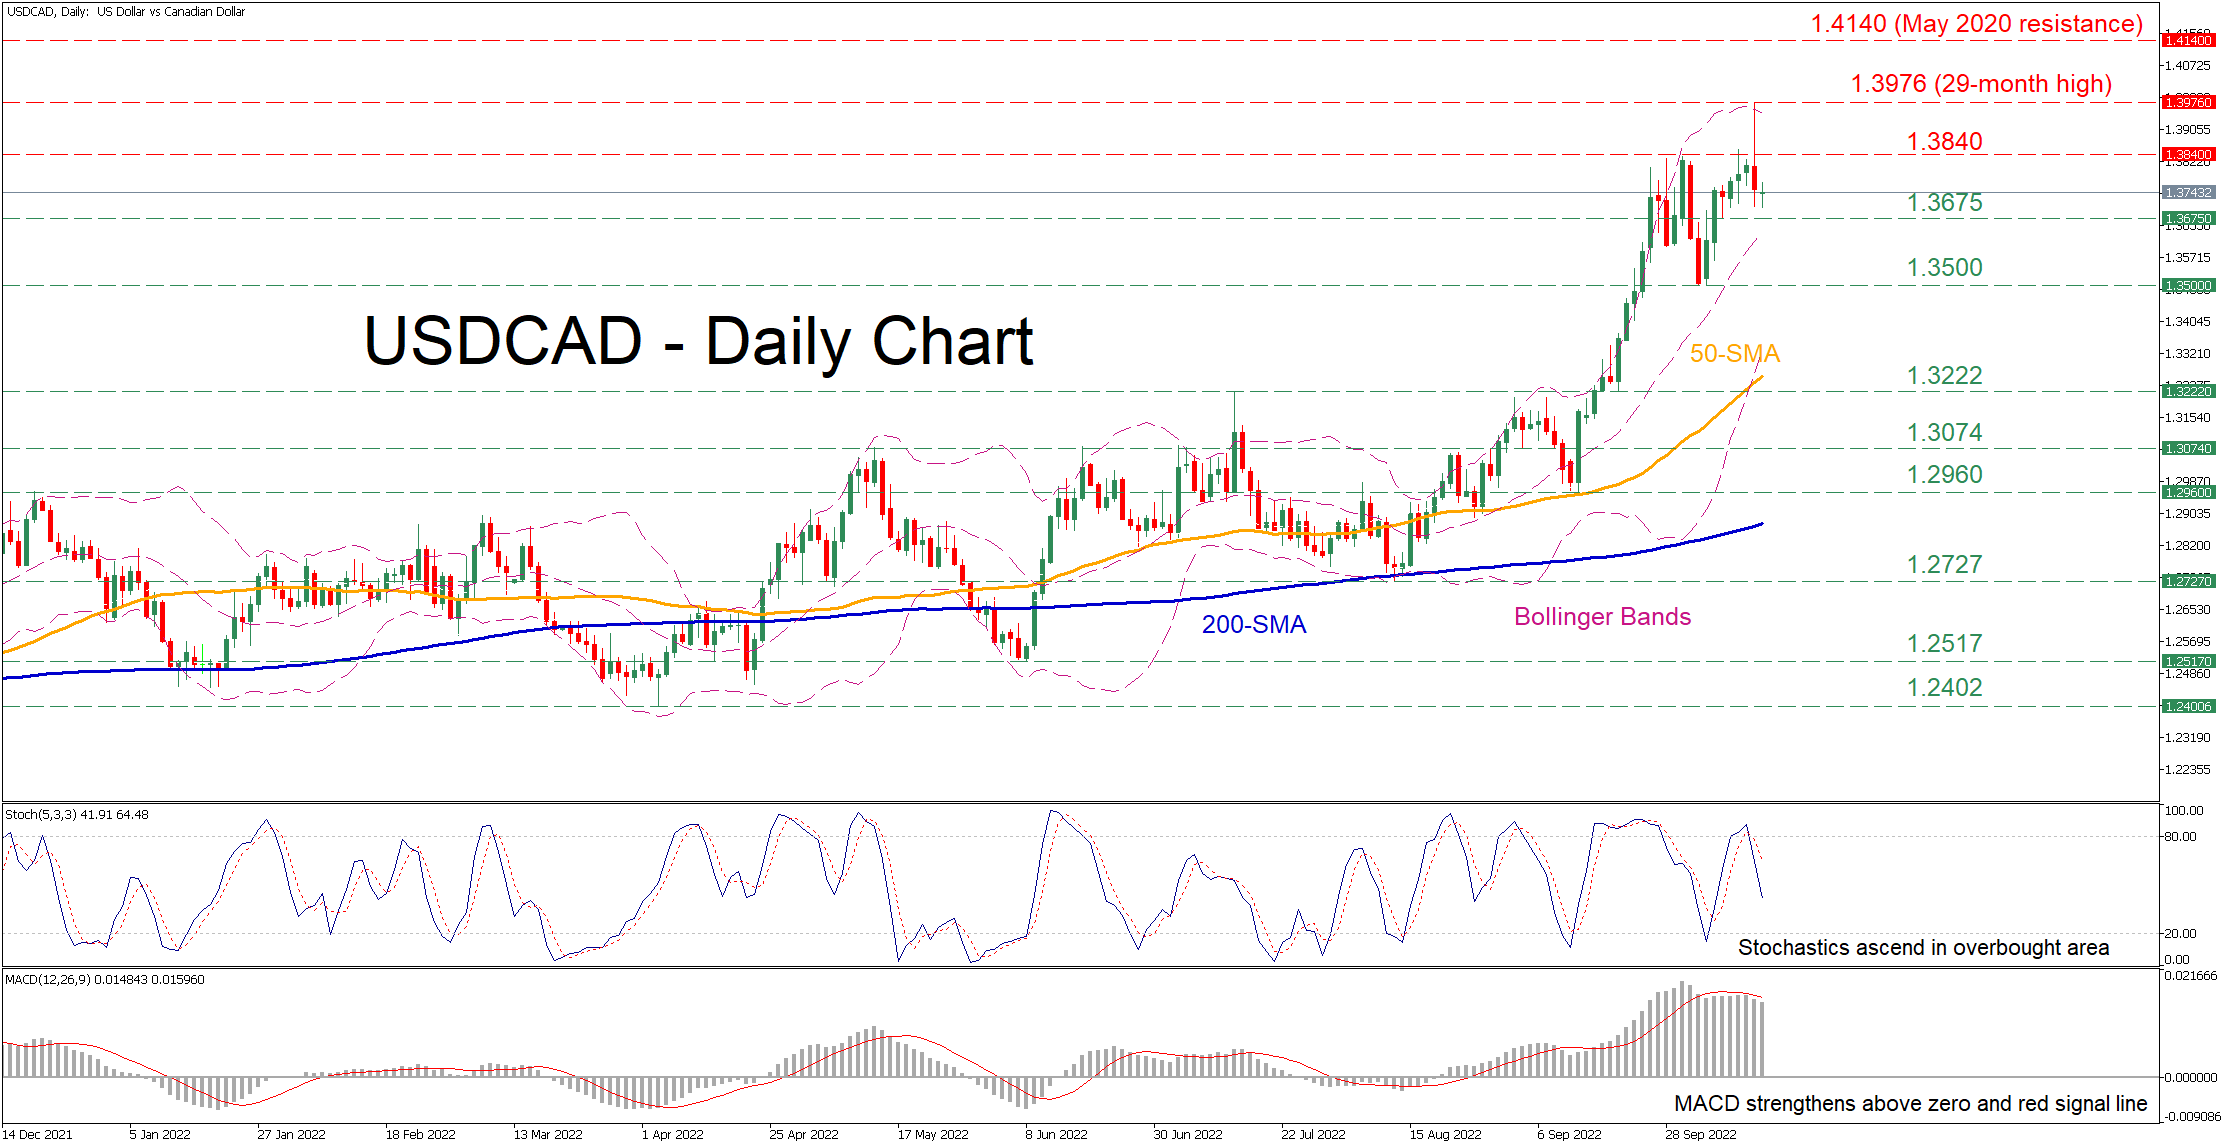
USDCAD has been in a steep uptrend since mid-September when the price managed to forcefully cross above the 1.3222 region. Although the pair spiked higher to a fresh 29-month high in the previous daily session, it quickly corrected lower and closed the day with losses, hinting that the rally could be overstretched.
The momentum indicators currently suggest that bullish forces are waning. Specifically, the stochastic oscillator is sloping downwards after posting a bearish cross, while the MACD histogram has retreated beneath its red signal line but remains in the positive territory.
Should the negative momentum strengthen, the pair could extend its recent retreat and encounter initial resistance at the 1.3675 region. Sliding beneath that floor, the bulls might aim for the recent low of 1.3500 before the attention shifts to the July peak of 1.3222. Even lower, the 1.3074 barrier could prove to be a tough one for the price to overcome.
Alternatively, if buyers re-emerge and push the price higher, the 1.3840 hurdle may act as the first line of defence. Crossing above the latter, the 29-month high of 1.3876 could provide further upside protection. Should that barricade fail, the price could ascend to form multi-year peaks, where the May 2020 resistance of 1.4140 may curb any advances.
Overall, even though bullish pressures appear to be subsiding, USDCAD’s steep uptrend remains intact. Nevertheless, a dive beneath the 1.3500 floor could be the starting point of a moderate downside correction.
GBP/JPY Daily Outlook
Daily Pivots: (S1) 163.67; (P) 165.48; (R1) 168.63; More...
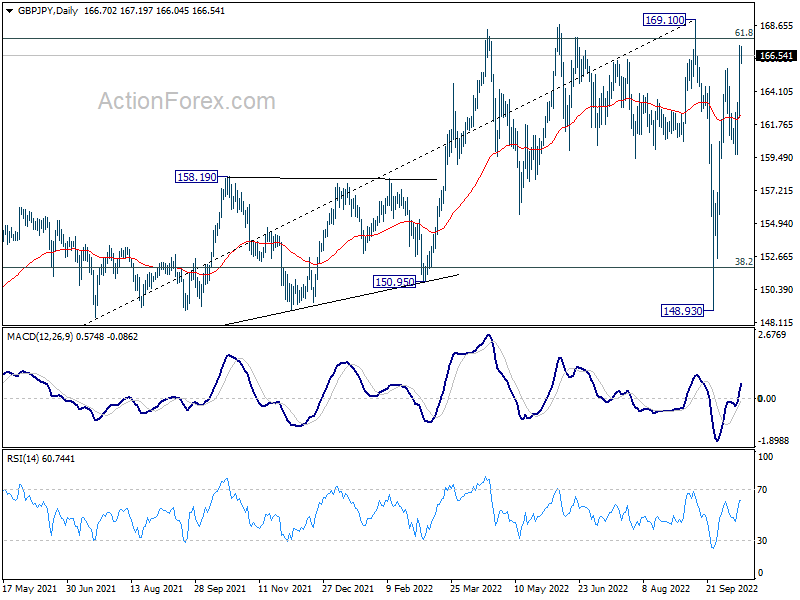
GBP/JPY's rise from 148.93 resumed by breaking through 165.69 resistance. Intraday bias is back on the upside for 169.10 high. Decisive break there will confirm larger up trend resumption. For now, further rally will remain in favor as long as 159.71 support holds, in case of retreat.
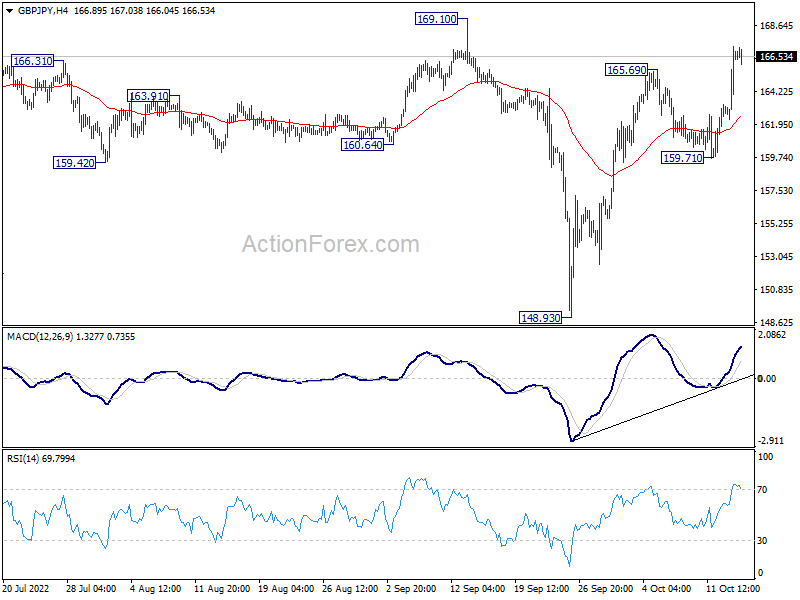
In the bigger picture, strong support from 38.2% retracement of 123.94 to 169.10 at 151.84 suggests that price actions from 169.10 are developing into a corrective pattern only. That is, rise from 123.94 (2020 low) should resume at a later stage. This will now remain the favored case as long as 148.93 support holds.
EUR/JPY Daily Outlook
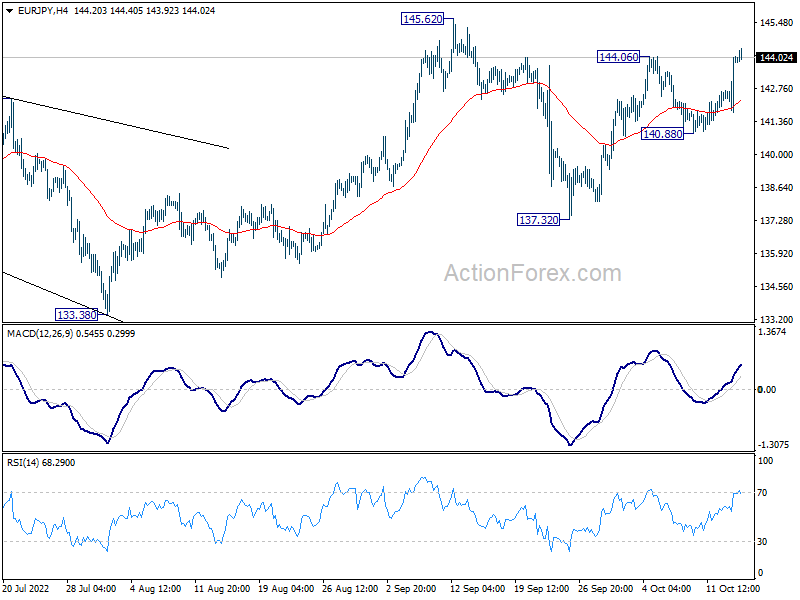
Daily Pivots: (S1) 142.44; (P) 143.26; (R1) 144.77; More....
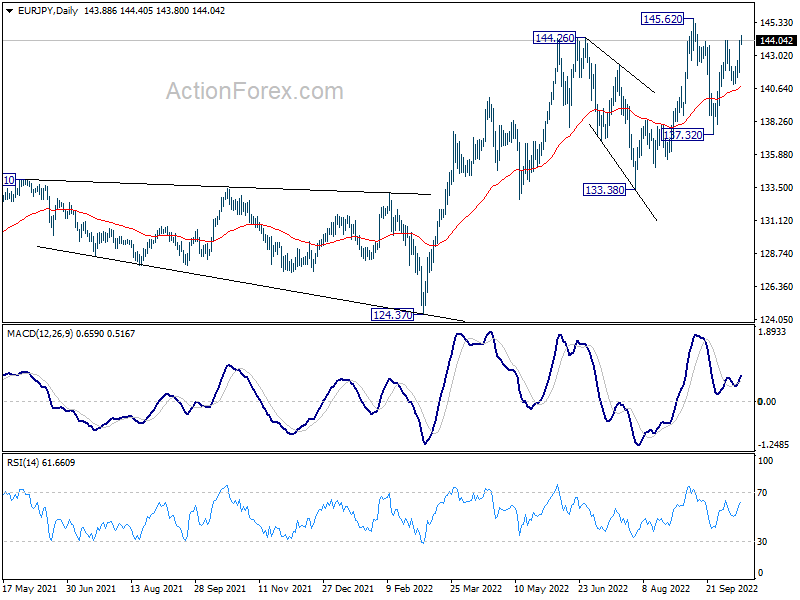
EUR/JPY's rebound from 132.32 resumed by breaking 144.06 resistance. Intraday bias is back on the upside for retesting 145.62 high. Decisive break there will resume larger up trend. For now, further rally will remain in favor as long as 140.88 support intact, in case of retreat.
In the bigger picture, as long as 133.38 support holds, the up trend from 114.42 (2020 low) could still extend through 145.62 high. In that case, next target is 149.76 (2015 high). However, sustained break of 133.38 will be a sign of medium term bearish reversal and bring deeper fall to 124.37 support first.
EUR/GBP Daily Outlook
Daily Pivots: (S1) 0.8570; (P) 0.8668; (R1) 0.8728; More...
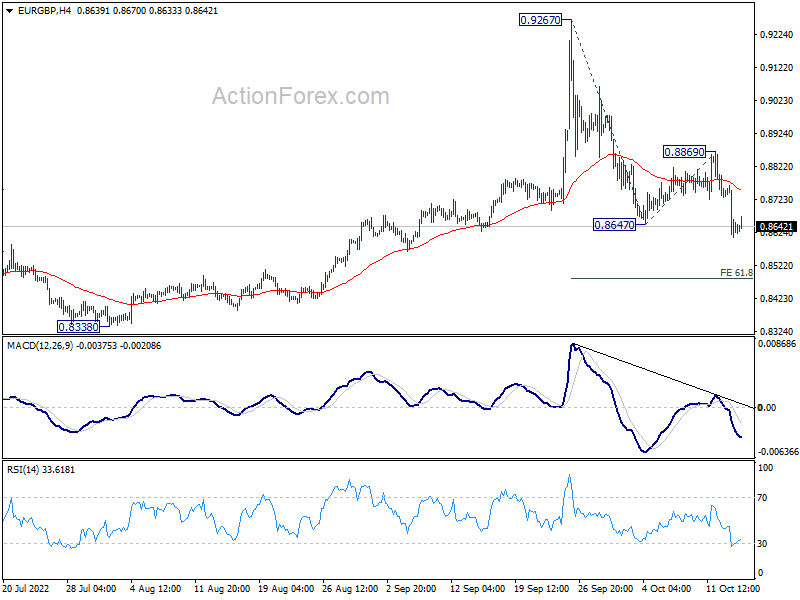
Intraday bias in EUR/GBP remains on the downside for the moment. Current fall from 0.9267 should target 61.8% projection of 0.9267 to 0.8647 from 0.8869 at 0.8486. Such decline is seen as part of a long term range pattern. Deeper fall is now in favor as long as 0.8869 holds, in case of recovery.
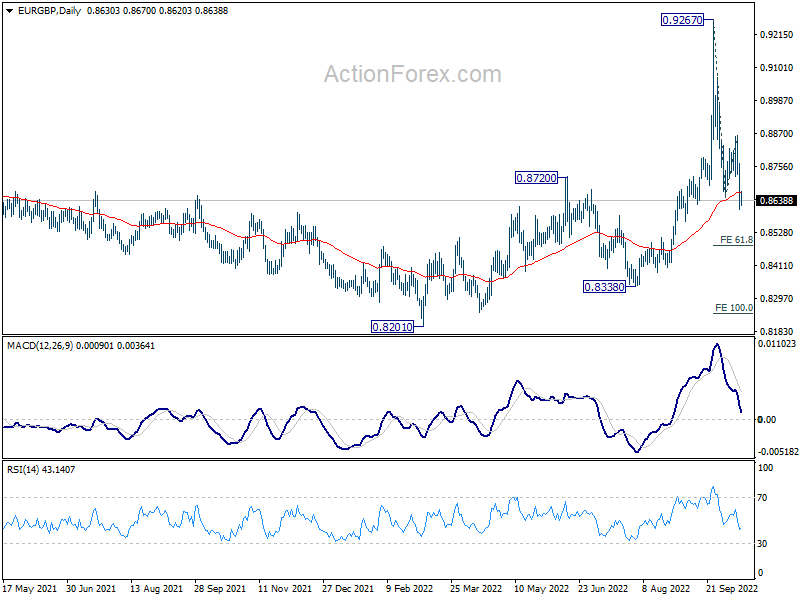
In the bigger picture, as long as 0.8720 resistance turned support holds, rise from 0.8201 is seen as resuming larger up trend from 0.6935 (2015 low). Break of 0.9499 (2020 high) should be seen at a later stage. However, firm break of 0.8720 will argue that sideway pattern from 0.9499 is extending with another falling leg instead.
EUR/AUD Daily Outlook
Daily Pivots: (S1) 1.5415; (P) 1.5477; (R1) 1.5526; More...
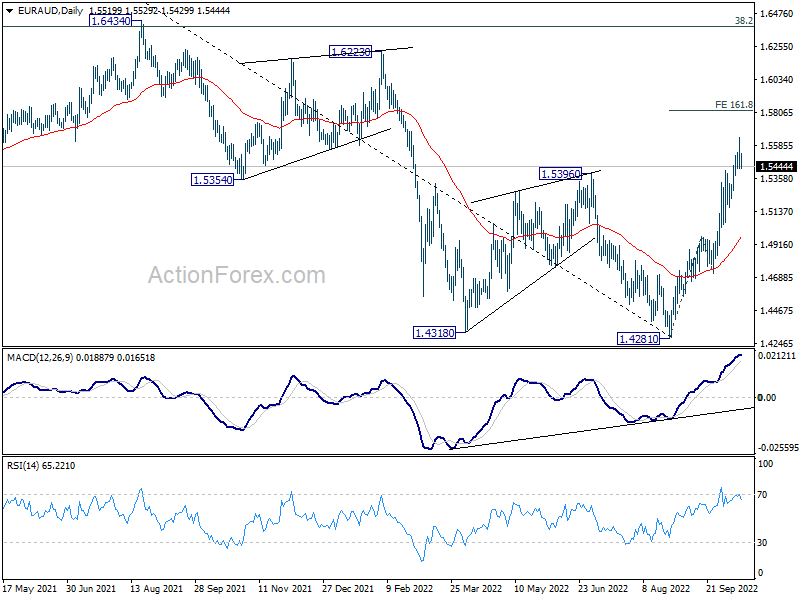
EUR/AUD retreated again after hitting 1.5638 and intraday bias is turned neutral. For now, further rally will remain in favor as long as 4 hour 55 EMA (now at 1.5347) holds. Above 1.5638 will target 161.8% projection of 1.4281 to 1.4965 from 1.4716 at 1.5823. Nevertheless, firm break of 4 hour 55 EMA will confirm short term topping and bring deeper pull back.

In the bigger picture, a medium term bottom should be in place at 1.4281, on bullish convergence condition in daily MACD. Further rise would be seen back to 1.6434 key resistance next. Break of 1.4965 resistance turned support is needed to indicate reversal. Otherwise, further rally will remain in favor.