

Sample Category Title
GBP/USD Daily Outlook
Daily Pivots: (S1) 1.1133; (P) 1.1257; (R1) 1.1455; More...
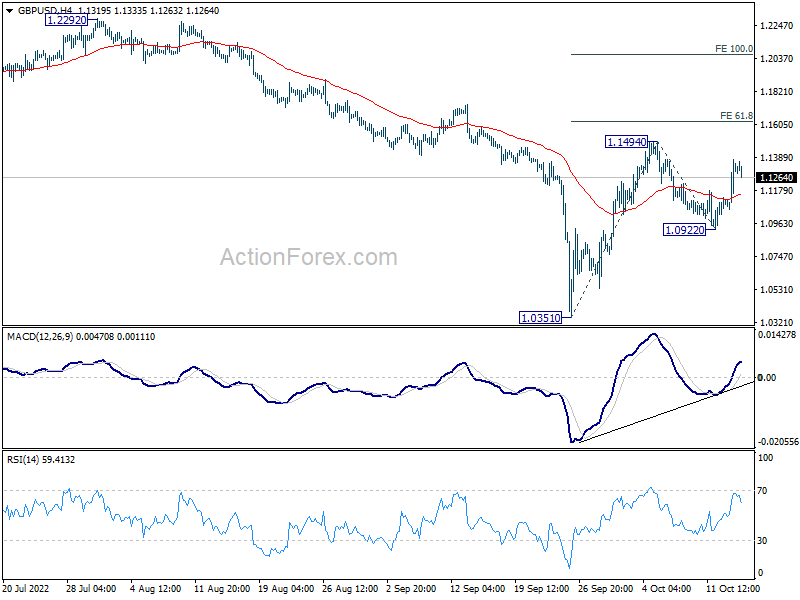
Intraday bias in GBP/USD remains on the upside for 1.1494 resistance. Firm break there will confirm resumption of whole rebound from 1.0351. Next target is 61.8% projection of 1.0351 to 1.1494 from 1.0922 at 1.1628. On the downside, below 1.0922 will turn bias back to the downside for 1.0351 low instead.
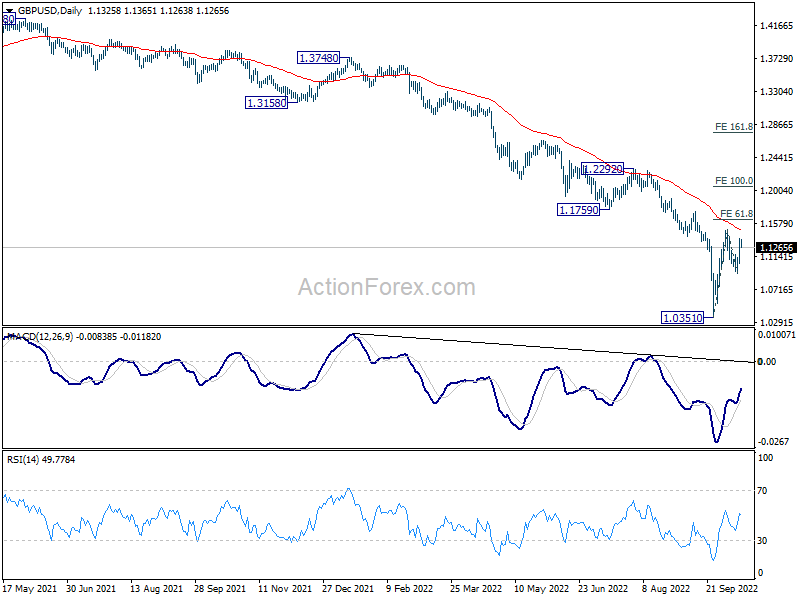
In the bigger picture, fall from 1.4248 (2018 high) is resuming long term down trend from 2.1161 (2007 high). Next target is 100% projection of 2.1161 to 1.3503 from 1.7190 at 0.9532. There is no scope of a medium term rebound as long as 1.1759 support turned resistance holds.
USD/CHF Daily Outlook
Daily Pivots: (S1) 0.9958; (P) 1.0016; (R1) 1.0072; More...
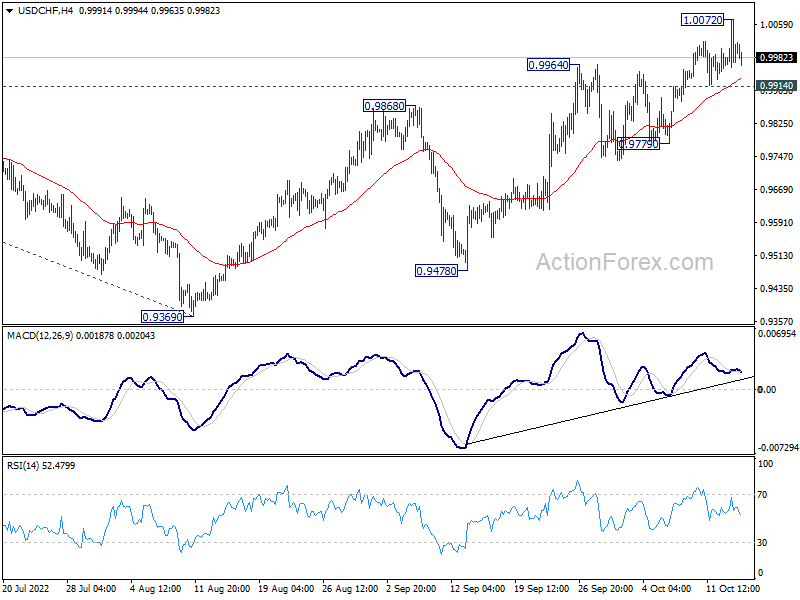
USD/CHF retreated again after hitting 1.0072 and intraday bias is turned neutral first. on the upside, break of 1.0072, and sustained trading above 1.0063, will confirm larger up trend resumption. Next target is 1.0283 projection level. However, break of 0.9914 support will indicate rejection by 1.0063, and turn bias back to the downside for 0.9779 support first.
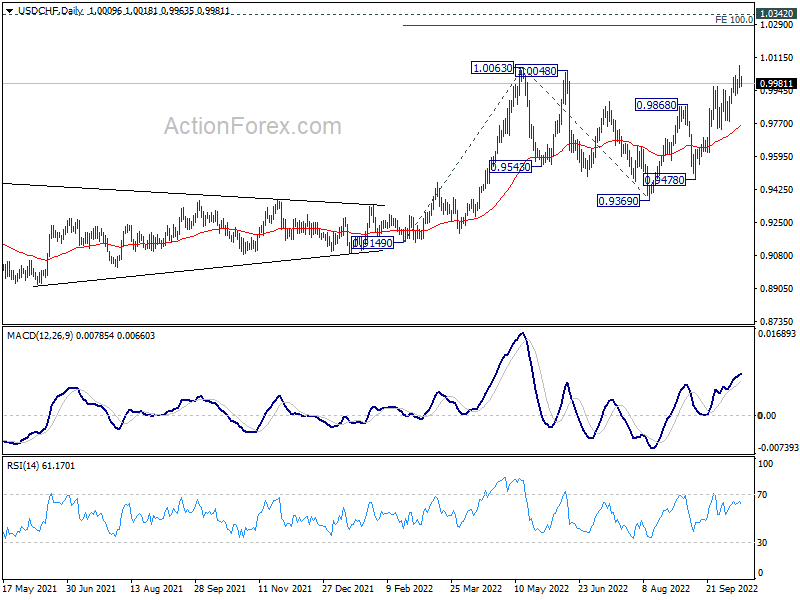
In the bigger picture, current development suggests that up trend from 0.8756 (2021 low) is still in progress. Sustained break of 1.0063 will target 100% projection of 0.9149 to 1.0063 from 0.9369 at 1.0283, and then 1.0342 (2016 high). For now, this will remain the favored case as long as 0.9369 support holds, even in case of deep pull back.
USD/JPY Daily Outlook
Daily Pivots: (S1) 146.58; (P) 147.12; (R1) 147.78; More...
Intraday bias in USD/JPY stays on the upside at this point. Firm break of 147.68 long term resistance will target 149.26 projection level, and possibly to 150 psychological level. Nevertheless, firm break of 145.89 resistance turned support should indicate rejection by 147.68, and bring deeper fall back to 140.33 support instead.

In the bigger picture, up trend from 101.18 is still in progress, as part of the whole up trend from 75.56 (2011 low). Further rise should be seen to 147.68 (1998 high), and possibly to 100% projection of 75.56 (2011 low) to 125.85 (2015 high) from 98.97 at 149.26, For now, break of 130.38 support is needed to be the first indication of medium term topping. Otherwise, outlook will stay bullish even in case of deep pull back.

USD/CAD Daily Outlook
Daily Pivots: (S1) 1.3650; (P) 1.3813; (R1) 1.3920; More...
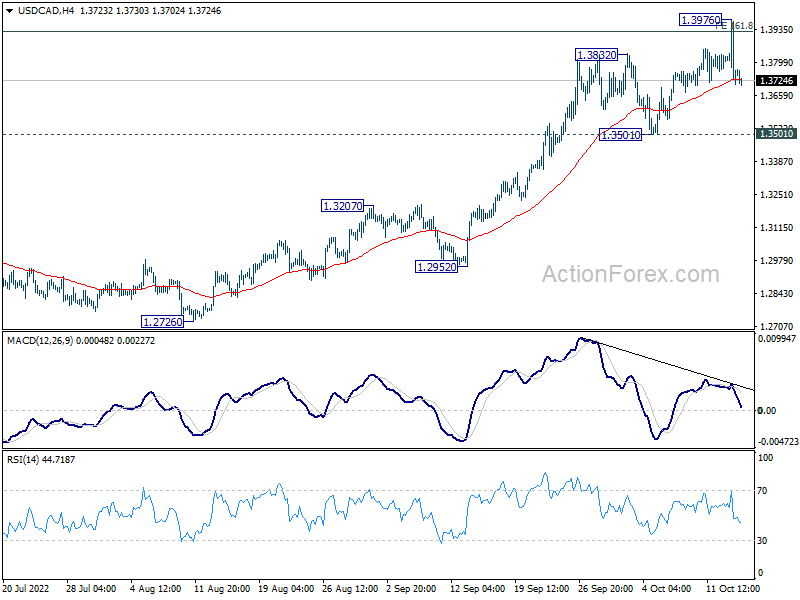
USD/CAD retreated notably after rising to 1.3976 and intraday bias is turned neutral first. Outlook will stay bullish as long as 1.3501 support holds. Firm break of 1.3976 will target 200% projection of 1.2005 to 1.2947 from 1.2401 at 1.4285. However, considering bearish divergence condition in 4 hour and daily MACD, break of 1.3501 will confirm short term topping,and bring deeper pull back to 55 day EMA (now at 1.3337).
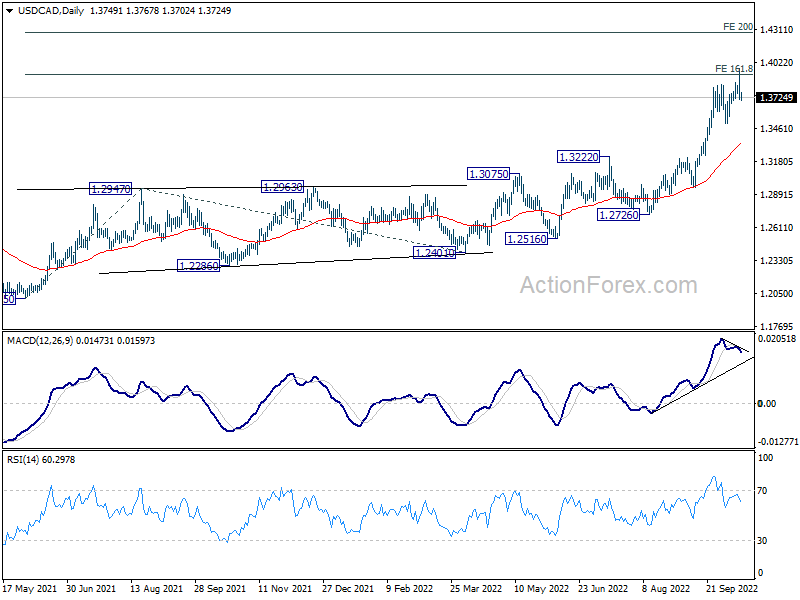
In the bigger picture, up trend from 1.2005 (2021 low) is still in progress. Based on current impulsive momentum, it could be resuming long term up trend from 0.9056 (2007 low). Whether it is or it isn't, retest of 1.4689 (2016 high) should be seen next. This will now remain the favored case as long as 1.3222 resistance turned support holds.
AUD/USD Daily Report
Daily Pivots: (S1) 0.6206; (P) 0.6261; (R1) 0.6352; More...
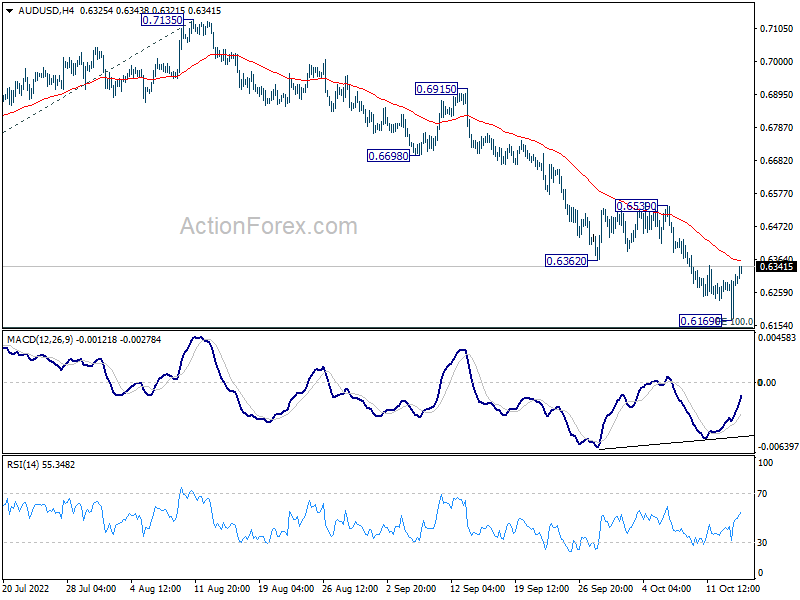
In temporary low is formed at 0.6169 in AUD/USD, just ahead of 100% projection of 0.7660 to 0.6680 from 0.7135 at 0.6155. Intraday bias is turned neutral first but outlook will stay bearish as long as 0.6539 resistance holds. Firm break of 0.6155 will target 138.2% projection at 0.5781. Nevertheless, firm break of 0.6539 will confirm short term bottoming and bring stronger rebound.
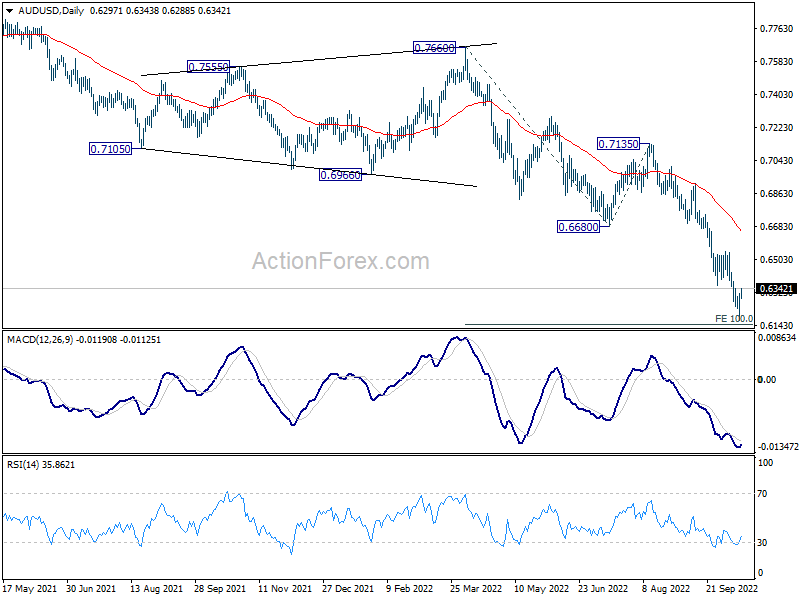
In the bigger picture, down trend form 0.8006 (2021 high) is expected to continue as long as 0.6680 support turned resistance holds. Next target is 0.5506 low. Medium term momentum will now be closely monitored to gauge the chance of break of 0.5506.
Dollar Fell as Sentiment Reversed, Yen Staying Weakest Despite Unconfirmed Sign of Intervention
Dollar's post-CPI rally faltered quickly, as risk sentiment staged a historic U-turn. For now, Sterling is the strongest one for the week on rumors that UK Prime Minister Liz Truss is going to reverse the mini-budget. New Zealand Dollar is the second strongest, followed by Euro. Yen remains the worst performer despite sign of intervention. Australian Dollar is the next worst, followed by Swiss Franc. The greenback is mixed for now, awaiting retail sales data from the US.
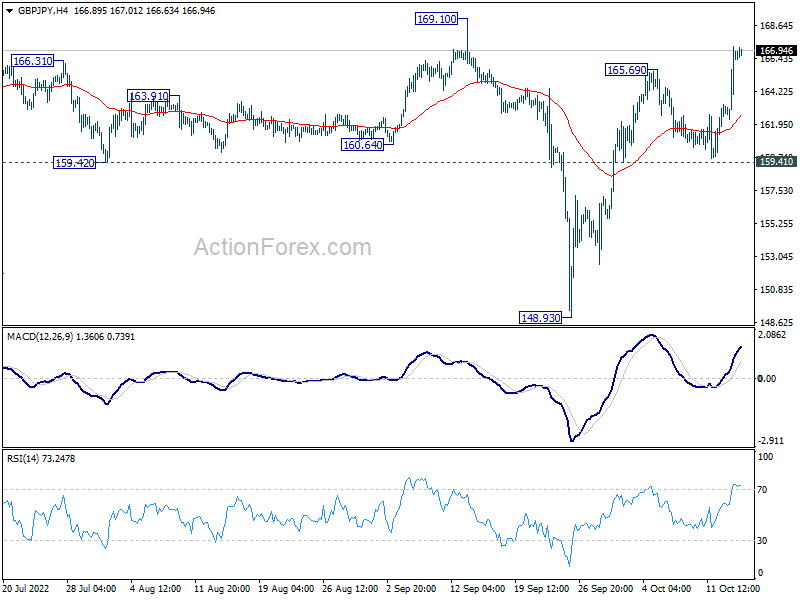
Technically, both EUR/JPY and GBP/JPY has resumed their near term rebounds from 137.32 and 148.93 respectively. Further rally would be seen towards 145.62 and 169.10 highs. But the question remains on what Japan would do with USD/JPY close to 1998 high, and the impact on other pairs. That is, if USD/JPY is knocked down again, would other Yen crosses follow, or Dollar is sold off instead?
In Asia, Nikkei closed up 3.25%. Hong Kong HSI is up 2.59%. China Shanghai SSE is up 1.93%. Singapore Strait Times is up 0.68%. Japan 10-year JGB yield is down -0.0018 at 0.249. Overnight, DOW rose 2.83%. S&P 500 rose 2.60%. NASDAQ rose 2.23%. 10-year yield rose 0.0050 to 3.952, after hitting as high as 4.080.
No reversal yet after DOW's 1500 historic U-turn
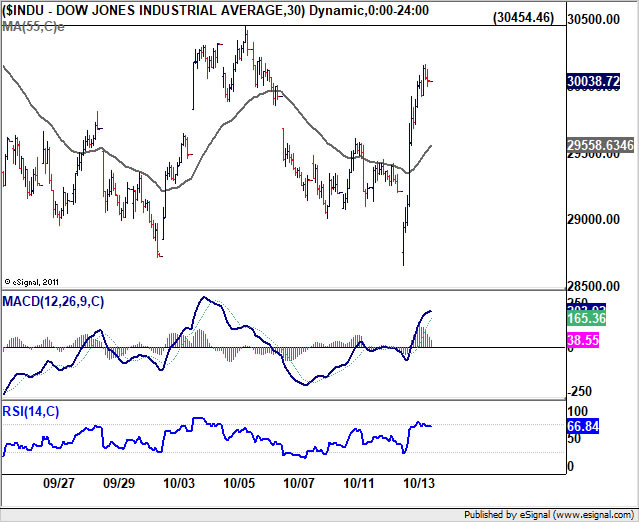
US stock staged a historic U-turn overnight, after initial post-CPI selloff. DOW had a jaw-dropping swing of more than 1500 pts, falling to as low as 28660.94, then rebounded to close at 30038.72, after hitting intraday high at 30168.54. There is no convincing explanation to the reversal. Some said investors saw the set of data as a "last gasp" for rising inflation. But after all, Fed is set to continue with aggressive tightening and there is no clear sign on where interest rate would really peak.
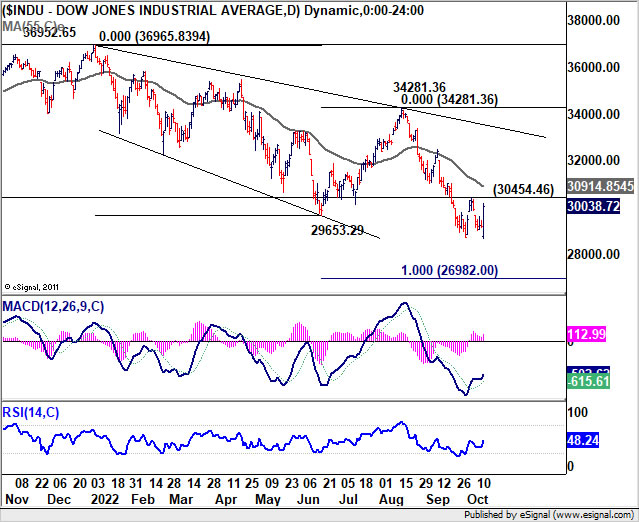
Anyways, immediate focus is now on 30454.46 resistance in DOW. Firm break there will complete a double bottom pattern, and bring stronger rebound through 55 day EMA (now at 30914.85) in the near term. Rejection by 30454.46 should set the stage for resuming the down trend through 28660.94 later in the month.
In either case, there is no clear sign of trend reversal for now, and the whole pattern from 36965.83 should still extend to 100% projection of 36965.83 to 29653.29 from 34281.36 at 26982.00 before completion.
Japan didn't confirm intervention after unusually USD/JPY volatility
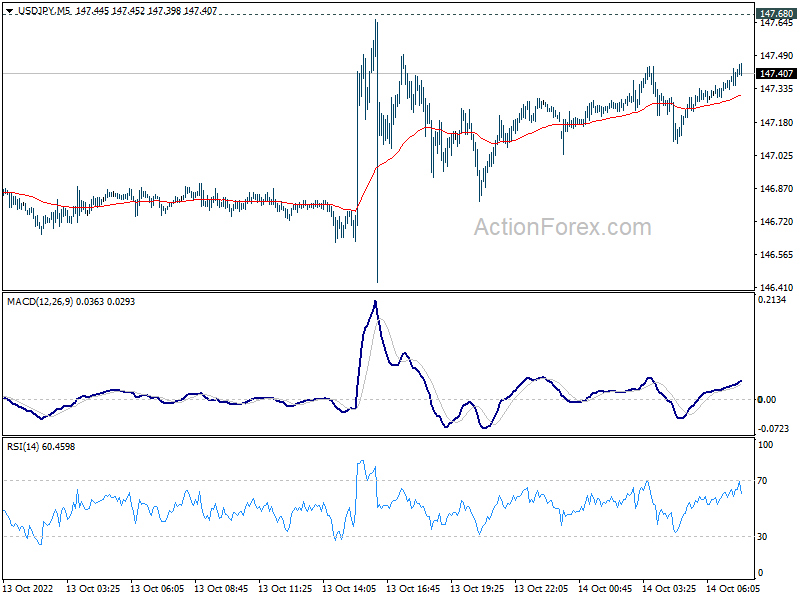
There was some unusual volatility in USD/JPY overnight at it approached 1998 high at 147.68. The pair was knocked down but there was no sustained selling. Japan Ministry of Finance declined to confirm whether that was caused by intervention.
Meanwhile, Finance Minister Shunichi Suzuki just reiterated that government's readiness to take "appropriate action" against "excessive volatility" in the markets. He said, "we cannot tolerate excessive volatility driven by speculative moves. We're watching market developments with a strong sense of urgency."
Separately, BoJ Governor Haruhiko Kuroda maintained that "raising rates now is inappropriate in light of Japan's economic, price conditions." He added that "pace of Japan's economic recovery still slow so BoJ must continue supporting economy."
NZ BNZ manufacturing dropped to 52.0, positive trend with ongoing volatility
New Zealand BusinessNZ Performance of Manufacturing Index dropped back from 54.8 to 52.0 in September, comparing to July's 53.5 and June's 50.2. Looking at some details, production dropped from 54.5 to 52.0. Employment dropped from 53.6 to 51.9. New orders tumbled sharply from 59.7 to 48.4. Finished stocks rose from 52.0 to 55.0. Deliveries edged down from 55.0 to 54.5.
BNZ Senior Economist, Doug Steel stated "the overall trend remains positive, but with ongoing volatility around it. On the positive side, the PMI's 3-month moving average has continued to edge higher this month but, not so good, the 52.0 monthly reading is now back below the PMI's longer-term norm".
Looking ahead
Eurozone will release trade balance today. But focus will be on US retail sales, while import price, U of Michigan consumer sentiment and business inventories will be featured. Canada will publish manufacturing sales and wholesale sales.
AUD/USD Daily Report
Daily Pivots: (S1) 0.6206; (P) 0.6261; (R1) 0.6352; More...
In temporary low is formed at 0.6169 in AUD/USD, just ahead of 100% projection of 0.7660 to 0.6680 from 0.7135 at 0.6155. Intraday bias is turned neutral first but outlook will stay bearish as long as 0.6539 resistance holds. Firm break of 0.6155 will target 138.2% projection at 0.5781. Nevertheless, firm break of 0.6539 will confirm short term bottoming and bring stronger rebound.
In the bigger picture, down trend form 0.8006 (2021 high) is expected to continue as long as 0.6680 support turned resistance holds. Next target is 0.5506 low. Medium term momentum will now be closely monitored to gauge the chance of break of 0.5506.
Economic Indicators Update
| GMT | Ccy | Events | Actual | Forecast | Previous | Revised |
|---|---|---|---|---|---|---|
| 21:30 | NZD | Business NZ PMI Sep | 52 | 54.9 | 54.8 | |
| 23:50 | JPY | Money Supply M2+CD Y/Y Sep | 3.30% | 3.40% | 3.40% | |
| 01:30 | CNY | CPI Y/Y Sep | 2.80% | 2.80% | 2.50% | |
| 01:30 | CNY | PPI Y/Y Sep | 0.90% | 1.10% | 2.30% | |
| 09:00 | EUR | Eurozone Trade Balance (EUR) Aug | -40.0B | -40.3B | ||
| 12:30 | CAD | Manufacturing Sales M/M Aug | -1.10% | -0.90% | ||
| 12:30 | CAD | Wholesale Sales M/M Aug | 0.10% | -0.60% | ||
| 12:30 | USD | Retail Sales M/M Sep | 0.20% | 0.30% | ||
| 12:30 | USD | Retail Sales ex Autos M/M Sep | -0.10% | -0.30% | ||
| 12:30 | USD | Import Price Index M/M Sep | -1.10% | -1.00% | ||
| 14:00 | USD | Michigan Consumer Sentiment Index Oct P | 58.8 | 58.6 | ||
| 14:00 | USD | Business Inventories Aug | 0.90% | 0.60% |
Technical Outlook and Review
USD/JPY:
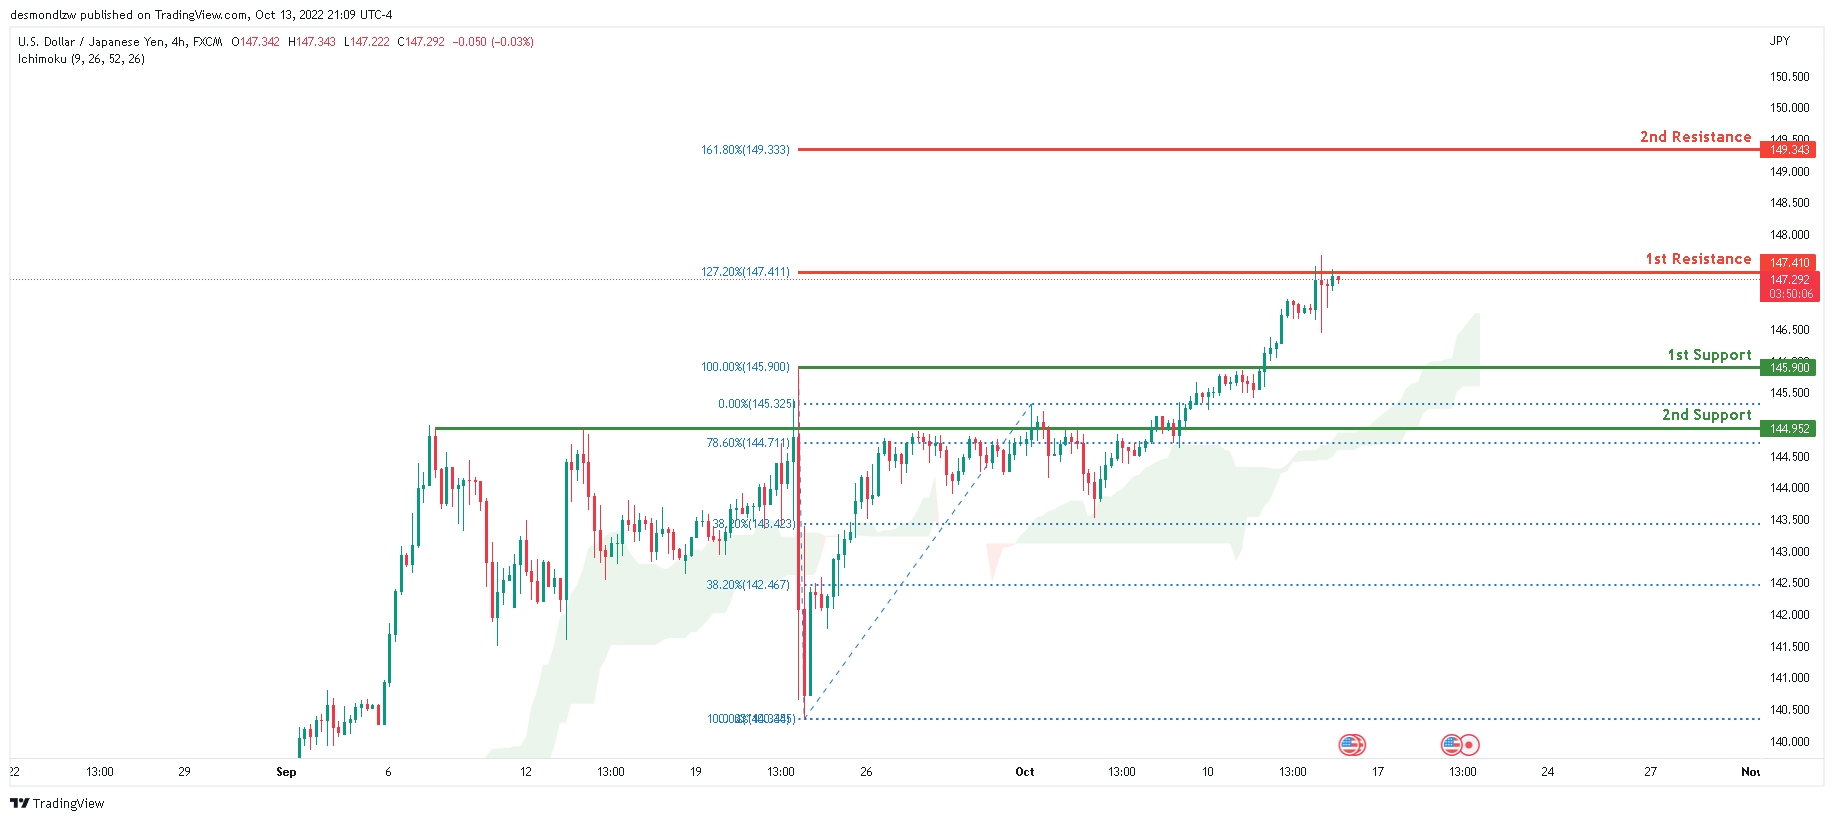
The current general bias for USDJPY on the H4 chart is bullish. To add to this bias, the price is currently trading above the Ichimoku cloud, indicating a bullish market. Overnight, the price has maintained its strong bullish momentum and tapped onto the first resistance line at 147.410, which contains the 127.2% Fibonacci extension line. Price is currently consolidating there. If this strong bullish momentum continues, expect price to continue towards 149.313 level where the 161.8% Fibonacci extension is located.
Areas of consideration:
- H4 time frame, 1st resistance at 147.410
- H4 time frame, 2nd resistance at 149.313
- H4 time frame, 1st support at 145.90
DXY:
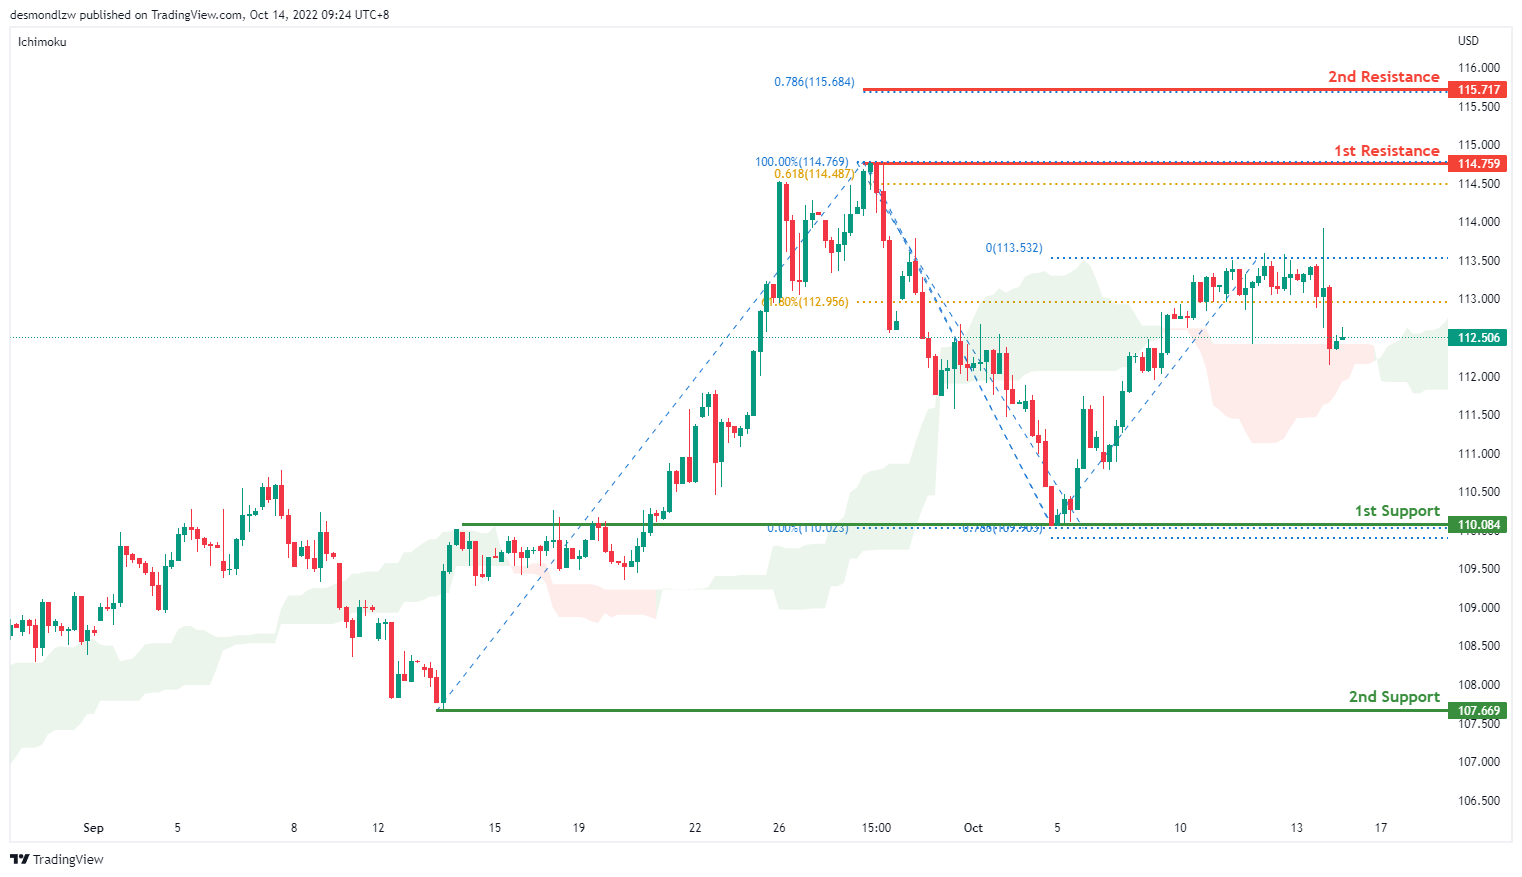
On the H4 chart, prices are moving in an ascending trend signalling an overall bullish momentum. Prices are moving towards the first support at 110.084 where the swing low sits. if it breaks this level, bearish momentum will bring price to second support at 107.669. Alternatively, price could move up to test the first resistance at 114.759 where the previous swing high sits. If bullish momentum continues it will bring price to 115.717 where the 78.6% projection.
Areas of consideration:
- H4 time frame, 1st resistance at 114.759
- H4 time frame, 1st support at 110.084
EUR/USD:
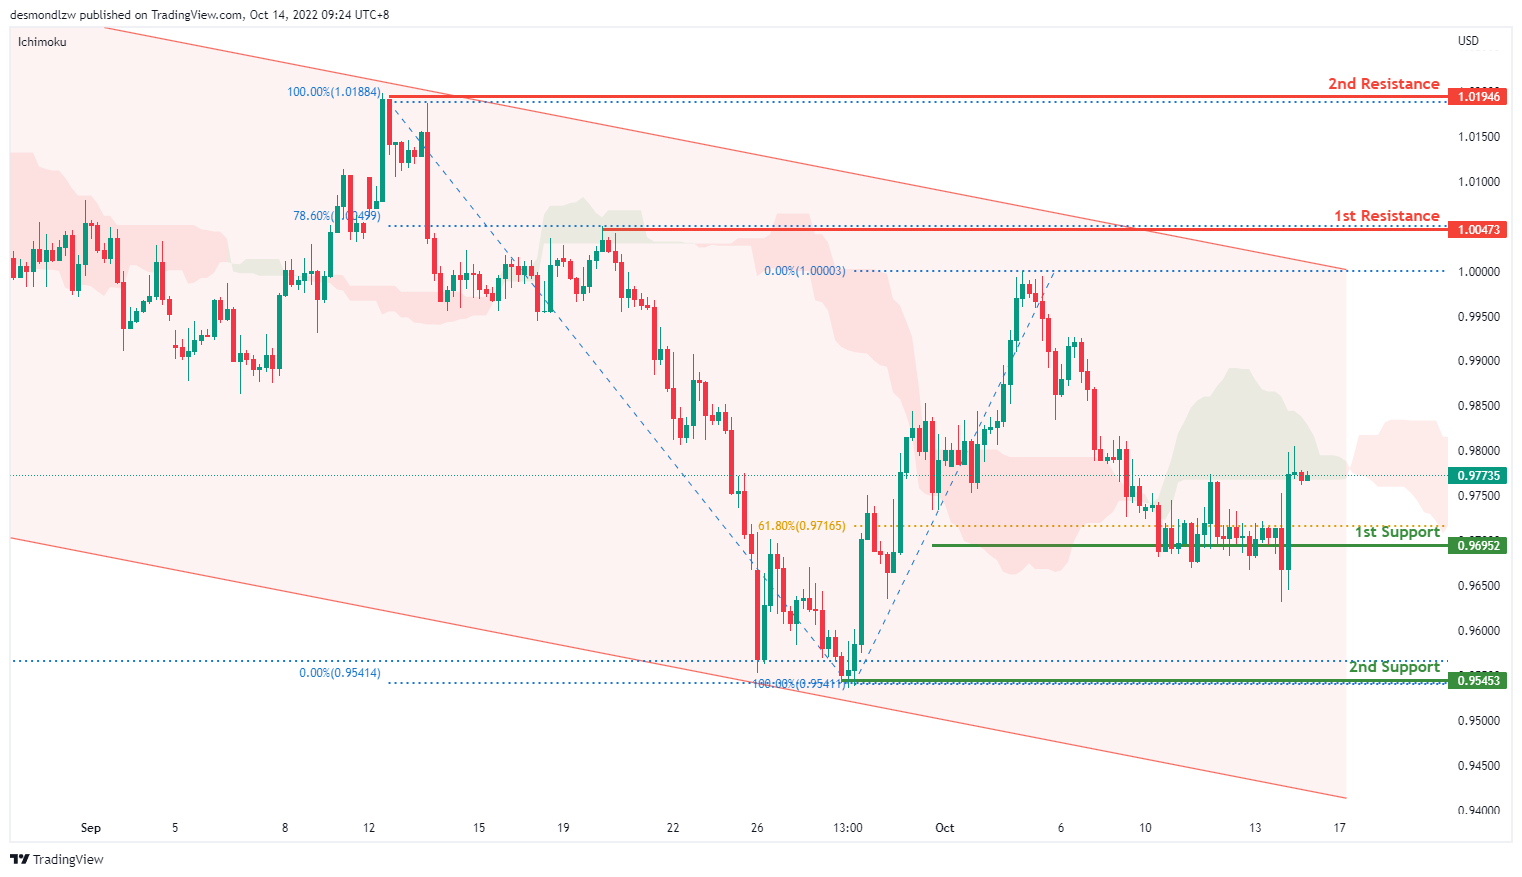
On the H4, price is moving within the descending trendline in a descending manner, with the price moving below ichimoku cloud- we are still overall bearish biassed. Although price has bounced off the first support at 0.9695 where the 61.8% retracement sits, it could still break this level and bring price to second support at 0.9545 where the swing low and 161.8% extension sit. Alternatively, price may test the first resistance at 1.0047 where the 78.6% retracement sits. If price breaks this level, it may test the second resistance at 1.0194, where the previous swing high sits
Areas of consideration :
- H4 1st resistance at 1.0047
- H4 2nd resistance at 1.0194
GBP/USD:
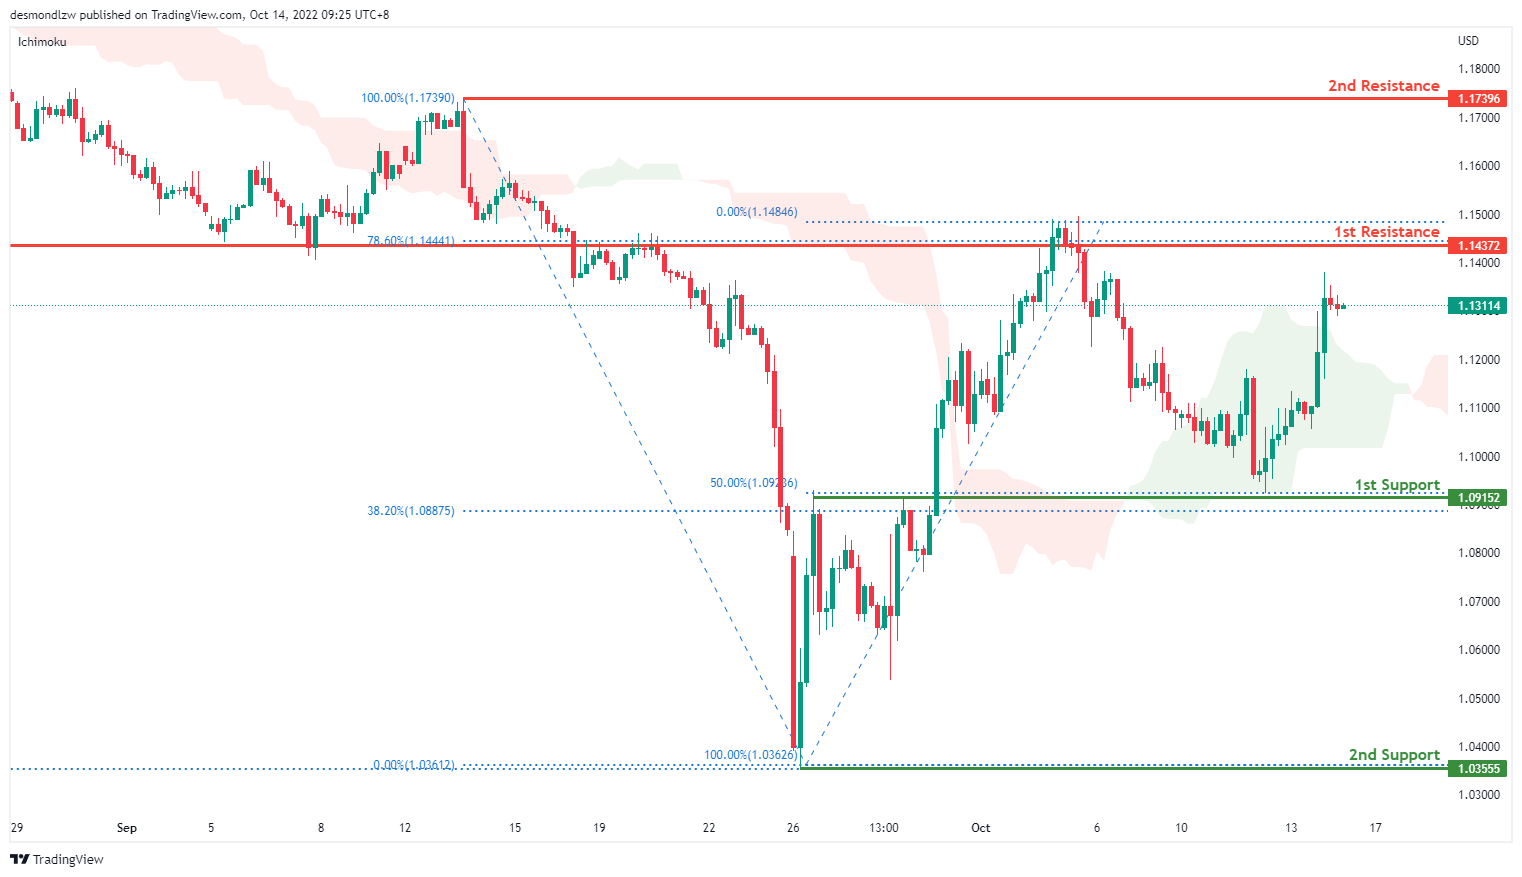
On the H4, price has rejected the first support and is moving in an ascending trend hence we are slightly bullish bias- if price breaks the first support at 1.0915 where the 50% retracement sits, bearish momentum will bring price to the second support at 1.0355 where the previous swing low sits. Alternatively price can test the first resistance at 1.1437 where the 78.6% retracement and overlap resistance sit. Subsequently the second resistance at 1.1739
Areas of consideration:
- H4 1st support at 1.0915
- H4 1st resistance at 1.1437
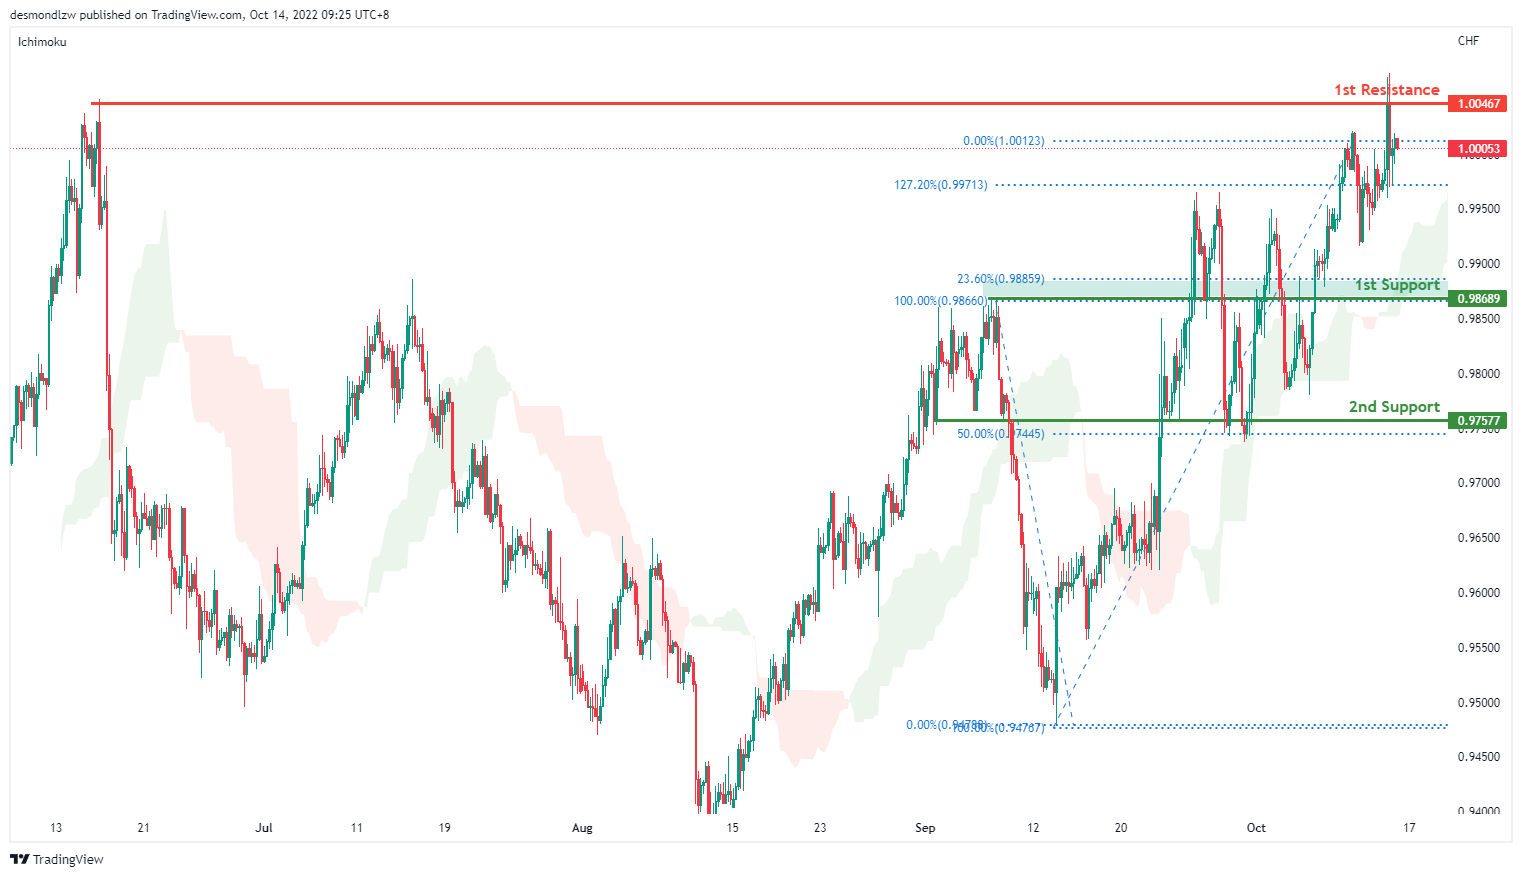
USD/CHF:
USDCHF is in a strong bullish trend on the H4 chart. Price is trading above the Ichimoku cloud signalling a bullish trend. Price has tested the first resistance at 1.0046 where the previous swing high sits and it’s pulling back slightly. If bearish momentum continues, price can test the first support at 0.9868 where the overlap support and 23.6% retracement sits then the second support at 0.9757 where the 50% retracement sits
Areas of consideration
- H4 1st support at 0.9868
- H4 1st resistance at 1.0046
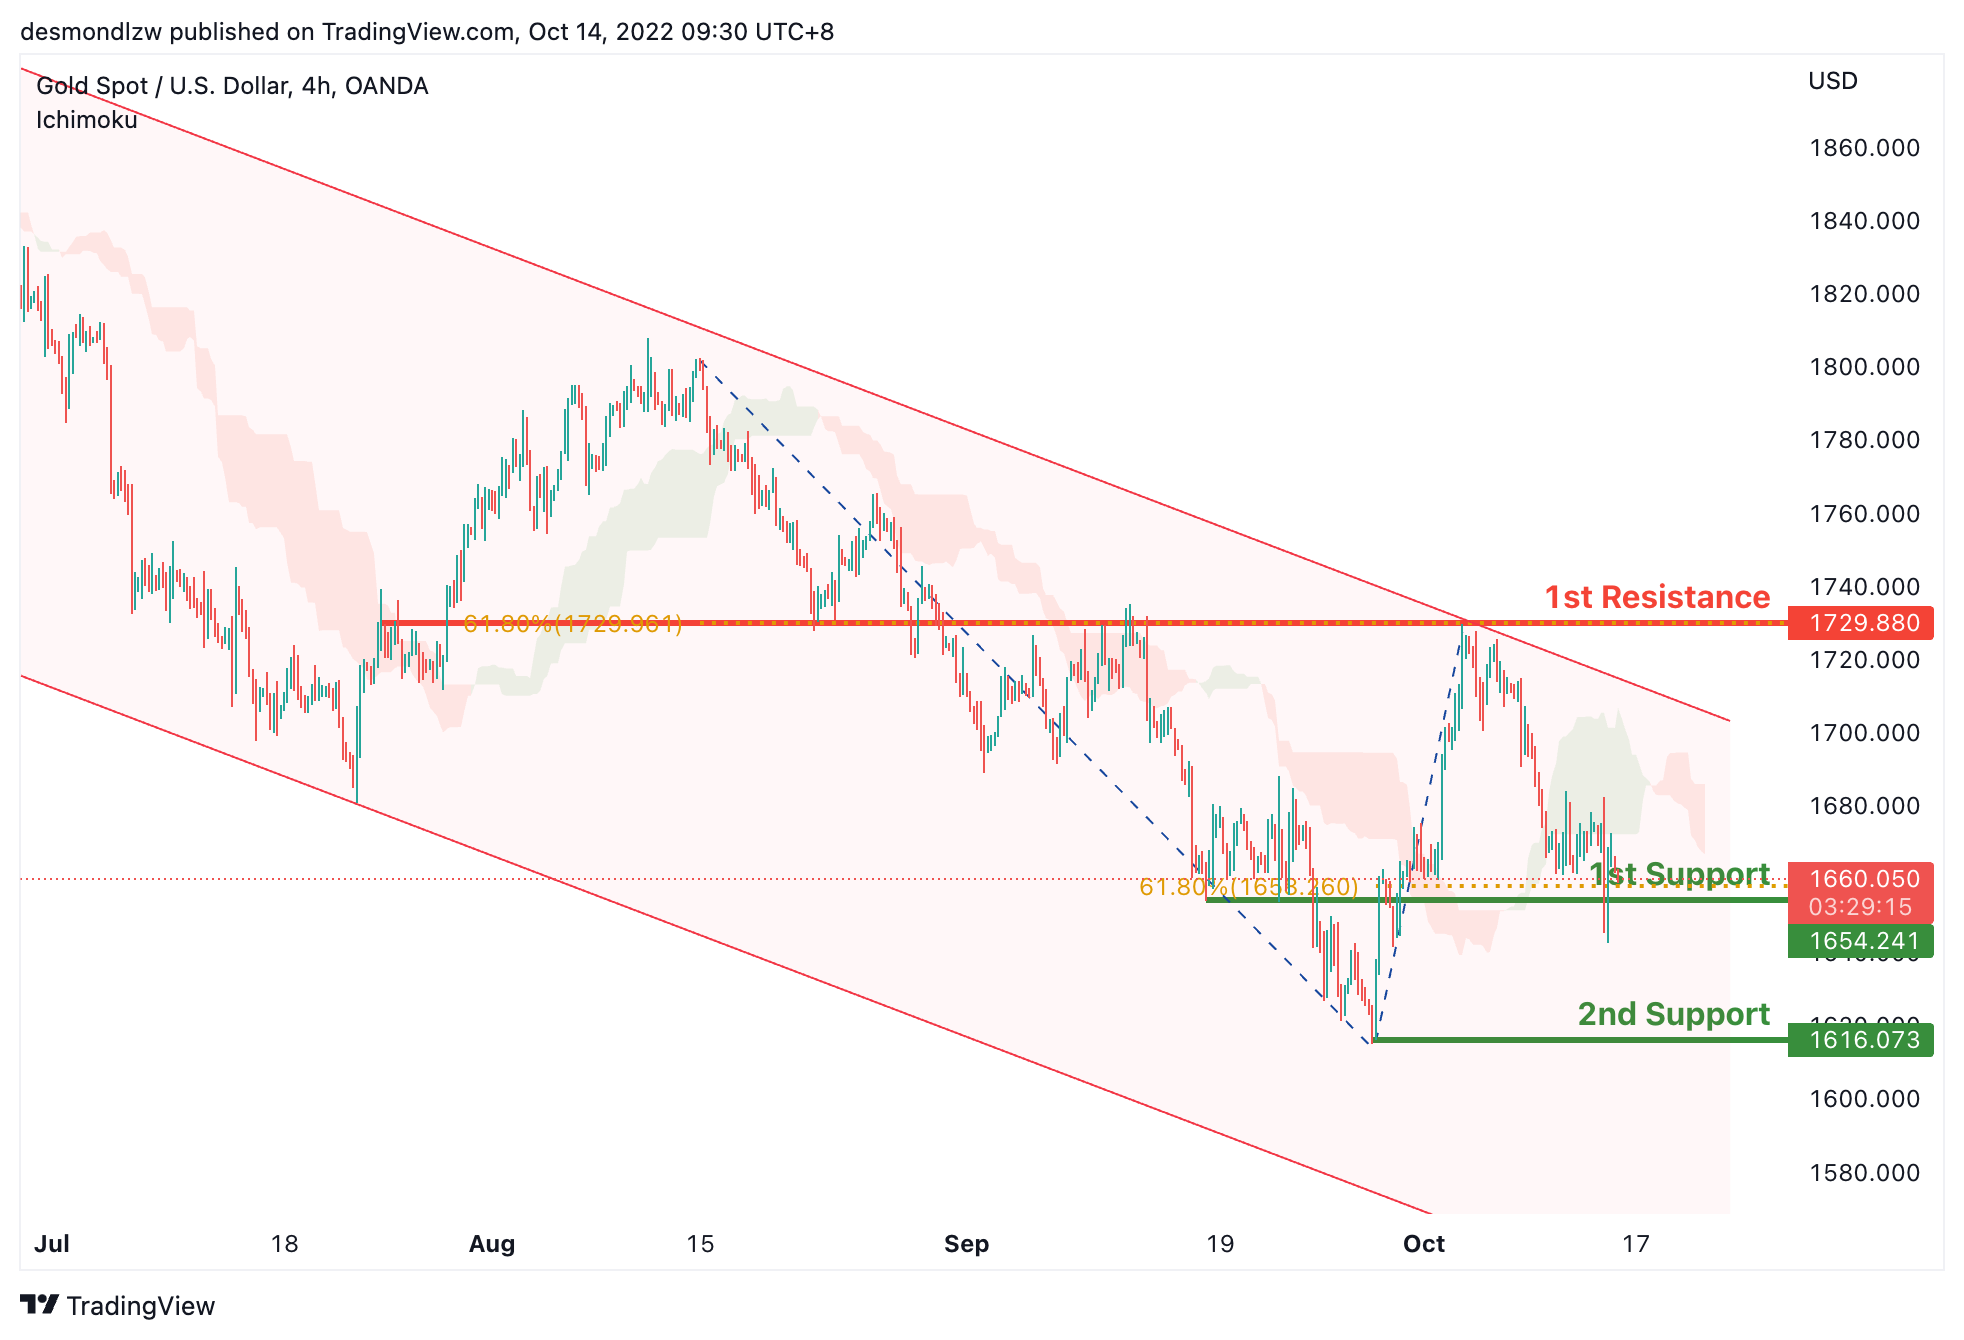
XAU/USD (GOLD):
On the H4, after the significant rise, the price is showing a pullback trend now, the 1st support is still held at 1660.410, which is in line with the 61.8% fibonacci retracement and overlap support. As the price is within the descending channel, we can expect the price to break 1st support and drop to the 2nd support at 1616.073, where the swing low is. Alternatively, the price may bounce off from the 1st support and rise to test the 1st resistance at 1729.880, where the 61.8% fibonacci retracement and previous swing highs are.
Areas of consideration:
- H4 time frame, 1st support at 1660.410
- H4 time frame, 2nd support at 1616.073
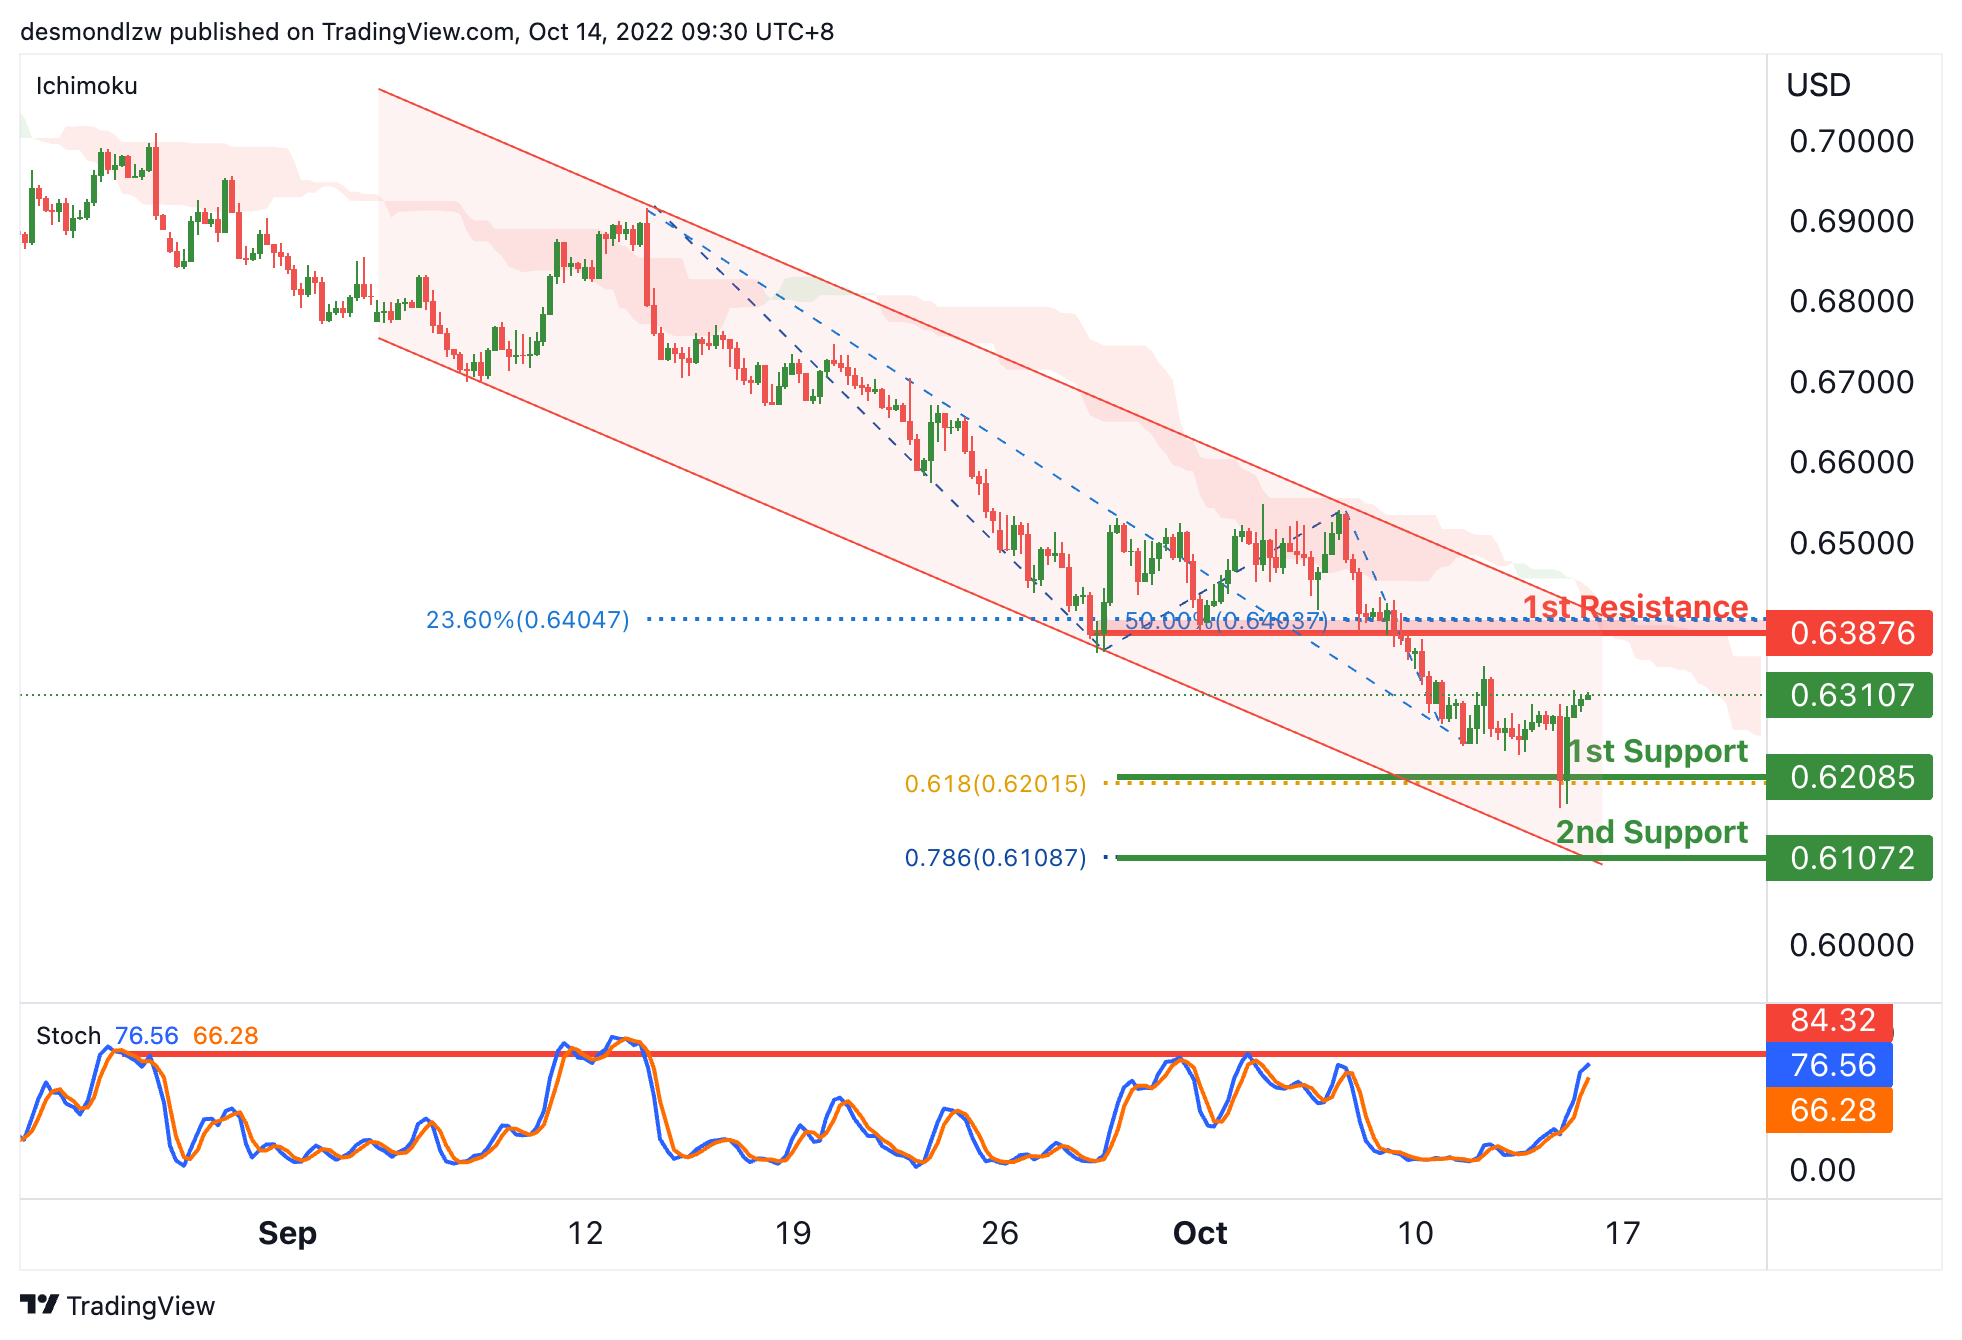
AUD/USD:
On the H4, the price is bouncing off from the 1st support, as the stoch is testing the 1st resistance,we are looking the price rise to test the 1st resistance at 0.63976. Alternatively, as the price is below the descending trendline and ichimoku cloud, the price may drop to the 1st support at 0.62085, which is in line with the 61.8% fibonacci projection. If the 1st support is broken, the 2nd support could be at 0.61072, where the 78.6% fibonacci projection is.
Areas of consideration
- H4, 1st support at 0.62085
- H4, 1st resistance at 0.63976
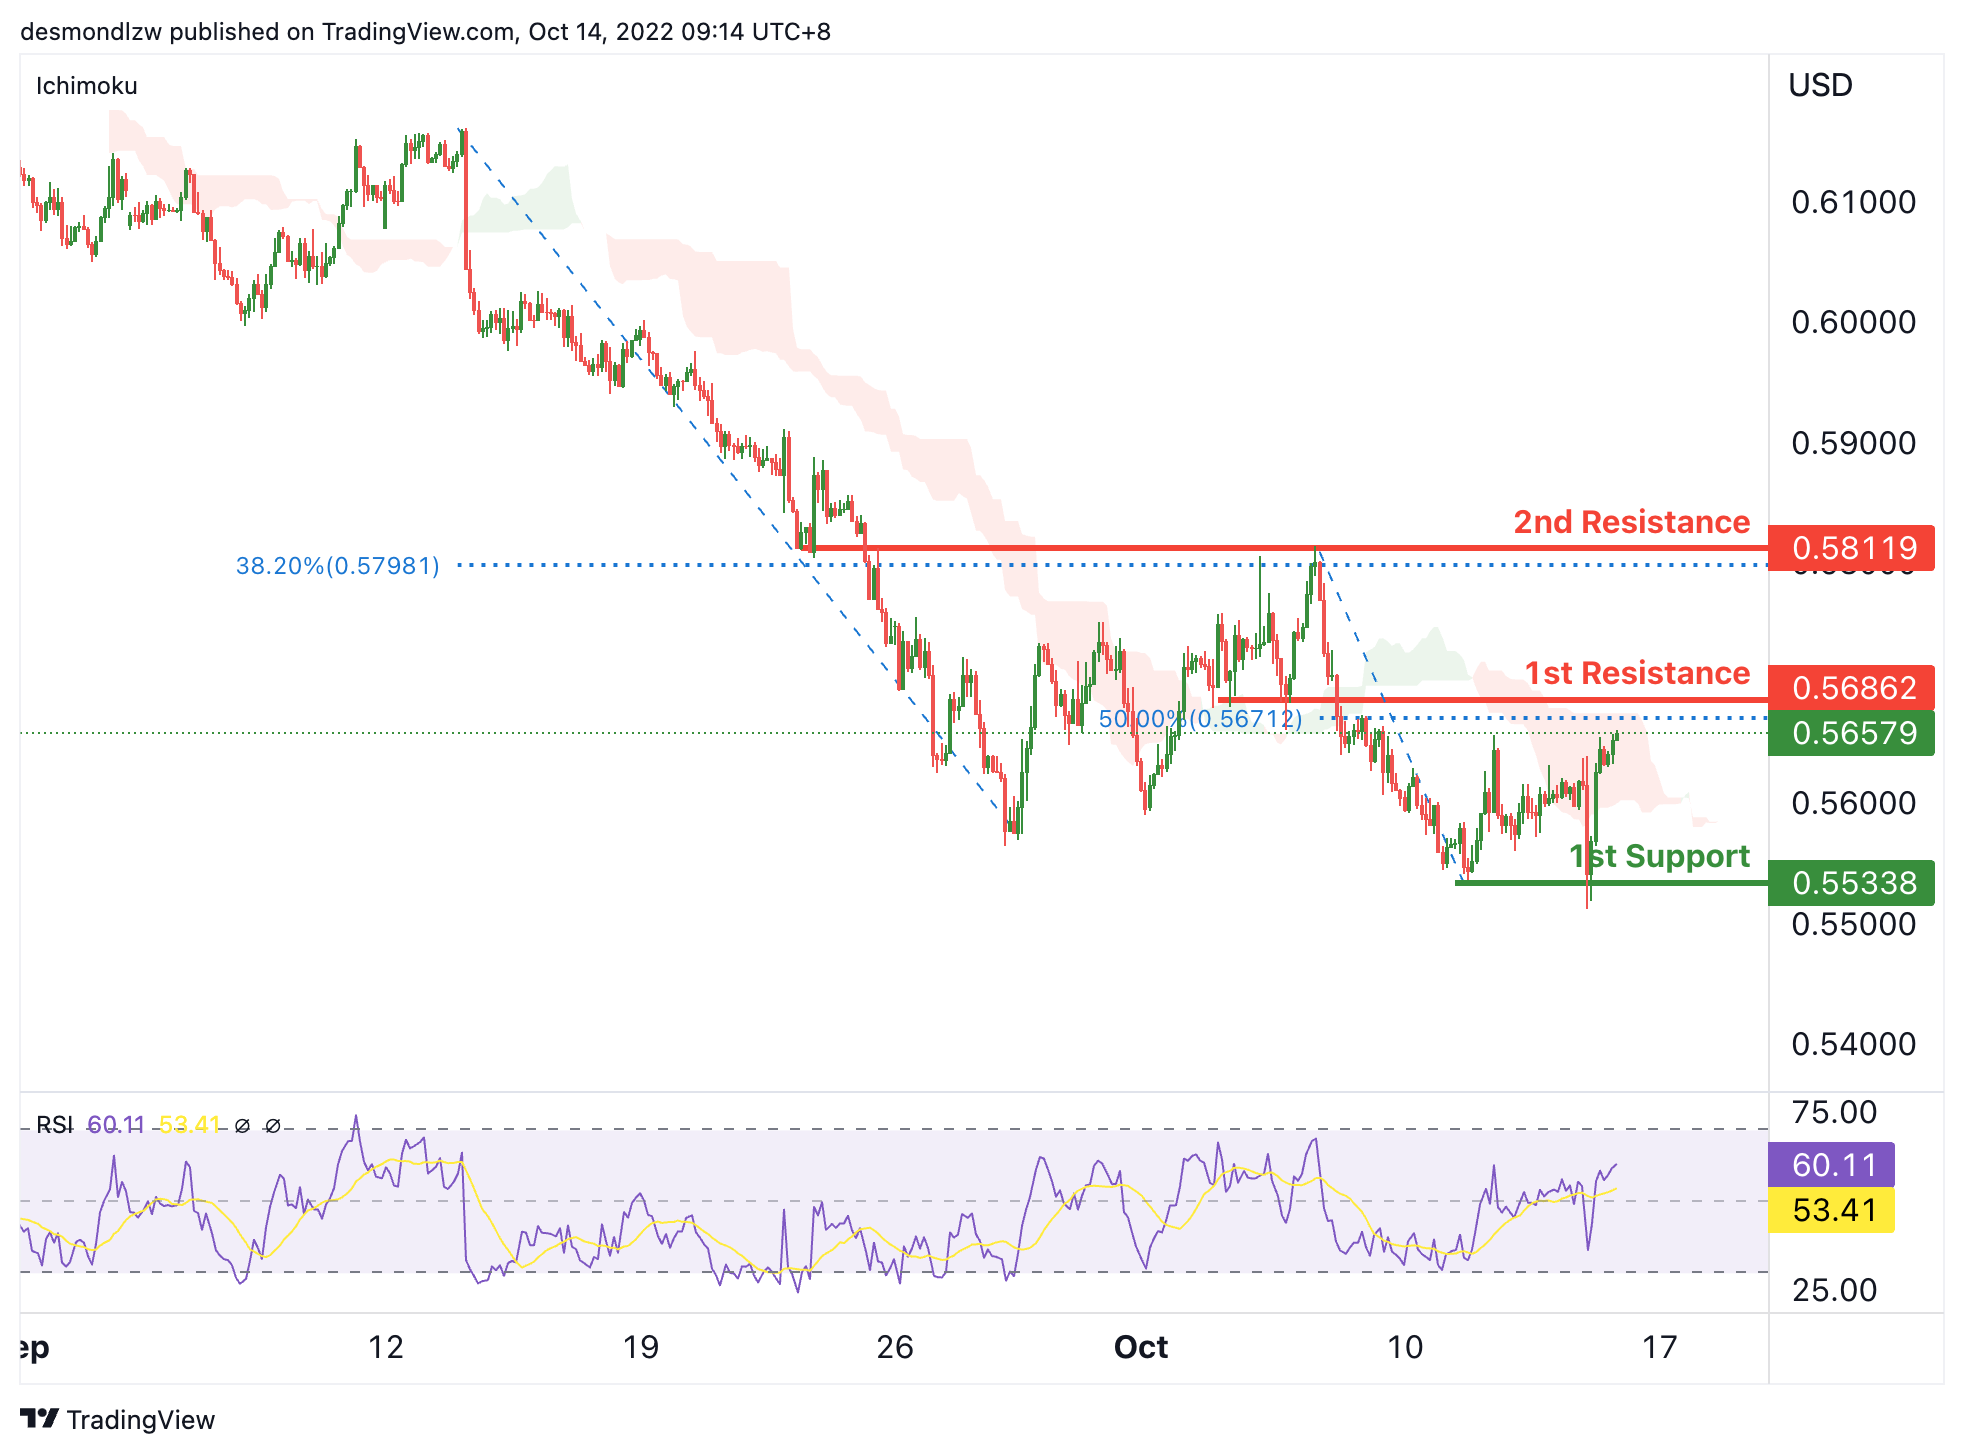
NZD/USD:
On the H4, the price is crossing the ichimoku cloud and RSI is rising over 50, we have a bullish bias that the price may rise to test the 1st resistance at 0.56862, where the 50% fibonacci retracement is. If the 1st resistance is broken, the 2nd resistance could be at 0.58119, which is in line with the 38.2% fibonacci retracement and overlap resistance. Alternatively, the price may drop to test the 1st support at 0.55338, which is in line with the swing low.
Areas of consideration:
- H4 time frame, 1st resistance at 0.56862
- H4 time frame, 2nd resistance at 0.58119
USD/CAD:
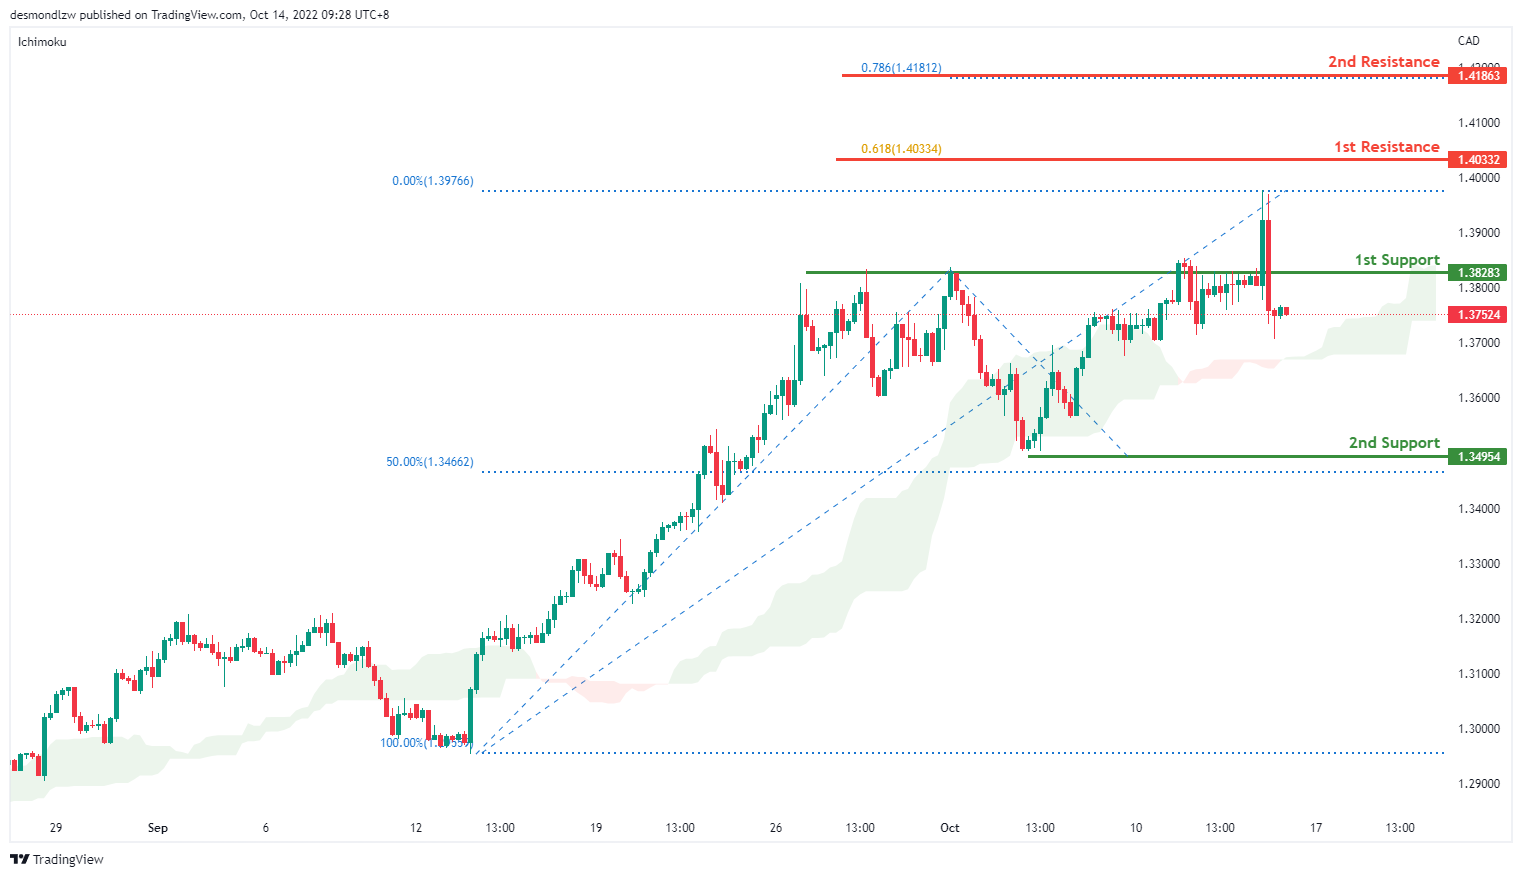
On the H4, the price trades higher near the 1st resistance of 1.4033 which is the previous swing high and 61.8% projection level. With the price trading above the ichimoku cloud, we have a short term bullish bias. The price could break the first resistance to test the second resistance at 1.4186 where the 78.6% projection sits. Alternatively it could fall to the 1st support at 1.3828 where the previous swing high sits subsequently the second support at 1.3495 where the 50% retracement sits
Areas of consideration:
- H4 time frame, 1st resistance at 1.4033
- H4 time frame, 1st support at 1.3828
OIL:
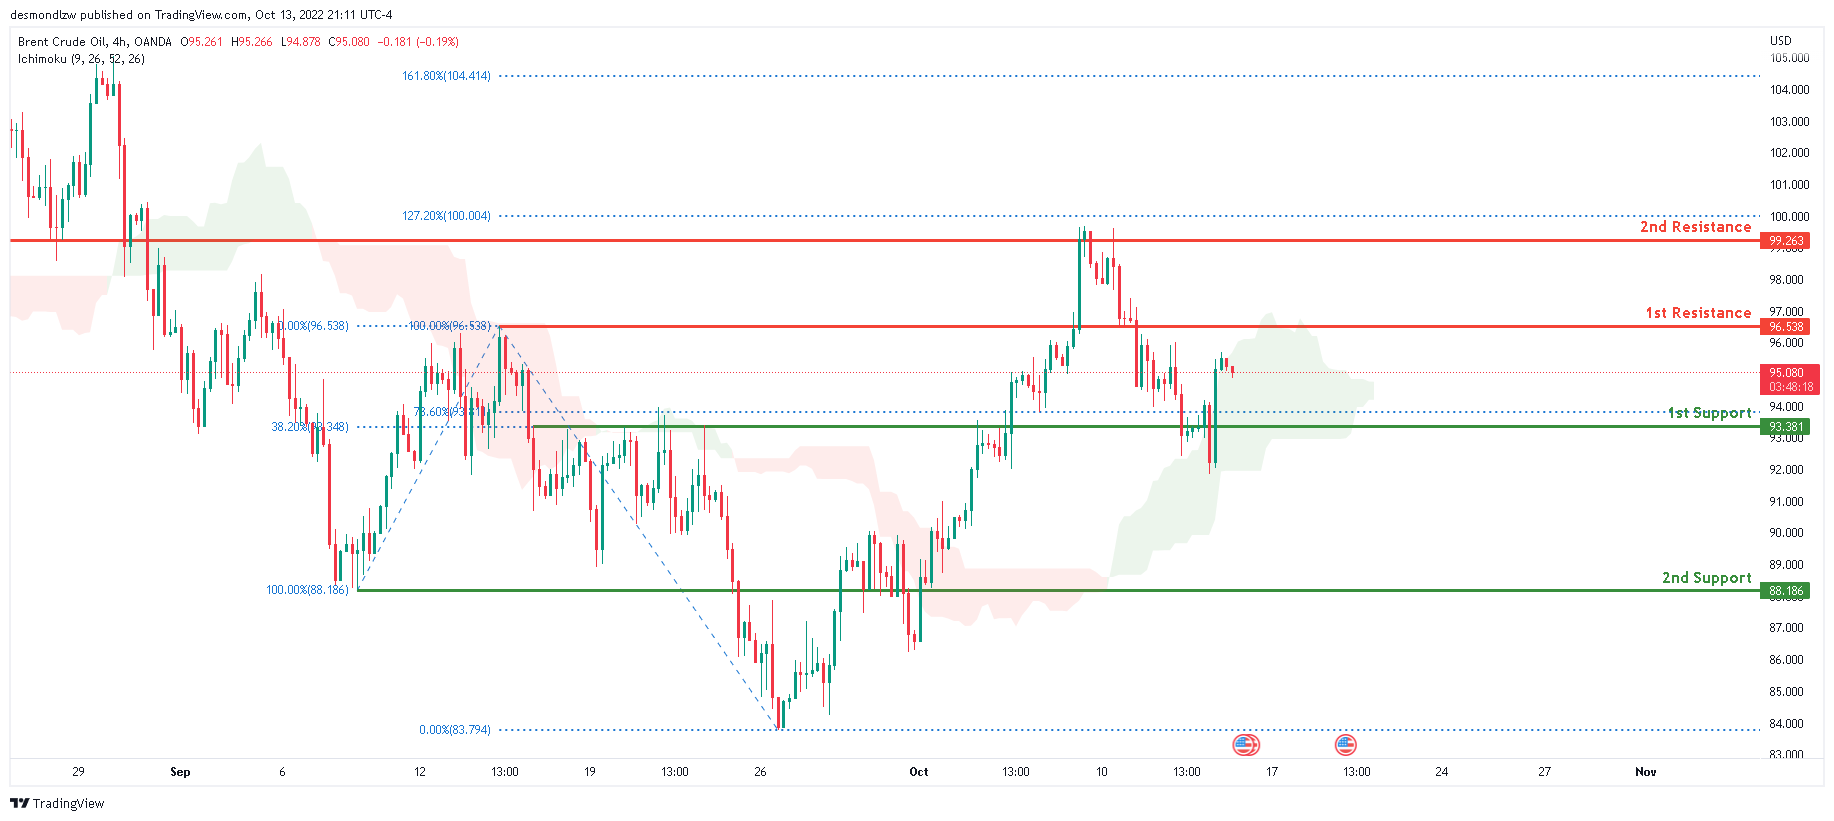
Looking at the H4 chart, the current overall bias for Oil is bullish . To add confluence to this bias, the price is currently above the Ichimoku cloud which indicates a bullish market. Overnight, price broke through the 1st support line at 93.381 where the 78.6% Fibonaaci line and 38.2% Fibonaaci line was located before going back up above it. If this bullish momentum continues, expect the price to head towards the 1st resistance at 96.538 where the 100% Fibonacci line and 0% Fibonacci line are located for a retest.
Areas of consideration:
- H4 time frame, 1st resistance at 96.538
- H4 time frame, 1st support at 93.381
Dow Jones Industrial Average:
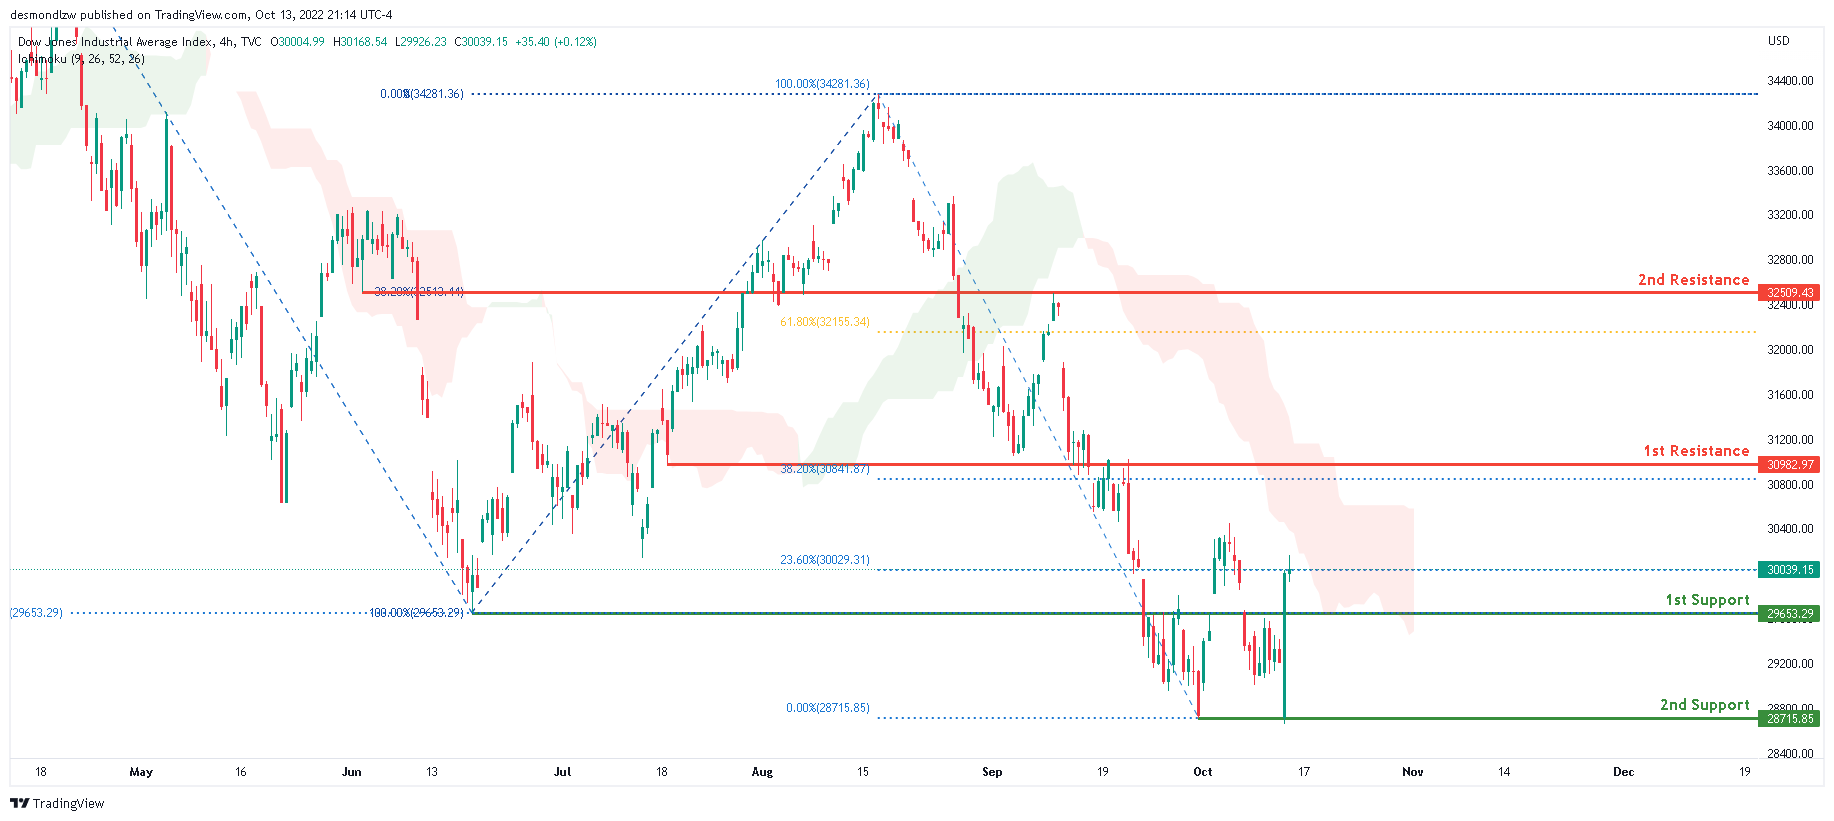
The current overall bias for DJI is bearish, according to the H4 chart. To add to this bias, the price is currently trading below the Ichimoku cloud, indicating a bearish market. Price had strong votality overnight due to the release of the US CPI data with price going down to test the 2nd support at 28715.85 where the previous low and 0% Fibonacci line is located. Price then closed above the 1st support at 29653.29 where the previous low and 100% Fibonacci line is located. If this short term bullish momentum continues, expect price to possibly head back up to test the 1st resistance at 30982.97 where the 38.2% Fibonacci line is located.
Areas of consideration:
- H4 time frame, 1st support at 29653.29
- H4 time frame, 2nd support at 28715.85
- H4 time frame, 1st Resistance at 30982.97
DAX:
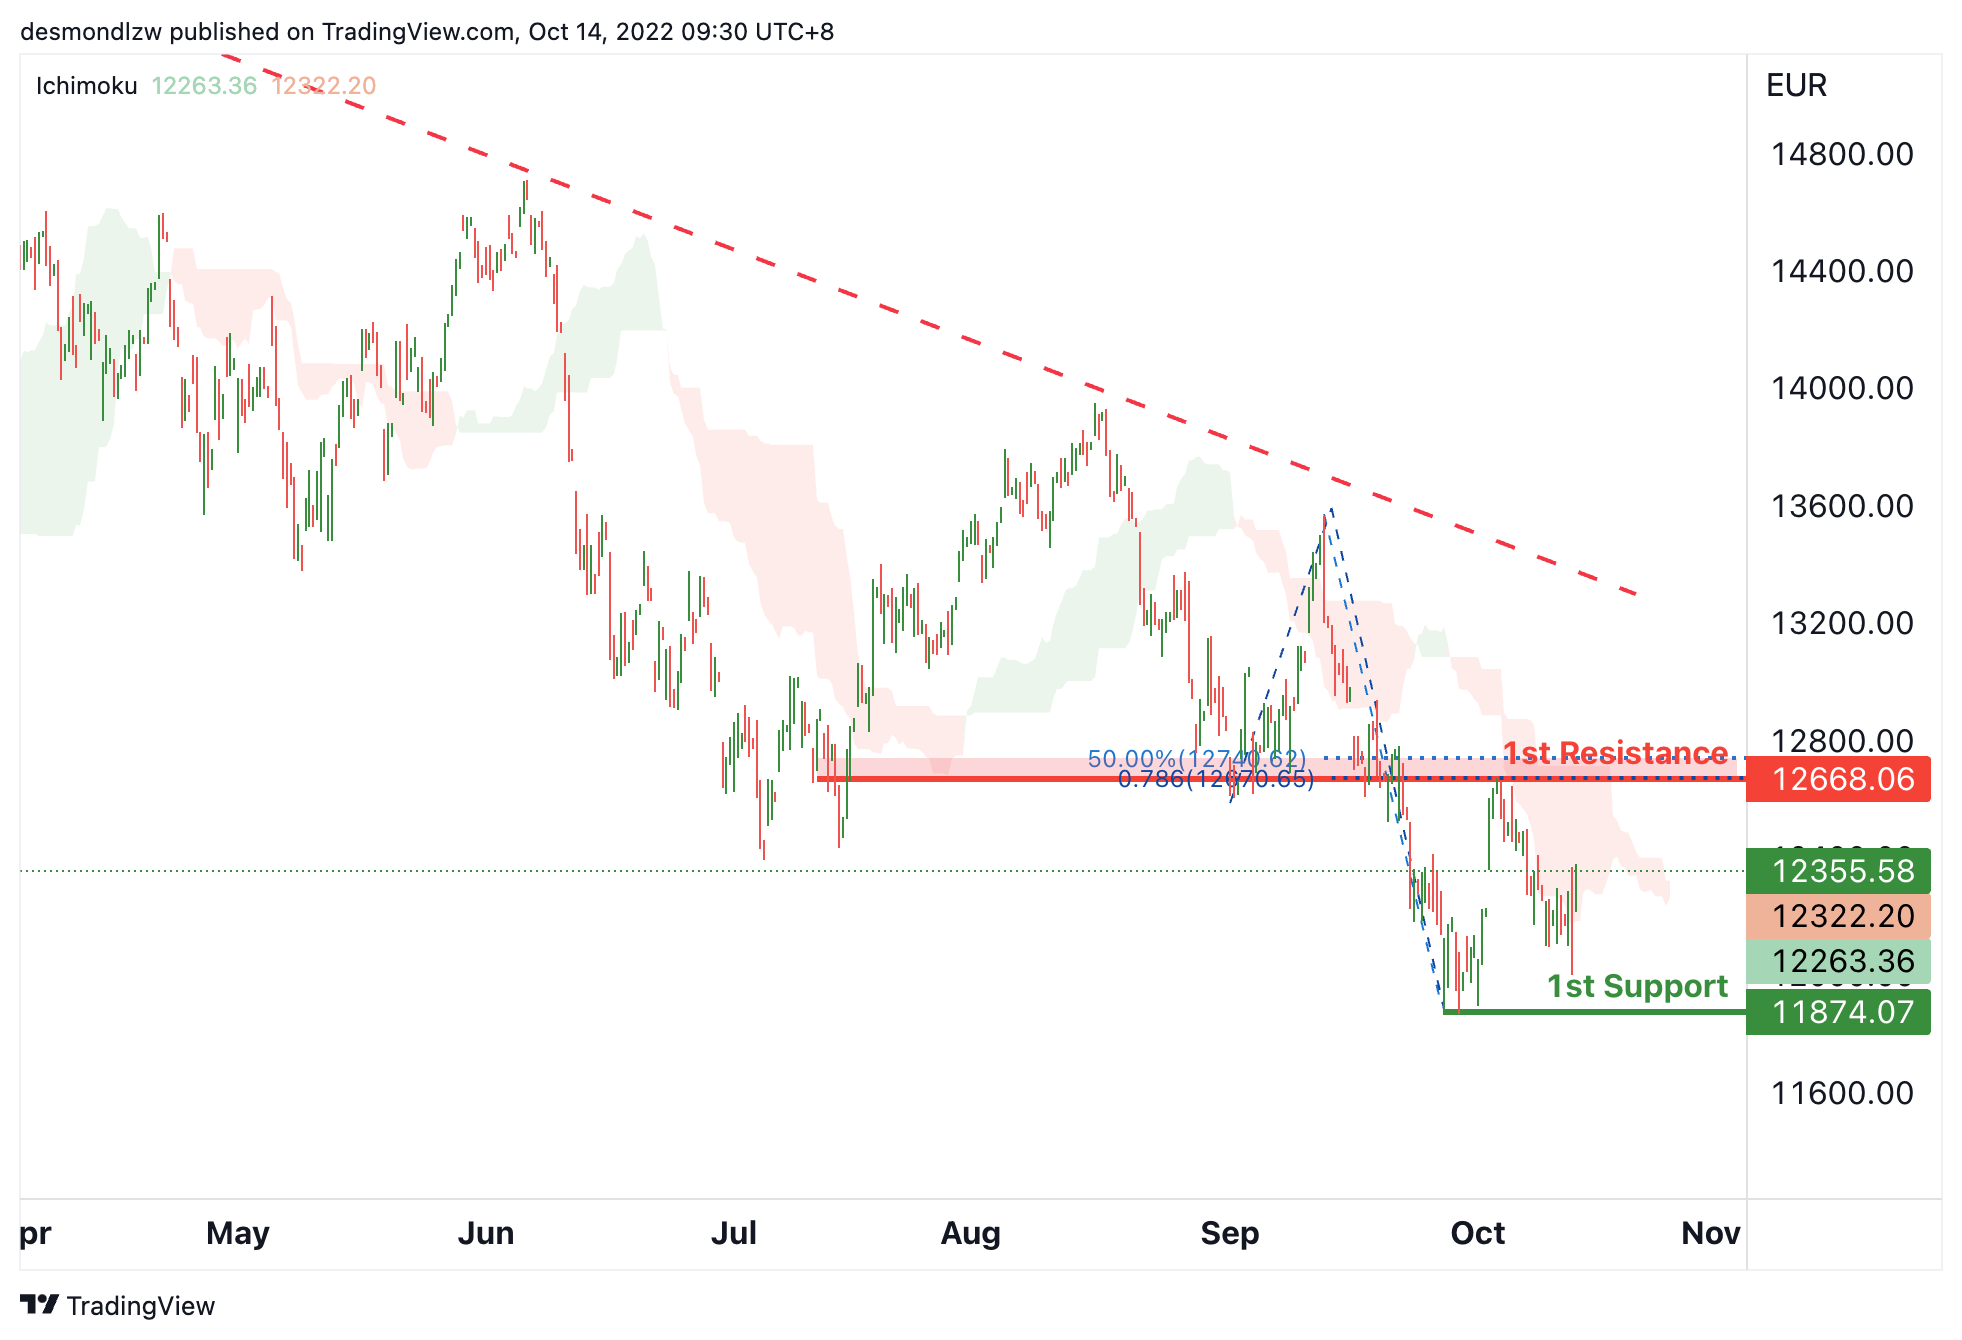
On the H4, as the price is crossing ichimoku cloud, we can expect the price to test the 1st resistance at 12668.06, which is in line with the 50% fibonacci retracement, 78.6% fibonacci projection and overlap resistance. After testing the 1st resistance, as the price is below the descending trendline, the price may drop to the 1st support at 11874.07, which is in line with the swing low.
Areas of consideration:
- H4 time frame, current price
- H4 time frame, 1st resistance at 12668.06
ETHUSD:
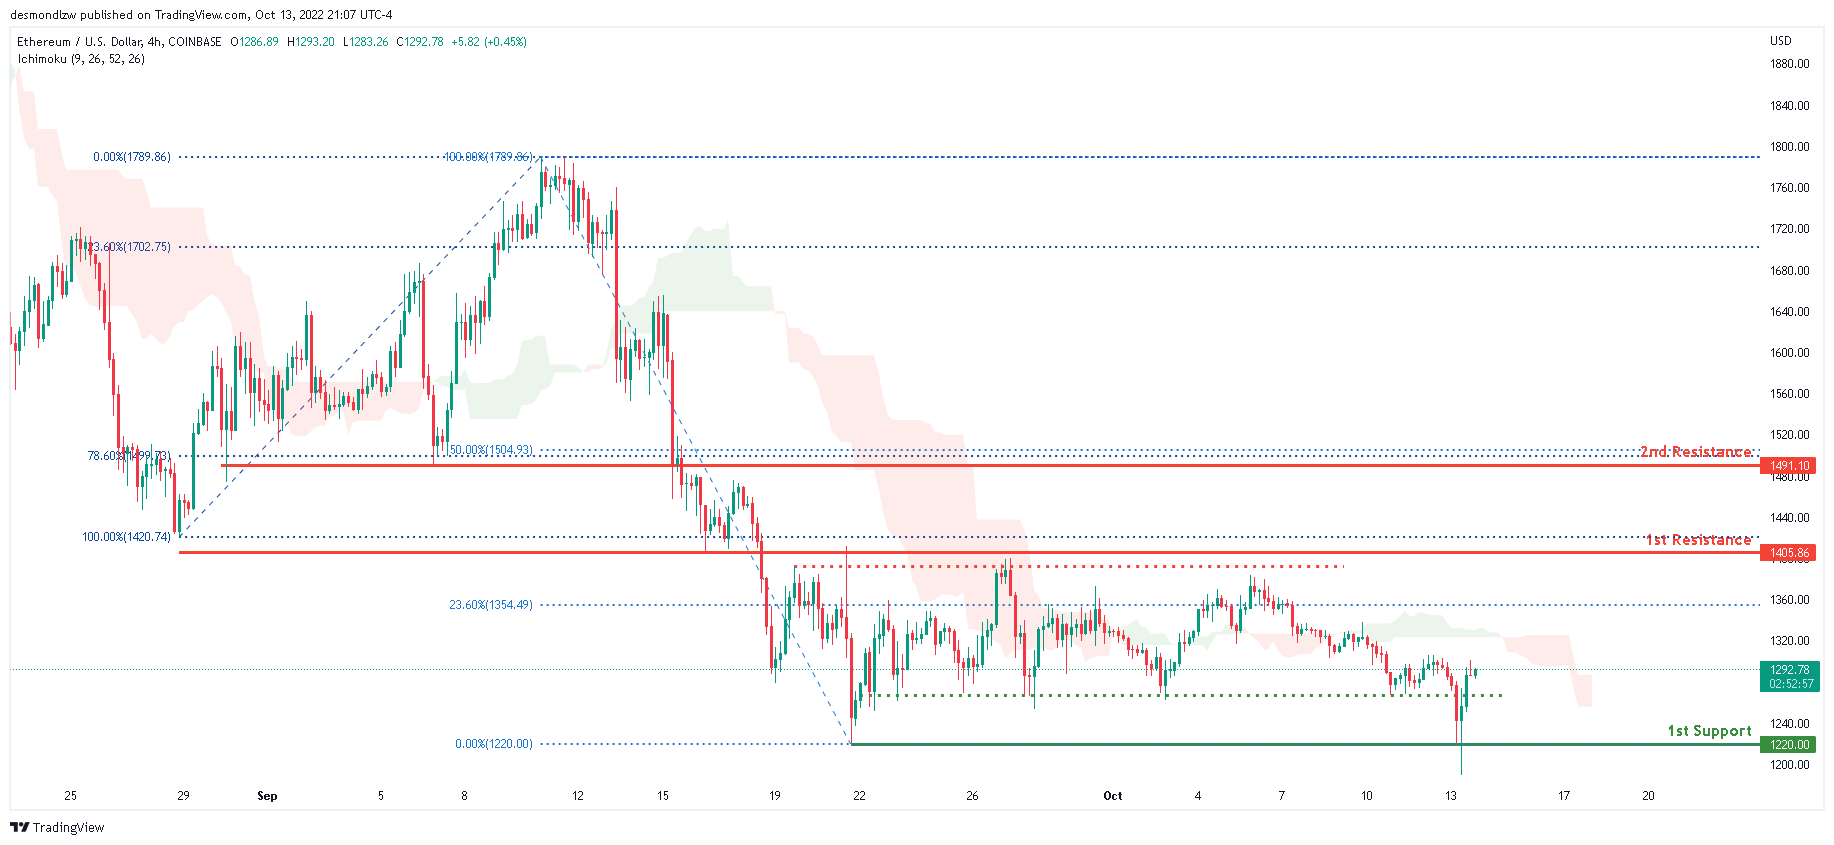
Looking at the H4 chart, the current overall bias for ETHUSD is bearish. To add confluence to this bias, the price is currently under the Ichimoku cloud which indicates a bearish market. Overnight, the price continued its bearish momentum downwards and went through the 1st support line at 1220.00, where the 0% Fibonaaci line is located, before reflecting back up. Expecting price to continue consolidating between the 1st support and 2nd resistance.
Areas of consideration:
- H4 time frame, 1st resistance of 1405.86
- H4 time frame, 1st support at 1220.00
BTCUSD:
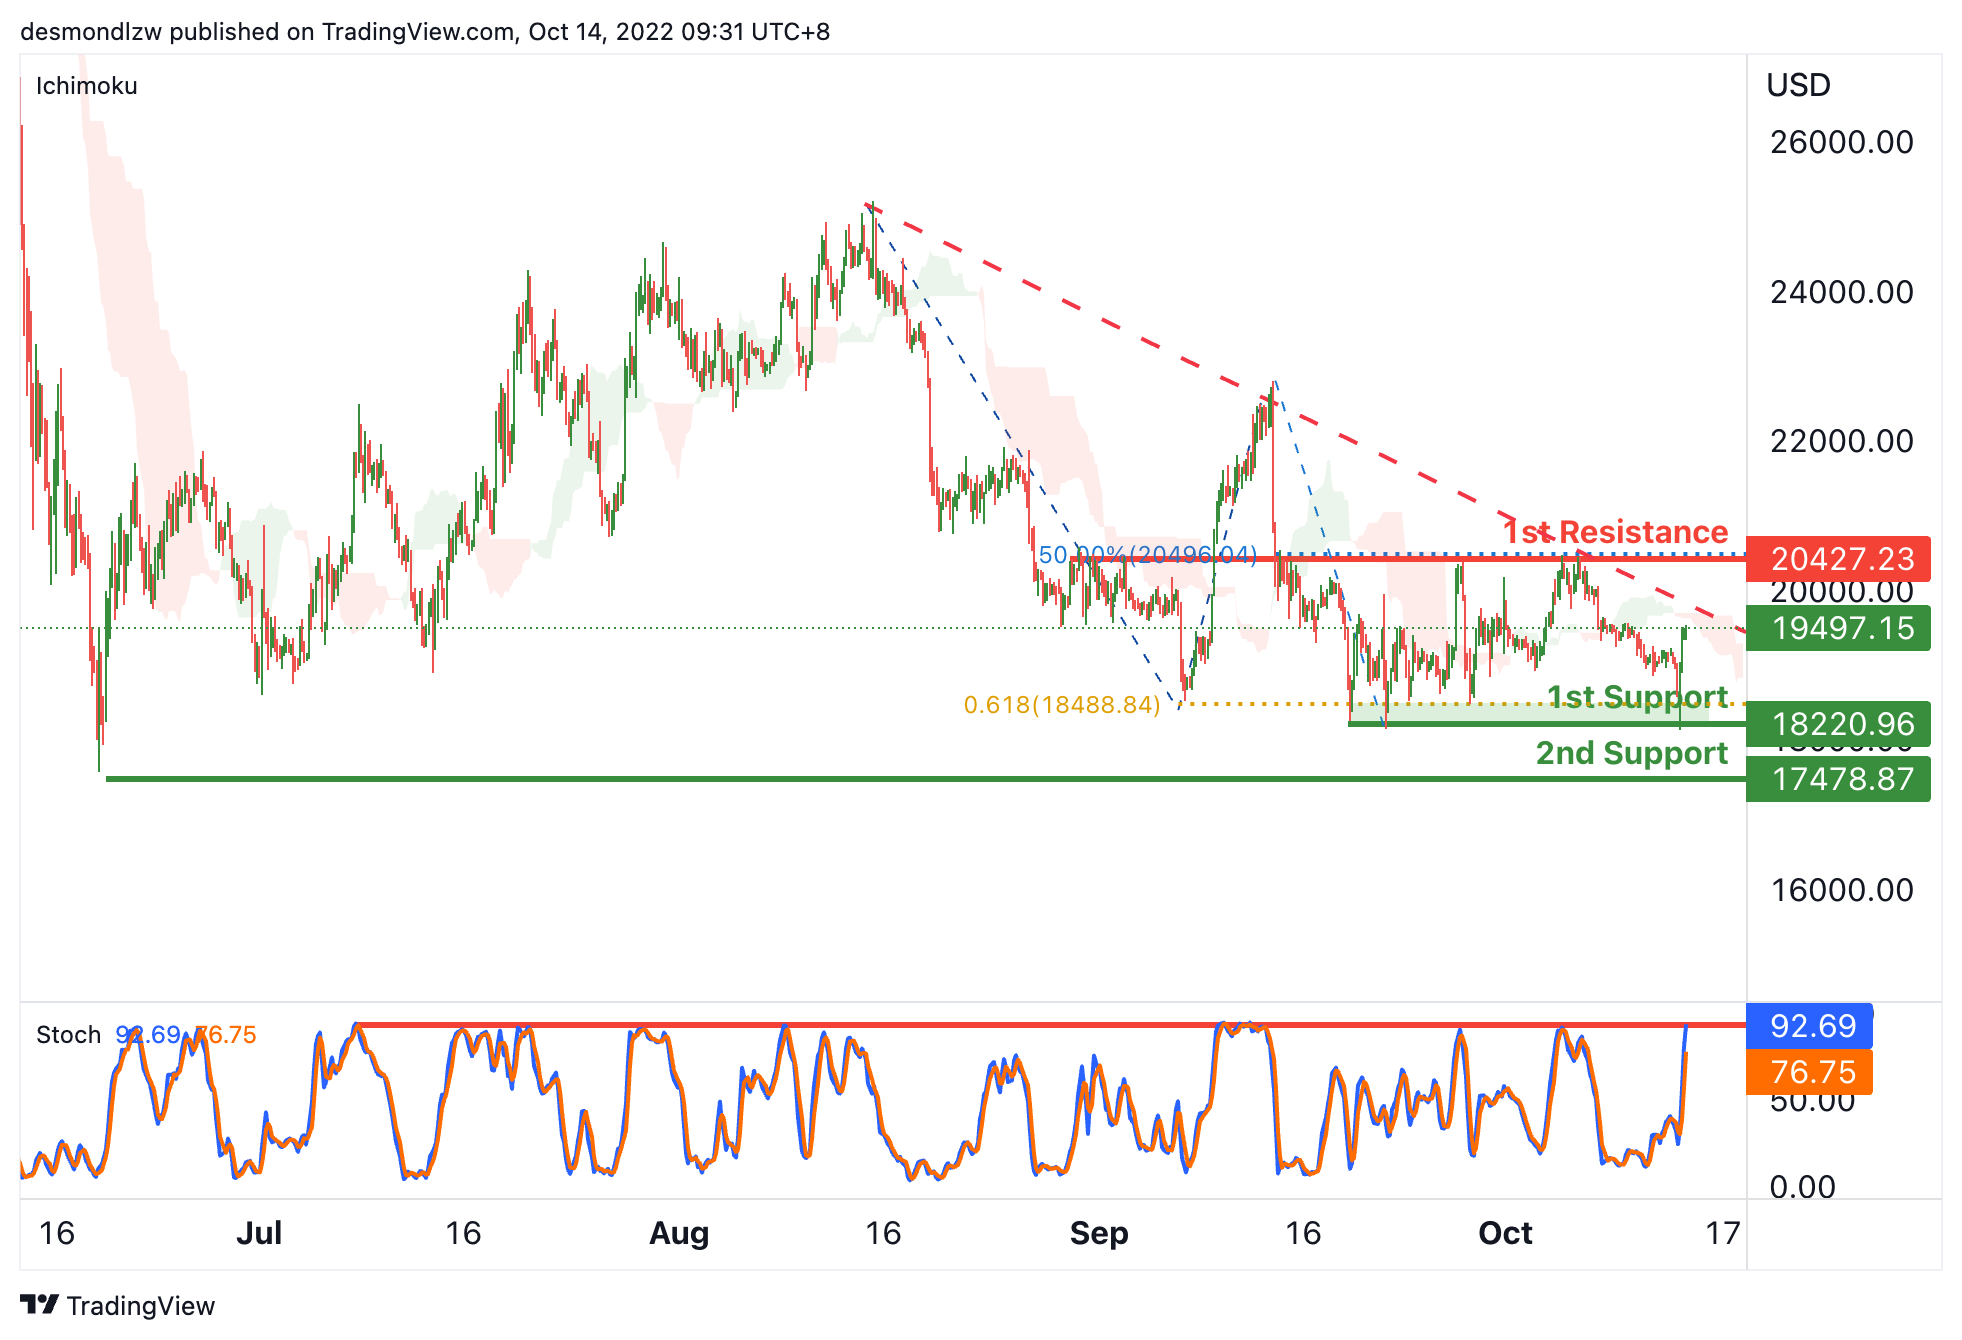
On the H4, price is showing a descending trendline and below the ichimoku cloud, we can expect the price drop to test the 1st support at 18220.96, which is in line with the swing lows and 61.8% fibonacci projection. If the 1st support is broken, we can expect the price to drop to the 2nd support at 17478.87, where the previous swing low is. Alternatively, the price may rise to the 1st resistance at 20427.23, where the overlap resistance and 50% fibonacci retracement are.
Areas of consideration:
- H4 time frame, 1st support at 18220.96
- H4 time frame, 2nd support at 17478.87
S&P 500:
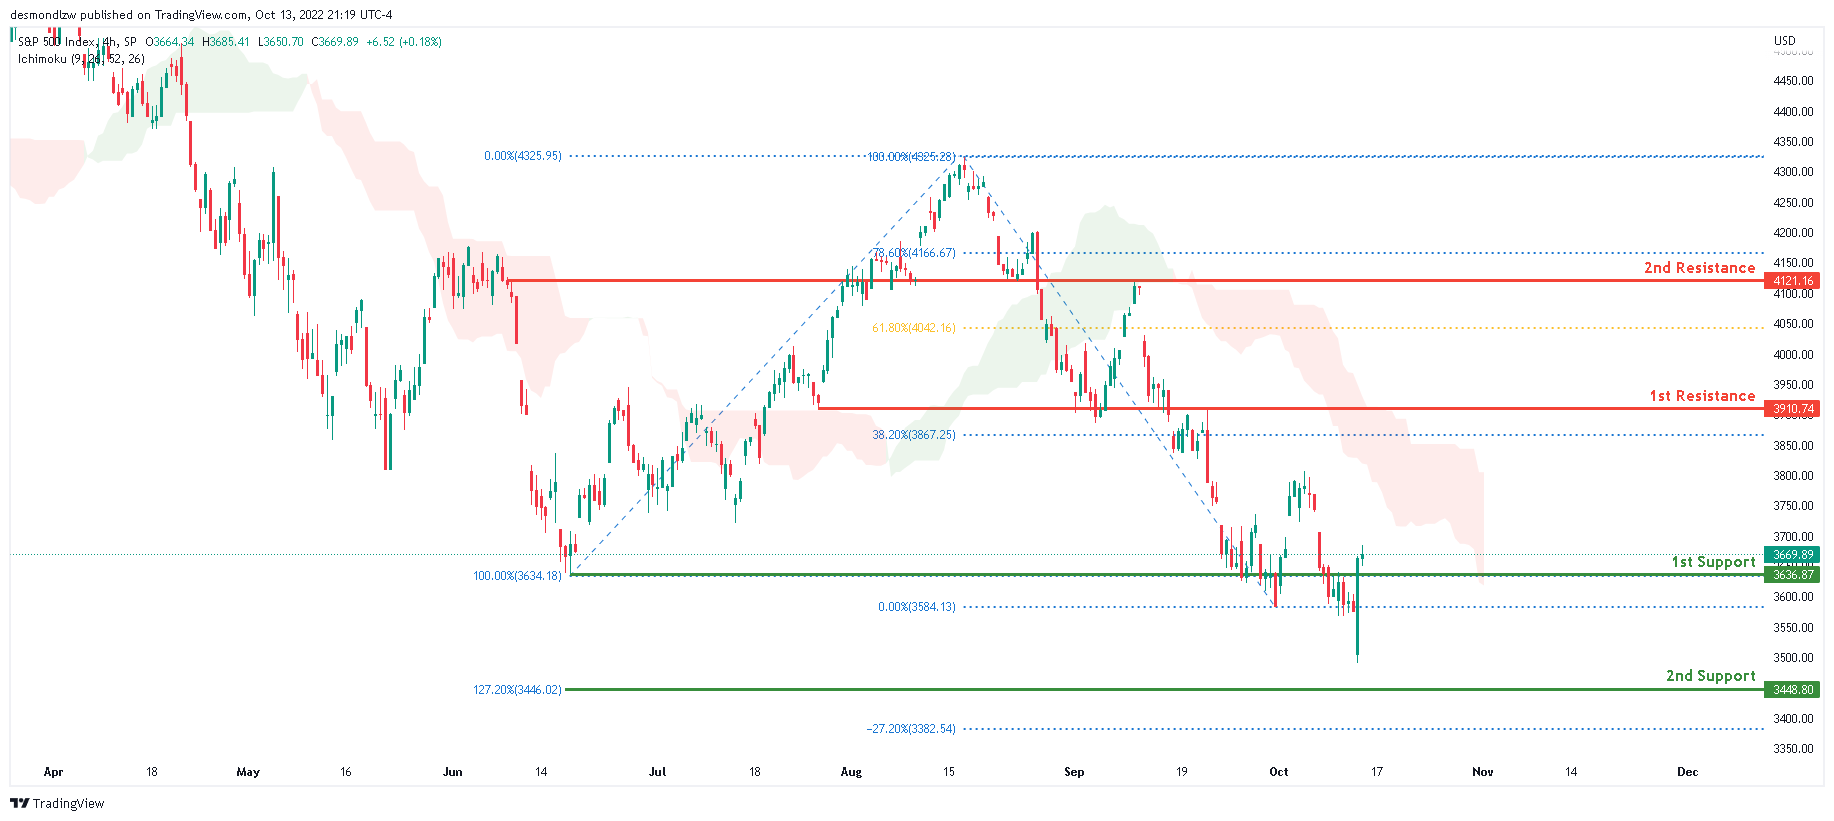
Based on the H4 chart, the current overall bias for the S&P500 is bearish. To add to this bias, the price is currently below the Ichimoku cloud, indicating a bearish market. Overnight, the price shot back up above the 1st support at 3636.87 where the 100% Fibonacci line and previous low is located due to the release of the US CPI data. If this short term bullish momentum continues, expect price to possibly head towards the 1st resistance at 3910.74 where the 38.2% Fibonacci line is located.
Areas of consideration:
- H4 time frame, 1st support at 3636.87
- H4 time frame, 1st resistance at 3910.74
NZ BNZ manufacturing dropped to 52.0, positive trend with ongoing volatility
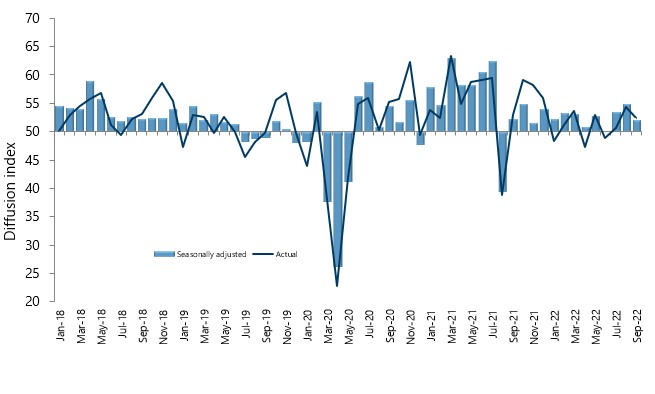
New Zealand BusinessNZ Performance of Manufacturing Index dropped back from 54.8 to 52.0 in September, comparing to July's 53.5 and June's 50.2. Looking at some details, production dropped from 54.5 to 52.0. Employment dropped from 53.6 to 51.9. New orders tumbled sharply from 59.7 to 48.4. Finished stocks rose from 52.0 to 55.0. Deliveries edged down from 55.0 to 54.5.
BNZ Senior Economist, Doug Steel stated "the overall trend remains positive, but with ongoing volatility around it. On the positive side, the PMI's 3-month moving average has continued to edge higher this month but, not so good, the 52.0 monthly reading is now back below the PMI's longer-term norm".
Japan didn’t confirm intervention after unusually USD/JPY volatility
There was some unusual volatility in USD/JPY overnight at it approached 1998 high at 147.68. The pair was knocked down but there was no sustained selling. Japan Ministry of Finance declined to confirm whether that was caused by intervention.
Meanwhile, Finance Minister Shunichi Suzuki just reiterated that government's readiness to take "appropriate action" against "excessive volatility" in the markets. He said, "we cannot tolerate excessive volatility driven by speculative moves. We're watching market developments with a strong sense of urgency."
Separately, BoJ Governor Haruhiko Kuroda maintained that "raising rates now is inappropriate in light of Japan's economic, price conditions." He added that "pace of Japan's economic recovery still slow so BoJ must continue supporting economy."
No reversal yet after DOW’s 1500 historic U-turn
US stocks staged a historic U-turn overnight, after initial post-CPI selloff. DOW had a jaw-dropping swing of more than 1500 pts, falling to as low as 28660.94, then rebounded to close at 30038.72, after hitting intraday high at 30168.54. There is no convincing explanation to the reversal. Some said investors saw the set of data as a "last gasp" for rising inflation. But after all, Fed is set to continue with aggressive tightening and there is no clear sign on where interest rate would really peak.
Anyways, immediate focus is now on 30454.46 resistance in DOW. Firm break there will complete a double bottom pattern, and bring stronger rebound through 55 day EMA (now at 30914.85) in the near term. Rejection by 30454.46 should set the stage for resuming the down trend through 28660.94 later in the month.
In either case, there is no clear sign of trend reversal for now, and the whole pattern from 36965.83 should still extend to 100% projection of 36965.83 to 29653.29 from 34281.36 at 26982.00 before completion.