Sample Category Title
EUR/CHF Daily Outlook
Daily Pivots: (S1) 0.9751; (P) 0.9774; (R1) 0.9810; More....
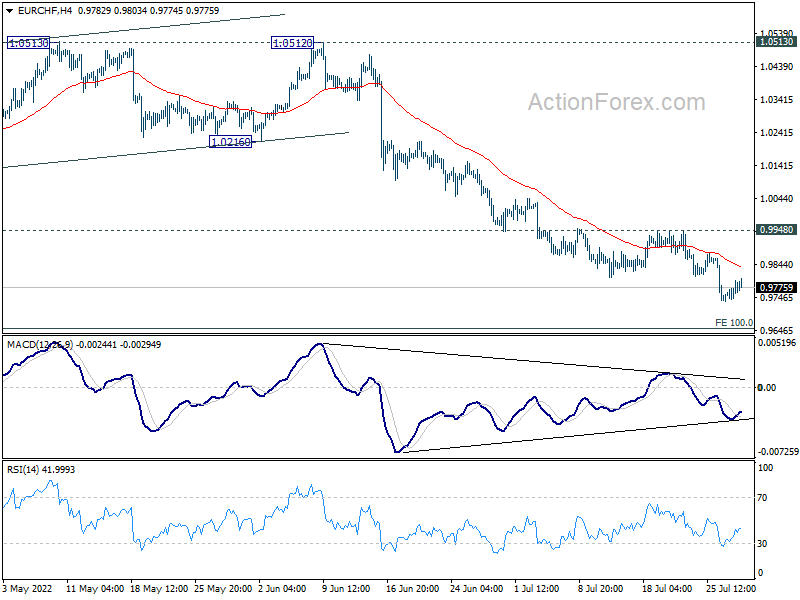
EUR/CHF is losing downside momentum again. But further decline is still expected as long as 0.9948 resistance holds. Current down trend should target 0.9650 long term projection level. On the upside, however, considering bullish convergence condition in 4 hour MACD, break of 0.9948 should confirm short term bottoming. Intraday bias will be back to the upside for further rebound.
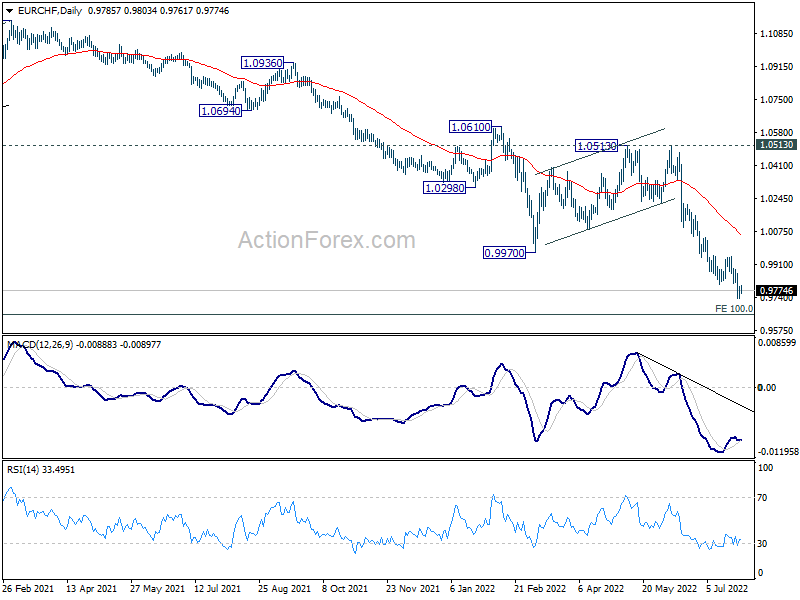
In the bigger picture,long term down trend from 1.2004 (2018 high) is expected to target 100% projection of 1.2004 to 1.0505 to 1.1149 at 0.9650. On the upside, break of 1.0513 resistance is needed to indicate medium term bottoming. Otherwise, outlook will stay bearish in case of strong rebound.
Ethereum Outperforms Bitcoin as Merge Continues to Attract Attention
The major cryptocurrencies have been steadily climbing since mid-June, recovering somewhat from the heavy losses suffered from April and emulating the stock rebound on Wall Street. Bitcoin has gained a healthy 30% from the June low point, but its rival Ether – the world’s second most popular crypto – has staged an even more impressive comeback, rallying by about 90%. Although Ether is known to be more volatile than Bitcoin, there is more than just the bounce back in broader risk assets driving this upswing.
The merge
Ethereum – the blockchain-based platform that processes the payments made via Ether – will receive a major upgrade on September 19 when the network will merge with Beacon Chain, replacing the existing proof-of-work (PoW) mechanism with a proof-of-stake (PoS) one. PoW is currently how most cryptocurrencies like Bitcoin are mined. But this system is seen as inefficient as it requires a lot of computing power to validate incoming transactions and transaction speeds are slow. It can also be quite costly for would-be miners to invest in the right software and hardware equipment.
In comparison, PoS uses less energy, is faster and does not require miners. Instead, PoS has validators who don’t need any specialized equipment to participate. However, it does have one major drawback, which is it’s not as secure as the more proven PoW system.
A supply shock?
But the most important distinction between the two is that in proof of stake, validators have to ‘stake’ a certain amount of their coins or tokens as a form of guarantee. This is in fact the primary concept on which the PoS mechanism is built upon in that it assumes that participants staking their funds will want to do things correctly to maintain the integrity of the blockchain network so as not to lose their stake.
And this is what could prove to be a game changer for Ether and Ethereum as the method of staking will significantly reduce the supply of the coin in circulation. The annual issuance of new Ether is also expected to be affected as the amount will be determined by how much validators stake rather than the current fixed rate of approximately 4.5 million a year.
The potential deflationary impact of the switch from PoW to PoS is what’s spurring this speculative interest in Ethereum, magnifying its upside whenever cryptos are rallying.
Bullish hopes
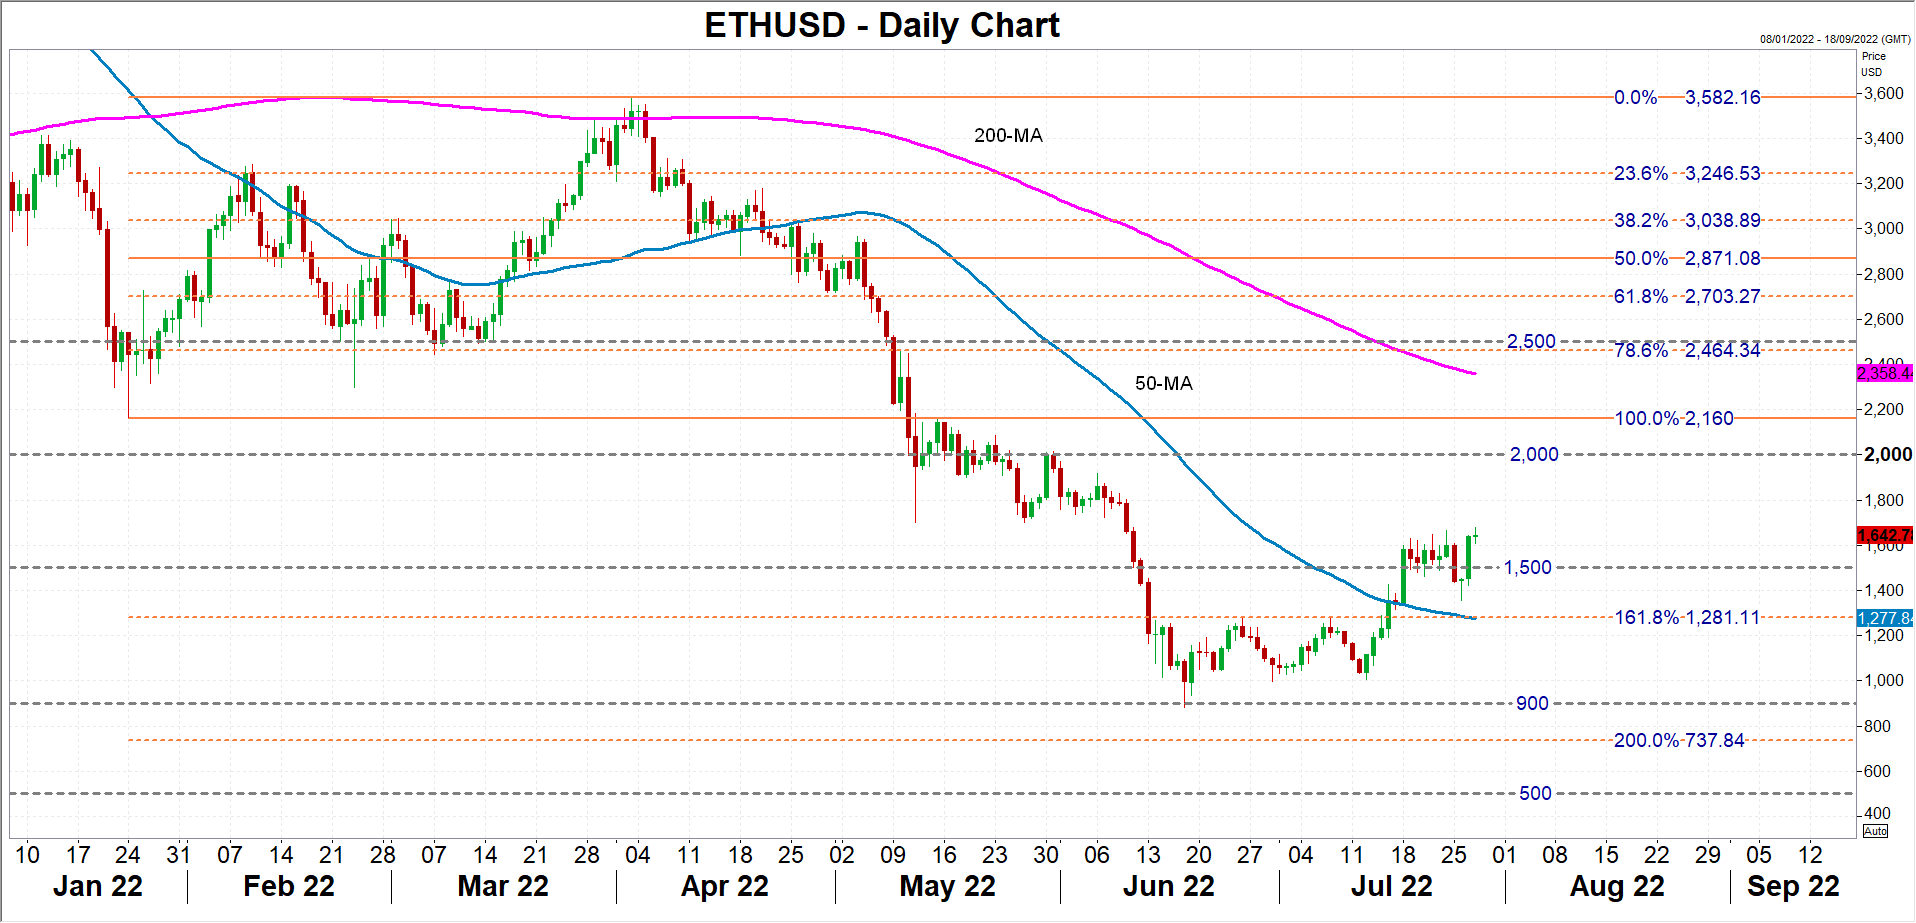
The price of ETHUSD hit a six-week high of $1,677.51 on Thursday. If the positive momentum gathers more steam, the $2,000 level will likely be eyed next before challenging the heavily congested region of $2,500.
The problem for the bulls, though, is that a more meaningful rally may not come until after the merge in September. An improvement in the macroeconomic environment by year-end might also propel Ethereum and other cryptocurrencies higher if inflationary pressures begin to moderate in the coming months and central banks like the Fed pause hiking interest rates.
Equity markets are already encouraged by the possibility of rate cuts in 2023 despite the increasing prospect of a recession in the interim and many traders are betting that stocks have bottomed out. Given how strong the positive correlation between equities and cryptos has grown this year, this could also be true for the crypto market.
Uncertainties ahead
However, it’s also possible that the worst has yet to come. For example, Europe’s energy crisis may only just be unfolding, and the Fed risks overestimating the spending power of the US consumer. If stocks tumble again, so would cryptos.
A sharp selloff could push ETHUSD towards the 50-day moving average, which is converging with the 161.8% Fibonacci extensions of the January-April uptrend around $1,280. A breach below it would pave the way for the $900 support zone, which defended the price back in June, while steeper declines could stretch until the $500 level.
Another risk and one that is more specific to cryptos is the liquidity problems facing some crypto lending and exchange platforms such as Coinbase. It comes after crypto lenders Celsius Network and Voyager Digital recently filed for bankruptcy, fuelling fears of full-scale liquidity crisis.
More upgrades to come
For Ethereum, the hype around the upcoming merge could yet cushion it against another crash, or at the very least, expedite any rebound that follows. Moreover, further updates are planned for Ethereum, such as the ‘surge’ upgrade that will boost its transaction processing capabilities. Hence, this phase of outperformance may only be just starting.
WTI Futures Extend Sideways Move Supported by 200-SMA
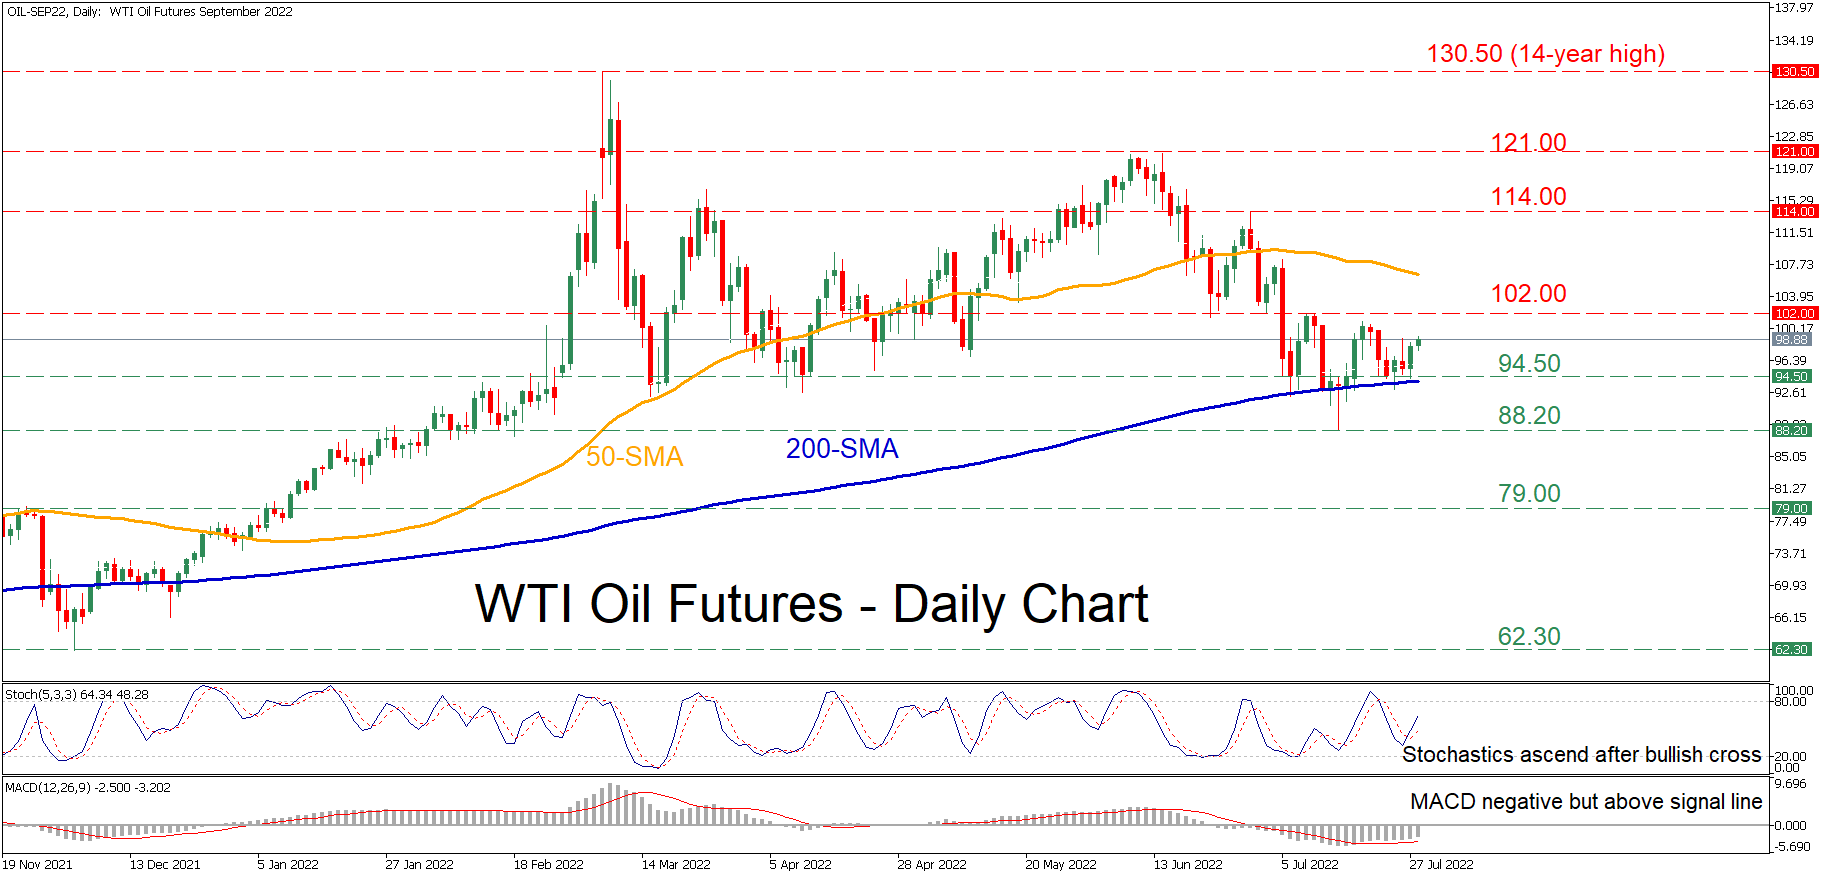
WTI oil futures (September delivery) have been losing ground since early June when the price failed to surpass the 121.00 mark. However, a further decline has been rejected multiple times by the 200-day simple moving average (SMA) and the price has currently adopted a rangebound pattern.
The momentum indicators suggest that near-term risks are tilted to the upside. Specifically, the stochastic oscillator is sloping upwards after posting a bearish cross, while the MACD histogram has jumped above its red signal line but remains in the negative territory.
Should the negative momentum strengthen, the price might encounter support at 94.50, which overlaps with the 200-day SMA. Sliding below that floor, the commodity could descend towards the recent low of 88.20 before the spotlight turns to 79.00. Failing to halt there, the December low of 62.30 might prove to be a tough obstacle for the bears to overcome.
On the flipside, bullish actions could propel the price towards 102.00, which is the upper boundary of the recent sideways pattern. Conquering this barricade, the bulls could aim for 114.00 before the price challenges the crucial resistance region of 121.00. An upside violation of the latter could open the door for the 14-year high of 130.50.
Overall, the recent sell-off in WTI oil futures is likely to resume, bringing the 200-day SMA under examination again. Nevertheless, a profound break above the 100 psychological mark might attract further buying interest and enable the commodity to post a strong rebound.
Fed Boosted Bitcoin
Bitcoin has surpassed the $23170 mark, adding more than 9% in the past 24 hours. Ethereum jumped 13% to $1640. Other leading altcoins in the top 10 have gained between 6% (BNB) and 15% (Polkadot).
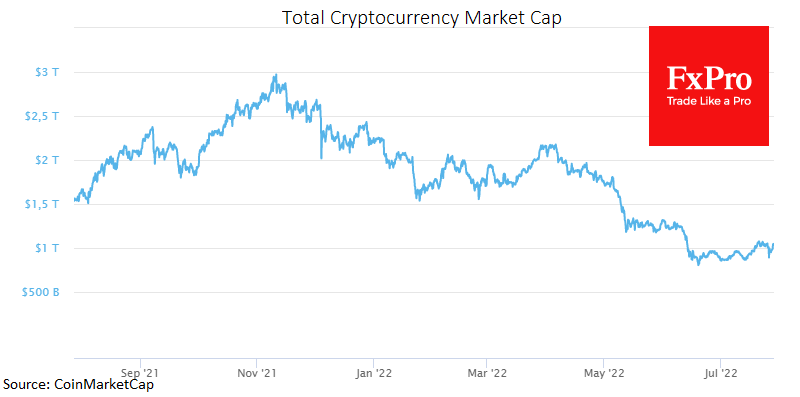
The total capitalisation of the crypto market, according to CoinMarketCap, rose 8.9% overnight to $1.06 trillion.
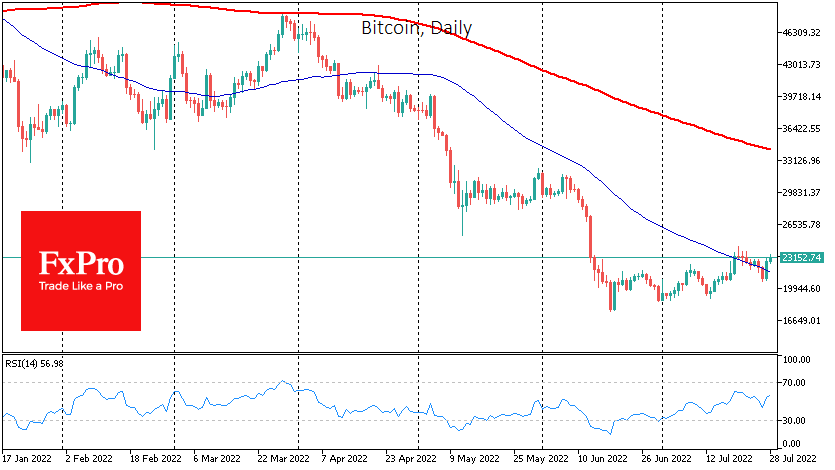
Bitcoin buying picked up sharply on Wednesday following the Fed’s decision and subsequent comments. The crypto market has once again proved that it is growing stronger than equities regarding restoring demand for risky assets. While policy tightening is a negative for asset valuation, it was already priced in, and the subsequent relatively neutral signals from Chairman Powell added strength to new buying in equities and cryptocurrencies.
Technically, BTCUSD has moved back above its 50-day moving average in a strong move and continues to rise as of Thursday morning. We will draw attention to the $24K area, where earlier in July, growth momentum stalled. The ability to gain further strength could increase the confidence of the market participants that the bottom is behind us.
The International Monetary Fund (IMF) released a report on the global economy, noting that the fall in the cryptocurrency market has not affected the global financial system’s stability. The IMF suggests that the crypto market will undergo a painful transformation, with a string of bankruptcies of cryptocurrency companies continuing.
Katie Wood’s ARK Invest fund sold $75m worth of Coinbase shares because of an SEC investigation. The regulator accuses some former top Coinbase executives of insider trading.
According to media reports, the US Treasury suspects cryptocurrency exchange Kraken is violating sanctions against Iran.
The US Consumer Financial Protection Bureau (CFPB) will investigate the use of digital currencies for payments and increase oversight of technology companies as they enter the traditional financial sector.
Tether, the issuer of USDT, the biggest by capitalisation stablecoin, has promised to zero in on commercial paper reserves from the current $3.7bn no later than November and clarified that they do not hold Chinese securities.
USD/CAD: Minor Waves Y and Z Tend to Qquality?
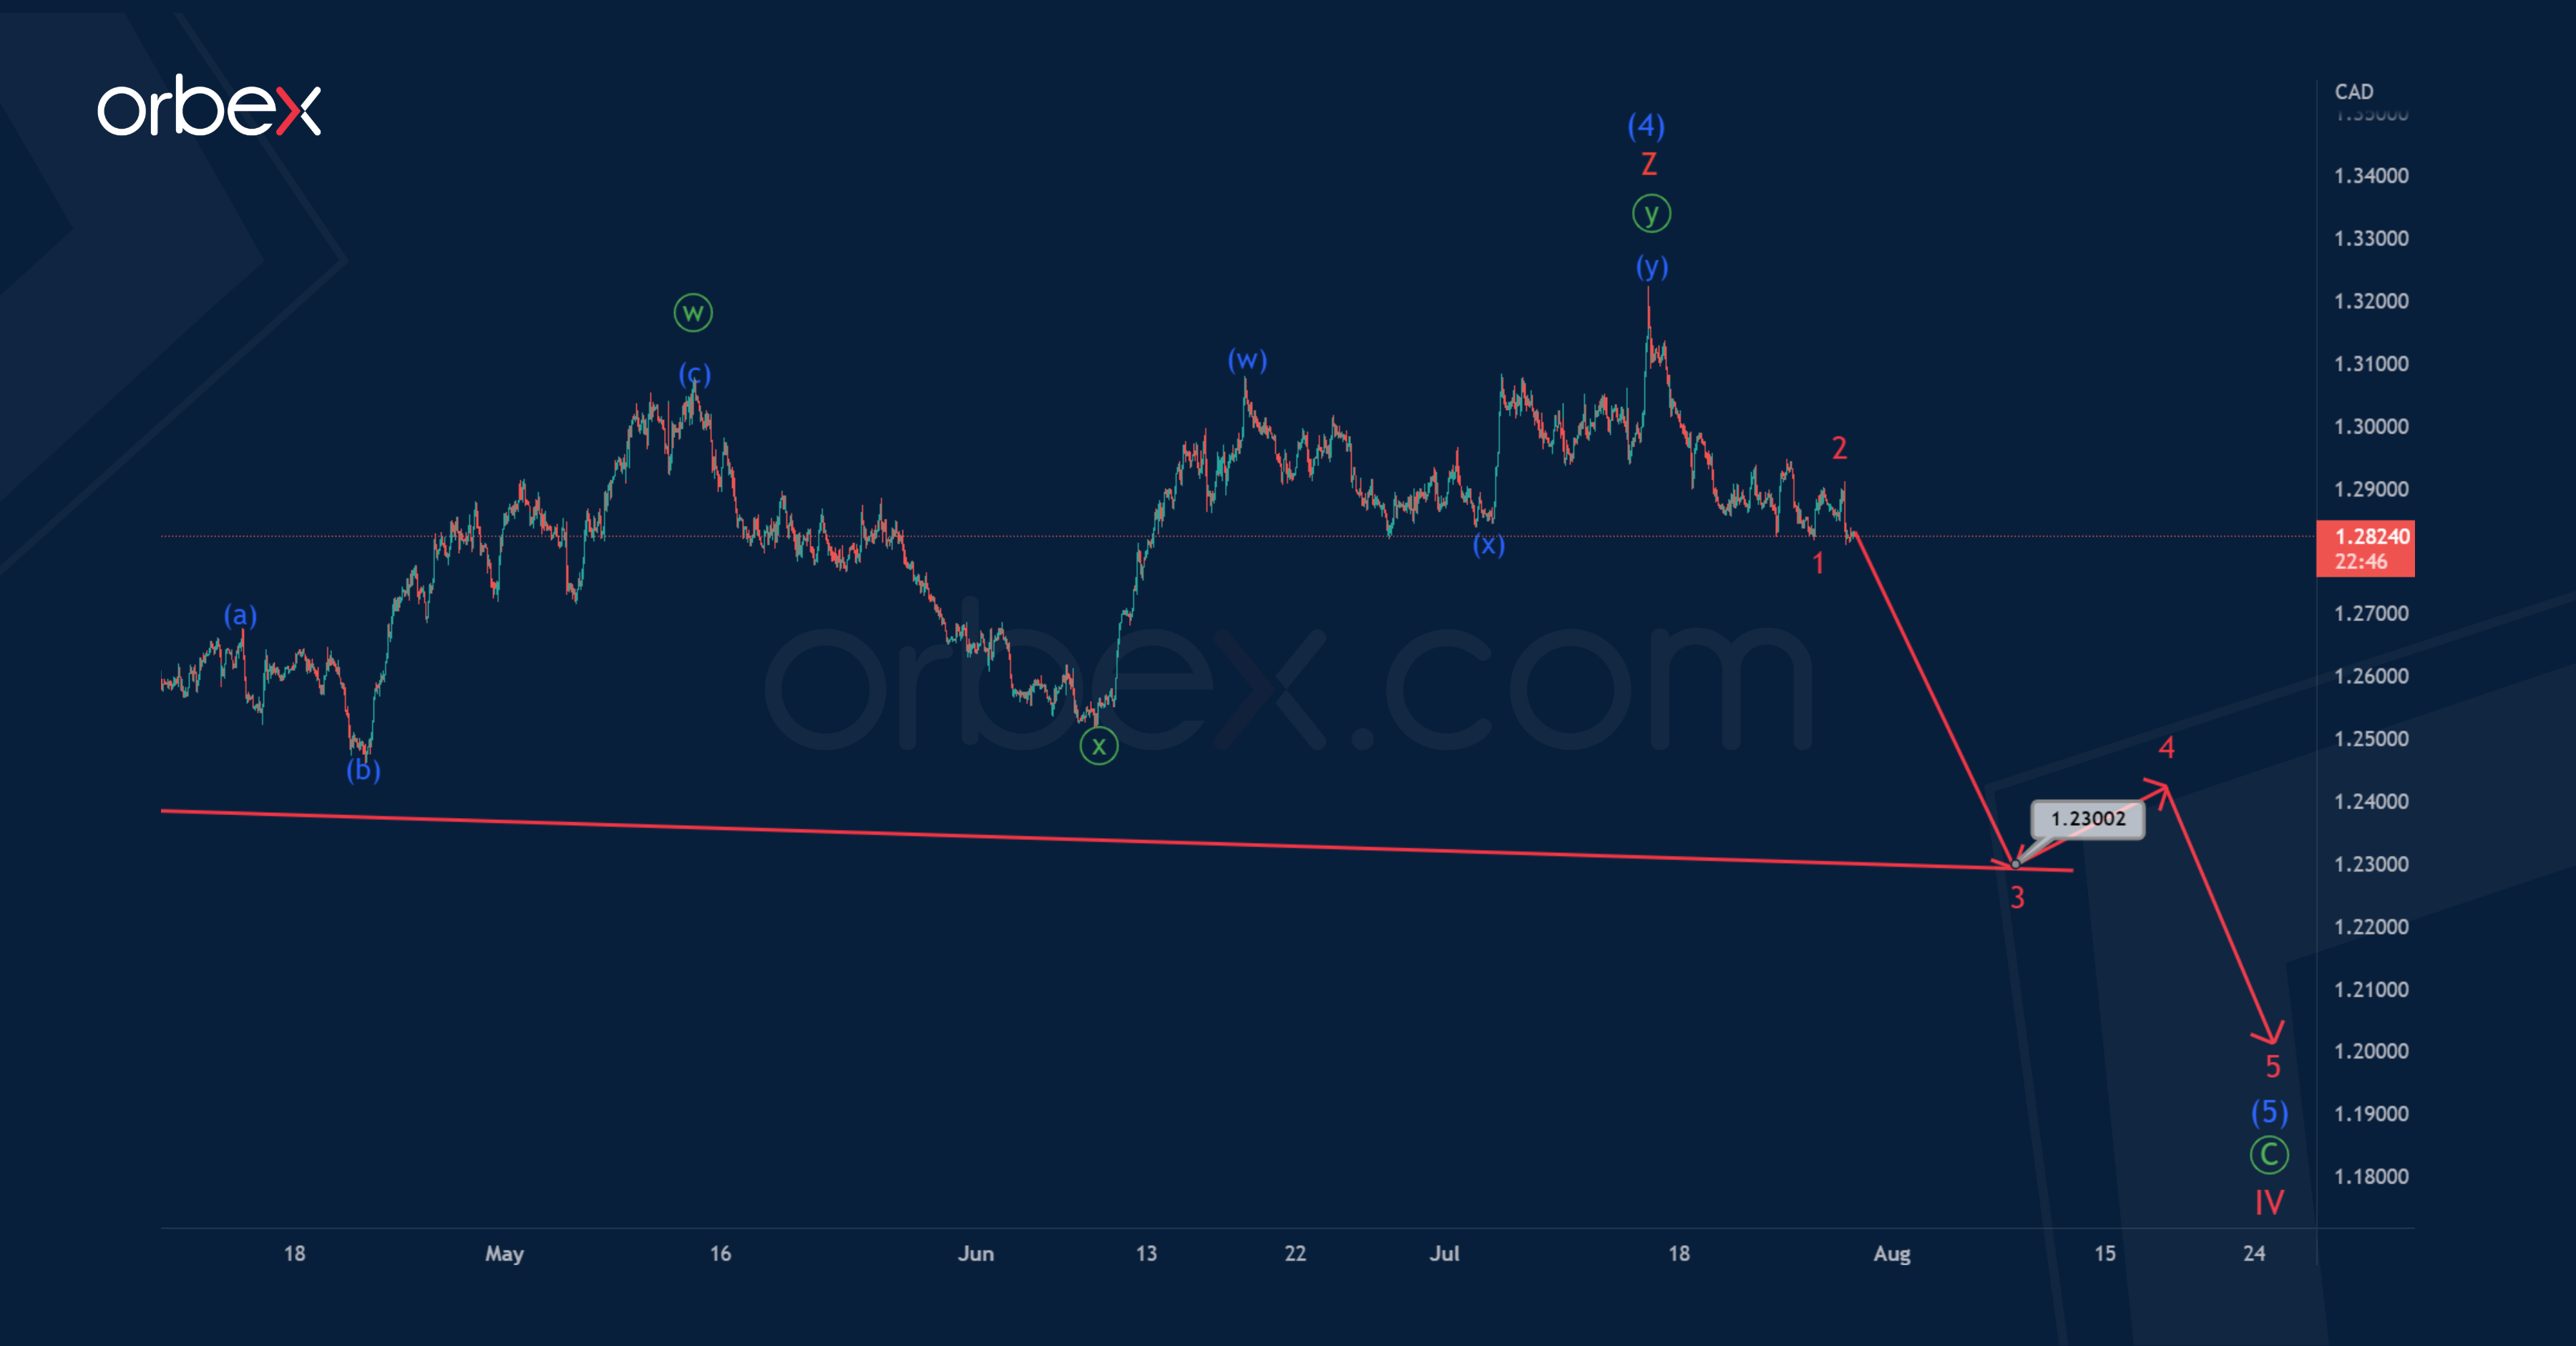
USDCAD seems to be forming a long-term correction wave (4) of the intermediate degree, which is part of the global downward impulse –– of the primary degree.
Perhaps the correction wave (4) is a side wave consisting of minor waves W-X-Y-X-Z. Most likely, the W-X-Y-X sub-waves have already been fully built. Not so long ago, the second intervening wave X was completed, and now the price is rising in the final wave Z, taking the form of a minute double zigzag.
The growth rate in the minor wave Z is possible to 1.332. At that level, wave Z will be at 100% of previous actionary wave Y.
Then, after reaching the specified price level, a market reversal is possible and the beginning of a decline in a bearish impulse (5).
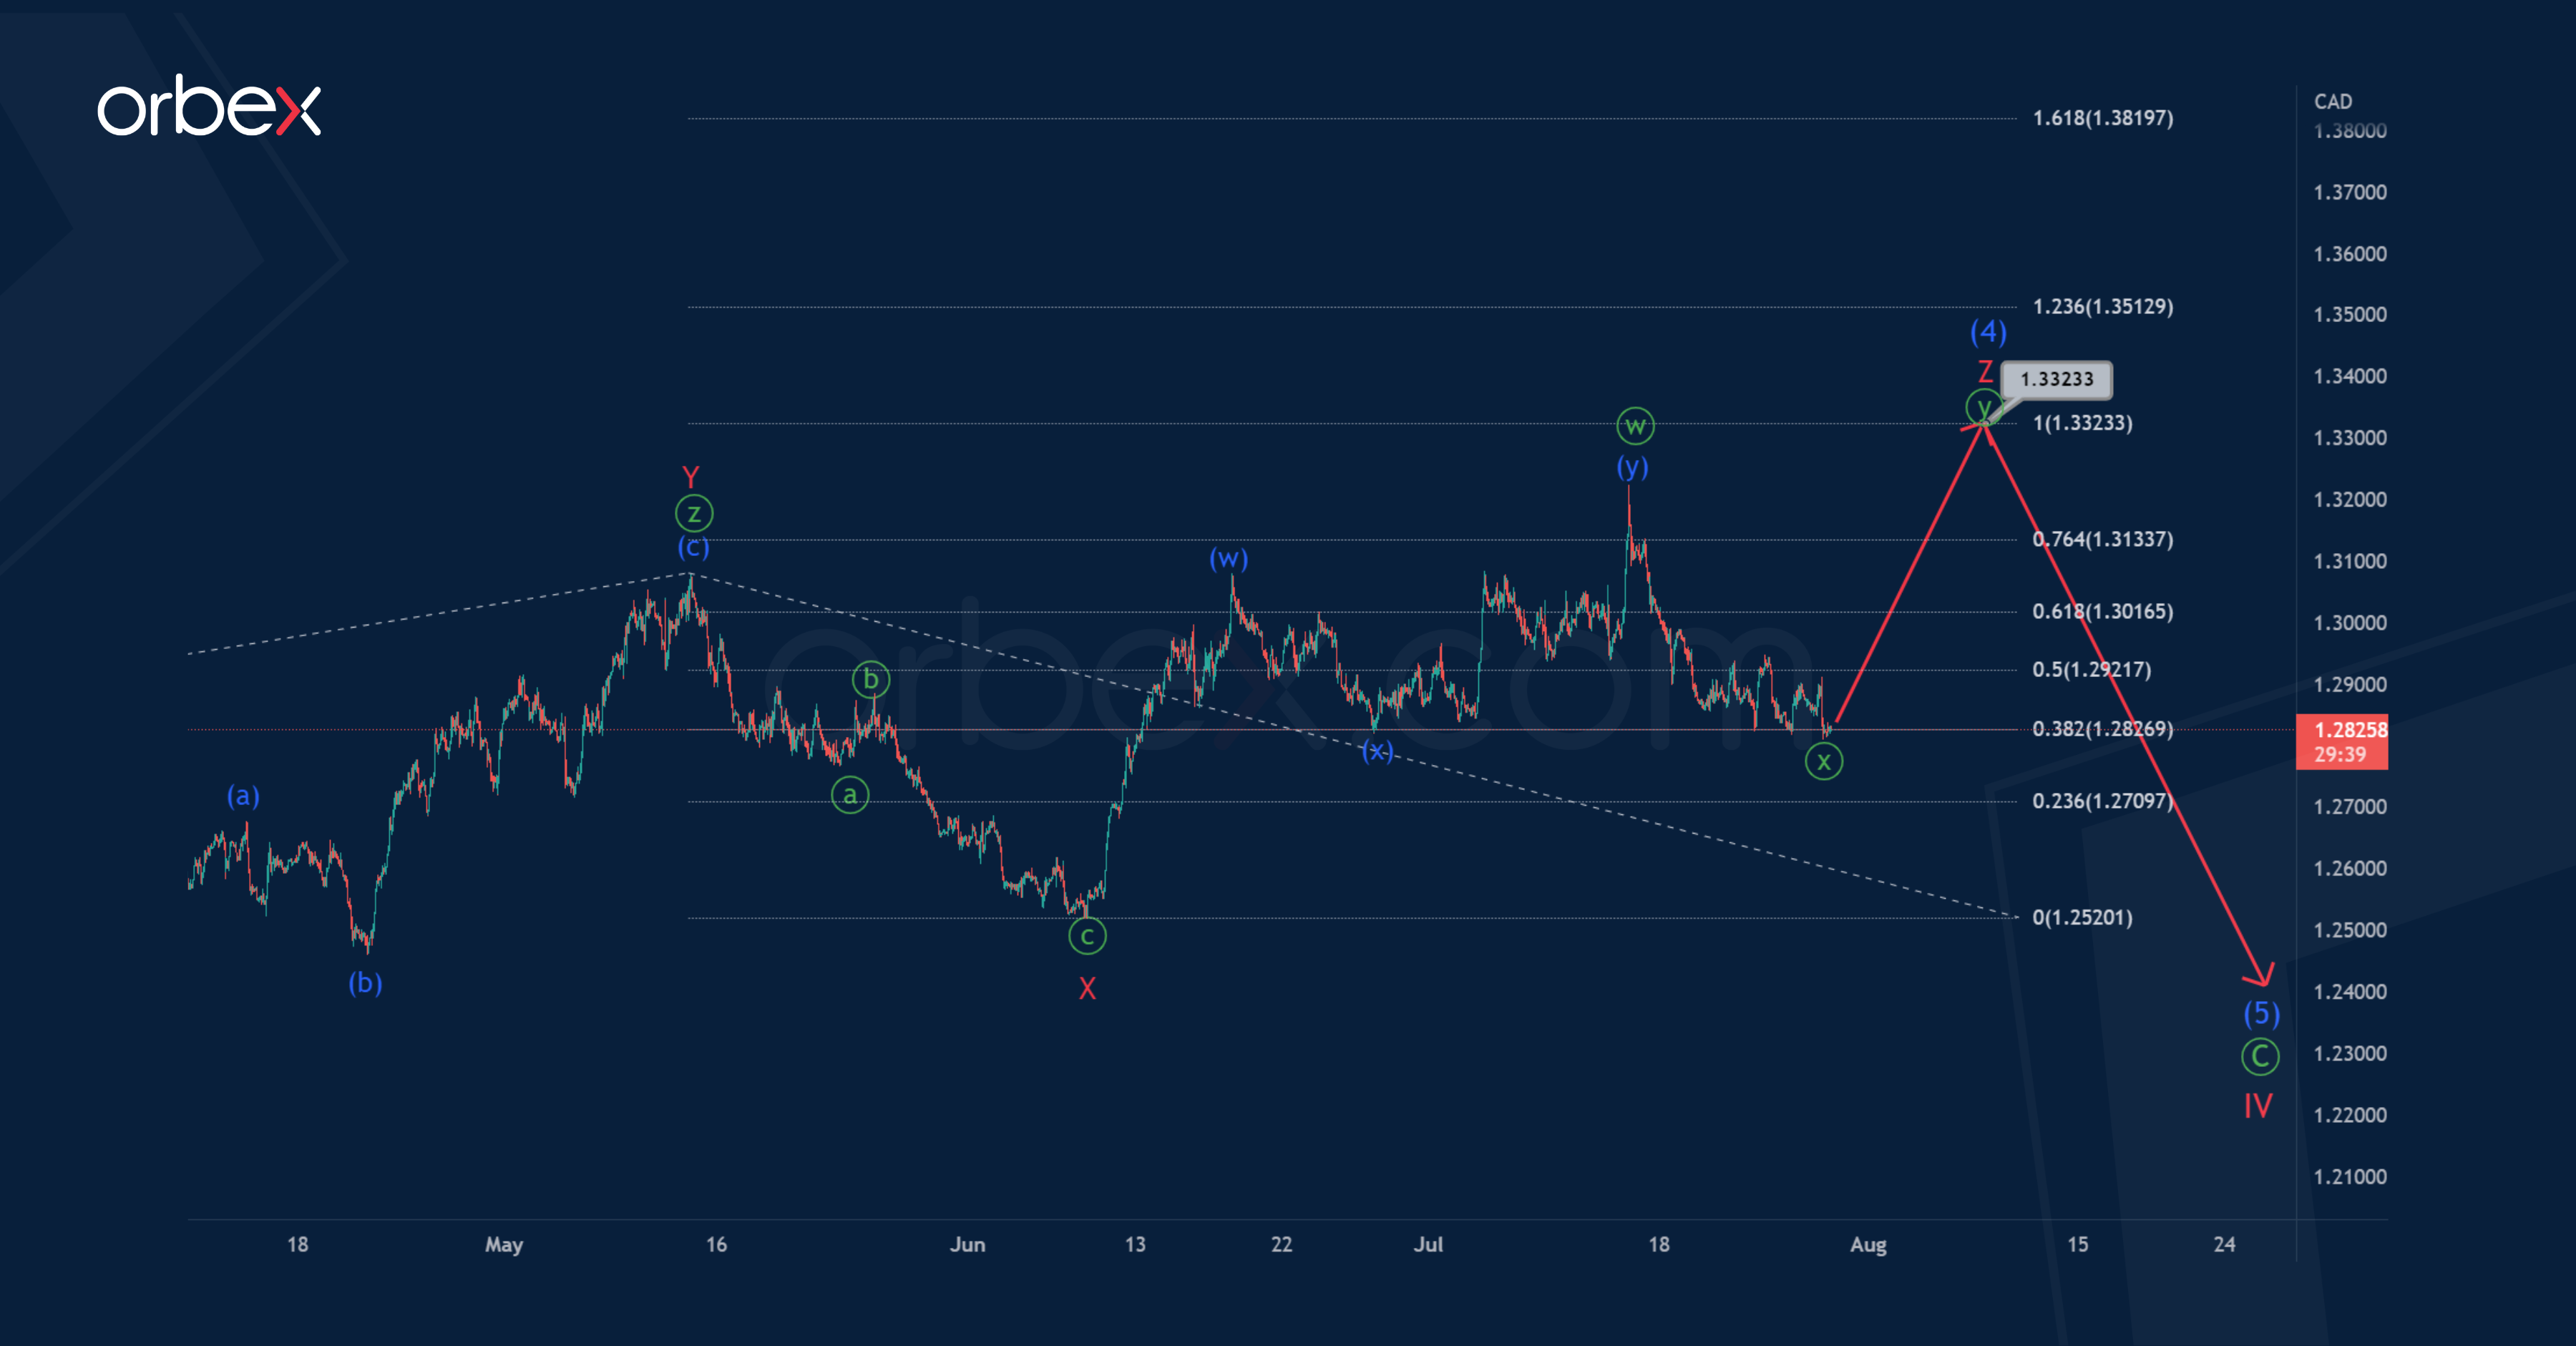
According to an alternative option, the formation of an intermediate corrective wave (4) could be fully completed. Therefore, let's assume that the first sub-waves of the descending intermediate impulse (5) are being formed.
It is possible that impulse 1 and bullish correction 2 have been fuly completed today, and now we see a decline in the minor wave 3.
The target for bears is at the support level of 1.230, this level is located on the red line drawn through the ends of the descending waves –– and X. At the level of 1.230, a market reversal may occur and the formation of a minor correction 4 may begin.
An approximate scheme of possible future movement is shown on the chart.
AUDUSD Surges Above the Downtrend Line, Testing 0.7000
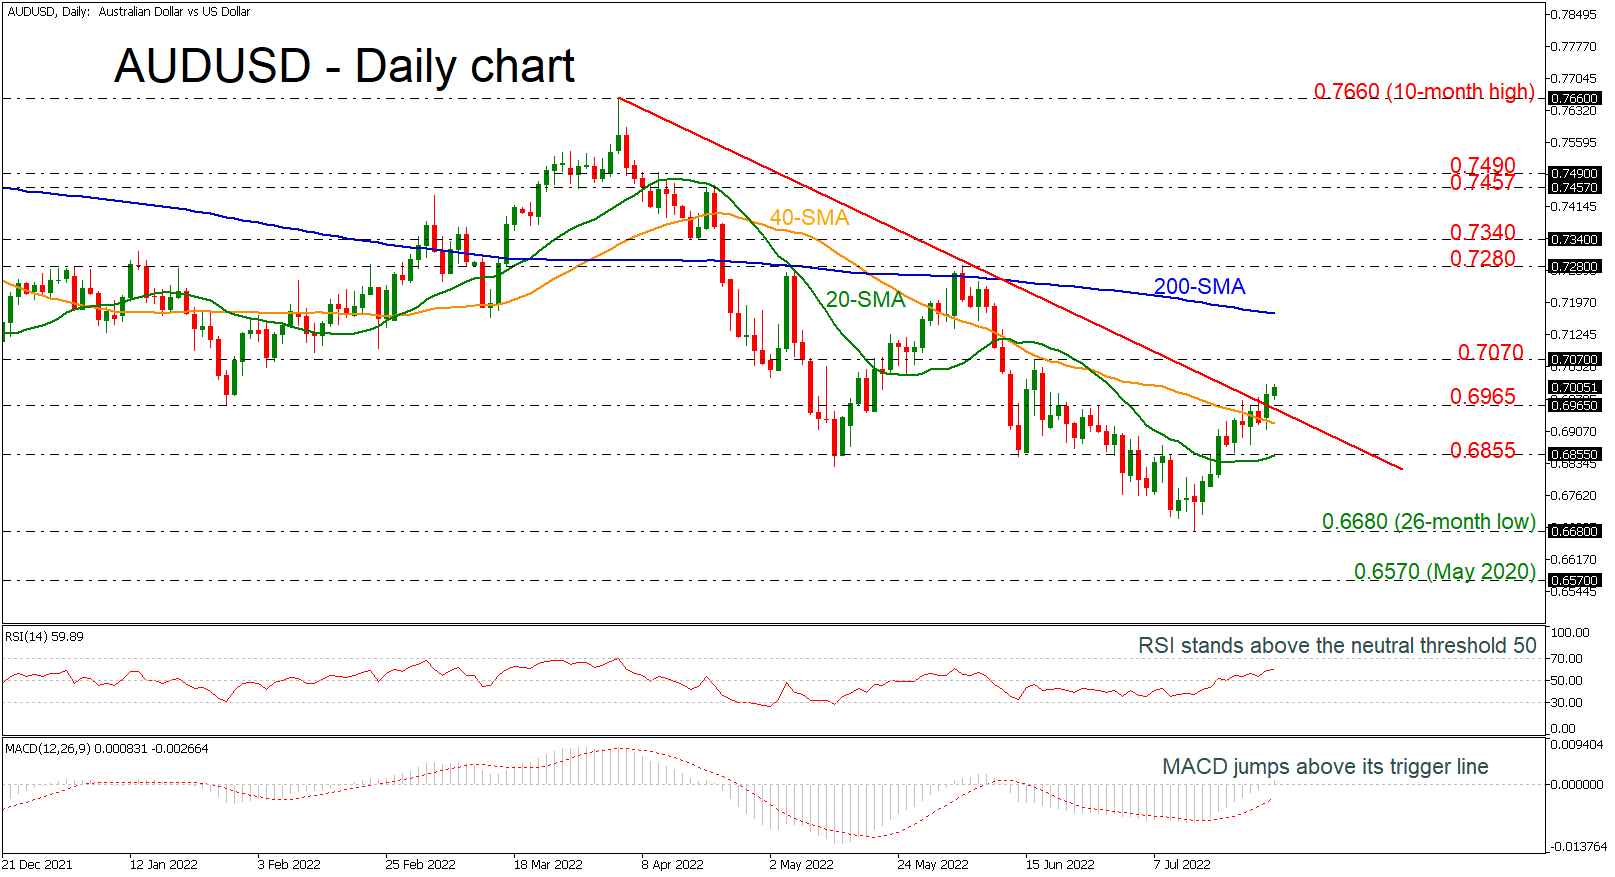
AUDUSD is surging above the medium-term descending trend line, adding some optimism for a short-term bullish bias. The simple moving averages (SMAs) are also confirming this move as they are pointing upwards, and the technical indicators are holding in a positive territory. The RSI is sloping north above the 50 level, while the MACD is increasing its momentum above its trigger and zero lines.
If buying interest intensifies, resistance may originate from the 0.7070 peak ahead of the 200-day SMA at 0.7170. Overcoming this strong line, the price may make a jump for the 0.7280-0.7340 restrictive region.
In case of negative pressures, initial tough support could develop from the immediate 0.6965 level before meeting the 20-day SMA, which overlaps with the 0.6855 barrier. Diving beneath this too the 26-month low of 0.6680 obstacle may also attempt to halt further losses.
In brief, the very short-term bias is bullish after the rebound off 0.6680 but the broader outlook may change if there is rise beyond the 200-day SMA.
Powell Sparks Buy Everything Rally
You had the feeling that Wall Street, with perpetually itchy buy-button trigger fingers, was primed for this FOMC. As expected, the FOMC raised the Fed Funds target by 0.75%, to a target range of 2.25%-2.50%. It was what Mr Powell said afterwards that turbocharged the FOMO gnomes of Wall Steet. Mr Powell said that it may be appropriate to slow the pace of increases going forward and that the decision on that would become a meeting to meeting one, effectively throwing out the forward guidance.
I should also mention that Mr Powell couched that by saying that he “wouldn’t hesitate” to implement sharper increases if the data warranted it. For some time, the US bond markets have been pricing a US recession, inflation peaking and falling by early 2023, and Fed rate cuts to start in H2 2023. Therefore, markets happily ignored the “wouldn’t hesitate” remarks and concentrated solely on the potentially slower pace of rate hikes bit, ignoring the fact that the Fed still seems intent on getting to a 3.50% terminal rate; it's just whether it happens sooner or later.
The result was predictable, of course. The street piled into the buy everything, sell US Dollars trade. Wall Street soared, led by the rate-sensitive Nasdaq, which booked over four per cent gains. In my mind, the big winner was Meta, as the buy everything trade limited the fallout of their poor earnings results and forward guidance. Cryptos rallied, Bitcoin rising over 8.0%, meaning that in addition to being a haven asset, an inflation hedging asset, a Dollar debasement hedge, and a deflation hedge, it is now a peak Fed/Fed Funds hedge. I’m impressed. Even gold rallied overnight, but US bond markets were surprisingly steady, suggesting that for once, a plan had come together perfectly.
Asian currencies didn’t really catch a tailwind either, although they may play some catchup today. Early price action on Asia-Pacific equities shows only modest gains and certainly not FOMO gnome exuberance. It could be that Asia is also watching rising oil prices, China’s covid zero and property market travails, Europe’s imminent gas-induced recession, and the ongoing Ukraine-Russia conflict giving them a more nuanced and less narrow world view, which doesn’t end at the East and West coasts of the United States.
The big winner in Asia looks like it's going to be the Japanese Yen. US bond markets look extremely comfortable with their peak-yield stance right now, and I would have to say that the highs we saw in June could well be the highs in US yields for this cycle. USD/JPY has fallen by 1.0% in Asia today, and long USD/JPY remains a crowded trade executed at unattractive levels. I can well imagine USD/JPY trading at 132.00 now before it sees 138.00 again. It is ironic that it seems just a couple of weeks ago, there was so much noise about getting back in the “widow maker” trade, selling Japanese 10-year JGBs to break the Bank of Japan and stop USD/JPY from rising above 150.00. I think they must have been former $200 oil forecasters or “institution” crypto spokespeople in a different life. Thankfully dear readers, the voice of reason is still here for you.
We don’t have another FOMC meeting until the 21st of September now, and a lot of water could flow under the inflationary bridge before then. The FOMC’s priority is inflation, and the data flow they are now relying on could well be either good news or bad news on that front. With forward guidance sub-contracted out to data flow from now on by the Fed, we can assume that volatility gyrations will remain elevated, becoming “operations normal.” Thus, assuming the “buy-everything” trade will now be a one-way ticket to investor nirvana is perilous. That reality will seep into markets eventually, but perhaps not this week.
US GDP could well print a second negative quarter this evening, but forecasts vary widely. Perversely, a negative print will probably see another stock market rally and US Dollar sell-off in the context of the price action overnight. The PCE Index data tomorrow, if it shows signs of waning, could see a rinse repeat. It is a strange world where an impending US recession is a signal to pile aggressively into stocks, let alone richly valued technology stocks; I guess you could justify it by saying that financial markets are “forward-looking.”
Today’s calendar in Asia is light once again. Australian Retail Sales missed forecasts, rising just 0.20% in June. That’s perhaps the first recent data I can recall from Australia that wasn’t showing the Lucky Country being as lucky as ever. Tighter monetary conditions may finally be forcing the Battlers to shop less, but given the above forecast inflation print yesterday, it won’t dissuade the Reserve Bank Of Australia from hiking by 0.50% at its next meeting.
Presidents Xi and Biden are due to have a phone call today. US tariff reduction seems to have fallen off the news headlines, and there may be no moves there. China may well be more concerned about the US reiterating the one-China policy and Taiwan. I expect not much to emerge from the phone call and even less to impact markets.
Ahead of the US GDP data tonight, we receive German Inflation for July, which is expected to ease slightly to 7.20% from 7.40%. A higher print will jangle the nerves of investors and give the ECB more unenviable food for thought. Overall, Germany and Europe’s fate is much more closely tied to the Russian natural gas situation and, to a lesser extent, Italian politics. EUR/USD did manage to book an 80 pip gain to 1.0200 overnight but looks in danger of stalling once again. The peak-Fed, buy everything trade, is still in danger of passing Europe by.
Asian equities rise post-FOMC
As outlined above, the Powell post-FOMC remarks saw Wall Street explode higher overnight, led by the Nasdaq. Asian markets are duly following suit, moving higher this morning, but not markedly so, and with nothing like the FOMO rally seen on Wall Street overnight. It seems that Asia is struggling to move China risks, US recession risks, European recession risks, and slowdowns in the region where inflation is playing catchup. That appears to be tempering enthusiasm, and I am sure the rise in oil prices this week isn’t helping either.
Overnight, the post-FOMC rally saw the S&P 500 finish 2.62% higher, with the Nasdaq exploding 4.02% higher, while the Dow Jones gained just 1.37%. There was a definite peak-interest-rate bias to the stock market rally, as evidenced by the Nasdaq outperformance. I think it's called growth over value. Futures markets are quiet in Asia, S&P 500, Nasdaq, and Dow futures edging just 0.10% lower.
Japan’s Nikkei 255 is just 0.20% higher today, an appreciating Yen and oil prices tempering stock market gains. South Korea’s Kospi, by contrast, is 0.90% higher as the Won remains stable. China’s Shanghai Composite and CSI 300 have risen by 0.80%, but Hong Kong is just 0.10% higher, and I suspect the HKMA’s 0.75% rate hike to match the Fed’s today is dampening sentiment and raising property concerns.
In regional markets, Singapore is 0.20% higher, Taipei and Kuala Lumpur have rallied by 0.85%, with Jakarta rising by 0.65%. Manila is 1.35% higher, and Bangkok is closed for the King’s birthday today and tomorrow. Australian markets are also higher; the All Ordinaries have risen by 0.75%, with the ASX 200 gaining 0.55%.
FOMC sparks US Dollar selloff
Jerome Powell’s remarks around rate hikes being driven by data sparked a sentiment rally overnight, as markets priced in peak inflation and interest rates. With equities rallying hard, the haven US Dollar resumed its downward correction, being sold heavily versus the G-10 space. That saw the dollar index plummet by 0.70% to 106.46. The dollar index has continued falling in Asia. Taking out the rising wedge support is at 106.45 as it falls 0.22% to 106.24. A daily close under 106.45 today will be a significant technical development, signalling deeper losses towards 1.0500 and 1.0350, potentially extending to the initial 102.50 long-term breakout. Resistance is at 107.45 and 108.00.
A weaker US Dollar saw EUR/USD reverse the previous day's losses, rising by 0.81% to 1.1096 before gaining another 0.14% to 1.0215 in Asia. Despite the overnight gains, EUR/USD remains rangebound, with a weaker dollar offset by geopolitical and recession fears in Europe itself. The multi-day resistance around 1.0275 remains formidable. Only a sustained break above 1.0360 now suggests a longer-term low is in place. EUR/USD has support at 1.0100 and 1.0000.
GBP/USD broke through resistance at 1.2100 overnight, on its way to a 1.04% gain to 1.04% gain to 1.2156. It has risen another 0.14% to 1.2175 in Asia. The close above 1.2100 signals a test of 1.2200 is imminent. The rally could eventually target longer-term resistance at 1.2400. Support is now at 1.2100, and then 1.1960, followed by 1.1900 and 1.1800.
USD/JPY edged 0.25% lower to 136.60 overnight but has tumbled by 0.95% to 135.30 in Asia as local investors rush to price in a peak of the US/Japan rate differential that has been behind the USD/JPY rally. Long USD/JPY is still a crowded trade, and as I have been signalling for some time, the risks of a material move lower have been increasing. The technical picture has support at 135.00 now, and USD/JPY could potentially move lower to the 131.50/132.00 if more US Dollar longs capitulate. Initial resistance is now at 136.50 and 137.50.
AUD/USD rose 0.80% to 0.6995 overnight, where it remains in Asia. NZDI/USD rose by 0.55% to 0.6265. The technical picture for both remains constructive as both currencies staged upside breakouts higher a fortnight ago. They remain well above their breakout lines at 0.6790 and 0.6145. In the short-term, AUD/USD is running into some resistance here at 0.7000, while NZD/USD faces resistance at 0.6300.
Asian currencies are mostly sharply unchanged today, with the US Dollar selloff versus the DM space passing Asia by. The Korean Won, the Chinese Yuan, and Singapore Dollar have booked only modest gains. The performance of Asian currencies today perhaps reflects the lackadaisical rally by Asian equities today, with the region's markets seemingly focused on a broader range of risks internationally. The impressive rally of oil prices this week may also be weighing on sentiment, and the Asia FX space remains, for the most part, at or near recent lows versus the US Dollar, suggesting that weakness will persist.
Oil rises once again overnight
Oil prices climbed once again overnight, boosted by a weaker US Dollar and a large drawdown of crude and gasoline stocks in the overnight official US Crude Inventory data. The inventory data was a surprise, and in combination with tumbling Russian natural gas supplies to Europe, it seems the reality that the physical market is as tight as ever is boosting prices.
Brent crude rose 2.45% overnight to $107.15 a barrel. In Asia, it has gained another 0.30% to $107.50, and it is testing formidable resistance at this level. A daily close above $108.00 would now be a significant bullish technical development targeting the 100-day moving average (DMA) at $110.15, followed by $115.00 a barrel. Support is at $104.00 and then 101.50 a barrel.
WTI rallied 2.75% higher to $98.10 overnight after the crude inventory release, gaining another 0.40% to $98.50 in Asia. WTI has resistance at $99.00, the week's highes, and then $100.00. The 200-day moving average (DMA) at $94.95 is nearby support, followed by 92.50 a barrel.
Gold rises on weak US Dollar
Gold jumped 1.0% higher to $1734.50 overnight, boosted by heavy US Dollar selling after the post-FOMC press conference. The charts continue to suggest that gold is trying to form a medium-term low; however, the price action remains underwhelming, even after the rally overnight. Softer US Dollar today and tomorrow could spur more US Dollar selling and lift gold higher, however.
Gold needs to overcome heavy resistance at the $1745.00 an ounce triple top before the gold bugs can really start to get excited. It has support at $1700.00 and $1680.00, and then the longer-term support around $1675.00 an ounce zone. A sustained failure of $1675.00 will signal a much deeper move lower targeting the $1450.00 to $1500.00 an ounce regions.
Daily Technical Analysis
EUR/USD
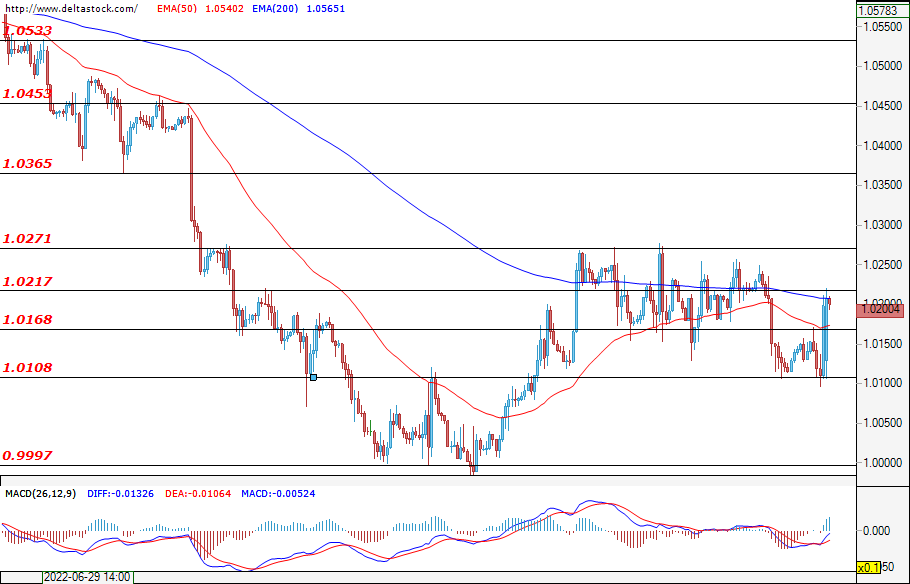
Wednesday's expectations for low volatility ahead of the Fed's decision were realised. The Euro moved steadily higher around the opening of the European session, reaching its key level of 1.0170, but quickly corrected the hard-earned pips. This attack by the bears managed to bring the euro back to around 1.0110. Everyone was waiting for the Federal Reserve's decision and when traders saw confirmation of the U.S. interest rate hike to 2.50%, followed four hours of high volatility with the same highs and lows within those hours. The 1.0170 resistance was breached and the pair managed to reach 1.0217 by the end of the day. At 12:30 GMT today, the U.S. GDP data is also expected to move the market. If the dollar continues to weaken, then the next resistance at 1.0270 can be reached, but not before the one at 1.0217 is breached. The first support is the level at 1.0168.
USD/JPY
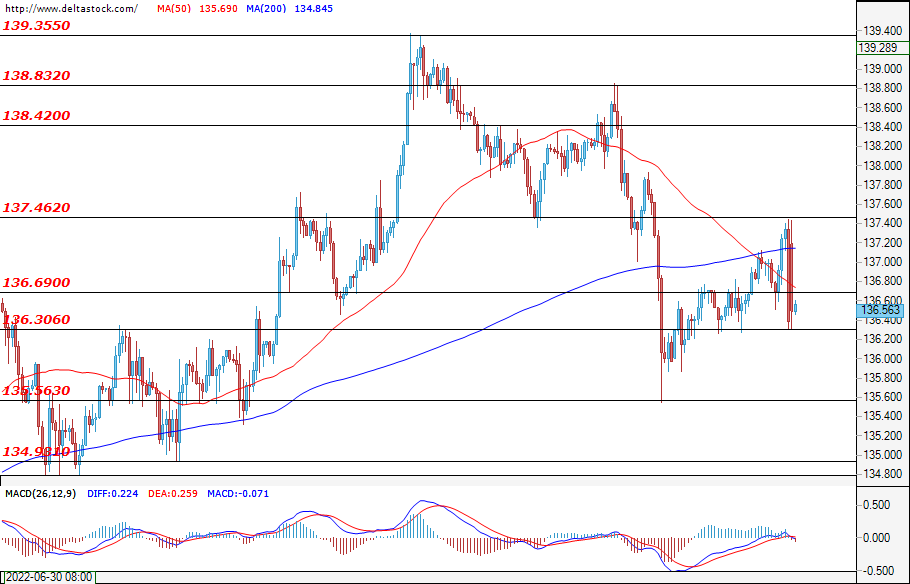
Today the USD/JPY extended its recovery from the 135.56 low, reached on Friday. The NInja slowly moved higher, managing to reach 137.46 - a key level that proved to be quite strong throughout the whole month. A correction started again even before the data came out, but the pair found a bottom around the level at 136.30. There, the bulls started to open new positions and brought the Ninja back to 137.46, but the bears prevailed once more and for the second time pushed the pair to the same bottom, where the day ended. The pair will also be influenced by the dollar strength around the U.S. GDP data at 12:30 GMT. The corrective move is expected to continue as the USD/JPY may return to 135.56 where it was at the end of last week, but if the data is positive for the dollar, the bulls will most likely gain momentum.
GBP/USD
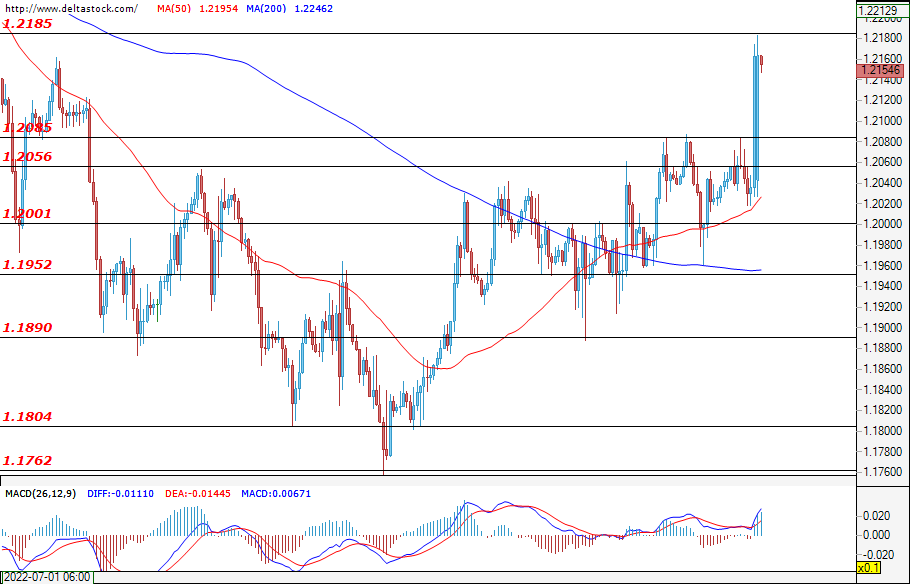
At the start of the London session, we saw a slight rise in GBP/USD, but the key level of 1.2085 managed to restrain the bulls before the Fed decision. The 75 bps hike led to four extremely volatile hours due to the fact that the market found Powel’s comments to have a more dovish tone. As a result, the dollar started to shed from its value and the aforementioned resistance was breached. There will be no specific data for the pound today, but at 12:30 GMT the U.S. Bureau of Economic Analysis will publish GDP data. If the decline of the dollar continues, we may see a new weekly high, but if the data stimulates traders to buy the dollar, then we may see a corrective move towards 1.2056.
EUGERMANY40
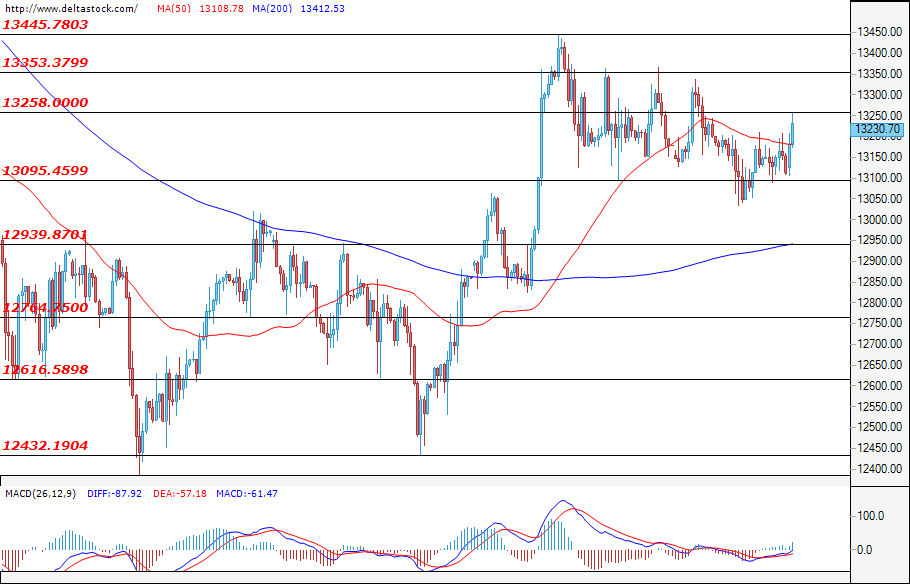
On Wednesday, the German index continued to move in its narrow range. All eyes appeared to be on the U.S. stock market and the Fed decision as liquidity was lower than usual. As the European session opened, we saw a slow decline to the 13095 support, which once again played its part and helped the index start a rally back to the upper end of its range. Today, the preliminary data on inflation in Germany is expected to be published. If the numbers appeal to traders, we could see a break of 13258 and a new weekly high, but if gas issues in Europe prove to be a problem for the German economy, we could see a negative reaction and the lower end of the range breached in search of a new bottom.
US30
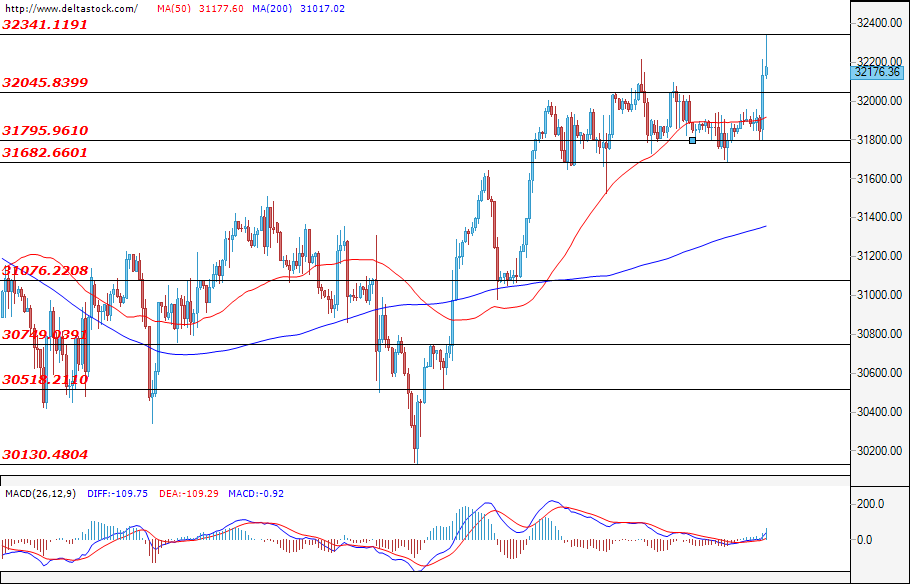
No one seemed to want to rush their positions before they were certain of the Federal Reserve decision on Wednesday. Throughout the day trading remained uneventful, but when we saw confirmation that the key interest rate will be hiked to 2.50% and heard Powel’s dovish comments, we saw a break of the front resistance at 32050. This allowed the bulls to push the price even higher and to reach a new monthly high of 32341. However, the US30 failed to continue rising or hold the levels and the index ended the day at around the current levels. Today, U.S. GDP data will be released at 12:30 GMT , and the moves we may see could lift the US30 even higher, if the data is positive. But if traders are disappointed, we may see the bottom of its weekly range – 31800, reached again.
SPX 500 Continues Upward
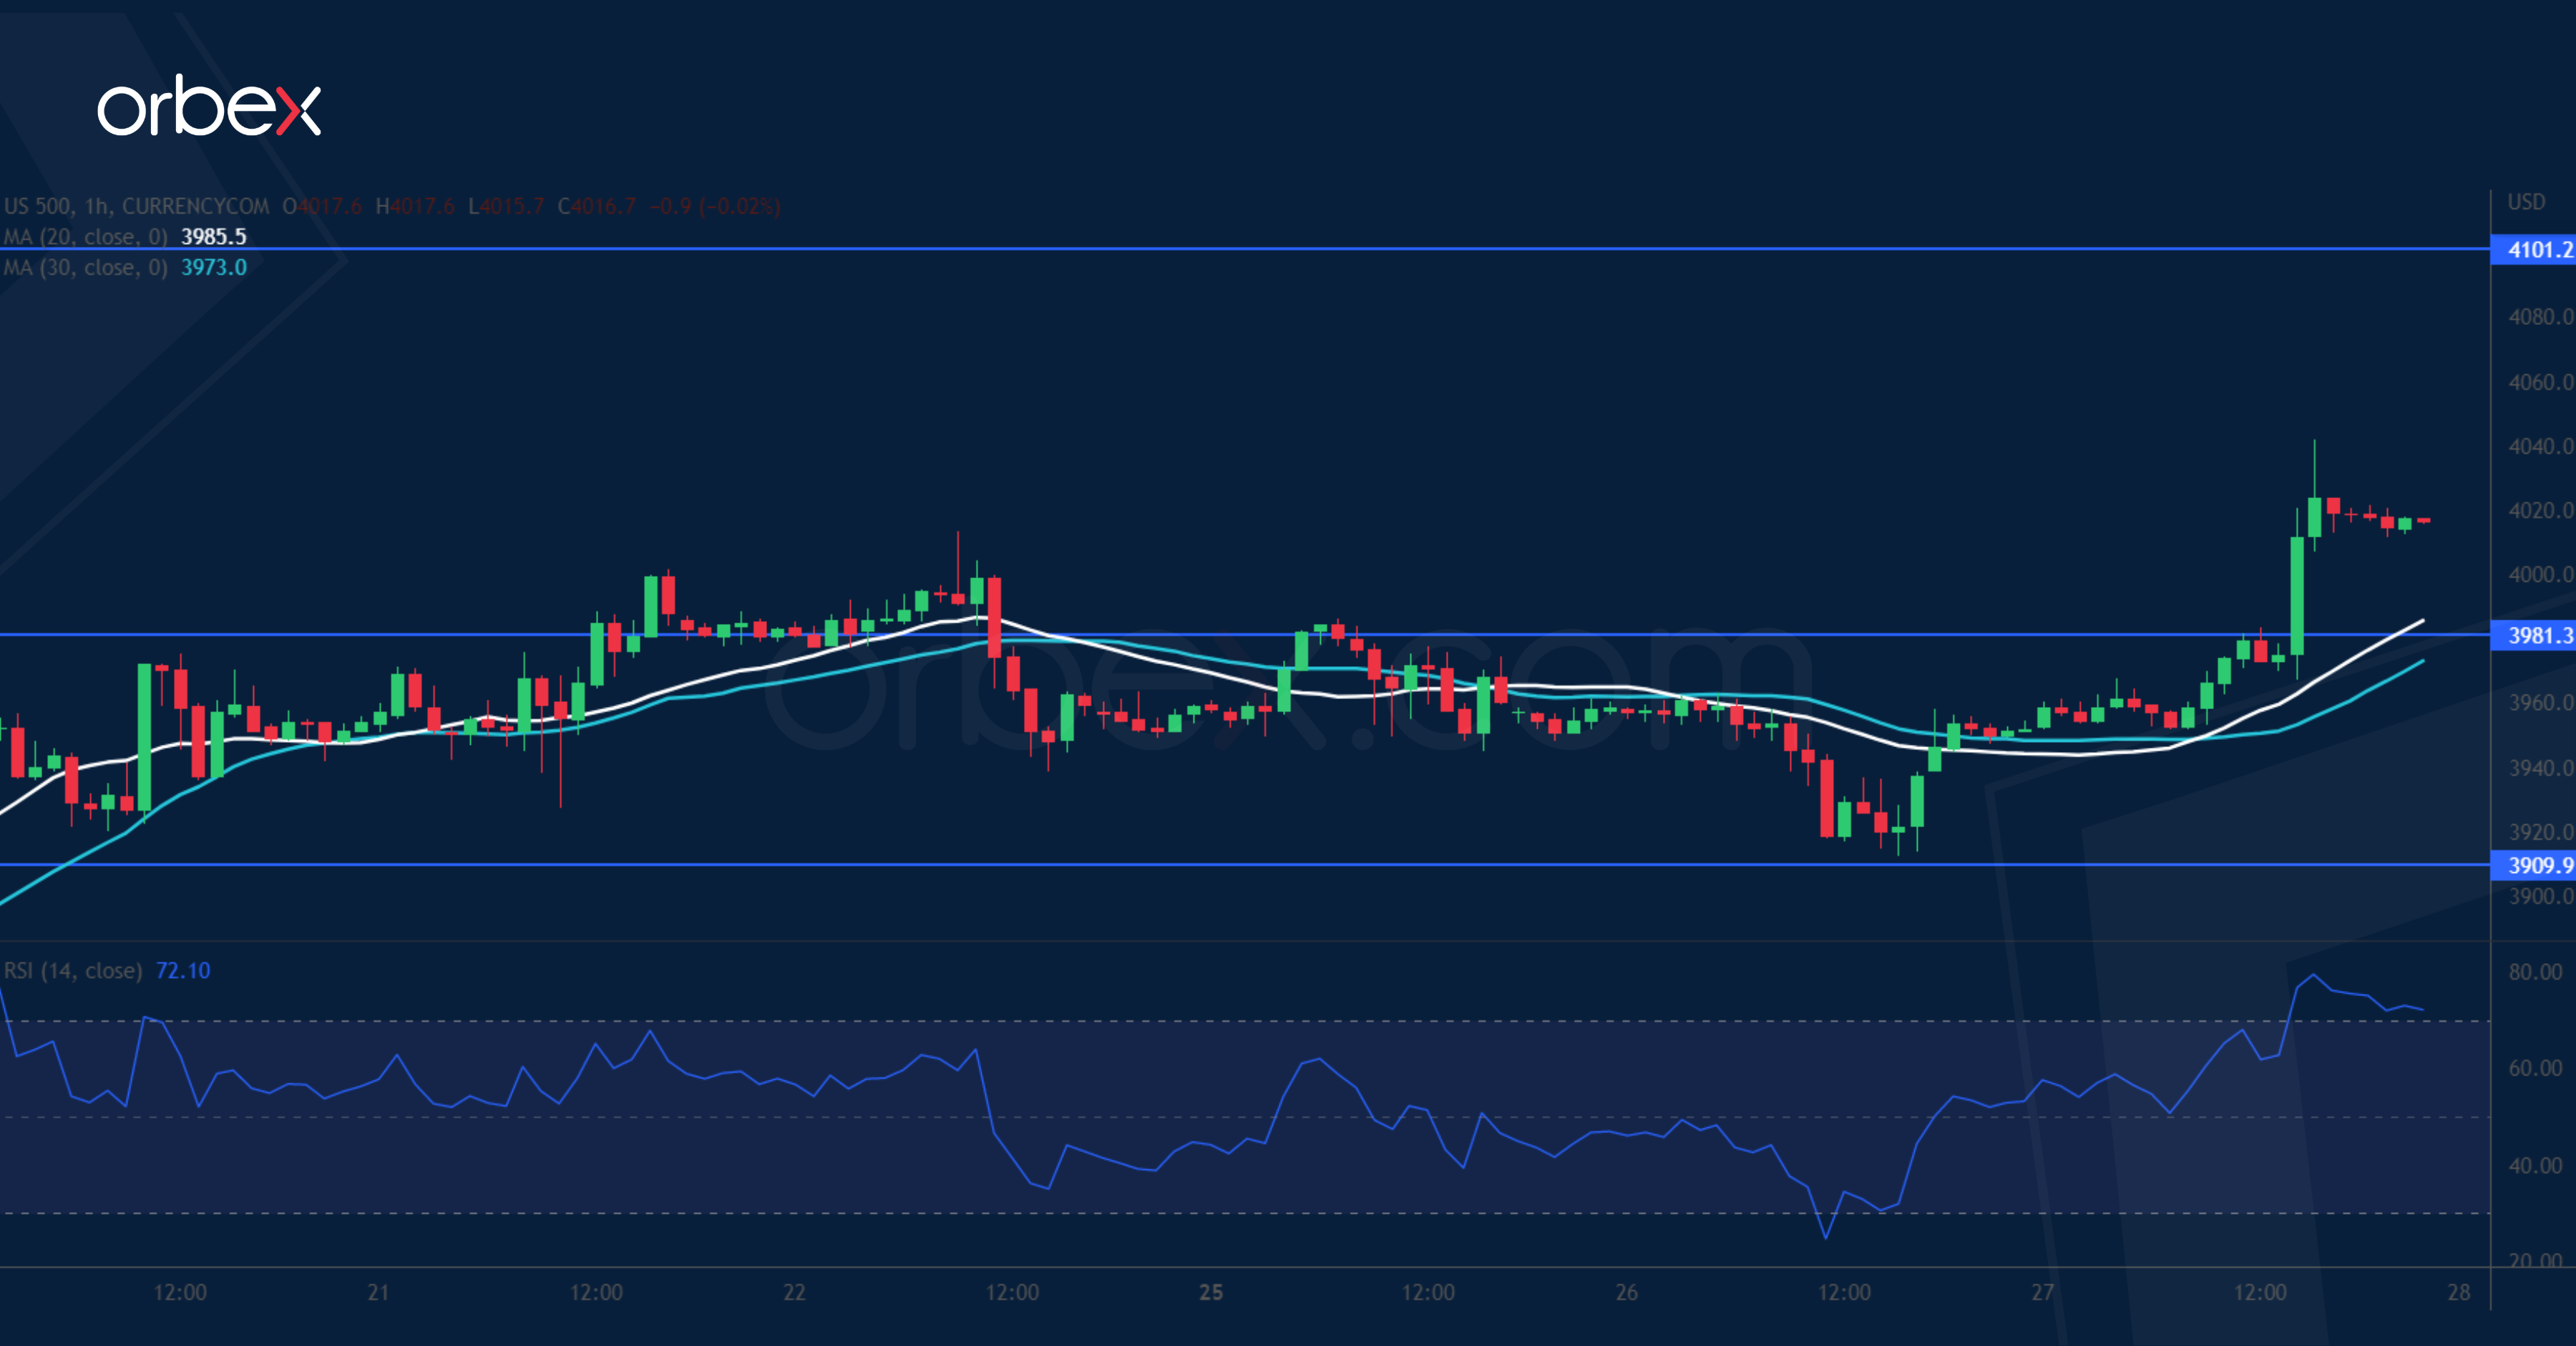
The S&P 500 soared as the Fed dropped the dreadful option of a full percentage rate hike for now. From the daily chart’s perspective, the market mood is cautious at best. However, there might still be room for short-term rebounds. The index has consolidated its gains over 3910. A close above the psychological tag of 4000 could fuel momentum buying and send the price to the start of the June sell-off at 4100. As the RSI shot into overbought territory, the base of the breakout at 3980 is the first support in case of a retracement.
US Oil Struggles to Recover
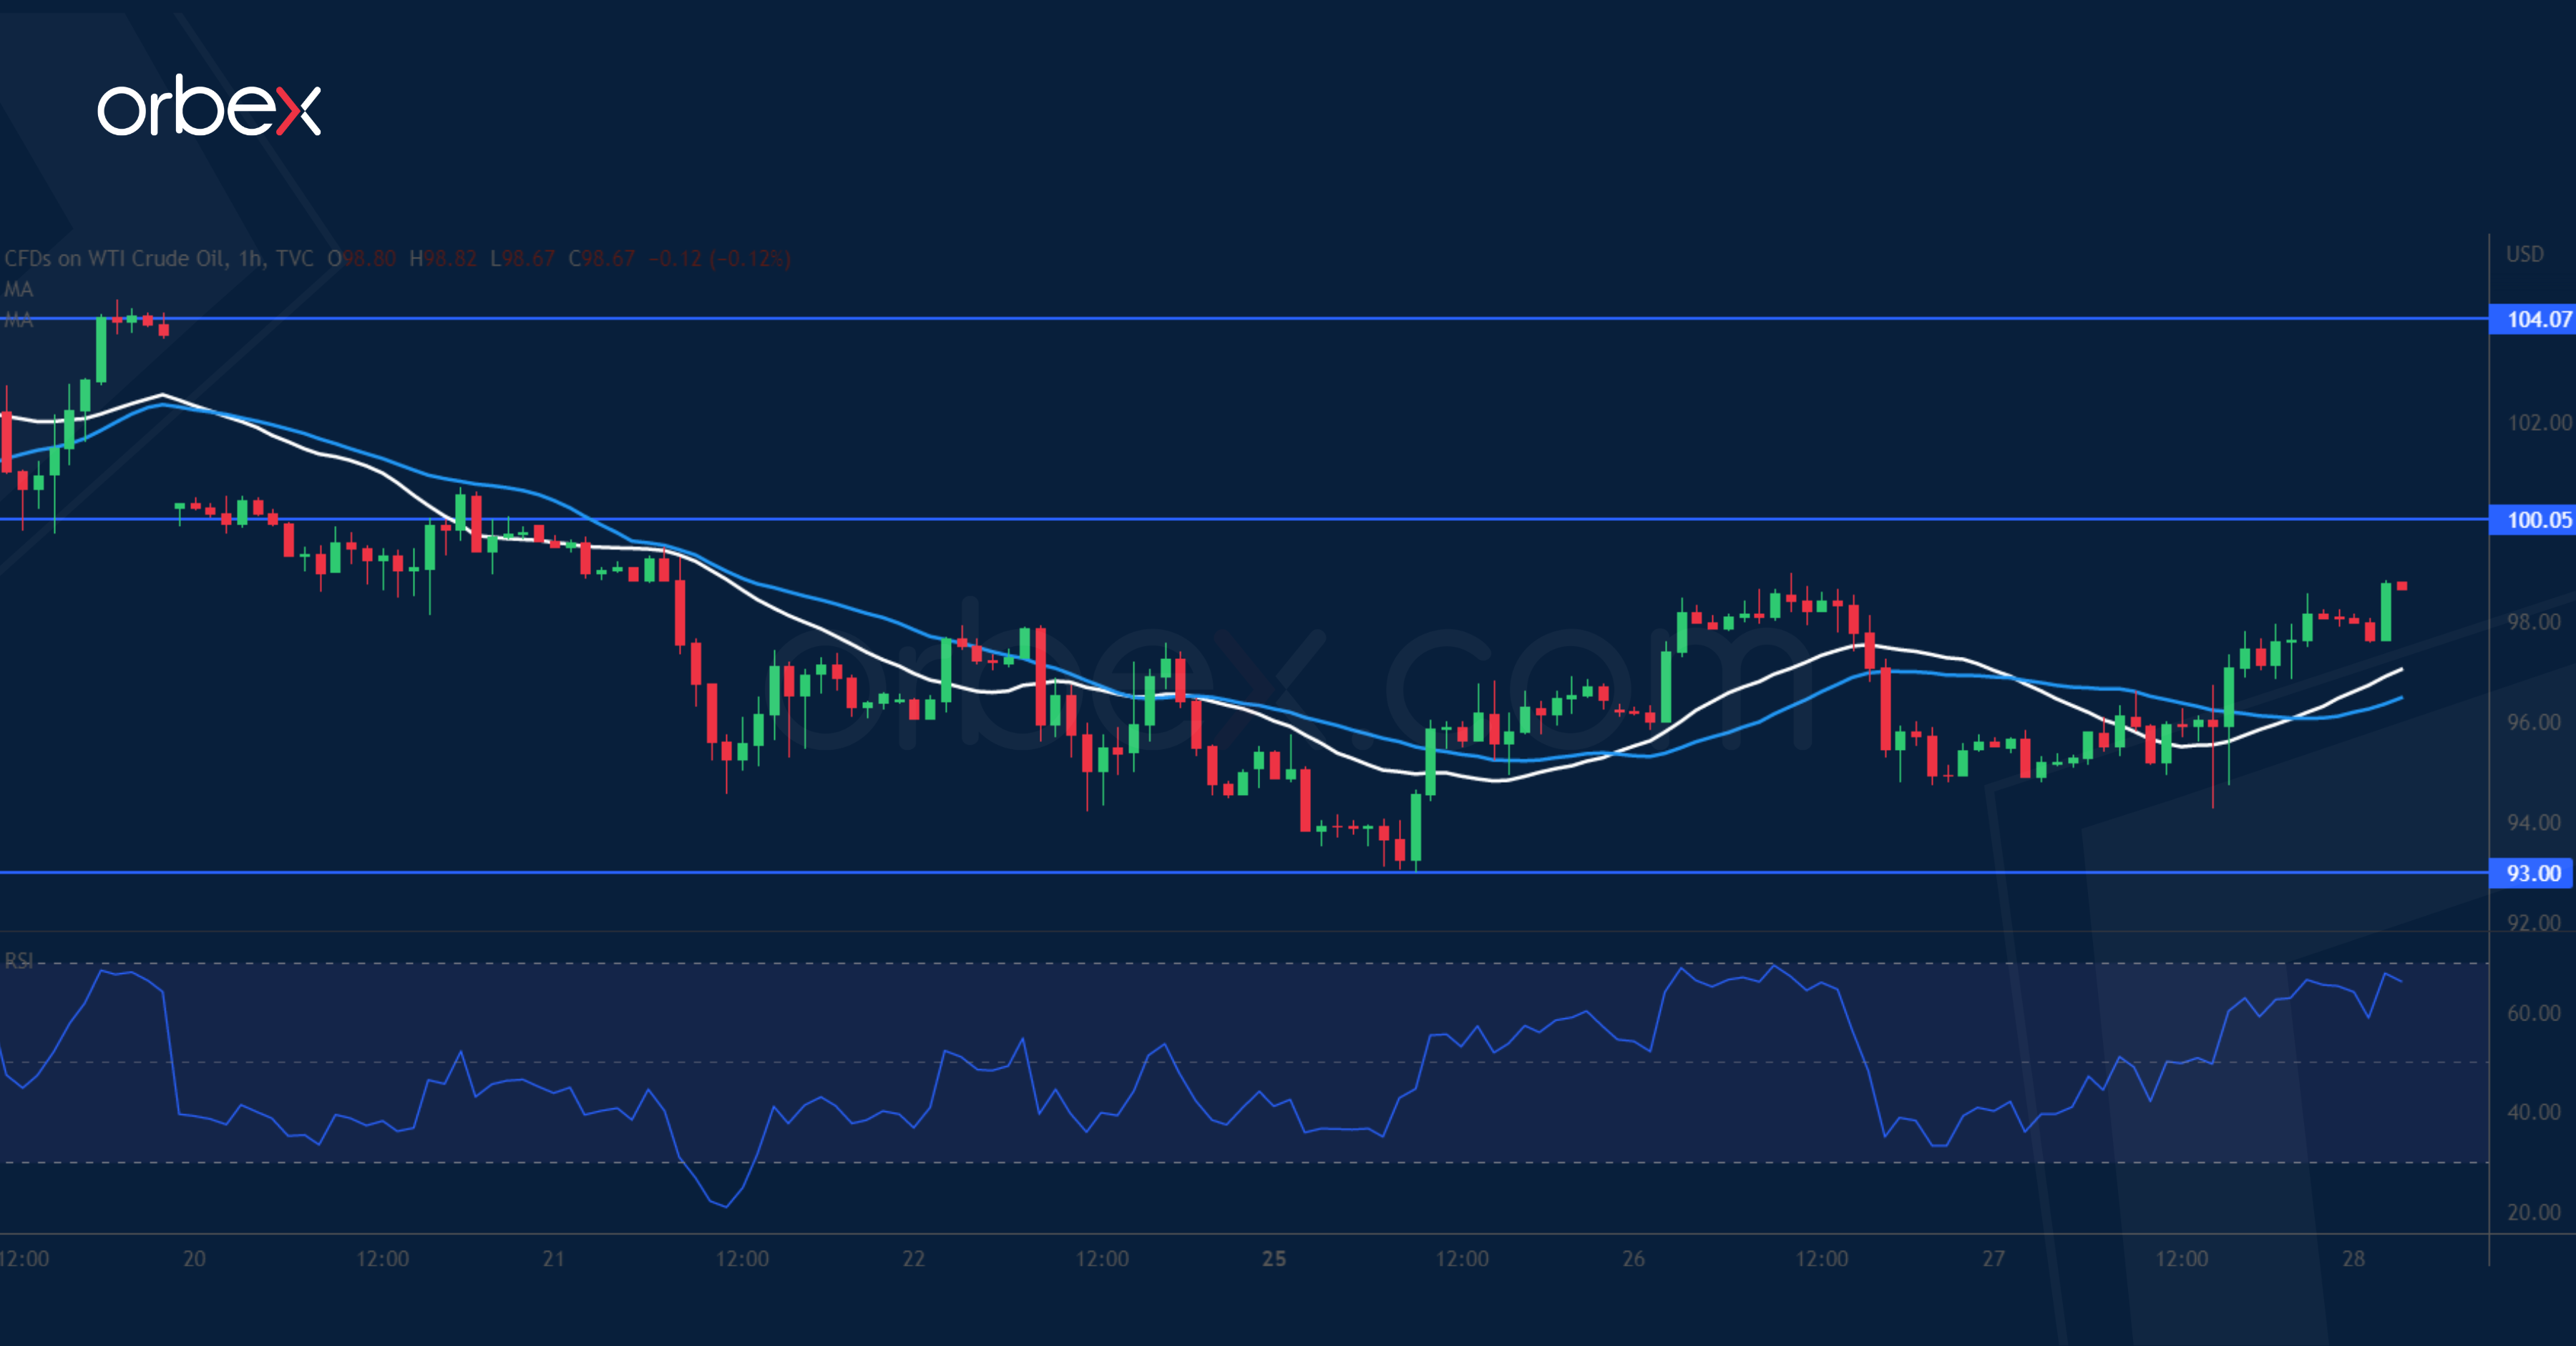
WTI crude bounces higher as US inventories show a larger-than-expected rise. The price is having a hard time holding onto its recent gains after it broke below last April’s low at 94.00. Sentiment has turned cautious as a series of lower lows forced more buyers to bail out. The latest rebound met stiff selling pressure at 104.00, a sign that sellers might have gained control. The bulls will need to lift the psychological level of 100.00 or 93.00 could be their last stronghold and its breach may extend losses below 88.00.