Sample Category Title
USD/CHF Tests Critical Floor
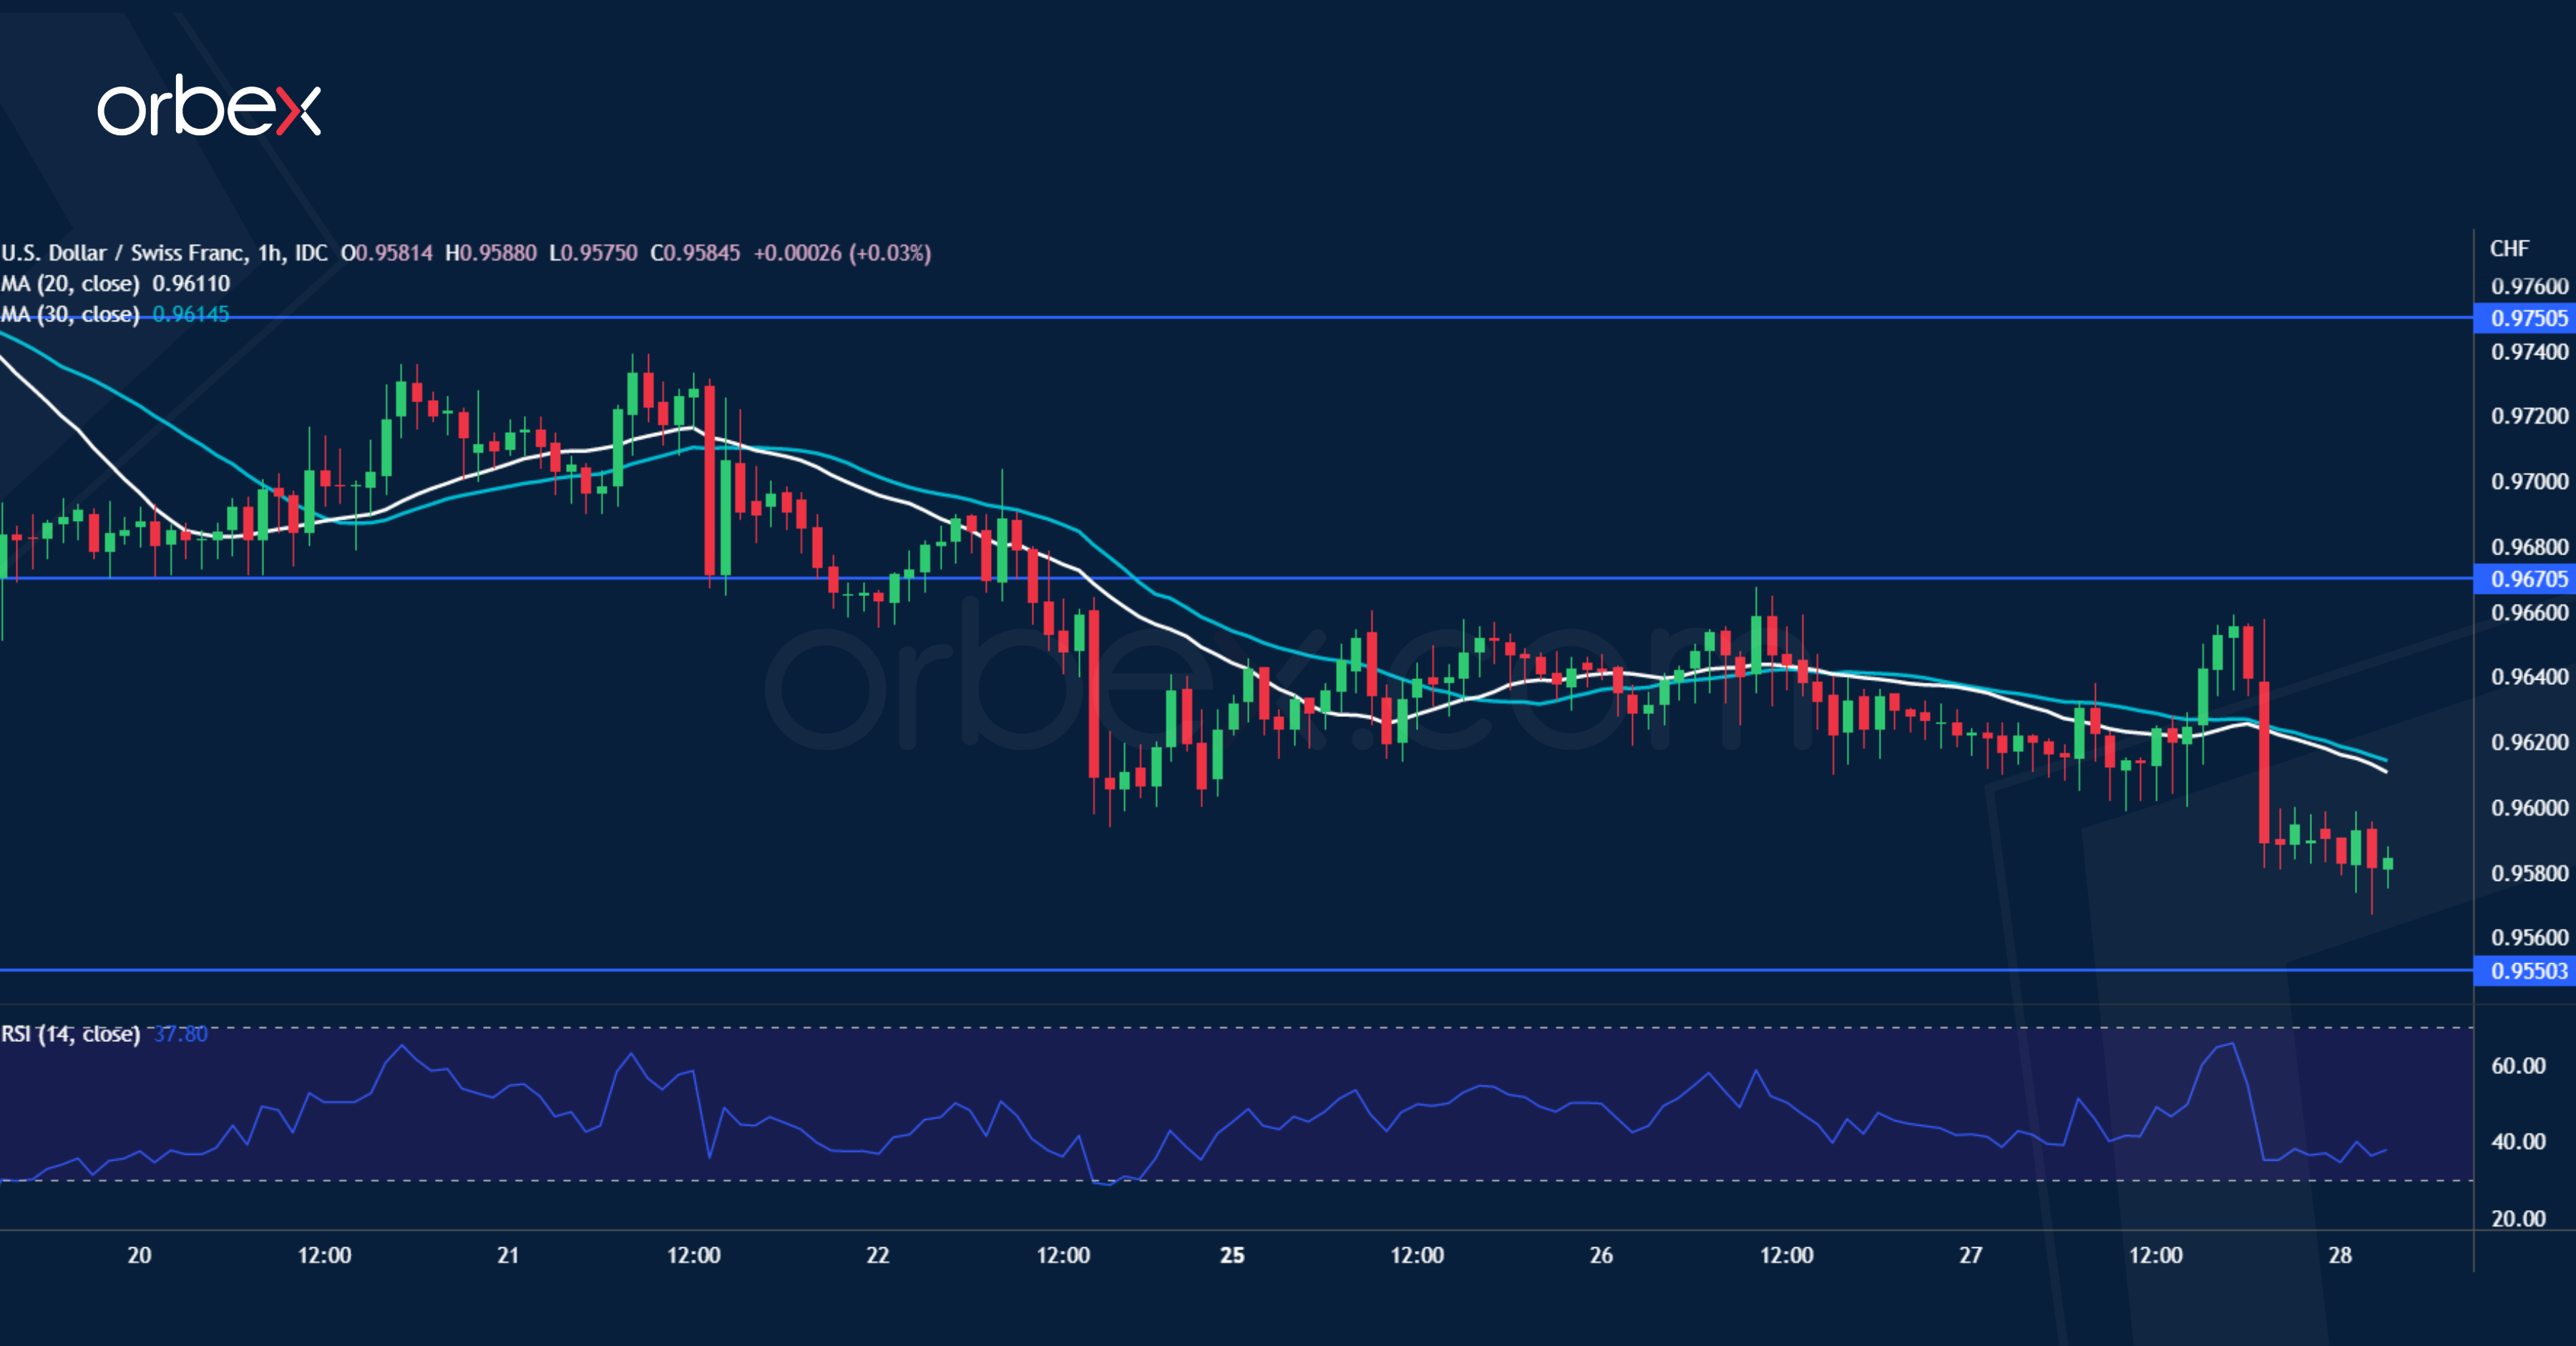
The US dollar softened after the Fed raised rates by 75bp as expected. The medium-term direction still points to the upside but intraday price action may remain choppy. The pair has struggled to find bids and given up most of its gains from the rally in early July. 0.9550 is a key support near the base of the previous recovery. A bearish breakout would indicate that the path of least resistance is down. The pair would be vulnerable to a sell-off below 0.9500. 0.9670 is the resistance to clear before the greenback could stabilise.
USD Remains on Back Foot in Asian Dealings
Markets
The Fed as expected lifted policy rates by 75 bps to what is now considered a neutral 2.25/2.50%. Chair Powell made clear that more tightening is appropriate as inflation remains high and the labour market still strong. And although the new statement mentions the softening in spending and production indicators, Powell refused to accept the US is already in a recession. Regarding the size of the next hikes, Powell didn’t give any guidance. Decisions will be made “meeting by meeting” and determined by incoming data. Another “unusually large” (ie 75 bps) move could be possible if warranted by the data but slowing down the pace could be equally appropriate “at some point”. If anything, the June dot plot offers the best guidance for now, he added. That’s telling because in it the Fed expects more hikes in 2023. This compares to markets already pricing in rate cuts. All in all, the onus is still very much on inflation. The Fed is willing to sacrifice growth with Powell reiterating that doing too little would turn out to be more costly. However, this is not how markets read it. The possibility for going slower from September on, even though this was by and large expected as US money markets didn’t budge a single bit, combined with the “dovish” twist in the statement was seen as a policy pivot. Stock markets surged more than 4% (Nasdaq) and the US yield curve steepened. Yields dropped 5.7 bps at the front and added 4 bps at the longest tenors. The dollar slipped in a knee-jerk reaction against most peers. EUR/USD rebounded from intraday lows sub 1.01 to 1.02, also supported by significant Bund underperformance. Yields added almost 10 bps in the 2y. The trade-weighted dollar index gave back gains of the day before to finish at 106.45. USD/JPY capped losses to 136.57.
The USD remains on the back foot in Asian dealings. Equity markets follow WS’s performance by advancing up to 1.5%. US Treasuries seem to backtrack already on yesterday’s gains. German Bunds have a much clearer downward bias, following a strong regional inflation print in NRW ahead of the national release this afternoon. It provides a glimpse of the European reading due tomorrow and it seems another upward surprise is in the making. It may keep German/European yields better protected after the recent sharp decline. For (ST) US yields Q2 GDP will be important. We’re not expecting it after yesterday’s solid batch of June (trade, capex and inventory) data, but in case of a negative figure (ie a technical recession), yields probably have room to ease. Markets would see it as a confirmation of yesterday’s presumed pivot. The USD may be in for a tactical pause but we don’t believe in a sharp and sustained correction lower. With the euro strategically under pressure, we see EUR/USD’s topside limited to south of 1.03.
News Headlines
New Australian Treasurer Jim Chalmers revealed that the government now assumes growth for this fiscal year (2022/23) of 3.0%. 2023/24 growth is even expected to ease further to 2.0%. For both years, the growth outlook is 0.5% lower compared the pre-election forecast. The new government expects inflation to peak at 7.75% (was seen at 4.25% previously). It now sees inflation at 5.5% in 2022/23 and at 2.75% in 2023/24. Unemployment is expected to rise to 3.75% next year and 4.0% in 2024 from the current historic low 3.5%. With expected wage rises of 3.75%, real wage growth is still expected to be negative the coming year. Economic data published this morning confirmed the cooling of spending due to higher prices. June retail sales unexpectedly slowed to 0.2% from a downwardly revised 0.7%. The Reserve bank of Australia meets next week and another 50 bps rate hike is largely expected. The Aussie dollar this morning stabilizes just below 0.70 after a USD driven rise yesterday.
The US Democratic Party reached an agreement on a broad budget and spending bill. According the Senator Joe Manchin who long opposed the Biden spending plans, it should be called the ‘inflation reduction act of 2022’ rather than the ‘Build Back Better’ act. The bill foresees an increase corporate taxes (including an higher corporate minimum tax and better enforcement of existing taxes) helping to reducing the national debt by $300bn but at the same time raising investments in energy technology and lower the cost of prescription drugs for which $430bn in additional spending is foreseen.
USD/CAD Daily Outlook
Daily Pivots: (S1) 1.2785; (P) 1.2848; (R1) 1.2889; More...
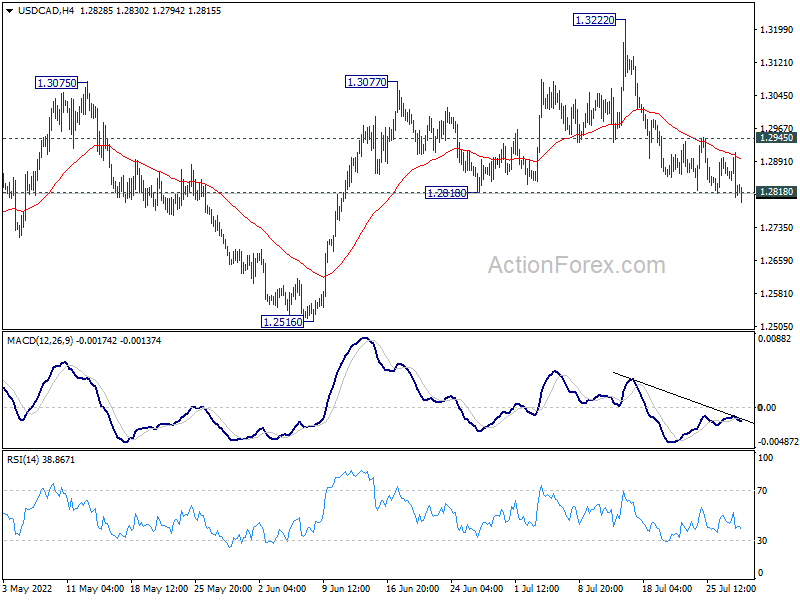
USD/CAD's fall from 1.3222 is resuming and intraday bias is back on the downside. Sustained break of 1.2818 support will bring deeper fall back to 1.2516 key support. This will also raise the chance of near term bearish reversal. On the upside, above 1.2945 minor resistance will revive near term bullishness, and turn bias back to the upside for retesting 1.3222 instead.
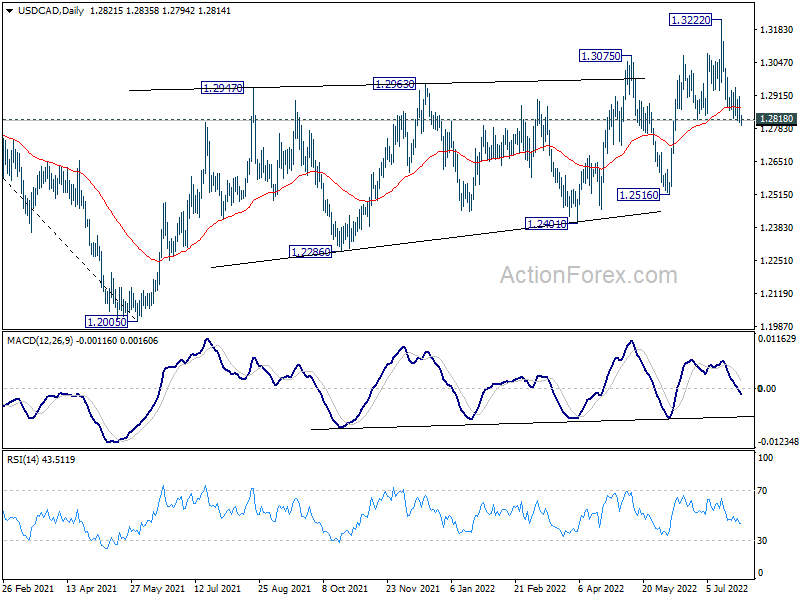
In the bigger picture, down trend from 1.4667 (2020 high) should have completed at 1.2005, after defending 1.2061 long term cluster support. Rise from there should target 61.8% retracement of 1.4667 to 1.2005 (2021 low) at 1.3650. This will remain the favored case now as long as 1.2516 support holds.
AUD/USD Daily Report
Daily Pivots: (S1) 0.6934; (P) 0.6974; (R1) 0.7034; More...
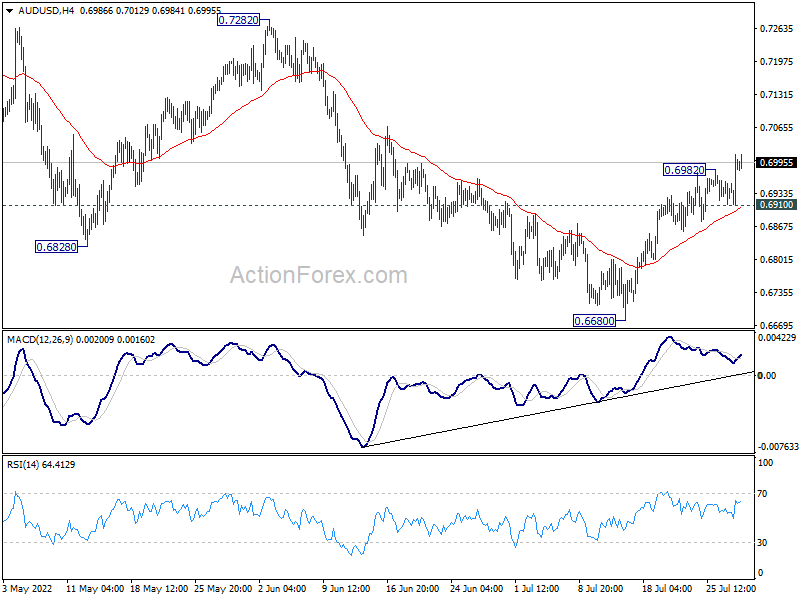
AUD/USD's rise from 0.6680 resumed after brief retreat and intraday bias remains on the upside. Sustained trading above 55 day EMA (now at 0.6965) will pave the way to 0.7282 resistance next. On the downside, however, break of 0.6858 minor support will argue that the rebound from 0.6910 is over. Intraday bias will then be back on the downside for retesting 0.6680 low.
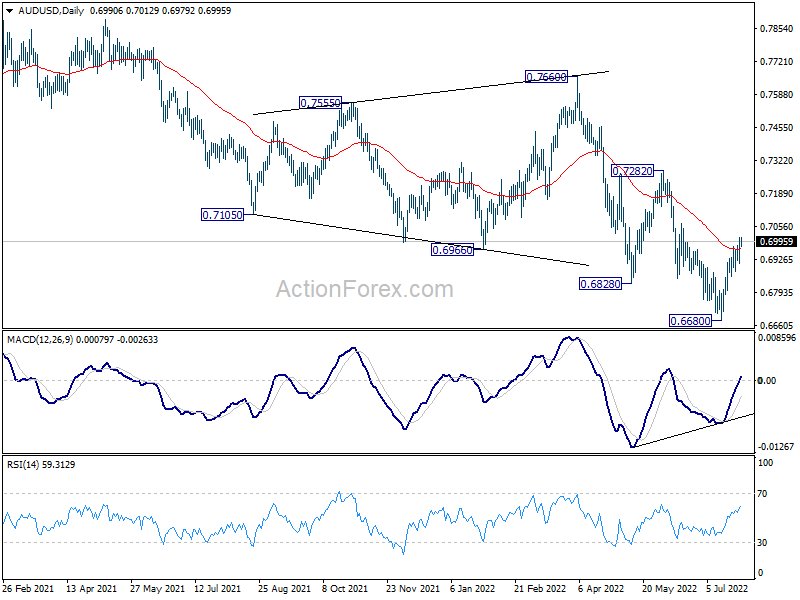
In the bigger picture, price actions from 0.8006 (2021 high) could still be a corrective pattern to rise from 0.5506 (2020 low). But current downside acceleration, as seen in weekly MACD), is raising the chance that it's a bearish impulsive move. In either case, outlook will remain bearish as long as 0.7282 resistance holds. Next target is 61.8% retracement of 0.5506 to 0.8006 at 0.6461.
EUR/USD Daily Outlook
Daily Pivots: (S1) 1.0124; (P) 1.0173; (R1) 1.0248; More...
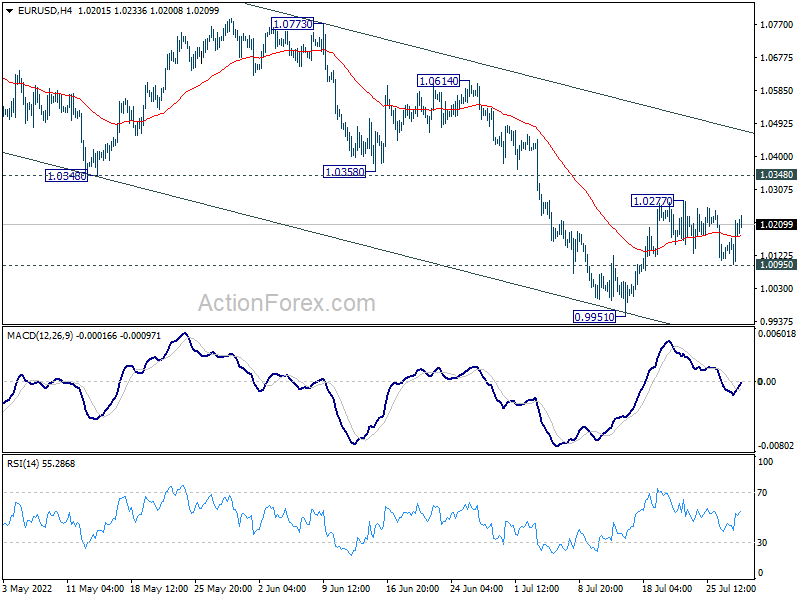
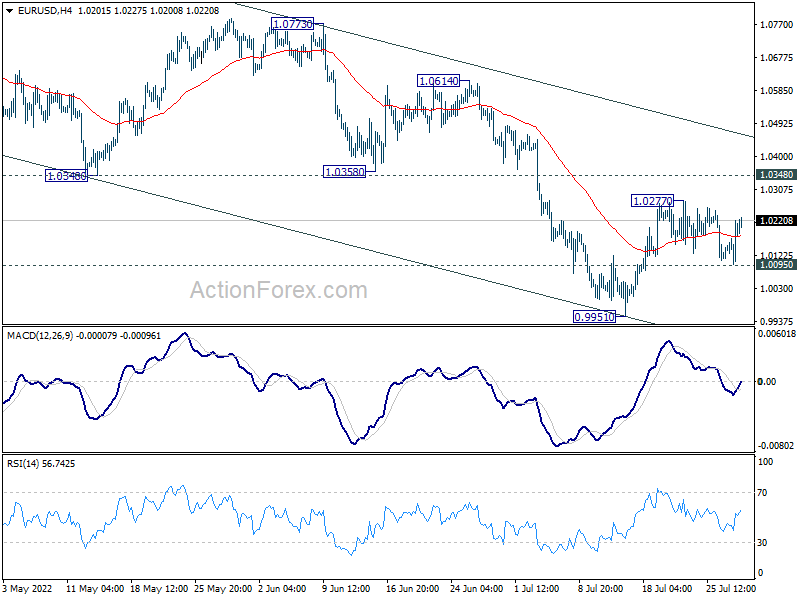
Intraday bias in EUR/USD stays neutral first. On the upside, above 1.0277 minor resistance will target 1.0348 resistance first. Break there will target channel resistance at 1.0469. on the downside, break of 1.0095 minor support will bring retest of 0.9951 low instead.
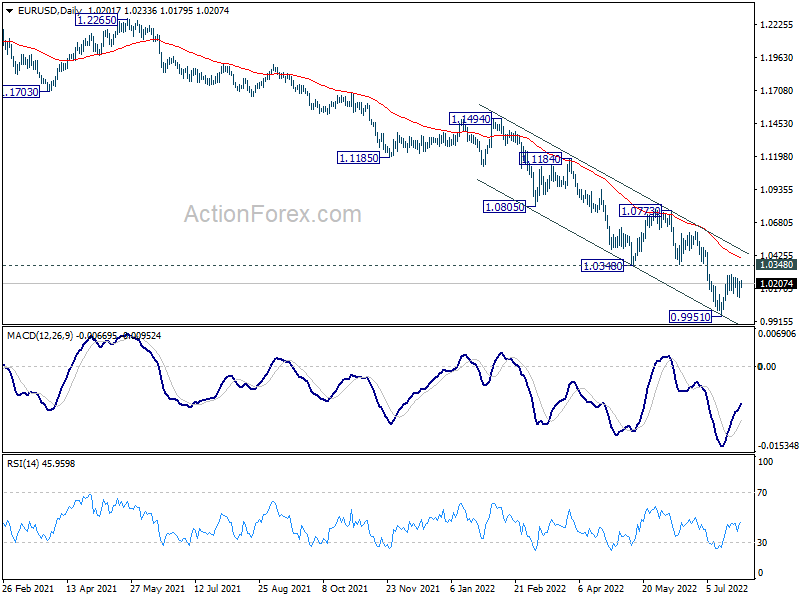
In the bigger picture, down trend from 1.6039 (2008 high) is still in progress. Next target is 100% projection of 1.3993 to 1.0339 from 1.2348 at 0.8694. In any case, outlook will stay bearish as long as 1.0773 resistance holds, in case of strong rebound.
GBP/USD Daily Outlook
Daily Pivots: (S1) 1.2057; (P) 1.2121; (R1) 1.2222; More...
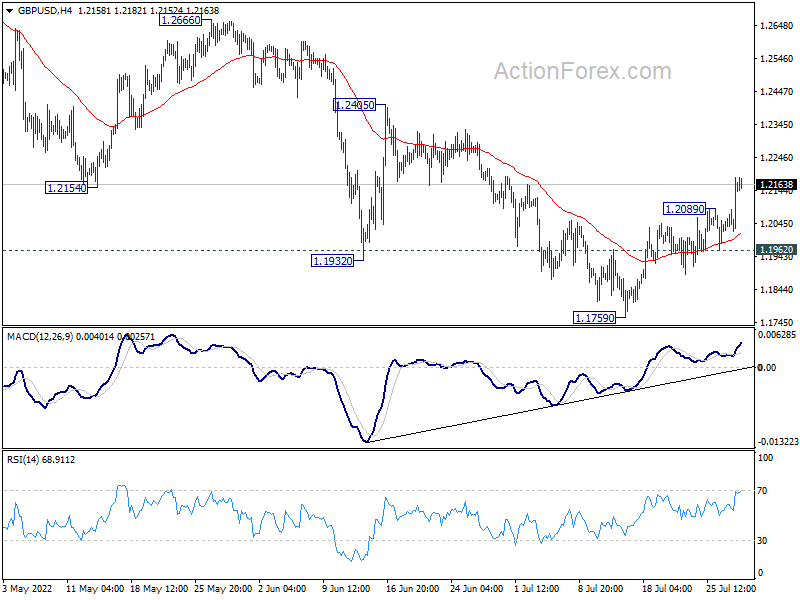
GBP/USD's rise resumed 1.1759 short term bottom resumed after brief retreat. Intraday bias is back on the upside for 1.2405 resistance. Firm break there will target 1.2666 key resistance next. On the downside, break of 1.1962 minor support will turn bias back to the downside for retesting 1.1759 low instead.
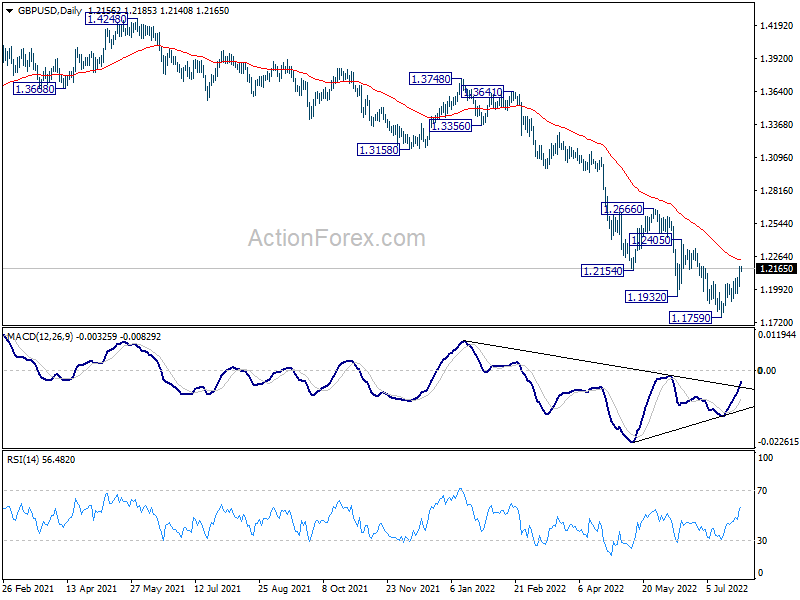
In the bigger picture, fall from 1.4248 (2018 high) could be a leg inside the pattern from 1.1409 (2020 low), or resuming the longer term down trend. Deeper decline is expected as long as 1.2666 resistance holds. Next target is 1.1409 low. However, firm break of 1.2666 will bring stronger rise back to 55 week EMA (now at 1.2986).
USD/CHF Daily Outlook
Daily Pivots: (S1) 0.9567; (P) 0.9613; (R1) 0.9642; More...
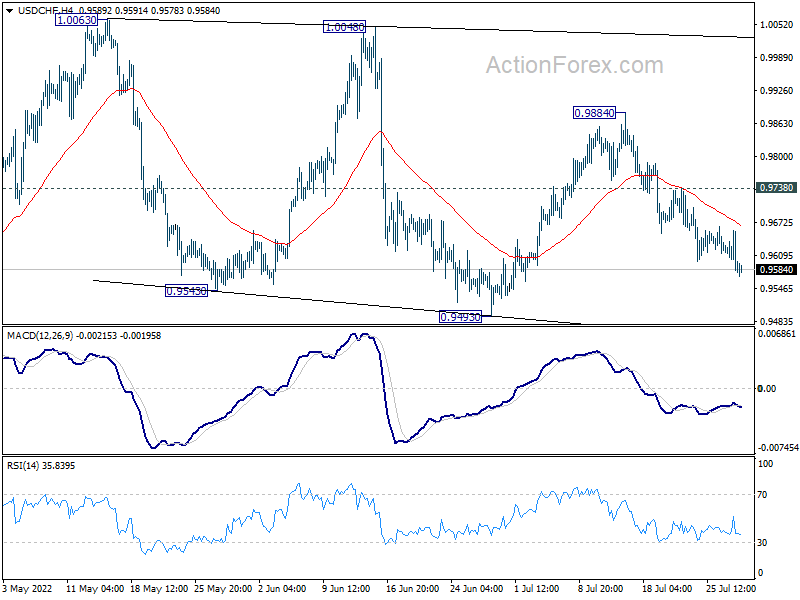
Intraday bias in USD/CHF stays on the downside at this point. Fall from 0.9884 is seen as a falling leg of the consolidation from 1.0063. Deeper decline would be seen to 0.9493 support. On the upside, though, above 0.9738 minor resistance will turn bias back to the upside for 0.9884 resistance.
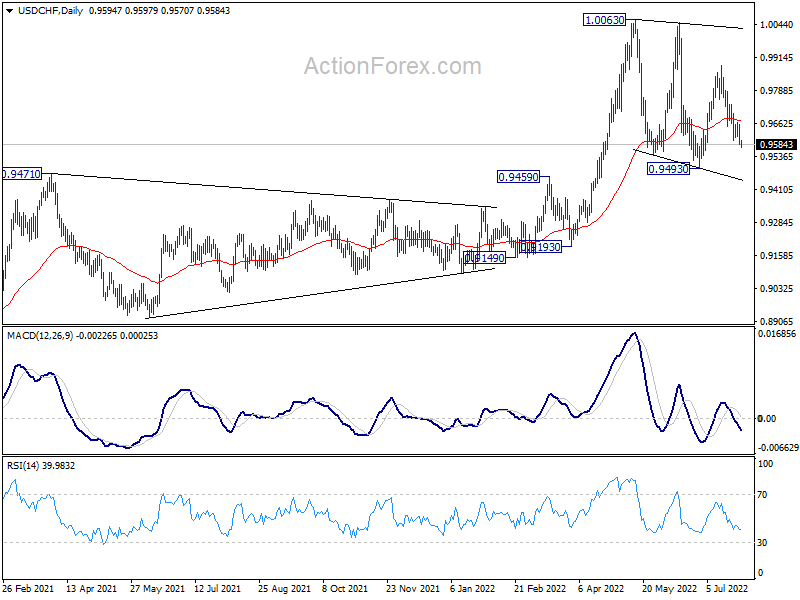
In the bigger picture, medium term up trend from 0.8756 (2021 low) is still in progress. On resumption, next target is 1.0342 (2016 high). Sustained break there will resume long term up trend from 0.7065 (2011 low). This will remain the favored case as long as 0.9471 resistance turned support holds.
USD/JPY Daily Outlook
Daily Pivots: (S1) 136.15; (P) 136.80; (R1) 137.28; More...
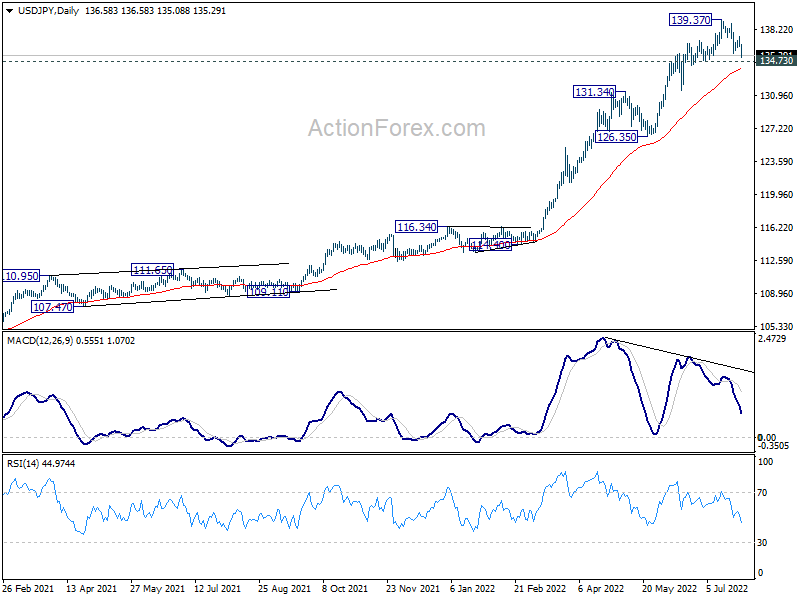
USD/JPY's fall from 139.37 extends lower today and focus is now on 134.73 support. Considering bearish divergence condition in daily MACD, sustained break of 134.73 will argue that it's already in correction to medium term up trend. Deeper decline would then be seen through 55 day EMA to 126.35/131.34 support zone. On the upside, above 137.44 minor resistance will turn bias back to the upside for retesting 139.37 resistance instead.
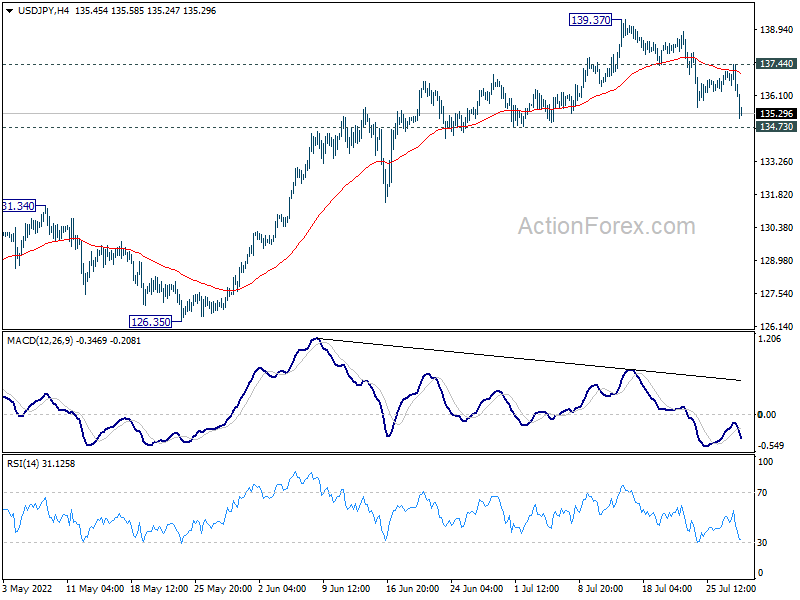
In the bigger picture, current rally is seen as part of the long term up trend from 75.56 (2011 low). Next target is 100% projection of 75.56 (2011 low) to 125.85 (2015 high) from 98.97 at 149.26, which is close to 147.68 (1998 high). This will remain the favored case as long as 126.35 support holds.
Dollar Broadly Lower as Fed Signals Slower Tightening Ahead
Dollar was sold off broadly overnight and stays weak in Asian session. Markets well received Fed Chair Jerome Powell's message that tightening pace is going to slow ahead. While stocks also rebounded, Yen reacted more to falling benchmark treasury yields. As for the week, the greenback is now the worst performer. Euro follows as second worst on worries over the impact of gas crunch. Sterling is the strongest one, helped by buying against Euro. Australian Dollar is the second strongest.
Technically, there are three levels to watch to confirm that Dollar selling is here to stay. Firstly, break of 1.0277 minor resistance in EUR/USD will resume the rebound from 0.9951. Further break of 1.0348 support turned resistance will raise the chance of a near term reversal. Secondly, firm break of 134.73 support in USD/JPY will indicate that larger correction is underway, for 126.35/131.34 support zone. Thirdly, break of 1745.21 resistance in Gold will also affirm the case of bullish reversal, after drawing support from 1682.60 cluster level.
In Asia, Nikkei rose 0.32%. Hong Kong HSI is down -0.42%. China Shanghai SSE is up 0.46%. Singapore Strait Times is up 0.34%. Japan 10-year JGB yield is up 0.010 at 0.205. Overnight, DOW rose 1.37%. S&P 500 rose 2.62%. NASDAQ rose 4.06%. 10-year yield dropped -0.053 to 2.734.
DOW resuming near term rebound as Fed Powell signals slowing tightening ahead
US stocks staged a strong rebound overnight after Fed Chair Jerome Powell hinted that tightening could slow ahead. After yesterday's 75bps hike, federal funds rate is now at 2.25-2.50%, close to the 2.5% neutral rate.
"While another unusually large increase could be appropriate at our next meeting, that is a decision that will depend on the data we get between now and then," Powell said. "We will continue to make our decisions meeting by meeting, and communicate our thinking as clearly as possible."
"As the stance of monetary policy tightens further, it likely will become appropriate to slow the pace of increases while we assess how our cumulative policy adjustments are affecting the economy and inflation," he also noted.
More in FOMC:
- FOMC Raises Rates by 75 bps and Indicates More to Come
- FOMC Recap: Fed Delivers 75bps, But Powell Throws Cold Water on Hawks
- The FOMC to Advance Meeting by Meeting
- FOMC Hikes Policy Rate by 75 Basis Points, Meeting Market Expectations
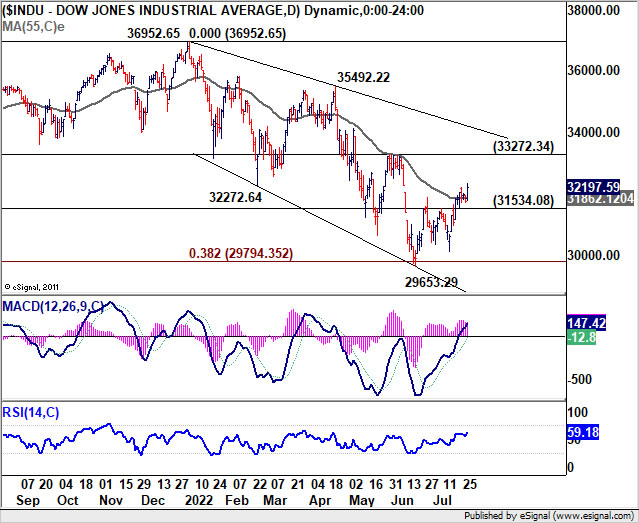
DOW rose 436 pts or 1.37% to close at 31799. Rebound from 29653.29 is resuming and the break above 55 day EMA again is a positive signal. Further rally is now in favor, as long as 31534.08 minor support holds, towards 33272.34 resistance. Firm break there will add to the case that whole corrective fall from 36952.65 has completed.
BoJ Amamiya: We need to support economic activity with accommodative monetary policy
Deputy Governor Masayoshi Amamiya said, "Japan's economy hasn't recovered yet to pre-pandemic levels... The foundations for an economic recovery remain weak and the outlook for wages is highly uncertain. As such, we need to support economic activity with accommodative monetary policy."
"Achieving our price target means having consumer inflation hit 2% on average over the business cycle, not a temporary rise to that level driven by exogenous factors such as increasing energy import costs," he emphasized.
Japan's CPI core (all-item ex fresh food), has been above BoJ's 2% target for three straight months. But officials are seeing it as temporary, at least until wage pressures build up.
Australia retail sales rose 0.2% mom in Jun, sixth-straight monthly rise
Australia retail sales rose 0.2% mom to AUD 34.2B in June, below expectation of 0.4% mom. Through the year, sales rose 12.0% yoy.
Ben Dorber, head of retail statistics at the ABS, said: "While the 0.2 per cent rise in June 2022 was the sixth-straight rise in retail turnover, it was also the smallest so far this year....
"Given the increases in prices we've seen in the Consumer Price Index, it will also be important to look at changes in the volumes of retail goods, in next week's release of quarterly data."
NZ ANZ business confidence improved to -56.7, business feeling apprehensive
New Zealand ANZ business confidence improved from -62.6 to -56.7 in July. Own activity outlook rose from -9.1 to -8.7. Employment intentions rose from 0.7 to 1.1. Pricing intentions rose from 73.7 to 74.0. Inflation expectations rose from 6.02 to 6.23.
ANZ said that most activity indicators were little changed, but residential construction intentions plummeted again to a fresh record low (-73.7). Inflation pressures remain intense, but may be topping out.
It added: "New Zealand businesses are well aware that the Reserve Bank is on a mission to reduce customer demand for their wares in order to reduce inflation. No wonder they're feeling apprehensive."
Looking ahead
Eurozone economic sentiment indicator and Germany CPI flash will be released in European session. Later in the day, US GDP and jobless claims will be featured.
USD/JPY Daily Outlook
Daily Pivots: (S1) 136.15; (P) 136.80; (R1) 137.28; More...
USD/JPY's fall from 139.37 extends lower today and focus is now on 134.73 support. Considering bearish divergence condition in daily MACD, sustained break of 134.73 will argue that it's already in correction to medium term up trend. Deeper decline would then be seen through 55 day EMA to 126.35/131.34 support zone. On the upside, above 137.44 minor resistance will turn bias back to the upside for retesting 139.37 resistance instead.
In the bigger picture, current rally is seen as part of the long term up trend from 75.56 (2011 low). Next target is 100% projection of 75.56 (2011 low) to 125.85 (2015 high) from 98.97 at 149.26, which is close to 147.68 (1998 high). This will remain the favored case as long as 126.35 support holds.
Economic Indicators Update
| GMT | Ccy | Events | Actual | Forecast | Previous | Revised |
|---|---|---|---|---|---|---|
| 01:00 | NZD | ANZ Business Confidence Jul | -56.7 | -62.6 | ||
| 01:30 | AUD | Import Price Index Q/Q Q2 | 4.30% | 1.90% | 5.10% | |
| 01:30 | AUD | Retail Sales M/M Jun | 0.20% | 0.40% | 0.90% | |
| 09:00 | EUR | Eurozone Economic Sentiment Indicator Jul | 102 | 104 | ||
| 09:00 | EUR | Eurozone Industrial Confidence Jul | 6.9 | 7.4 | ||
| 09:00 | EUR | Eurozone Services Sentiment Jul | 14.5 | 14.8 | ||
| 09:00 | EUR | Eurozone Consumer Confidence Jul F | -27 | -27 | ||
| 12:00 | EUR | Germany CPI M/M Jul P | 0.60% | 0.10% | ||
| 12:00 | EUR | Germany CPI Y/Y Jul P | 7.40% | 7.60% | ||
| 12:30 | USD | Initial Jobless Claims (Jul 22) | 248K | 251K | ||
| 12:30 | USD | GDP Annualized Q2 P | 0.90% | -1.60% | ||
| 12:30 | USD | GDP Price Index Q2 P | 7.20% | 8.30% | ||
| 14:30 | USD | Natural Gas Storage | 19B | 32B |
Technical Outlook and Review
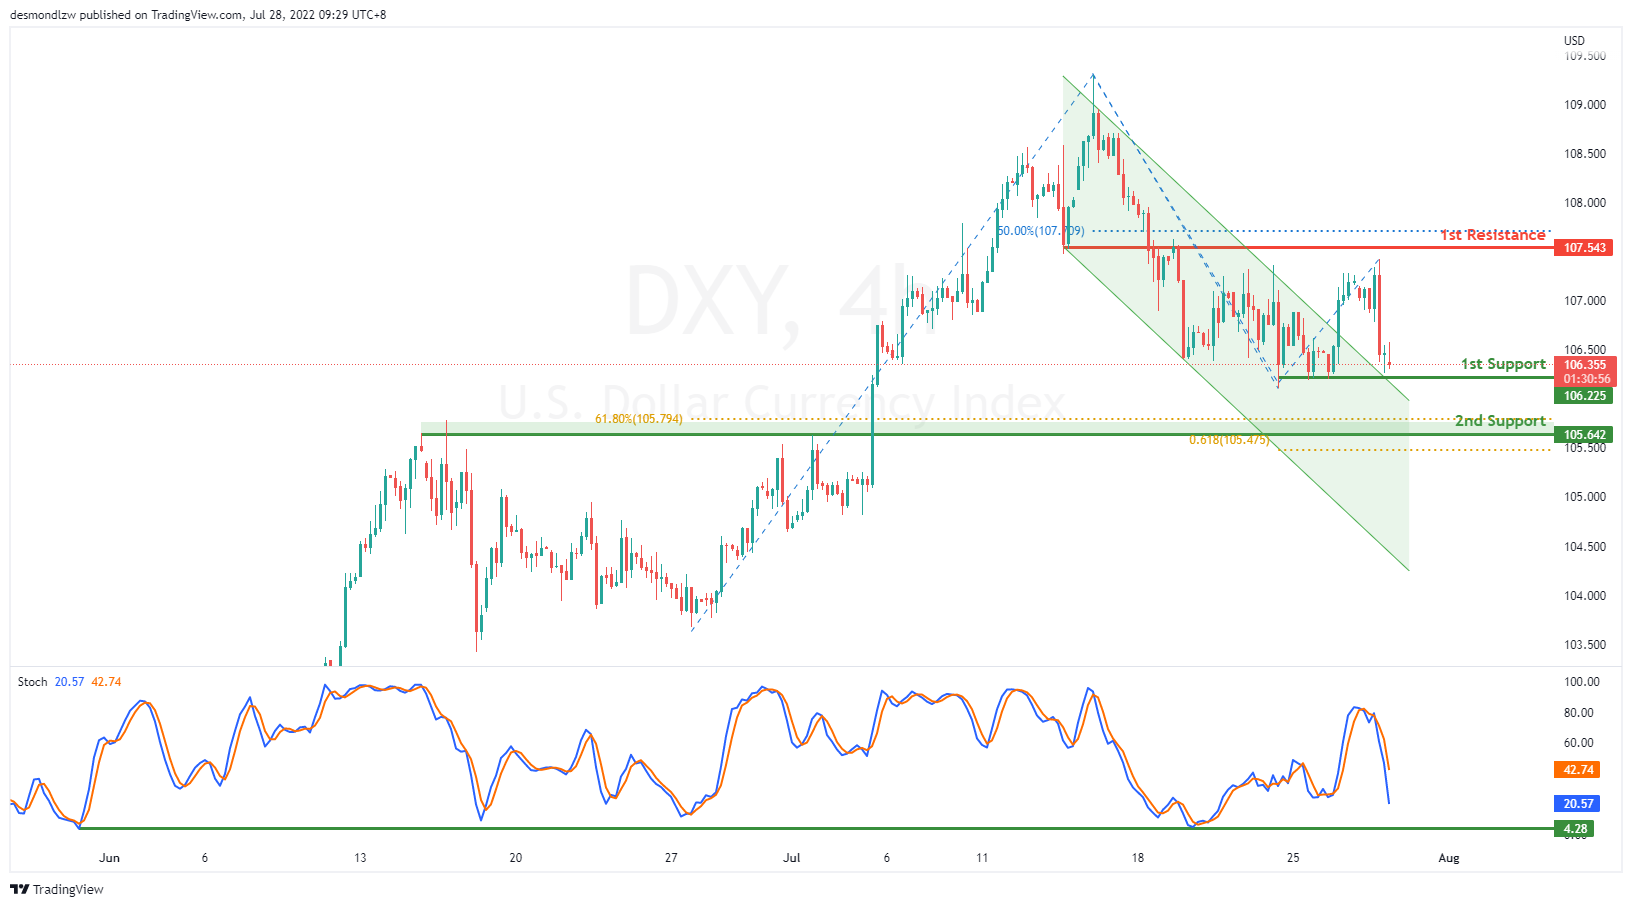
DXY:
On the H4, with prices breaking out of the descending channel and expected to bounce off the stochastic support, we have a bullish bias that prices will drop and rise from the 1st support at 106.225 where the swing low support is to the 1st resistance at 107.543 where the pullback resistance and 50% fibonacci retracement are. Alternatively, price could break 1st support structure and head to 2nd support at 105.642 where the overlap support, 61.8% fibonacci retracement and 61.8% fibonacci projection are.
Areas of consideration:
- H4 time frame, 1st resistance at 107.543
- H4 time frame, 1st support at 106.225
XAU/USD (GOLD):
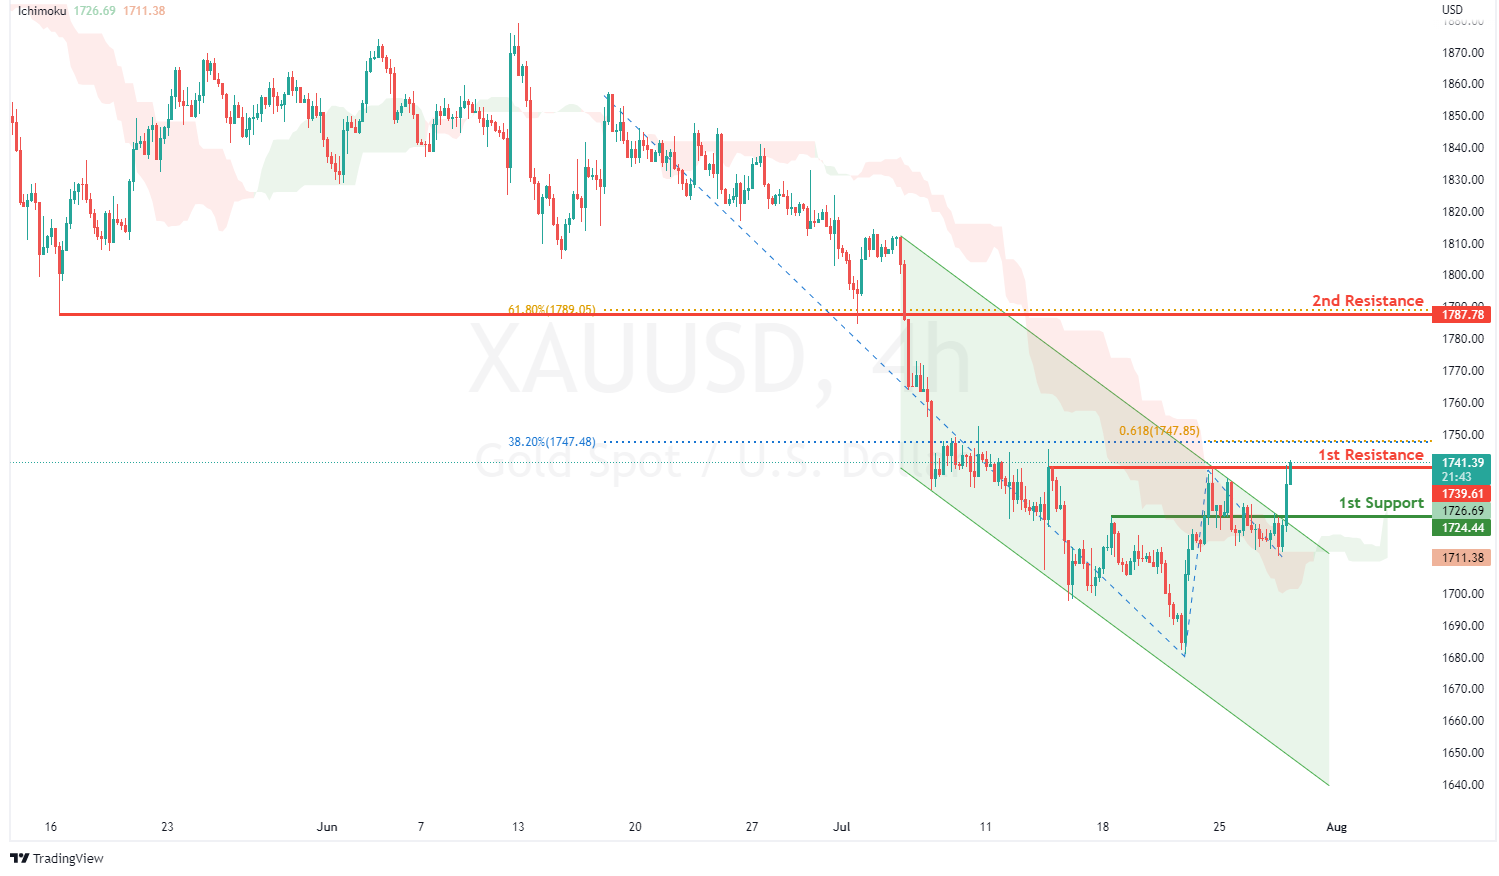
On the H4, with prices breaking out of a descending channel and moving above the ichimoku indicator, we have a bullish bias that price will rise to the 1st resistance at 1739.61 where the swing high resistance, 38.2% fibonacci retracement and 61.8% fibonacci projection are. Once there is upside confirmation of price breaking 1st resistance structure, we would expect bullish momentum to carry price to 2nd resistance at 1787.78 in line with pullback resistance and 61.8% fibonacci retracement. Alternatively, prices could drop to 1st support at 1724.44 where the pullback support is.
Areas of consideration:
- H4 time frame, 1st Resistance at 1739.61
- H4 time frame, 1st Support at 1724.44
GBP/USD:
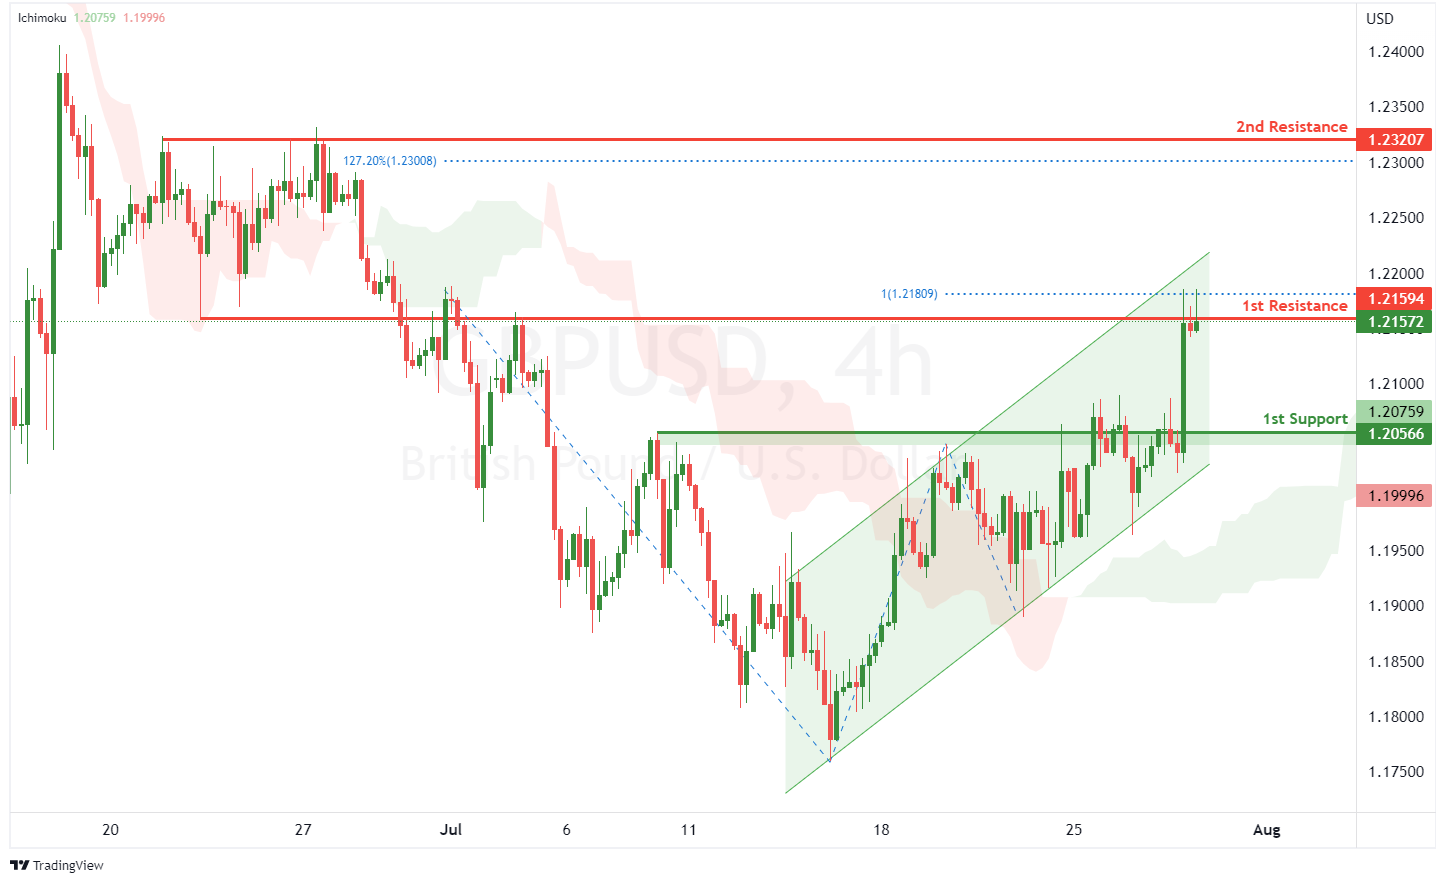
On the H4, with prices moving within an ascending channel and above the ichimoku indicator, we have a bullish bias that price will rise to the 1st resistance at 1.21594 where the pullback resistance and 100% fibonacci projection are. Once there is upside confirmation of price breaking 1st resistance, we would expect bullish momentum to carry price to 2nd resistance at 1.23207 where the swing high resistance and 127.2% fibonacci extension are. Alternatively, price could drop to 1st support at 1.20566 where the pullback support is.
Areas of consideration:
- H4 1st resistance at 1.21594
- H4 1st support at 1.20566
USD/CHF:
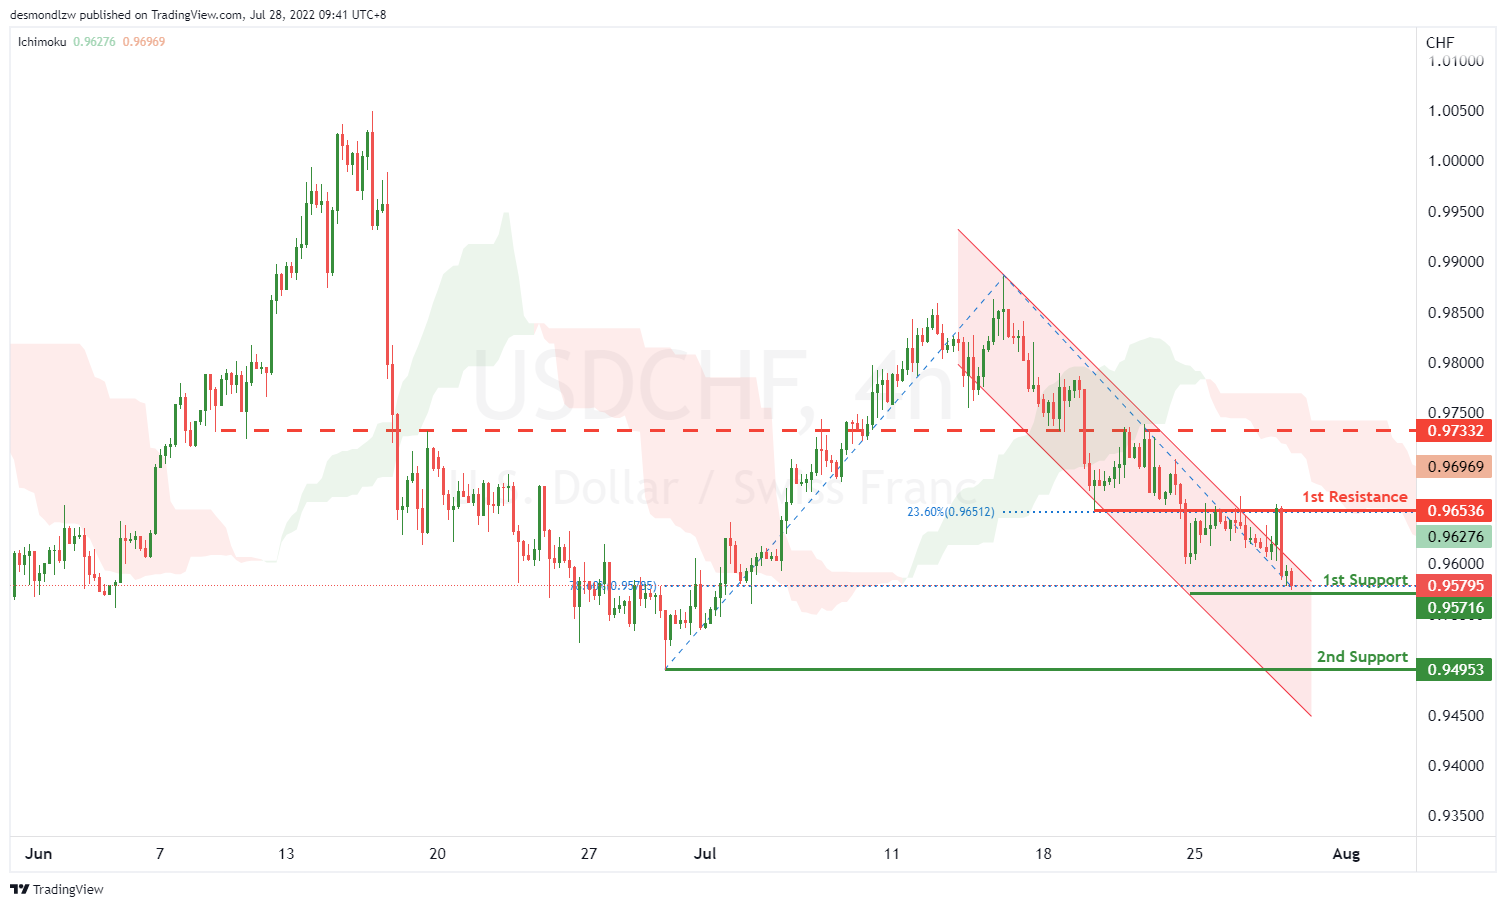
On the H4, with price moving along the descending channel, we have a bearish bias that price might drop from our 1st support at 0.95716, which is in line with 78.6% fibonacci retracement to the the 2nd support at 0.94953, which is in line with the swing low. Alternatively, price may bounce off from the 1st support and head for 1st resistance at 0.96536 where the 23.6% fibonacci retracement is. Take note the price of 0.97332 could be the 2nd resistance.
Areas of consideration
- 1st support level at 0.95716
- 2nd support level at 0.94953
EUR/USD :
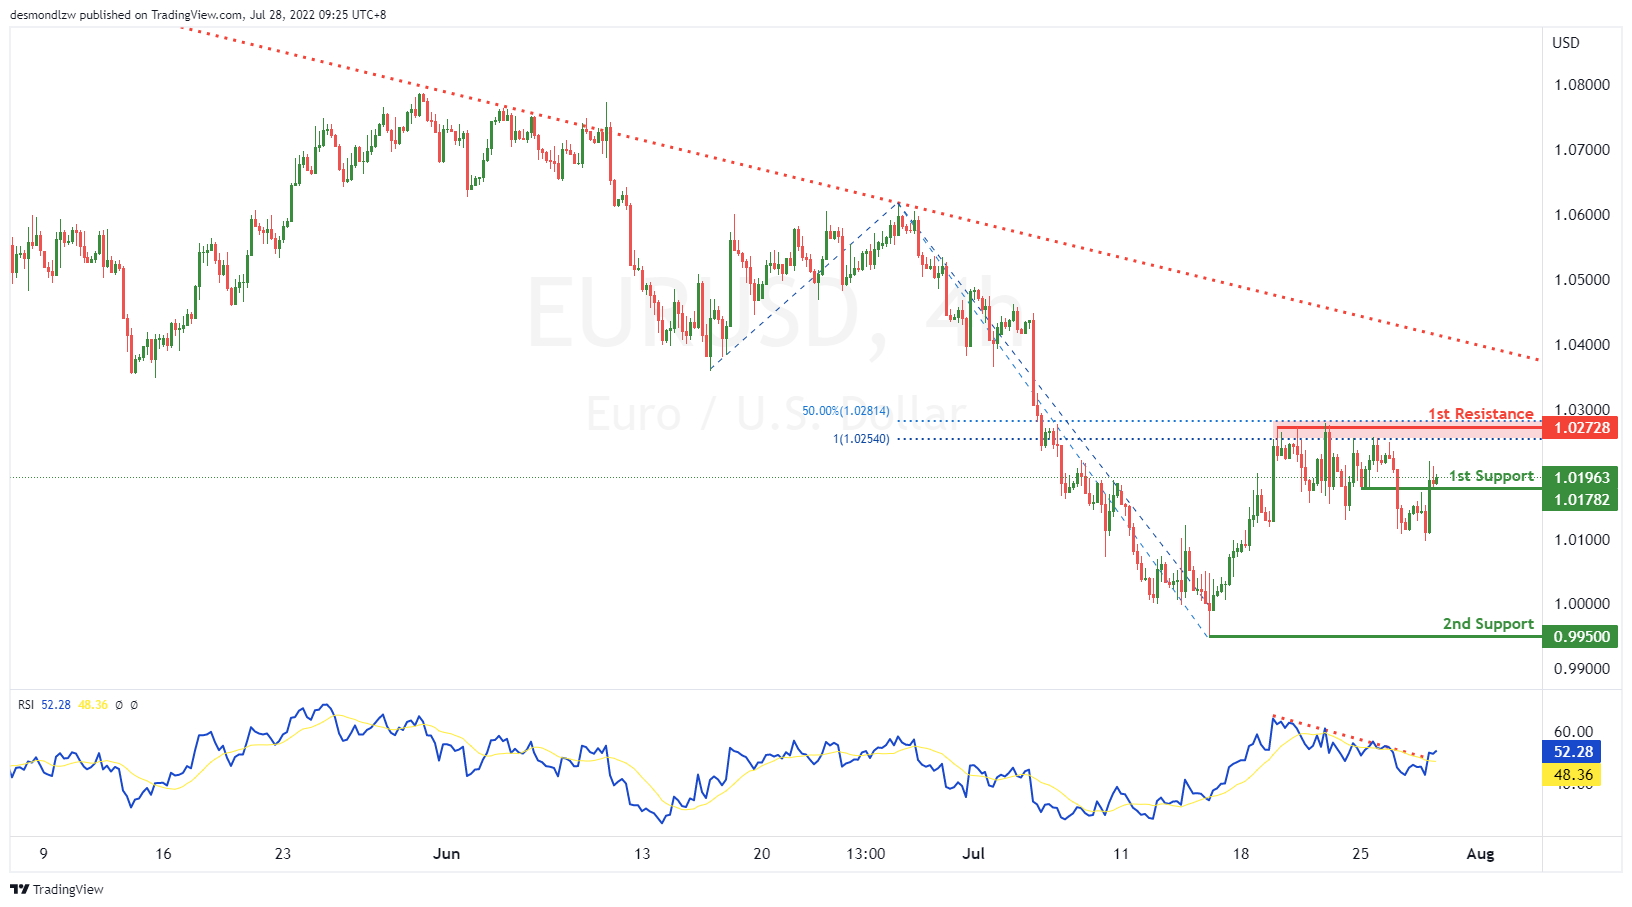
On the H4, with price bouncing off the ichimoku cloud and breaking out of the descending trend channel, we have a bullish bias that price will rise from the 1st support at 1.01782 at the pullback support to the 1st resistance at 1.02025 at the swing high in line with the 50% fibonacci retracement and 100% fibonacci projection . Alternatively, price may reverse off the 1st support and drop to the 2nd support at 1.01112 at the overlap support and swing low.
Areas of consideration :
- H4 1st resistance at 1.02025
- H4 1st support at 1.01782
USD/JPY:
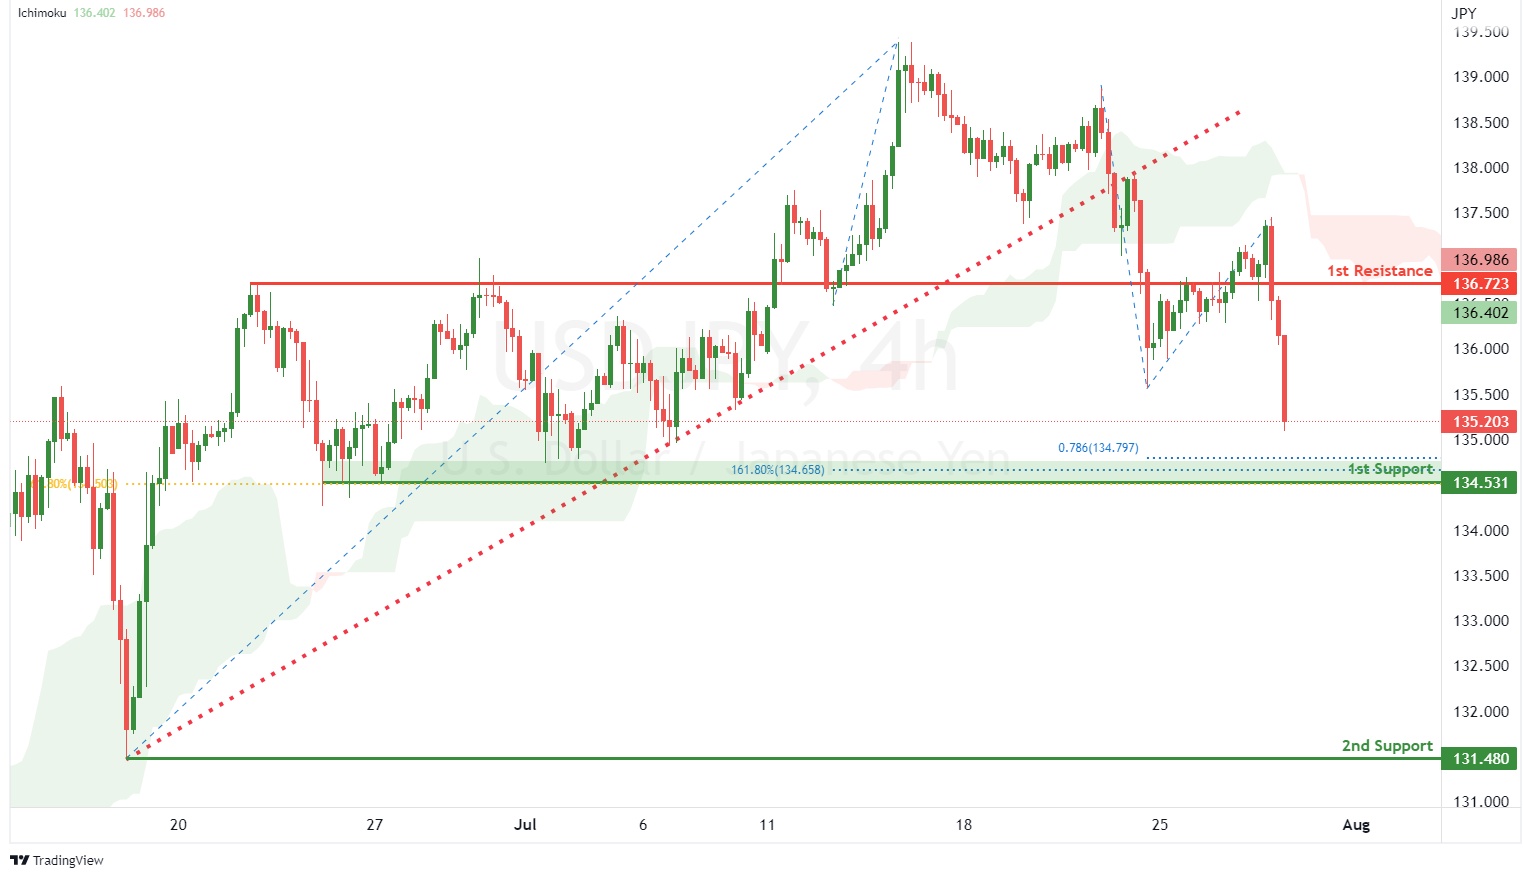
On the H4, with price broken out of the ascending trendline and moving below the ichimoku indicator, we have a bearish bias that price will drop to our 1st support at 134.531 where the swing low support, 61.8% fibonacci retracement, 78.6% fibonacci projection and 161.8% fibonacci extension are. Once there is downside confirmation of price breaking 1st support, we would expect bearish momentum to carry price to the 2nd support at 131.480 where the swing low support is. Alternatively, price could head for 1st resistance at 136.723 where the overlap resistance is.
Areas of consideration:
- H4 time frame, 1st resistance at 136.723
- H4 time frame, 1st support at 134.531
AUD/USD:
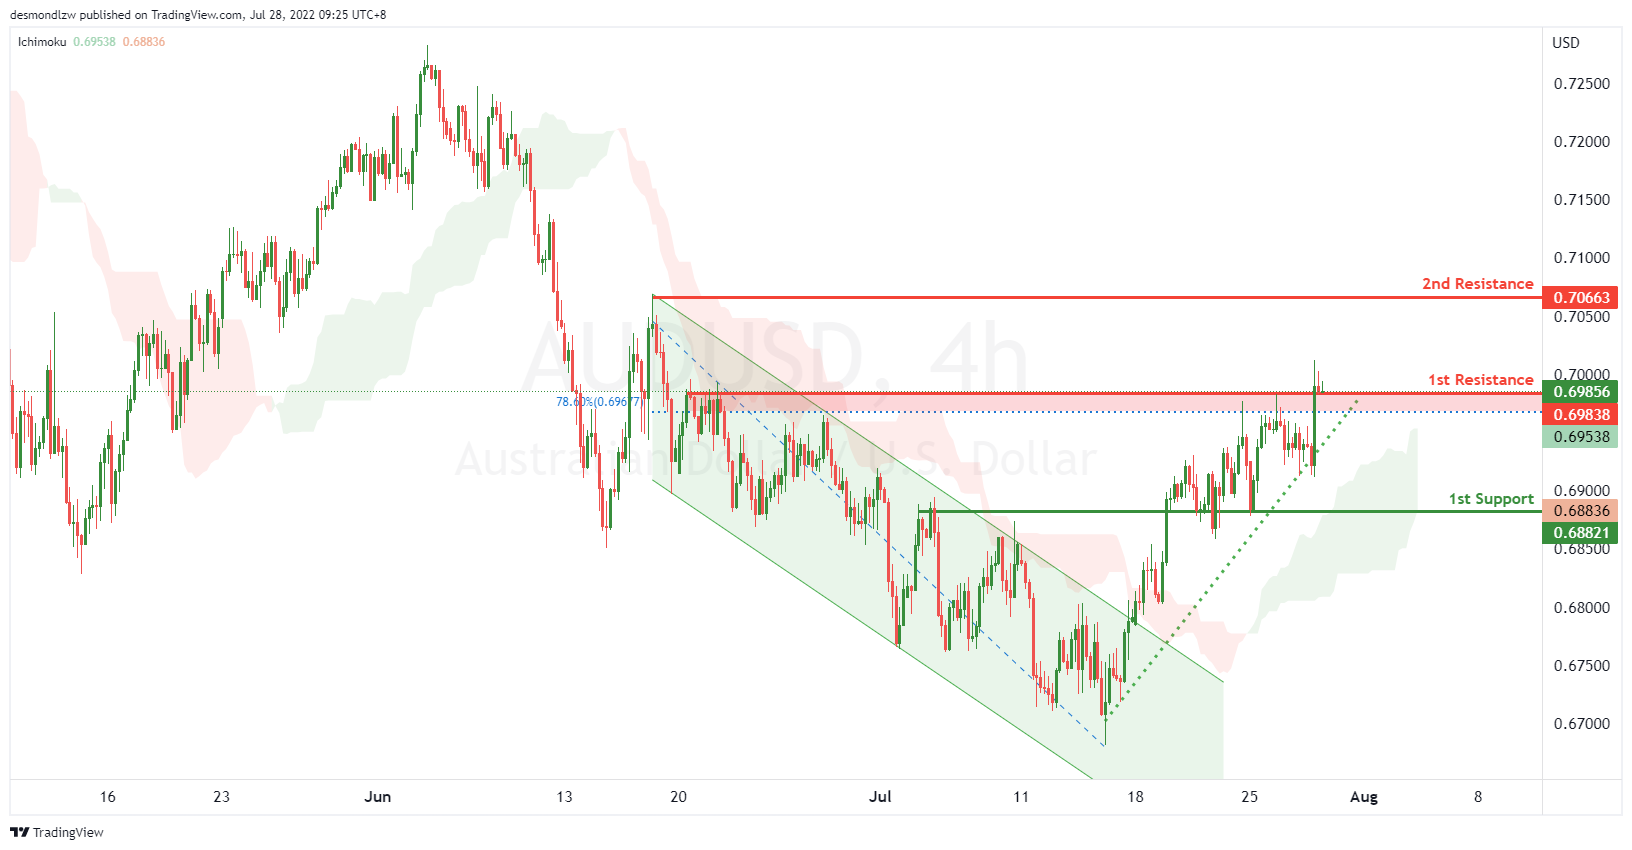
On the H4, with price moving above the ichimoku cloud and breaking out of the descending trend channel and moving in an ascending support, we have a bullish bias that price will rise from the 1st resistance at 0.69838 at the overlap resistance in line with the 78.6% fibonacci retracement to the 2nd resistance at 0.70663 at the swing high. Alternatively, price may reverse off 1st resistance and drop to the 1st support at 0.68021 at the overlap support.
Areas of consideration
- H4 1st resistance at 0.69838
- H4 1st support at 0.68021
NZD/USD:
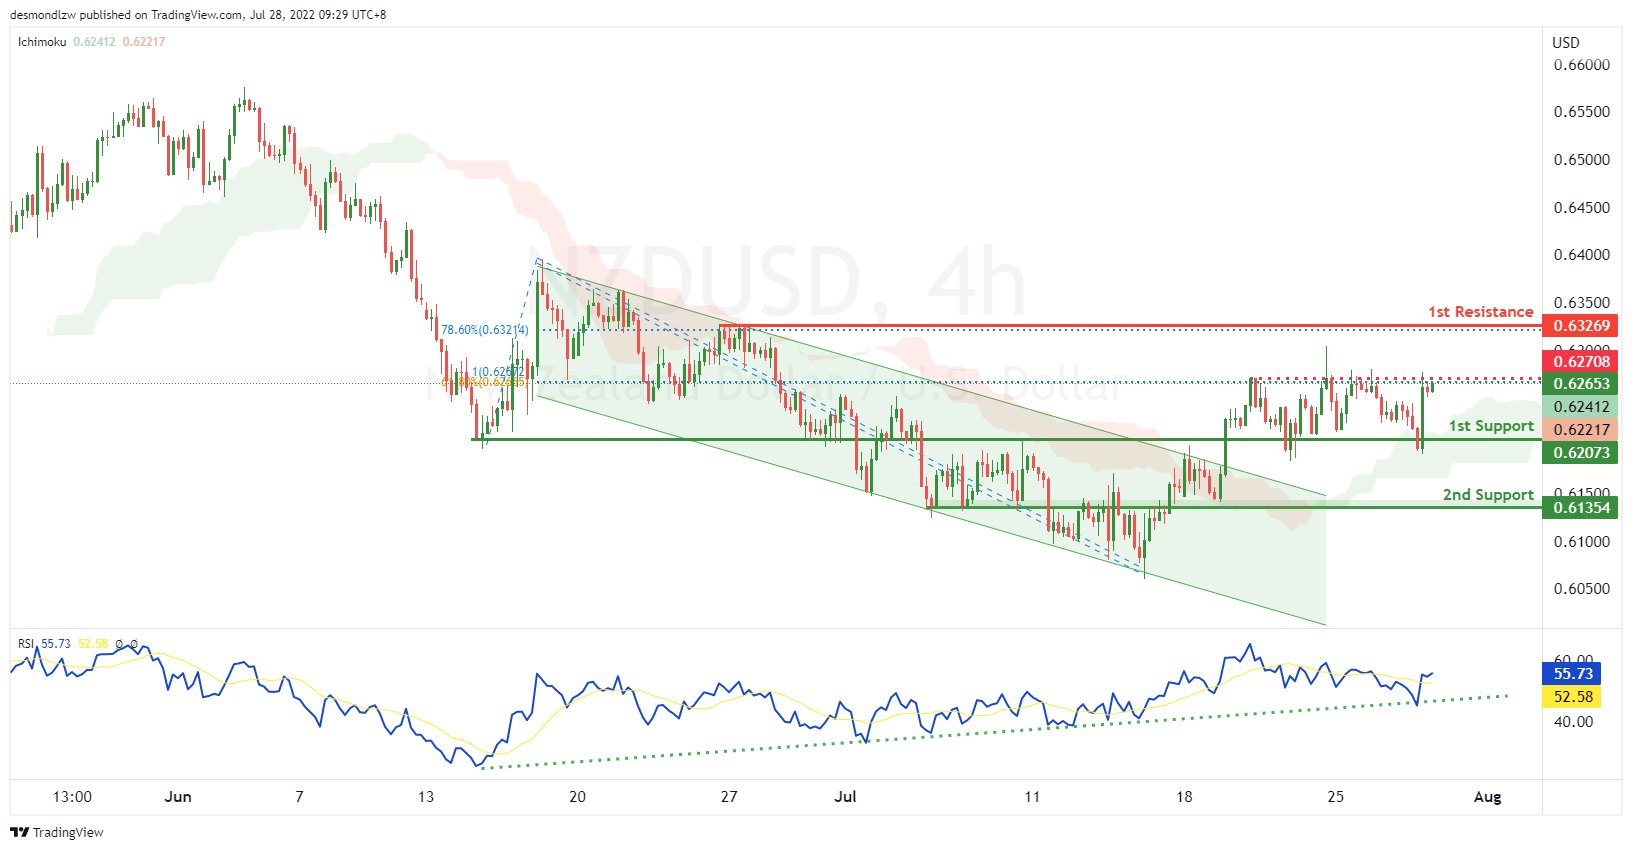
On the H4, with price breaking the descending trend channel, RSI showing an ascending trendline and moving above the ichimoku cloud, we have a bullish bias that price will rise from the 1st support at 0.62073 at the overlap support. If price breaks the intermediary resistance at 0.62708 at the swing high in line with the 61.8% fibonacci retracement and 100% fibonacci projection, we will have upside confirmation that price will rise to the 1st resistance at 0.63269 at the swing high in line with the 78.6% fibonacci retracement. Alternatively, price may break the support structure at the 1st support and drop to the 2nd support at 0.61354 at the pullback support.
Areas of consideration:
- H4 time frame, 1st support at 0.62073
- H4 time frame, 1st resistance at 0.63269
USD/CAD:
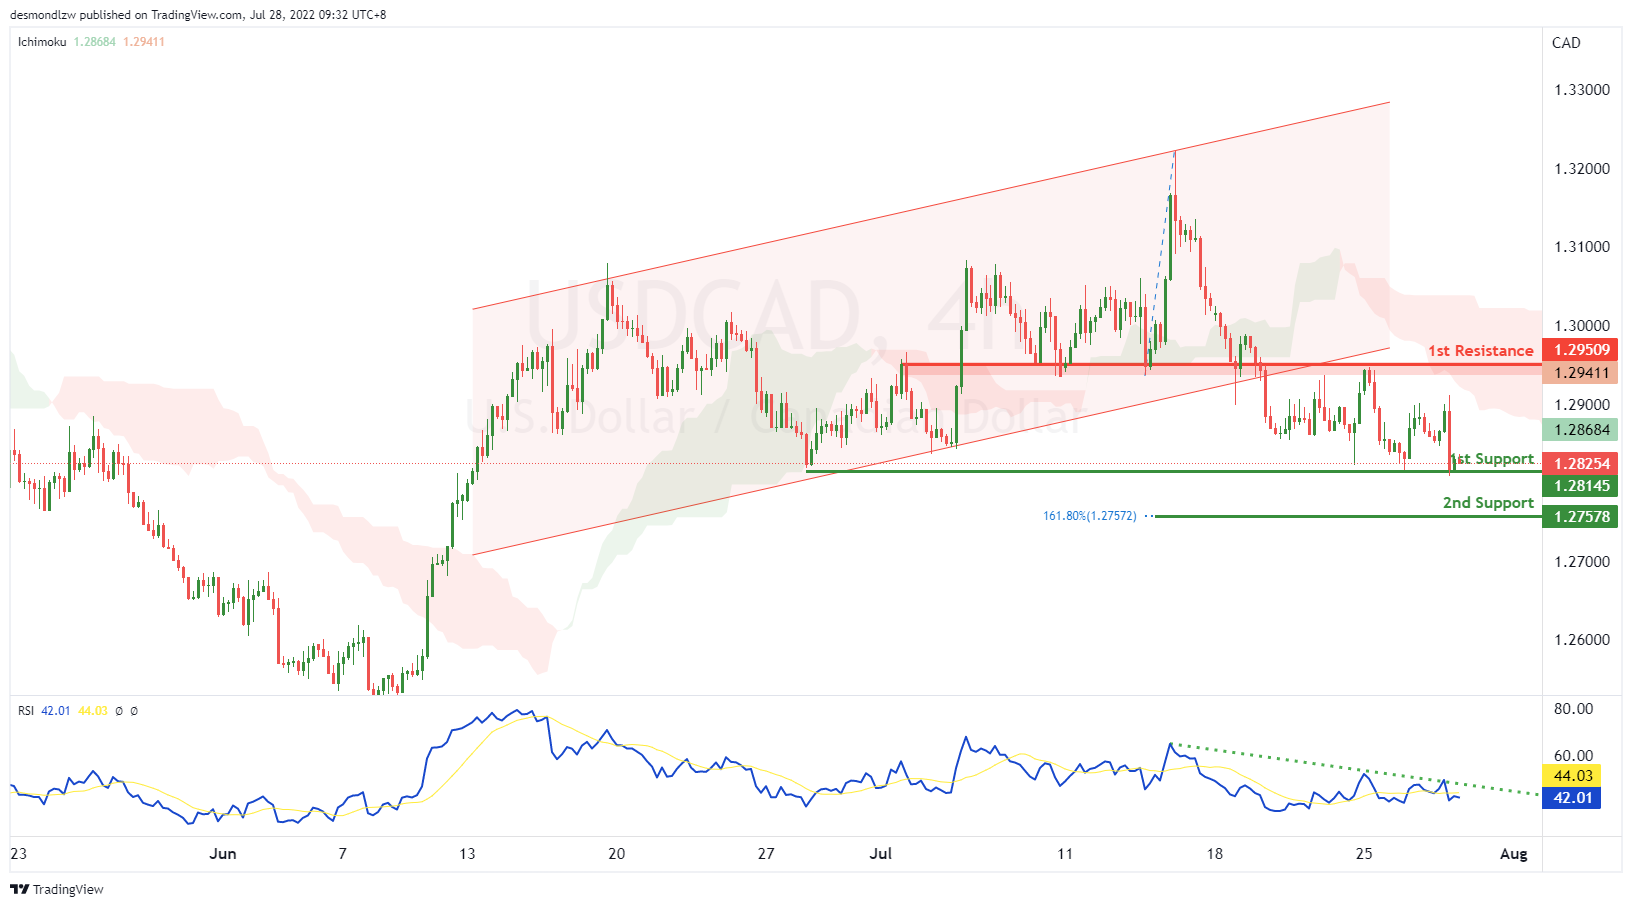
On the H4, with the price breaking the ascending channel, we have a bearish bias that the price may drop from our 1st support at 1.28145, which is in line with swing lows to our 2nd support at 1.27578, which is in line with the 161.8% fibonacci extension. Alternatively, the price may rise to the 1st resistance at 1.29509, which is in line with the overlap resistance.
Areas of consideration:
- H4 time frame, 1st support at 1.28145
- H4 time frame, 2nd support at 1.27578
OIL:
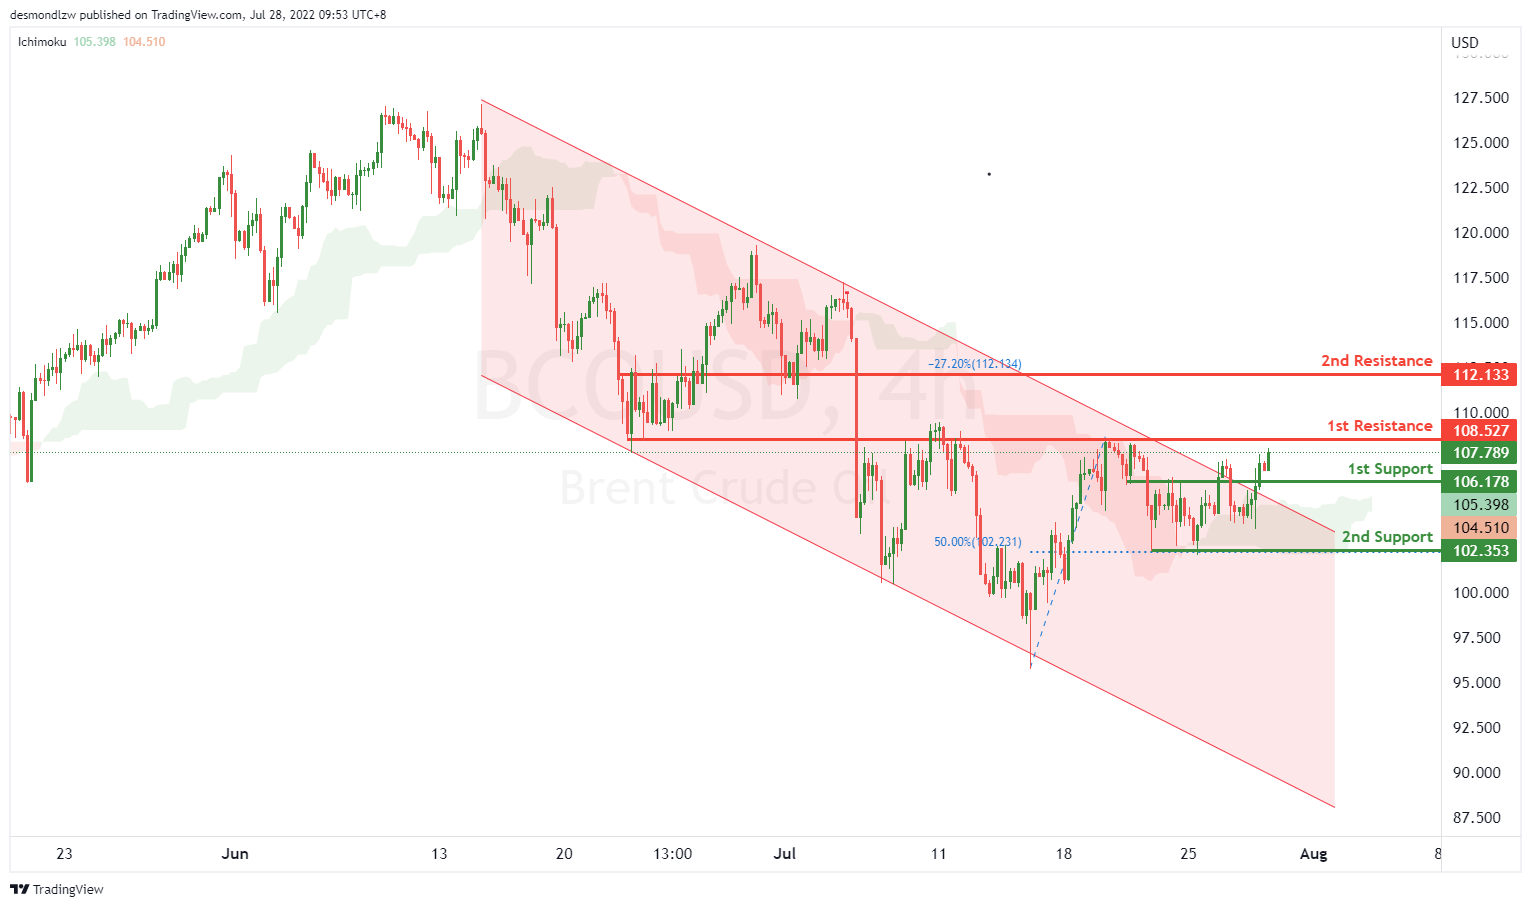
On the H4, with price breaking the bearish channel and moving above ichimoku indicator, we have a bearish bias that price might rise from our 1st resistance at 108.527, which is in line with the overlap resistance to our 2nd resistance at 112.133, which is in line with -27.2% fibonacci expansion. Alternatively, the price may drop to 1st support at 102.353, which is in line with pullback resistance and 50% fibonacci retracement.
Areas of consideration:
- H4 time frame, 1st resistance of 108.527
- H4 time frame, 2nd resistance of 112.133
Dow Jones Industrial Average:
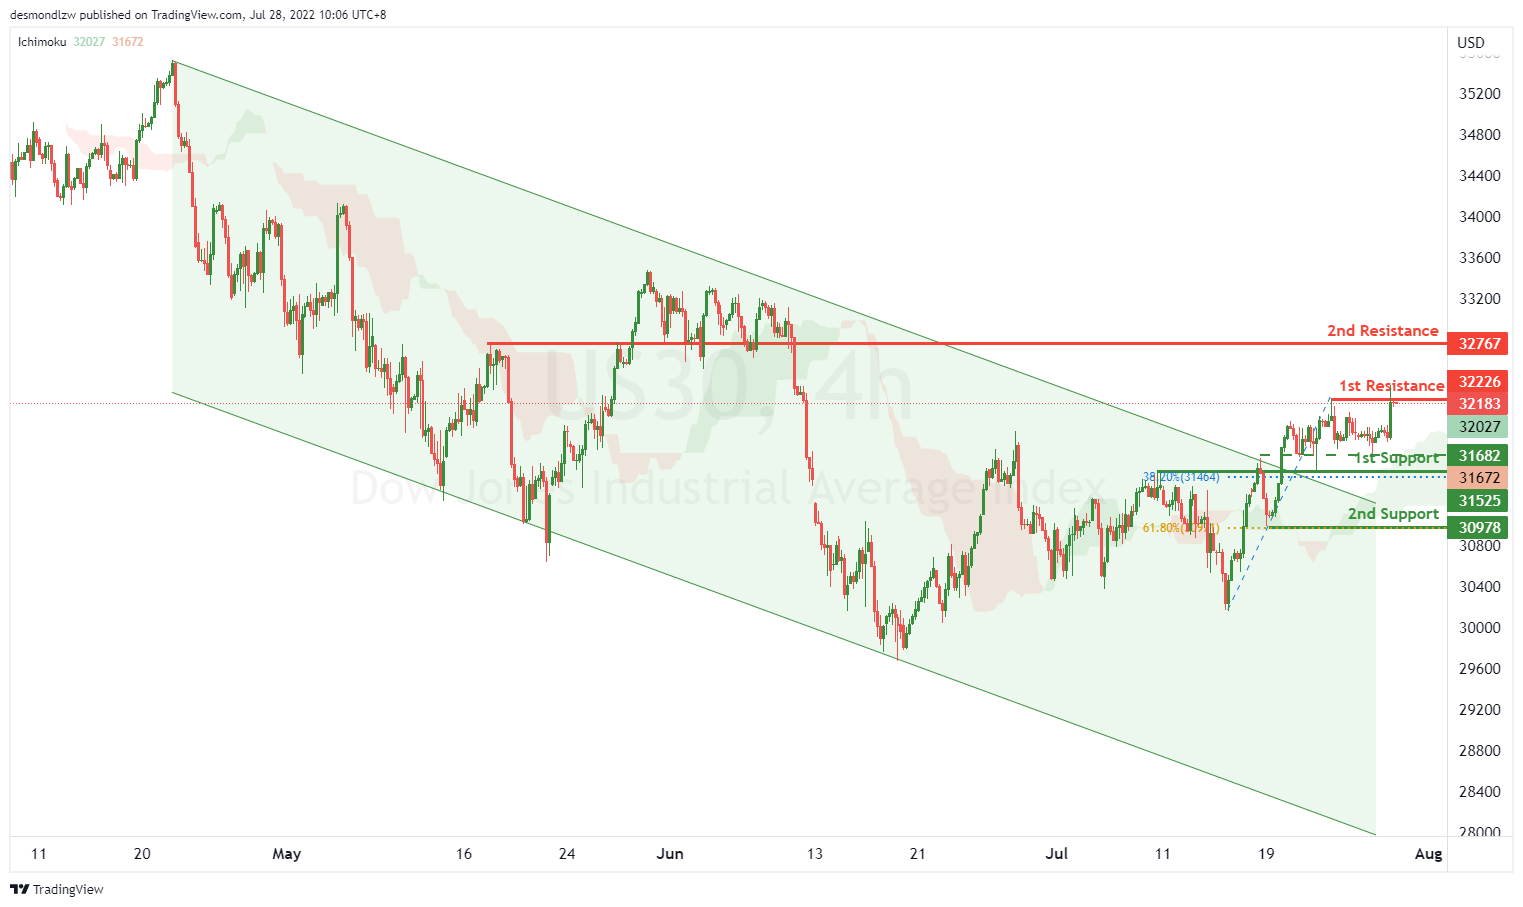
On the H4, with price moving with a bearish channel and having a bullish break, we have a bullish bias that price might rise from our 1st resistance at 32226, which is in line with the swing highs to our 2nd resistance at 32767, which is in line with overlap resistance. Alternatively, price may reverse off the 1st resistance and drop to the 1st support at 31525, which is in line with the overlap support and 38.2% fibonacci retracement, if the price keeps going down, it may drop to our 2nd support at 30978, which is in line with 61.8% fibonacci retracement. Take note the price is fluctuating currently and testing the support of 31682.
Areas of consideration:
- H4 time frame, 1st resistance of 32226
- H4 time frame, 2nd resistance at 32767