

Sample Category Title
GBP/JPY Daily Outlook
Daily Pivots: (S1) 155.46; (P) 155.97; (R1) 156.90; More...
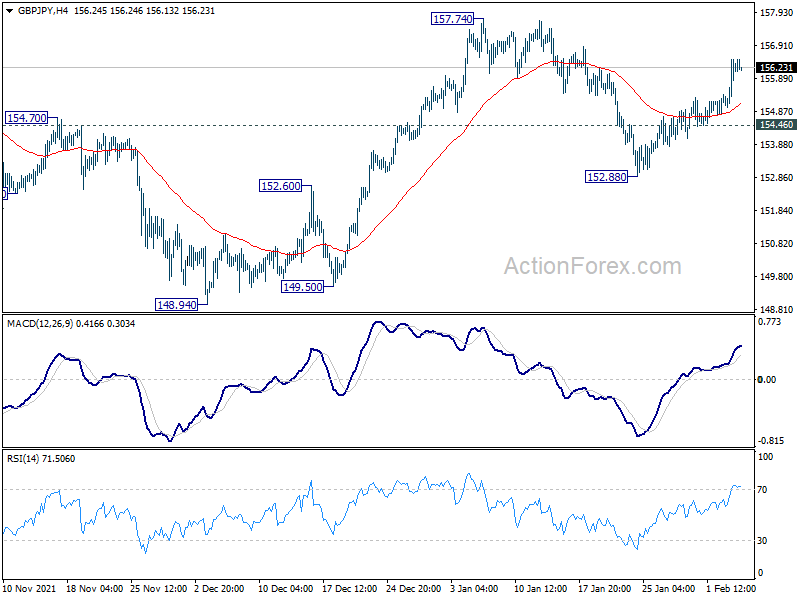
Intraday bias in GBP/JPY remains on the upside for retesting 157.74/158.19 resistance. Firm break there will resume larger up trend from 123.94. On the downside, break of 154.46 minor support will mix up the outlook again and turn intraday bias neutral.
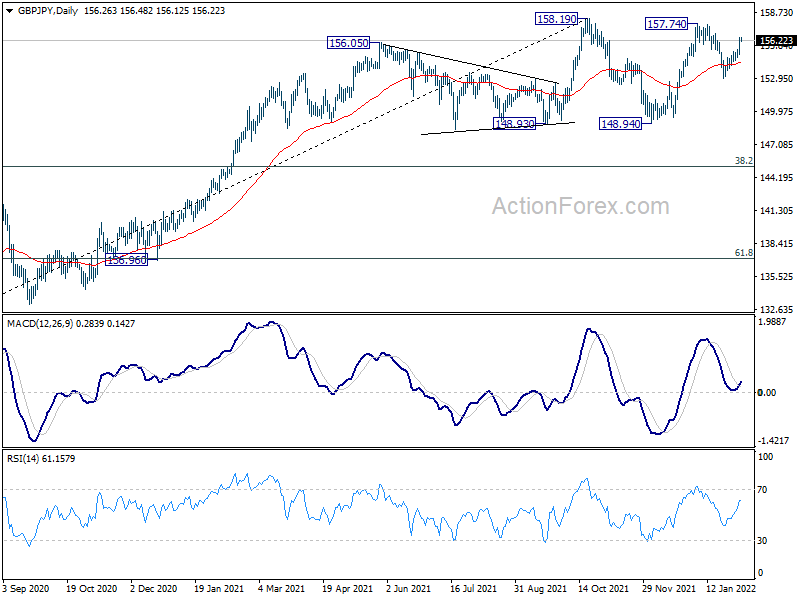
In the bigger picture, price actions from 158.19 are currently seen as developing into a consolidation pattern to up trend from 123.94 (2020 low). Downside should be contained by 123.94 to 158.19 at 145.10 to bring rebound. Firm break of 158.19 will resume the up trend to long term fibonacci level at 167.93. However, sustained break of 145.10 will raise the chance of trend reversal and target 61.8% retracement at 137.02.
EUR/JPY Daily Outlook
Daily Pivots: (S1) 129.97; (P) 130.76; (R1) 132.32; More....
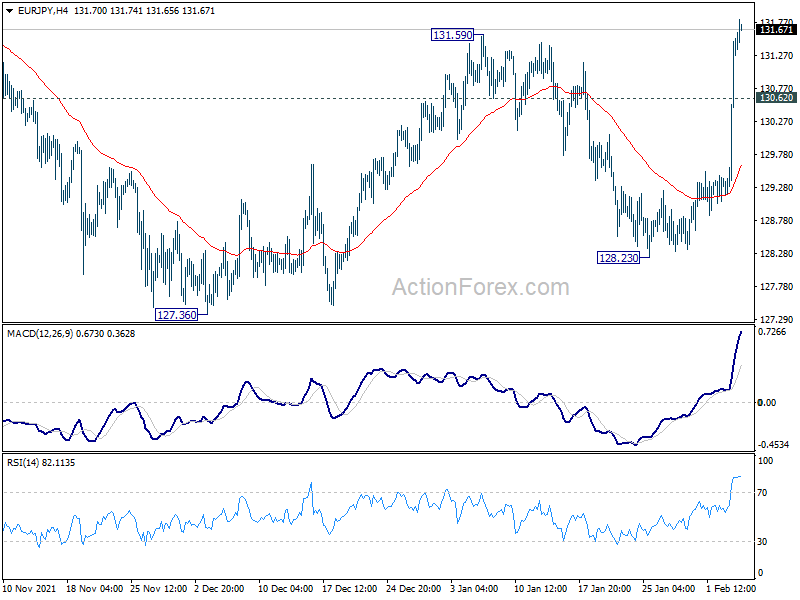
EUR/JPY's break of 131.59 resistance confirms resumption of whole rebound from 127.36. More importantly, the development revives the case that consolidation pattern from 134.11 has finished with three waves at 127.36. Intraday bias is back on the upside for retesting 133.44/134.11 resistance zone. Firm break there will resume larger up trend from 114.42. On the downside, below 130.62 minor support will turn intraday bias neutral and bring consolidation first, before staging another rally.
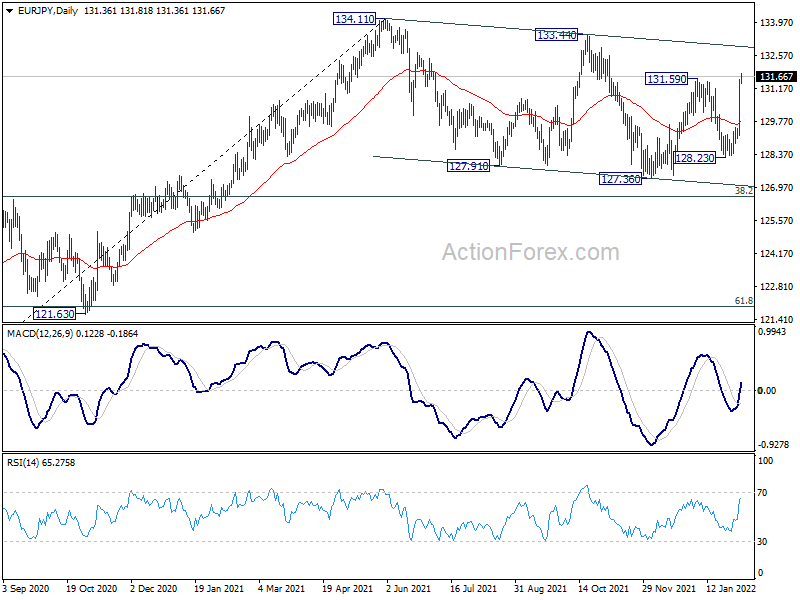
In the bigger picture, price actions from 134.11 are currently seen as a consolidation pattern only. As long as 38.2% retracement of 114.42 (2020 low) to 134.11 at 126.58 holds, up trend from 114.42 is still in favor to continue. Break of 134.11 will target long term resistance at 137.49 (2018 high). However, sustained break of 126.58 will raise the chance of bearish reversal. In this case, deeper decline would be seen to 61.8% retracement at 121.94, and possibly below.
EUR/GBP Daily Outlook
Daily Pivots: (S1) 0.8326; (P) 0.8371; (R1) 0.8457; More...
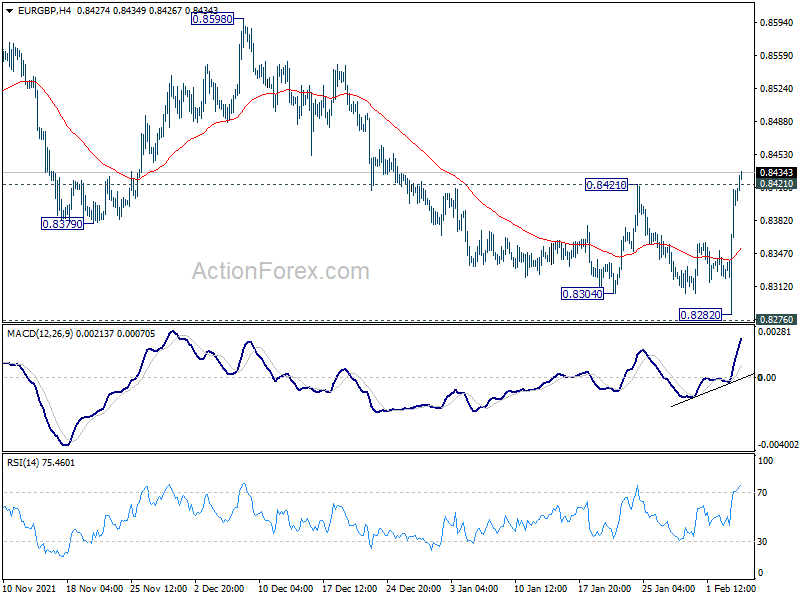
EUR/GBP's break of 0.8421 resistance indicates that a short term bottom is at least formed at 0.8282, just ahead of 0.8276 long term support. Intraday bias is back on the upside for 0.8598 structural resistance next. For now, risk will stay on the upside as long as 0.8282 support holds, even in case of deep retreat.
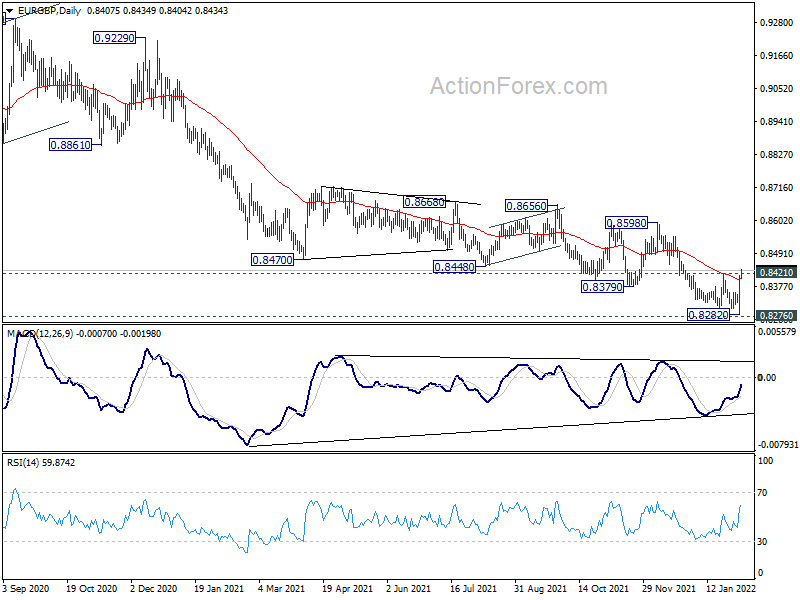
In the bigger picture, price actions from 0.9499 (2020 high) are still see a corrective pattern that should be contained by 0.8276 long term support. Bullish convergence condition in daily MACD and break of 55 day EMA raises the chance that it might be completed. Break of 0.8598 and sustained trading above 55 week EMA (now at 0.8578) should confirm this case and turn outlook bullish for 0.9499 high again. However, sustained break of 0.8276 will argue that the long term trend has reversed.
EUR/AUD Daily Outlook
Daily Pivots: (S1) 1.5890; (P) 1.5965; (R1) 1.6097; More...
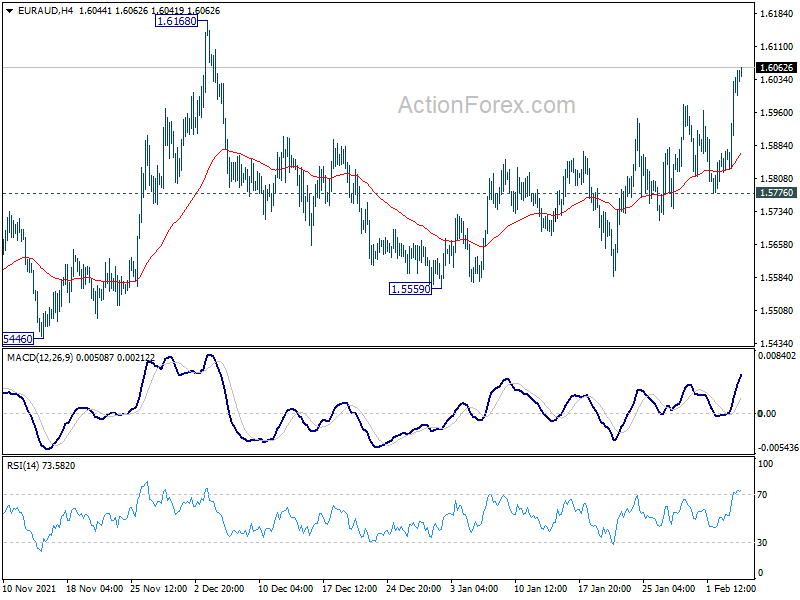
EUR/AUD's choppy rise from 1.5559 is still in progress and further rally should be seen to retest 1.6168 resistance first. Firm break there will target 1.6434 resistance next. However, on the downside, break of 1.5776 support will turn bias back to the downside for 1.5559 support instead.
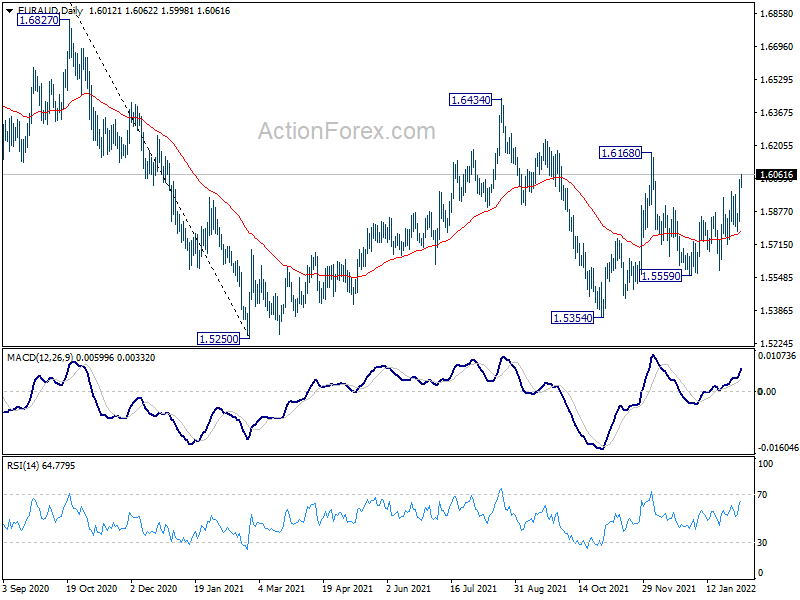
In the bigger picture, rise from 1.5354 is seen as the third leg of the corrective pattern from 1.5250 low. Further rise cannot be ruled out, but even in that case, strong resistance should be seen at 38.2% retracement of 1.9799 to 1.5250 at 1.6988. Larger down trend from 1.9799 is in favor to extend through 1.5250 at a later stage.
EUR/CHF Daily Outlook
Daily Pivots: (S1) 1.0427; (P) 1.0485; (R1) 1.0587; More....
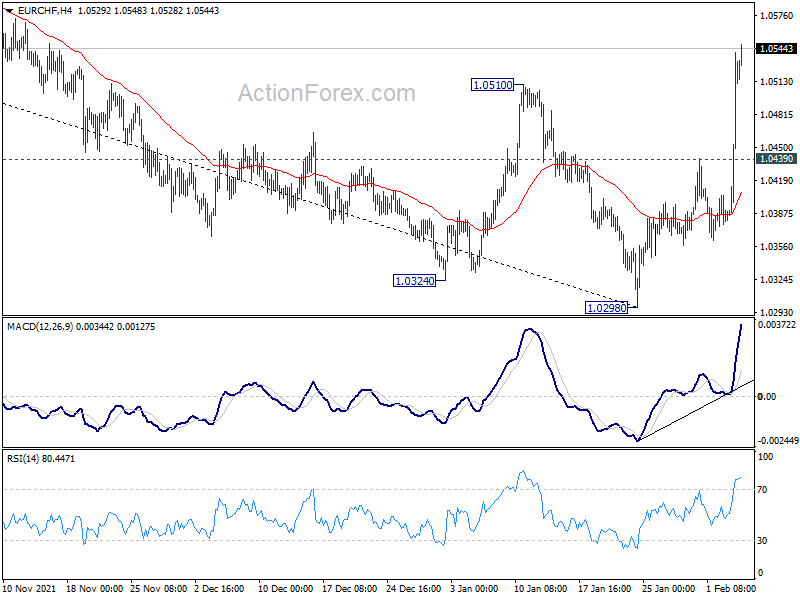
EUR/CHF's rebound from 1.0298 accelerates to as high as 1.0548 so far. The strong break of 1.0510 resistance argues that a medium term bottom was already formed at 1.0298, on bullish convergence condition in daily MACD. Intraday bias is now on the upside for 38.2% retracement of 1.1149 to 1.0298 at 1.0623 first. Sustained trading above there will raise the chance of trend reversal and target 61.8% retracement at 1.0824 next. For now, further rise will remain in favor as long as 1.0439 minor support holds, in case of retreat.
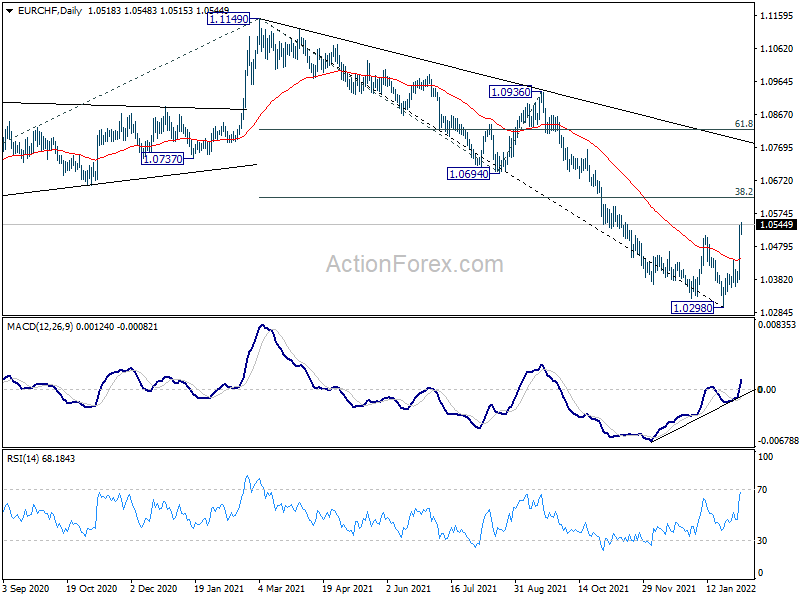
In the bigger picture, current development suggests that a medium term bottom is formed at 1.0298 on bullish convergence condition in daily MACD. Rebound from there is still tentatively viewed part of a corrective pattern. That is, larger down trend from 1.2004 (2018) could still extend through 1.0298 to 61.8% projection of 1.2004 to 1.0505 to 1.1149 at 1.0223. However, sustained trading above 55 week EMA (now at 1.0671) will argue that the down trend is over, and bring stronger rise back to 1.1149 next.
Euro Power Continues, Dollar Staying Pressured ahead of NFP
Euro remains in the spotlight in Asian session, as post-ECB rally is extending. Dollar is particularly in pressure as markets are awaiting disappointment from non-farm payroll job data. Yen is currently the second weakest for the week, following the greenback. Aussie is the second strongest, next to Euro, followed by Kiwi. Focuses will turn to non-farm payroll report from the US today, and the reactions from stocks, yields and currencies.
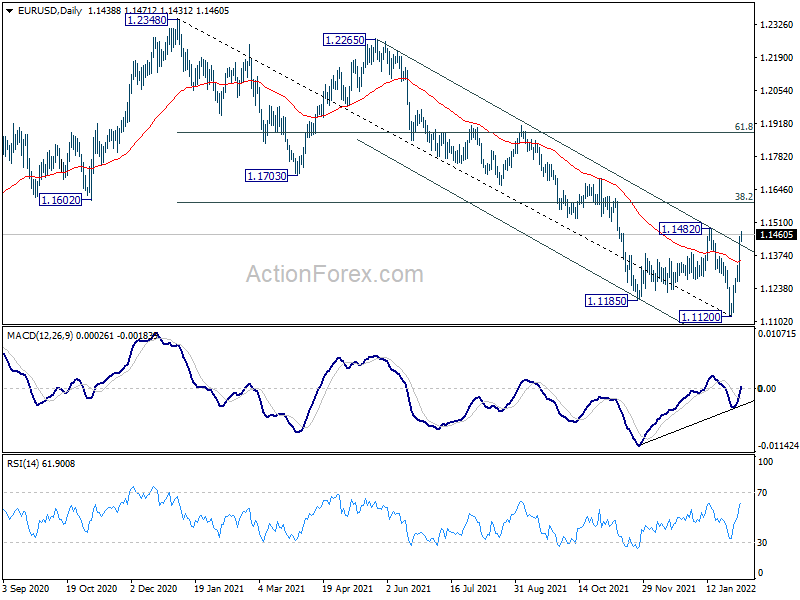
Technically, EUR/GBP's break of 0.8421 resistance, as well as 55 day EMA, now raises the chance of major bottoming at 0.8282, just ahead of 0.8276 key long term support. Further rally should at least be seen towards 0.8598 resistance to have a test on it. EUR/CHF's break of 1.0510 resistance also indicates medium term bottoming at 1.0298. Now, focus will be on 1.1482 resistance in EUR/USD. Firm break there will align with the bullish outlook in Euro.
In Asia, at the time of writing, Nikkei is up 0.76%. Hong Kong HSI is up 3.18%. China is still on holiday. Singapore Strait Times is up 0.20%. Japan 10-year yield is up 0.0259 at 0.206, back above 0.2 handle! Overnight, DOW dropped -1.45%. S&P 500 dropped -2.44%. NASDAQ dropped -3.74%. 10-year yield rose 0.061 to 1.827.
Fed Barkin: Interest rates at pre-pandemic levels are place to reassess
Richmond Fed President Thomas Barkin in a Reuters interview, "it is a straightforward call to say we ought to get rates back into better position. It does not feel to me like there is enough information to say holy cow we have to restrain the economy right now."
Barkin added that the federal funds rate should be raised back to where it was just before the pandemic, that is, a range of 1.50-1.75%. "Pre-pandemic levels are the place to reassess. Where we were pre-pandemic was under every member of the (Federal Open Market Committee's) assessment of where neutral was," he said.
"Then we can look around and say do you want to then start to move into the range ... where we are starting to restrain?"
BoJ Kuroda: Hard to see inflation sustainably reach target without wages rise
BoJ Governor Haruhiko Kuroda told the parliament today that inflation remains subdued in Japan because of the delay in recovery from pandemic, the public's deflationary mindset and firms' assumption that prices won't rice much.
"In Japan, nominal wages haven't risen much. It's hard to see inflation sustainably reach our 2 per cent target unless wages rise in tandem with prices," he said.
"It's important to maintain powerful monetary easing to support the economy, and help generate steady wage and price growth."
Dollar index shaky as NFP might disappoint
US non-farm payroll report is a major focus today. Markets are expecting 150k job growth in January. Unemployment rate is expected to stay unchanged at 3.90%. Average hourly earnings are expected to grow 0.50% mom.
Looking at related economic data, ADP private job was a big disappointment with -301k losses. ISM manufacturing employment ticked up from 53.9 to 54.5. ISM services employment dropped from 54.9 to 52.3. Four-week moving average of initial jobless claims rose from 205k to 255k. All in all, there are prospects of downside surprise in today's NFP readings, except wages growth.
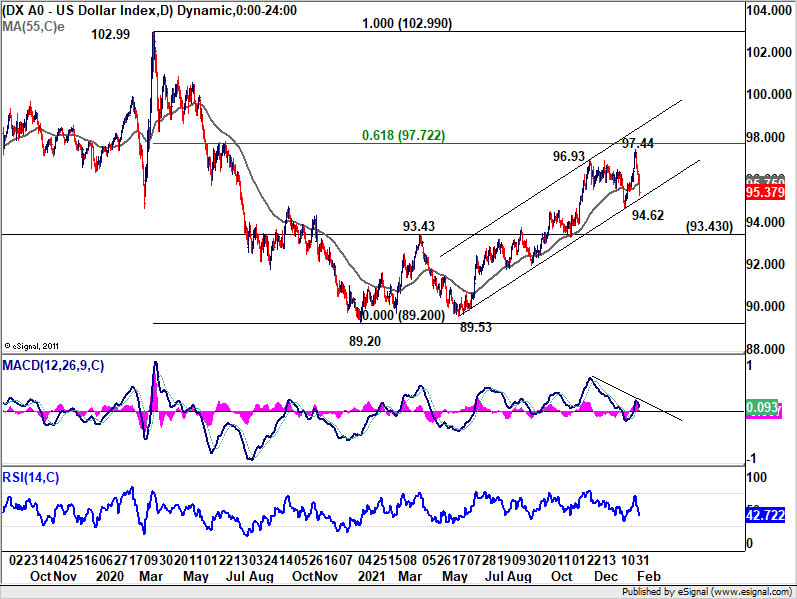
Dollar index had a steep decline this week, thanks to the strong rebound in EUR/USD. The question now is on whether long term fibonacci level of 61.8% retracement of 102.99 to 89.20 at 97.72 is too much for DXY to overcome. Sustained break of trend line support at around 95.00 will argue that a medium term top was formed at 97.44, on bearish divergence condition in daily MACD. In this case, DXY would likely drop through 94.62 towards 93.43 resistance turned support before finding a bottom. Reactions to today's NFP could guidance the direction for the rest of the quarter.
Elsewhere
New Zealand building permits rose 0.6% mom in December. RBA monetary policy statement reiterated that the central bank will be patient on interest rates.
Germany factory orders, France industrial output, UK construction PMI and Eurozone retail sales will be released in European session.
Later in the day, Canada will release employment data and Ivey PMI while US will release non-farm payroll employment.
EUR/CHF Daily Outlook
Daily Pivots: (S1) 1.0427; (P) 1.0485; (R1) 1.0587; More....
EUR/CHF's rebound from 1.0298 accelerates to as high as 1.0548 so far. The strong break of 1.0510 resistance argues that a medium term bottom was already formed at 1.0298, on bullish convergence condition in daily MACD. Intraday bias is now on the upside for 38.2% retracement of 1.1149 to 1.0298 at 1.0623 first. Sustained trading above there will raise the chance of trend reversal and target 61.8% retracement at 1.0824 next. For now, further rise will remain in favor as long as 1.0439 minor support holds, in case of retreat.
In the bigger picture, current development suggests that a medium term bottom is formed at 1.0298 on bullish convergence condition in daily MACD. Rebound from there is still tentatively viewed part of a corrective pattern. That is, larger down trend from 1.2004 (2018) could still extend through 1.0298 to 61.8% projection of 1.2004 to 1.0505 to 1.1149 at 1.0223. However, sustained trading above 55 week EMA (now at 1.0671) will argue that the down trend is over, and bring stronger rise back to 1.1149 next.
Economic Indicators Update
| GMT | Ccy | Events | Actual | Forecast | Previous | Revised |
|---|---|---|---|---|---|---|
| 21:45 | NZD | Building Permits M/M Dec | 0.60% | 0.60% | ||
| 00:30 | AUD | RBA Monetary Policy Statement | ||||
| 07:00 | EUR | Germany Factory Orders M/M Dec | 0.50% | 3.70% | ||
| 07:45 | EUR | France Industrial Output M/M Dec | 0.50% | -0.40% | ||
| 09:30 | GBP | Construction PMI Jan | 54.3 | 54.3 | ||
| 10:00 | EUR | Eurozone Retail Sales M/M Dec | -0.50% | 1.00% | ||
| 13:30 | USD | Nonfarm Payrolls Jan | 150K | 199K | ||
| 13:30 | USD | Unemployment Rate Jan | 3.90% | 3.90% | ||
| 13:30 | USD | Average Hourly Earnings M/M Jan | 0.50% | 0.60% | ||
| 13:30 | CAD | Net Change in Employment Jan | -121.5K | 54.7K | ||
| 13:30 | CAD | Unemployment Rate Jan | 6.00% | 5.90% | ||
| 15:00 | CAD | Ivey PMI Jan | 55.1 | 45 |
Technical Outlook and Review
DXY:
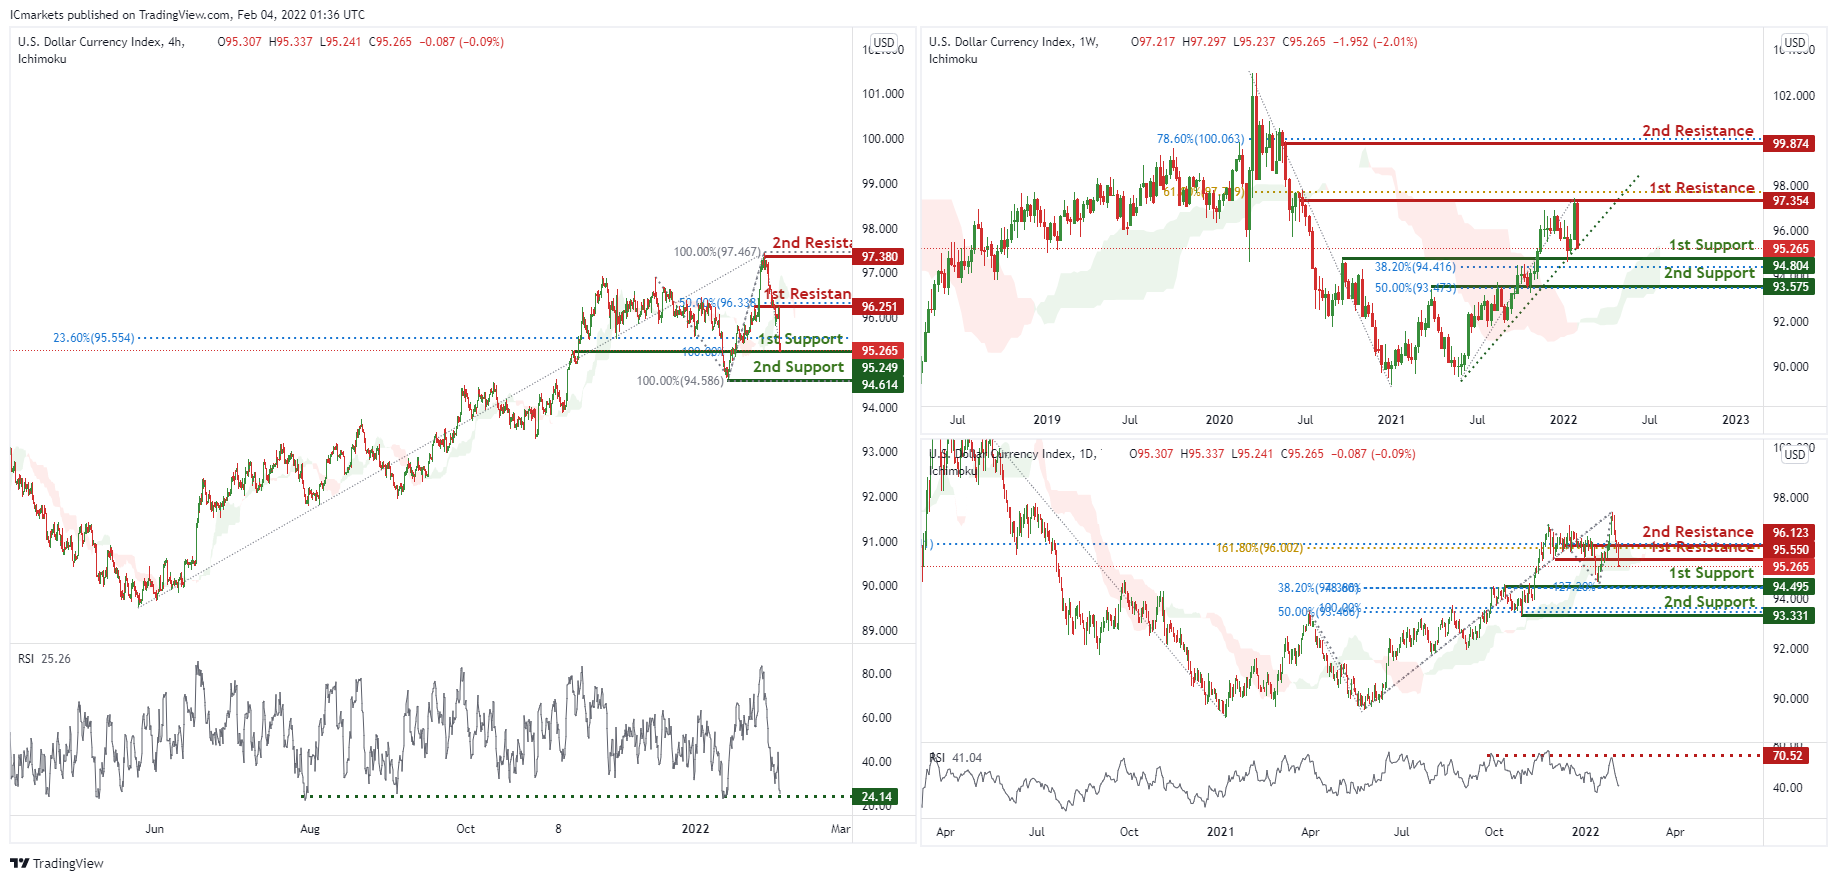
On the weekly, prices are on bullish momentum and abiding to our ascending trendline. We see potential for prices to bounce from our 1st support at 94.804 in line with 38.2% Fibonacci retracement and 50% Fibonacci retracement towards our 1st resistance at 97.354 in line with 61.8% Fibonacci retracement. Prices are trading above our ichimoku cloud support, further supporting our bullish bias.
On the daily, prices are on bearish momentum. We see potential for prices to dip from our 1st resistance at 95.265 which is a graphical overlap towards our 1st support at 94.495 in line with 38.2% Fibonacci retracement and 78.6% Fibonacci extension. RSI are at levels where dips previously occurred.
On the H4 timeframe, prices have reached a graphical overlap and on bullish momentum. We would expect a bounce from our 1st support at 95.249 in line with 100% Fibonacci extension and 23.6% Fibonacci retracement towards our 1st resistance at 96.251 in line with 50% Fibonacci retracement. RSI is at a level where bounces previously occurred and also ichimoku clouds are forecasting bullish momentum.
Areas of consideration:
- H4 time frame, 1st resistance at 96.251
- H4 time frame, 1st support at 95.249
XAU/USD (GOLD):
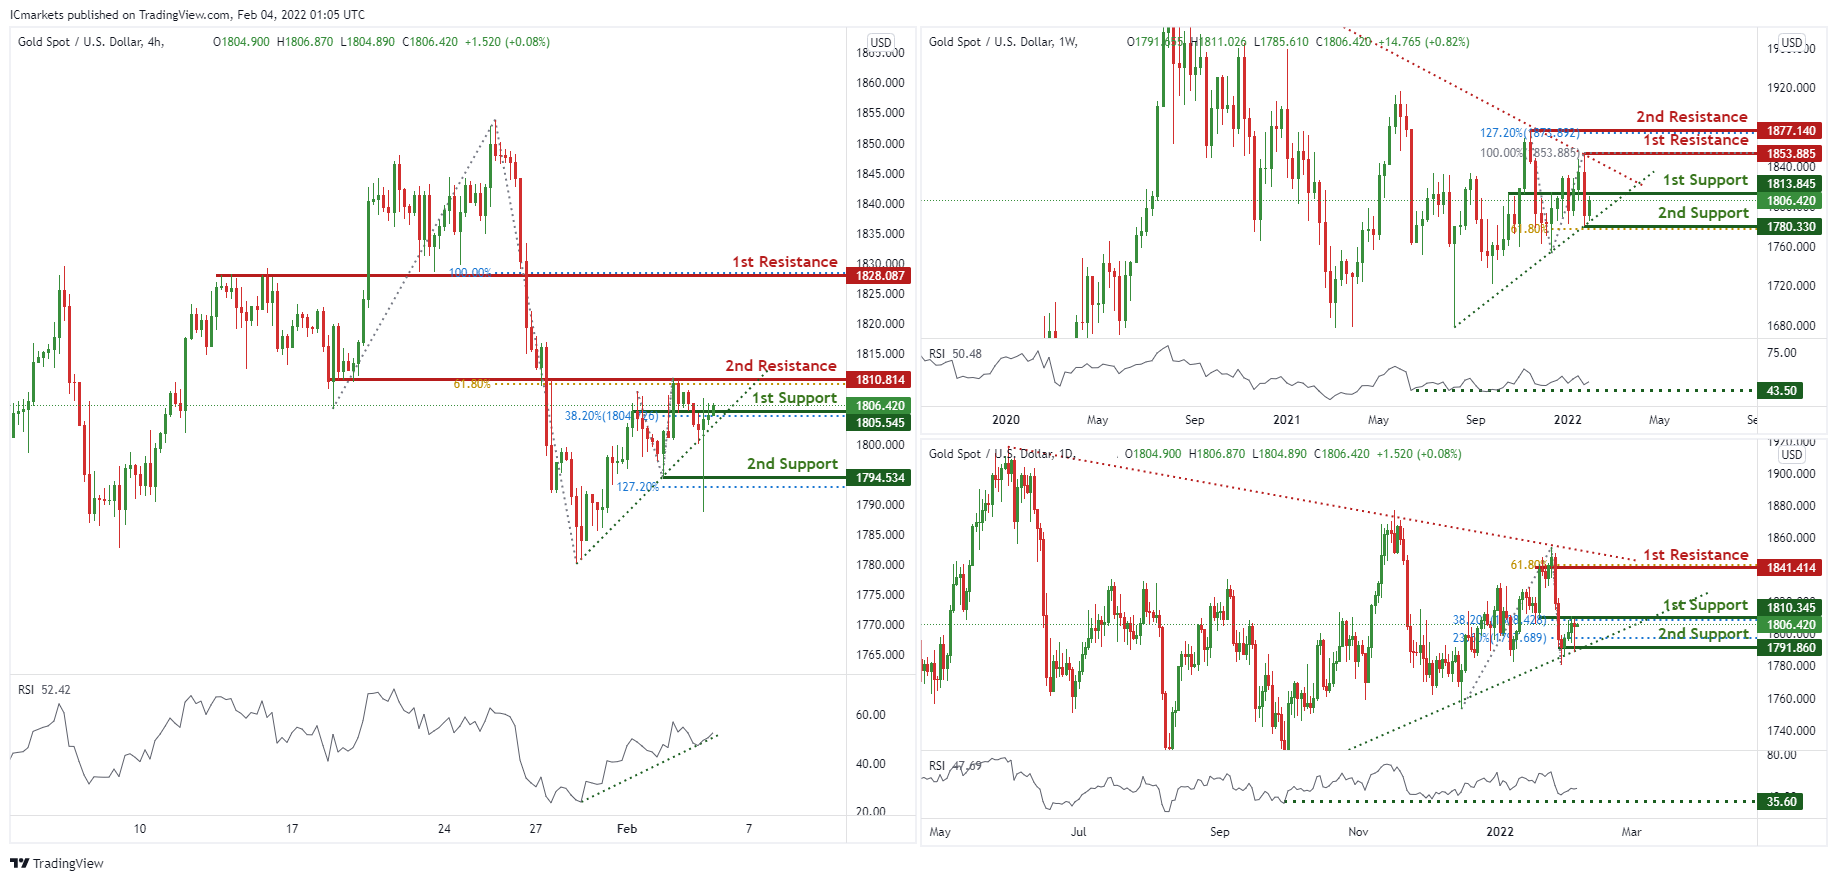
On the weekly, prices are consolidating in a triangle and have the potential to climb from our 1st support at 1813.845 which is a graphical overlap towards our 1st resistance at 1853.885 in line with 100% Fibonacci retracement. RSI is at levels where bounces previously occur.
On the daily, prices are consolidating in a triangle. We see potential for a bounce from our 1st support at 1806.42 in line with 38.2% Fibonacci retracement towards our 1st resistance at 1841.414 in line with 61.8% Fibonacci extension. Our bias is further supported by RSI at levels where bounces previously occurred.
On the H4 chart, prices areon bullish momentum and abiding to our ascending trendline support. We see potential for prices to bounce from our 1st support at 1805.545 towards our 1st resistance at 1810.814 in line with 61.8% Fibonacci extension. RSI are on bullish momentum.
Areas of consideration:
- 4h 1st support at 1805.545
- 4h 1st resistance at 1810.814
GBP/USD
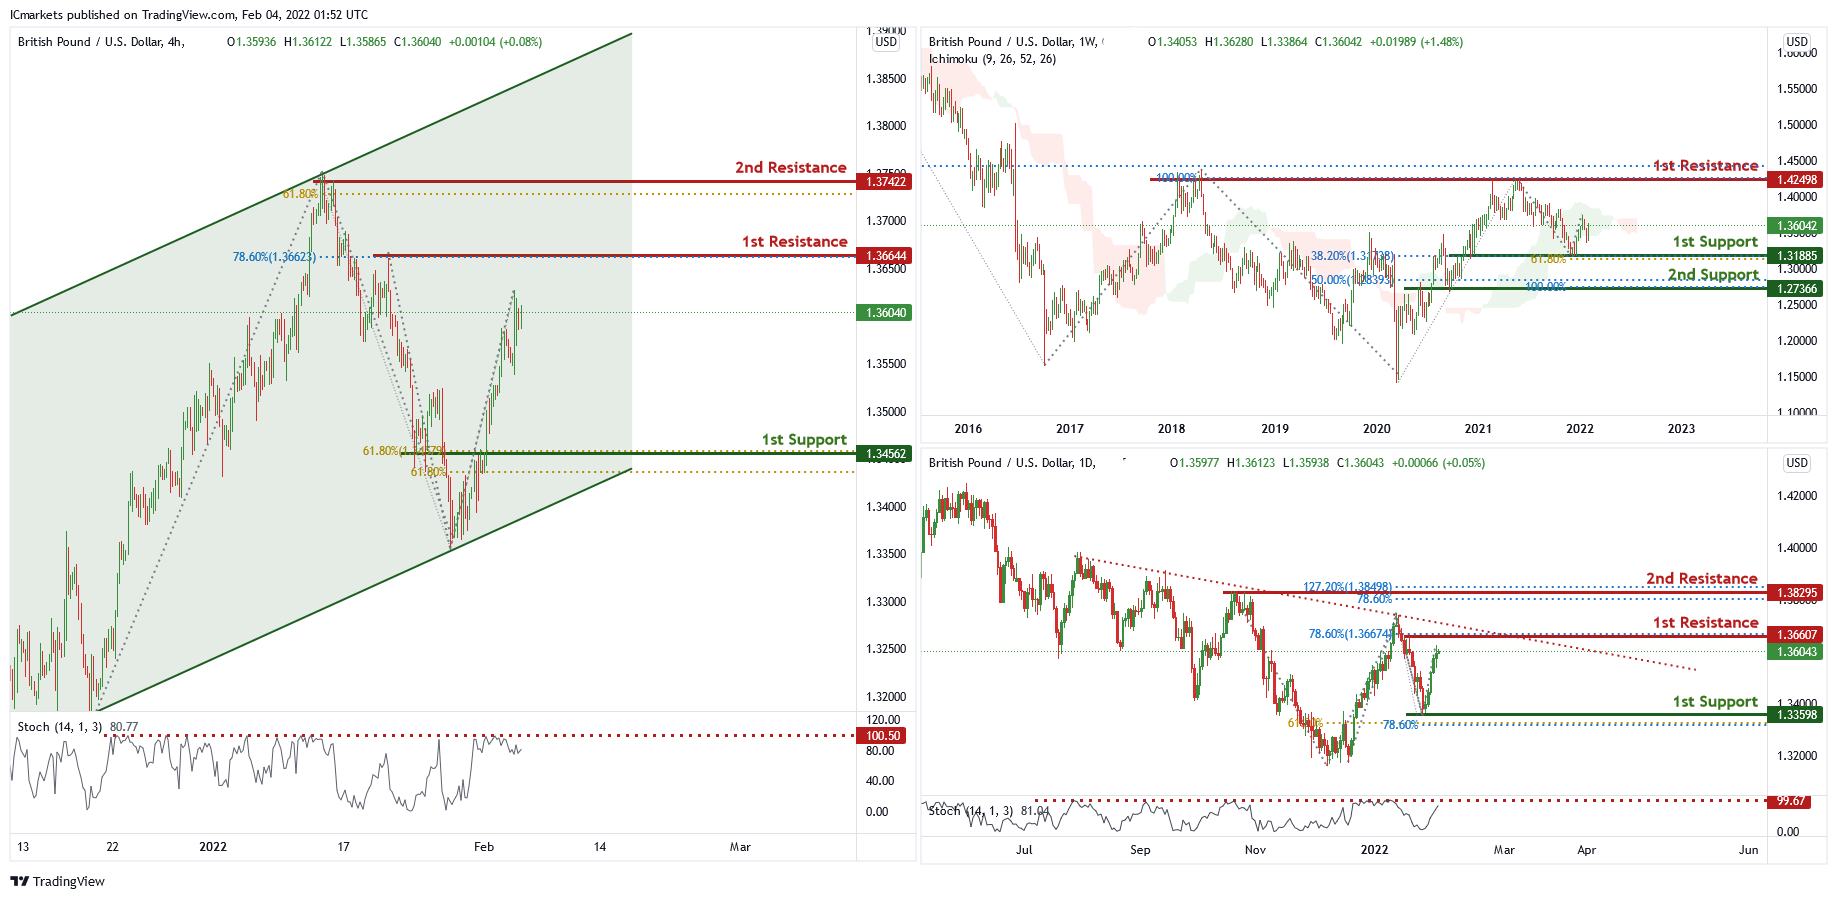
On the weekly chart , price has recently bounced off the 1st support level of 1.31885 which is also 38.2% Fibonacci retracement and 61.8% Fibonacci projection. Price can potentially go to the 1st resistance level of 1.42498 which is also 100% Fibonacci projection and 50% Fibonacci retracement. Our bullish bias is supported by the ichimoku cloud indicator.
On the daily chart , price is abiding by a descending trendline and near the 1st resistance level of 1.36607 which is 78.6% Fibonacci retracement. Price can potentially dip to the 1st support level of 1.33598 which is also 61.8% Fibonacci projection and 78.6% Fibonacci retracement. Our bearish bias is supported by the stochastic indicator as it is near resistance level.
On the H4 chart, price is trading in an ascending channel and is near 1st resistance level of 1.36644 which is also 78.6% Fibonacci retracement. Price can potentially dip to the 1st support level of 1.34562 which is also 61.8% Fibonacci retracement and 61.8% Fibonacci projection. Our bearish bias is supported by a stochastic indicator as it is near resistance level.
Areas of consideration
- H4 1st support at 1.34562
- H4 1st resistance at 1.36644
USD/CHF:
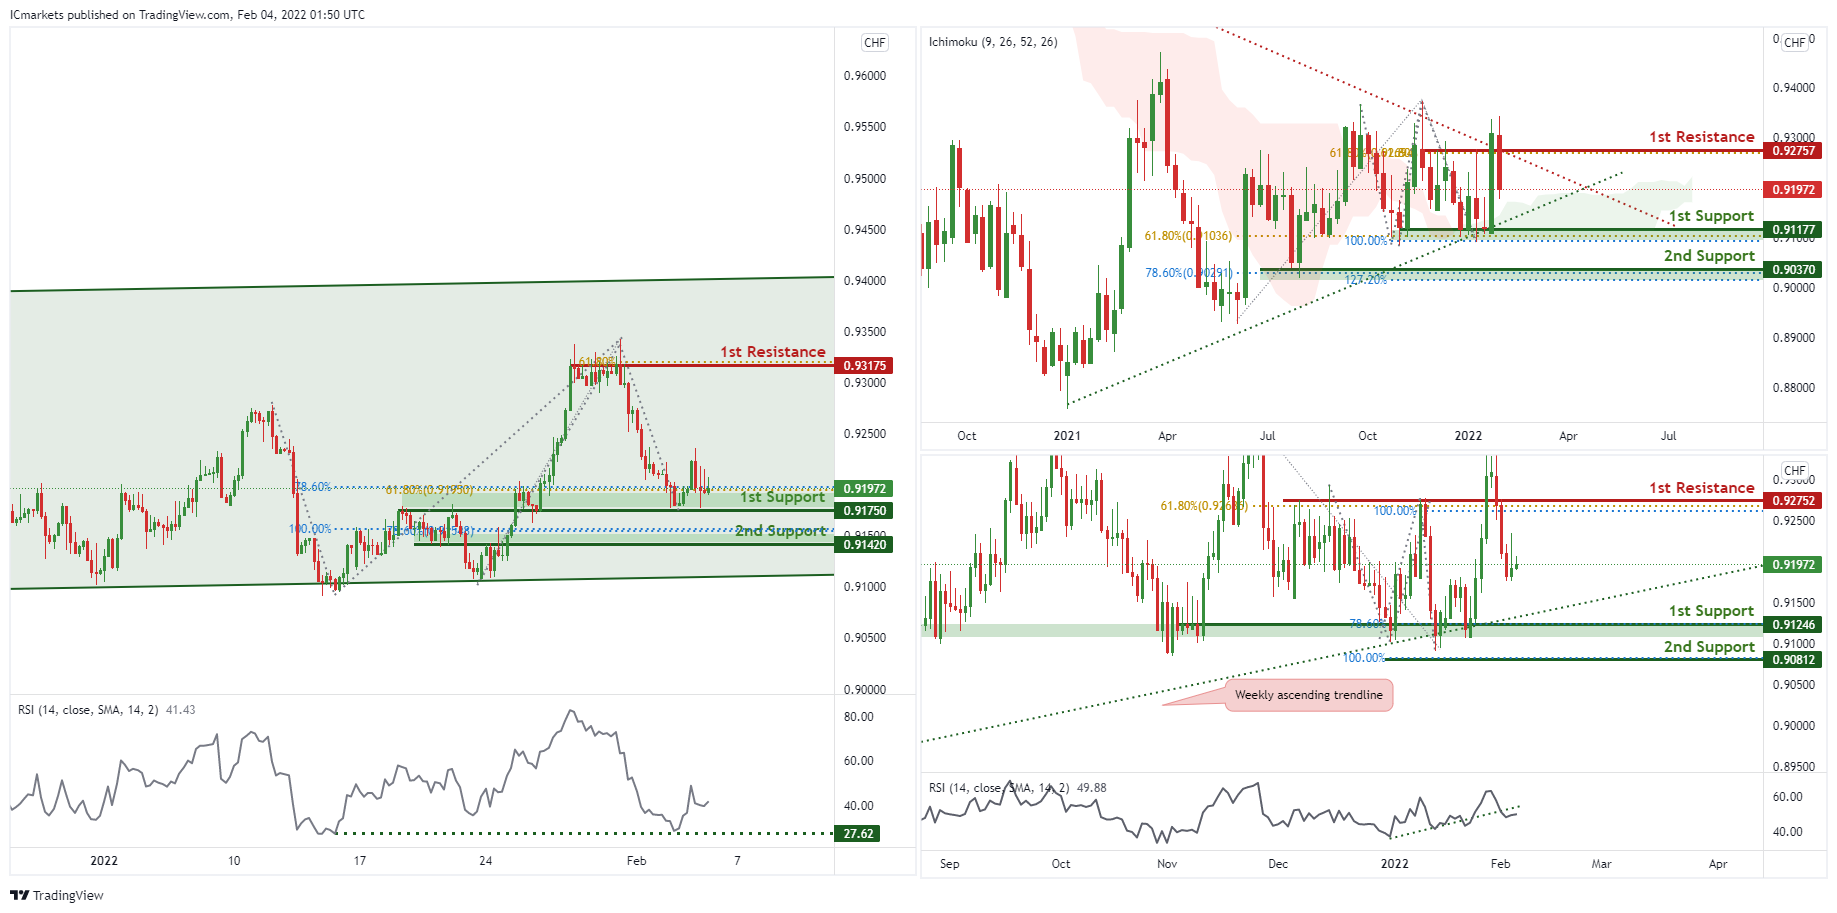
On the weekly, prices are on bearish momentum and abiding to our descending trendline. We see the potential for a dip from our 1st resistance at 0.93206 in line with 78.6% Fibonacci extension towards our 1st support at 0.91845 in line with 61.8% Fibonacci retracement. RSI is showing bearish momentum. On the daily chart, prices are hovering in between 2 levels. We see the potential for a dip if prices approach our 1st resistance at 0.93720 in line with 100% Fibonacci extension towards our 1st support at 0.92713 which is a graphical overlap. RSI are at levels where dips previously occurred. Traders should wait for prices to swing higher or lower before entering.
On the H4 timeframe,price is abiding to the daily ascending channel signifying an overall bullish momentum. We can expect the price to bounce from 1st Support in line with 78.6% Fibonacci projection and 61.8% fibonacci retracement towards 1st Resistance in line with 61.8% Fibonacci projection and previous swing high. Our bullish bias is further supported by the RSI indicator where it is at the support level.
Areas of consideration:
- Watch 1st Support at 0.91750
- Watch 1st Resistance at 0.93175
EUR/USD :
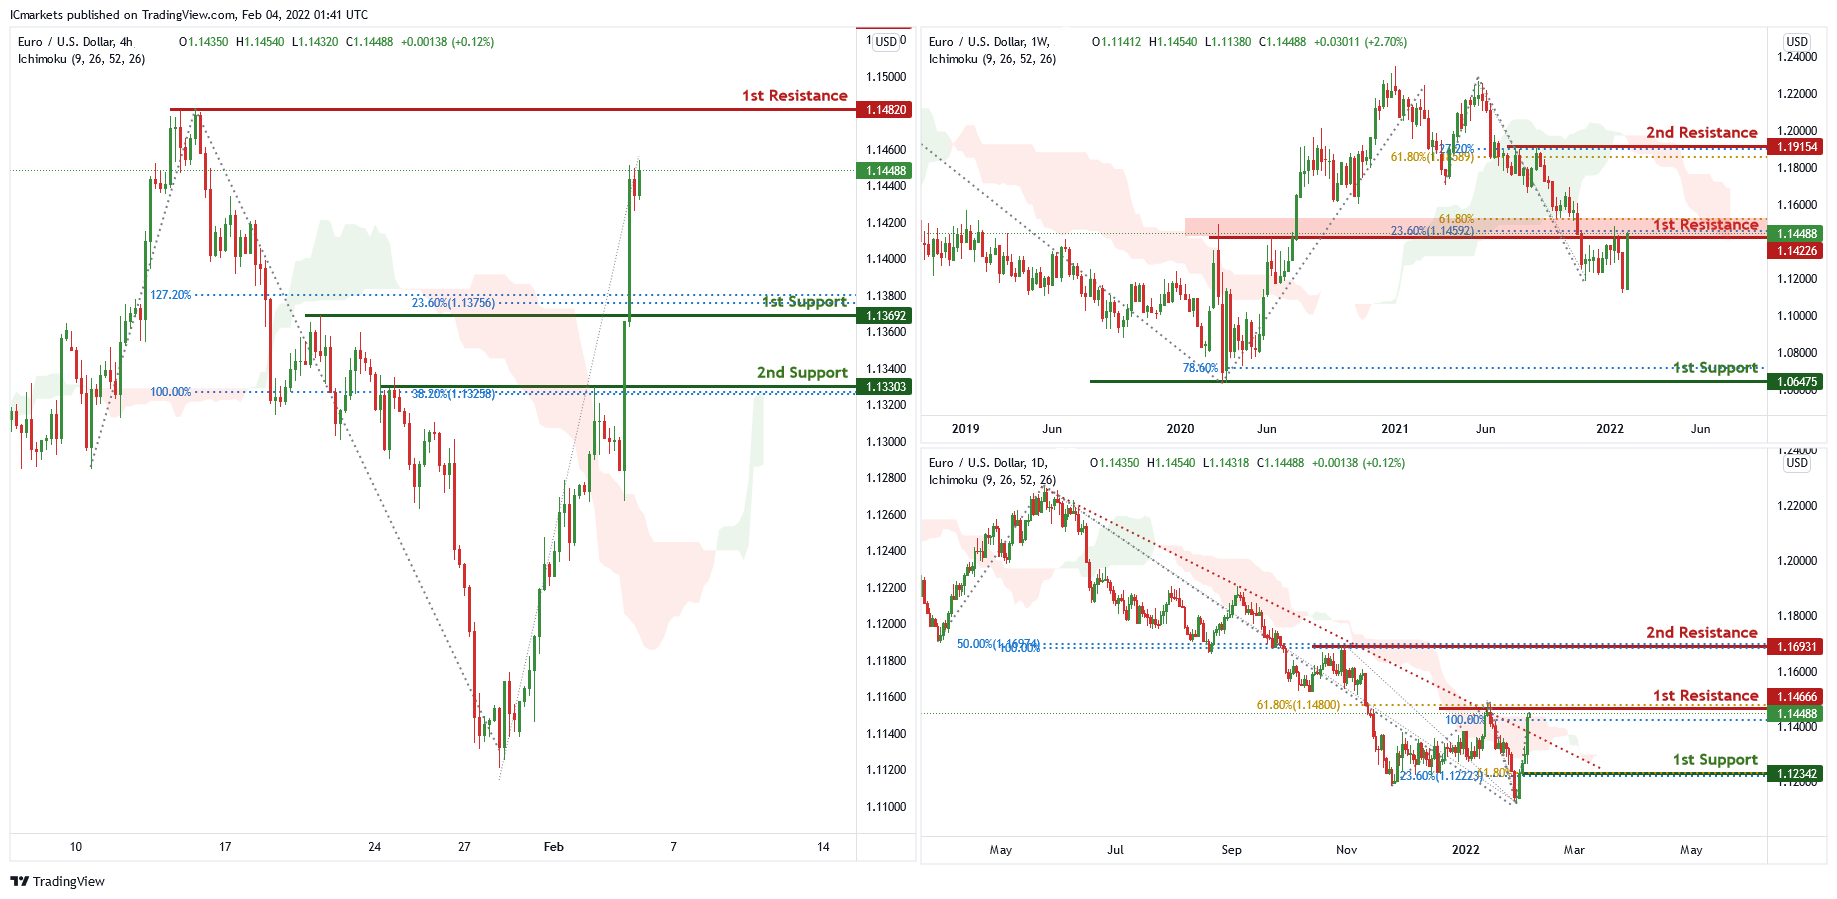
On the weekly chart, price is near 1st resistance level of 1.14226 which is also 61.8% Fibonacci projection and 23.6% Fibonacci retracement. Price can potentially dip to the 1st support level of 1.06475 which is 78.6% Fibonacci projection. Our bearish bias is supported by the ichimoku cloud indicator as price is trading below it.
On the daily chart, price has broken out of the descending trendline and is near 1st resistance level of 1.14666 which is also 100% Fibonacci projection and 61.8% Fibonacci retracement. Price can potentially go to the 2nd resistance level of 1.16931 which is 50% retracement and 100% projection. Our bullish bias is supported by the ichimoku cloud indicator as price is trading above the cloud.
On the H4 chart , price is near the 1st resistance level of 1.14820 which is the graphical swing high. Price can potentially dip to the 1st support level of 1.13692 which is also 23.6% Fibonacci retracement and 127.2% Fibonacci projection. Our bearish bias is supported by the stochastic indicator as it is near resistance level,
Areas of consideration
- H4 1st support at 1.13692
- H4 1st resistance at 1.14820
USD/JPY
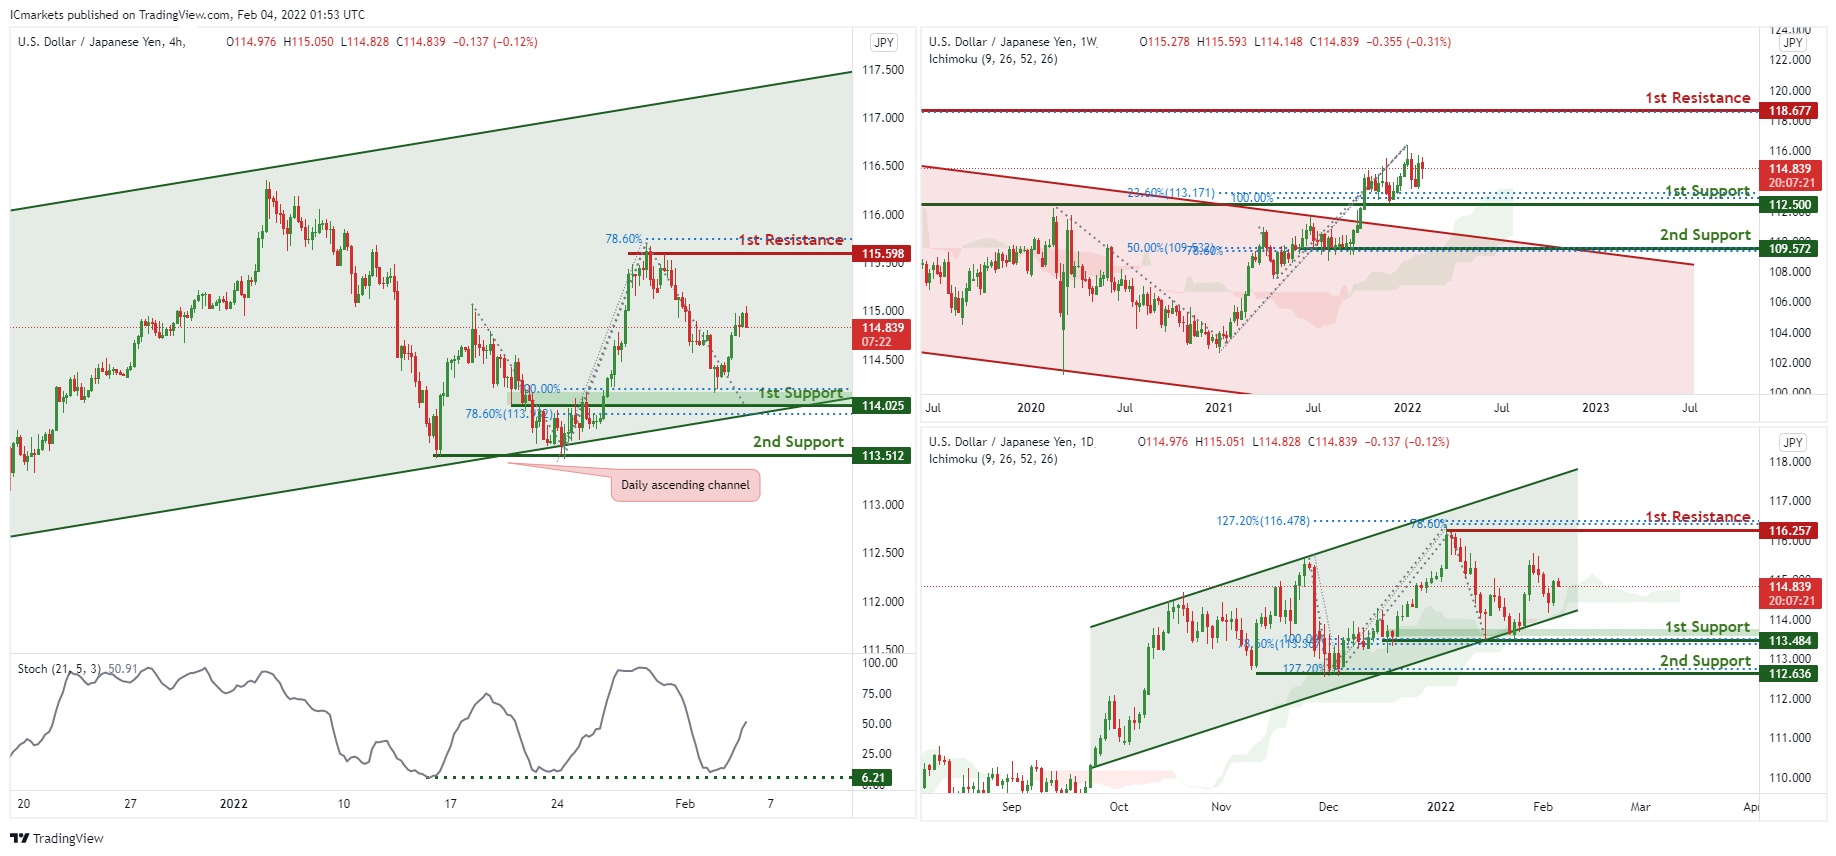
On the weekly chart, price has broken out of the descending channel and near support level of 112.500 which is also 23.6% Fibonacci retracement and 100% Fibonacci projection. Price can potentially go to the 1st resistance level of 118.677 which is also 78.6% Fibonacci retracement. Our bullish bias is supported by the ichimoku cloud indicator as price is trading above it.
On the daily chart price is trading in an ascending channel and is between 1st resistance of 116.257 which is also 127.2% Fibonacci retracement , 78.6% Fibonacci projection and 1st support of 113.484 which is also 100% Fibonacci projection and 78.6% Fibonacci retracement. Our bullish bias is supported by the ichimoku cloud indicator as price is trading above it.
On the H4 chart,in reference to yesterday’s analysis, price indeed bounced at 1st Support. Price is trading in an ascending channel signifying an overall bullish momentumWe can expect price to bounce from 1st Support in line with 78.6% Fibonacci retracement and 100% Fibonacci projection towards 1st Resistance in line with 78.6% FIbonacci projection and previous swing high. Our bullish bias is further supported by the stochastic indicator where the %K line is at the support level. Traders should wait for price to swing higher or lower before entering.
Areas of consideration:
- H4 1st support at 114.025
- H4 1st resistance at 115.598
AUD/USD:
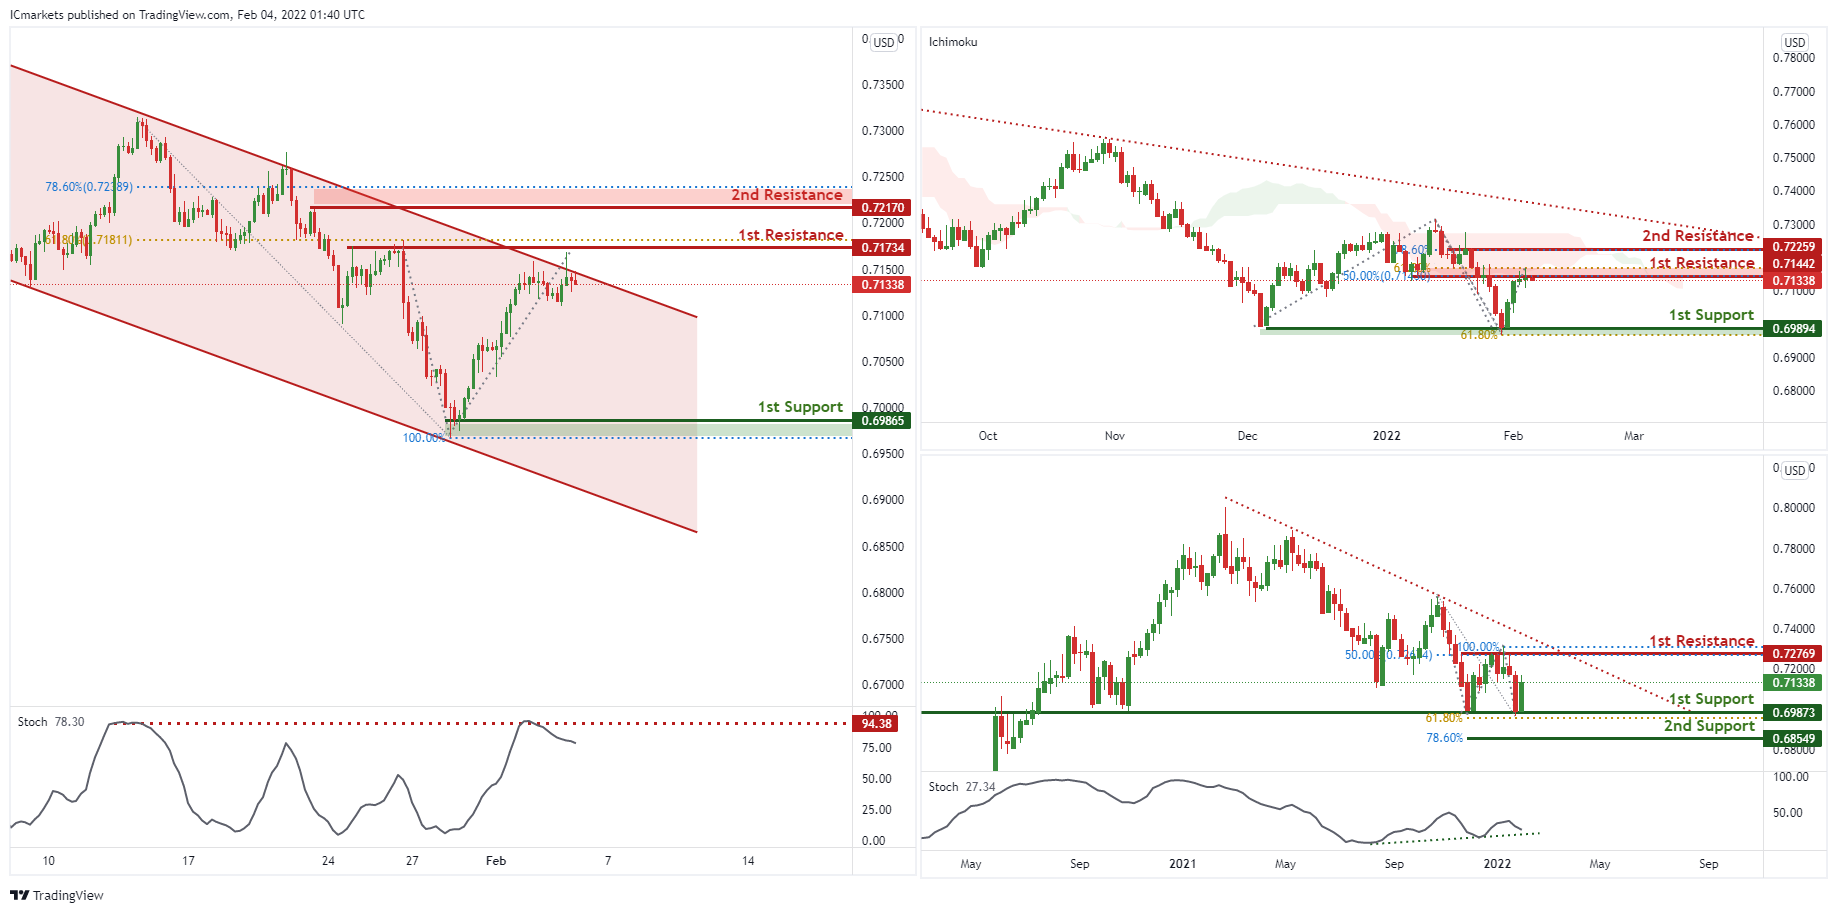
On the weekly, price is abiding to the descending trendline resistance , signifying an overall bearish momentum. However, the price bounced up at the horizontal support. We can expect price to reach 1st Resistance in line with 50% Fibonacci retracement and 100% Fibonacci projection. Traders can wait for price to swing higher or lower before entering.
On the Daily timeframe, price is abiding to the descending trendline , signifying an overall bearish momentum. We can expect the price to drop from 1st Resistance in line with 50% Fibonacci retracement and 61.8% Fibonacci projection towards 1st Support in line with horizontal support and 61.8% Fibonacci projection.
On the H4 timeframe, price is abiding to the descending channel, signifying an overall bearish momentum. We can expect price to drop from 1st Resistance in line with 50% Fibonacci retracement towards 1st Support in line with previous swing low and 78.6% Fibonacci projection. Our bearish bias is further supported by the stochastic indicator where the %K line is at the resistance level.
Areas of consideration:
- H4 1st Support level 0.69865
- H4 1st resistance level 0.71734
NZD/USD:
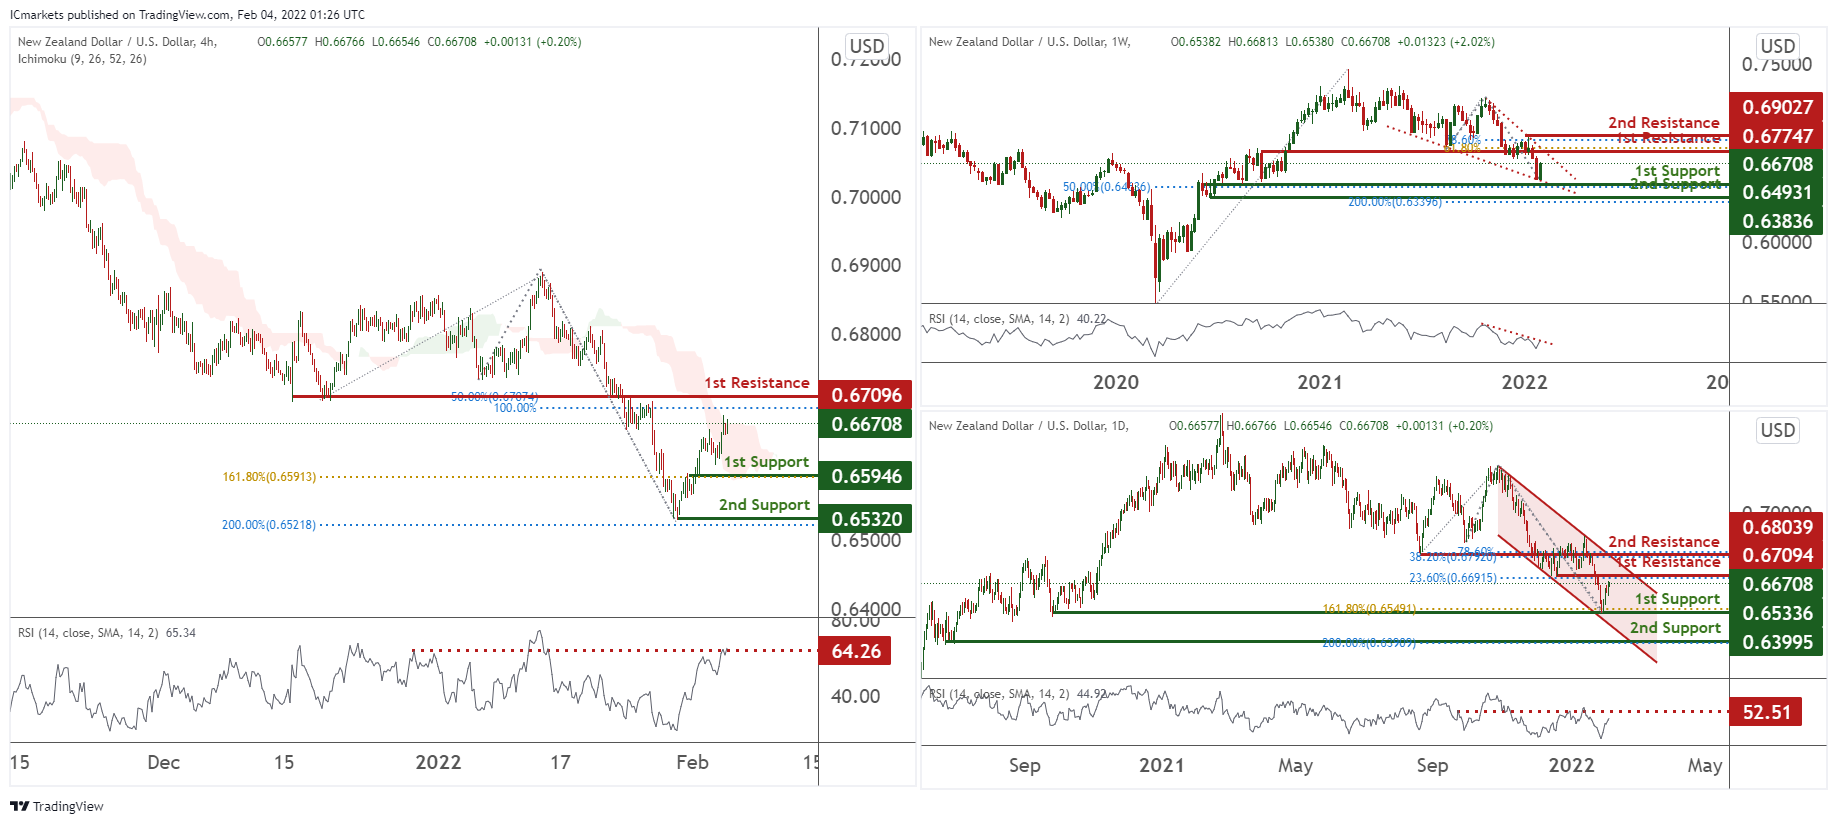
On the weekly, prices are on bearish momentum and abiding to a bearish triangle. We see potential for a dip from 1st resistance at 0.67747 in line with 61.8% Fibonacci retracement towards 1st support at 50% Fibonacci retracement. RSI is on bearish momentum.
On the daily, prices are on bearish momentum and consolidating in a bearish triangle. We see potential for prices to dip from our 1st resistance at 0.67094 in line with 23.6% Fibonacci retracement towards our 1st support at 0.65336 in line with 161.8% Fibonacci projection. RSI is at levels where dips previously occurred.
On the H4 timeframe, prices are approaching a Pivot and are on bearish momentum. We see potential for prices to dip from our 1st resistance at 0.67096 in line with 100% Fibonacci extension and 50% Fibonacci retracement towards our 1st support at 0.65946 in line with 161.8% Fibonacci Projection. Our bias is further supported by the Ichimoku Clouds forecasting bearish momentum and also RSI at a level where dips usually occur.
Areas of consideration:
- H4 time frame, 1st resistance at 0.67096
- H4 time frame, 1st support at 0.65946
USD/CAD:
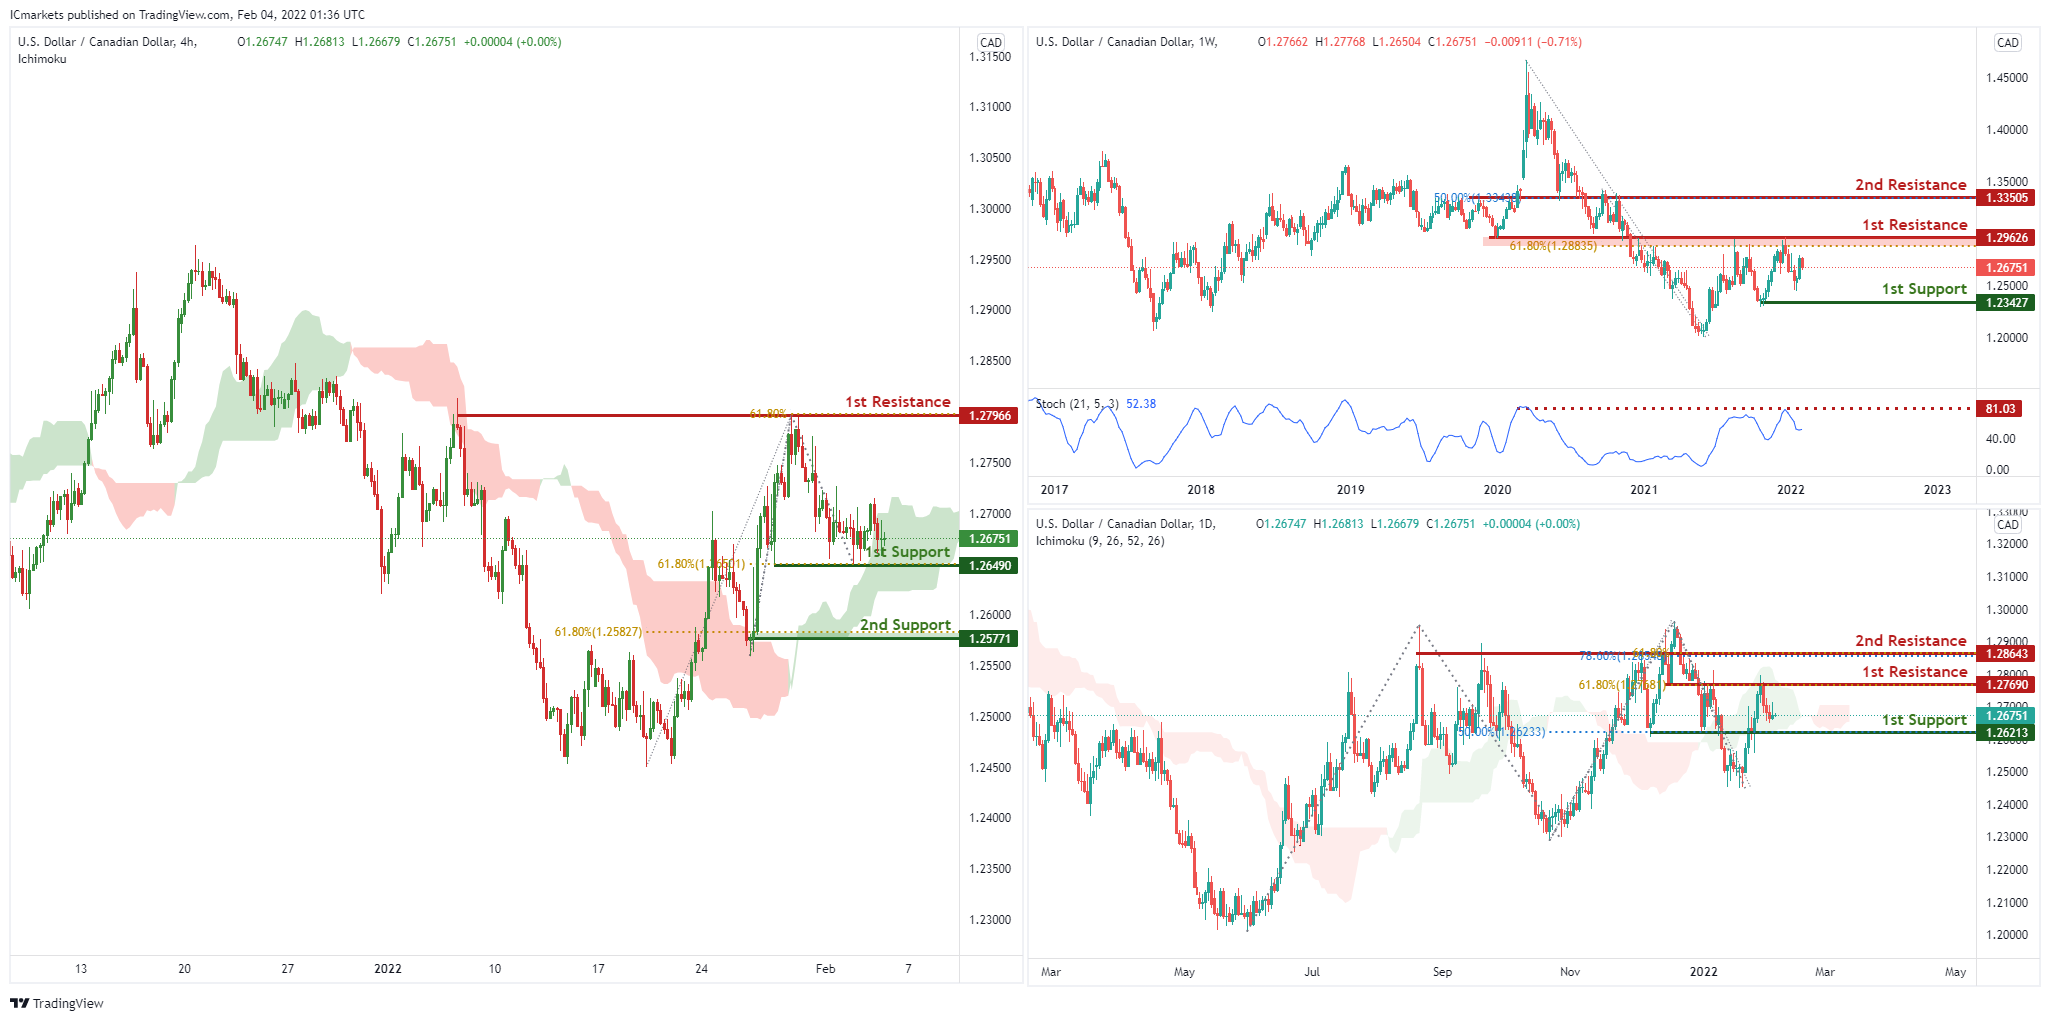
On the Weekly, with price expected to reverse off the stochastics indicator, signifying an overall bearish momentum. We can expect price to drop from our 1st resistance at 1.29626 in line horizontal graphical overlap and 61.8% Fibonacci retracement towards 1st support in line with horizontal swing low support at 1.23427. Alternatively, price may break 1st resistance structure and head for 2nd resistance, which coincides with the horizontal swing high resistance at 1.33505. Traders should wait for prices to swing higher or lower before entering.
On the Daily, with price expected to break the ichimoku cloud, signifying an overall bearish momentum. We can expect price to drop from our 1st resistance at 1.27690 in line horizontal graphical overlap and 61.8% Fibonacci retracement towards 1st support in line with horizontal overlap support ,50% Fibonacci retracement level at 1.26213. Alternatively, price may break 1st resistance structure and head for 2nd resistance, which coincides with the horizontal swing high resistance at 1.28643. Traders should wait for prices to swing higher or lower before entering.
On the H4, with prices moving above the ichimoku cloud, we see the potential for a bounce from our 1st support at 1.26490 in line with horizontal swing low support and 61.8% Fibonacci retracement towards our 1st resistance at 1.27966 in line with horizontal swing high resistance and 61.8% Fibonacci retracement. Alternatively, price may break 1st support structure and head for 2nd support at 1.25771, in line with 61.8% Fibonacci retracement and horizontal swing low support.
Areas of consideration:
- H4 time frame, 1st support at 1.26490
- H4 time frame, 1st resistance at 1.27966
OIL:
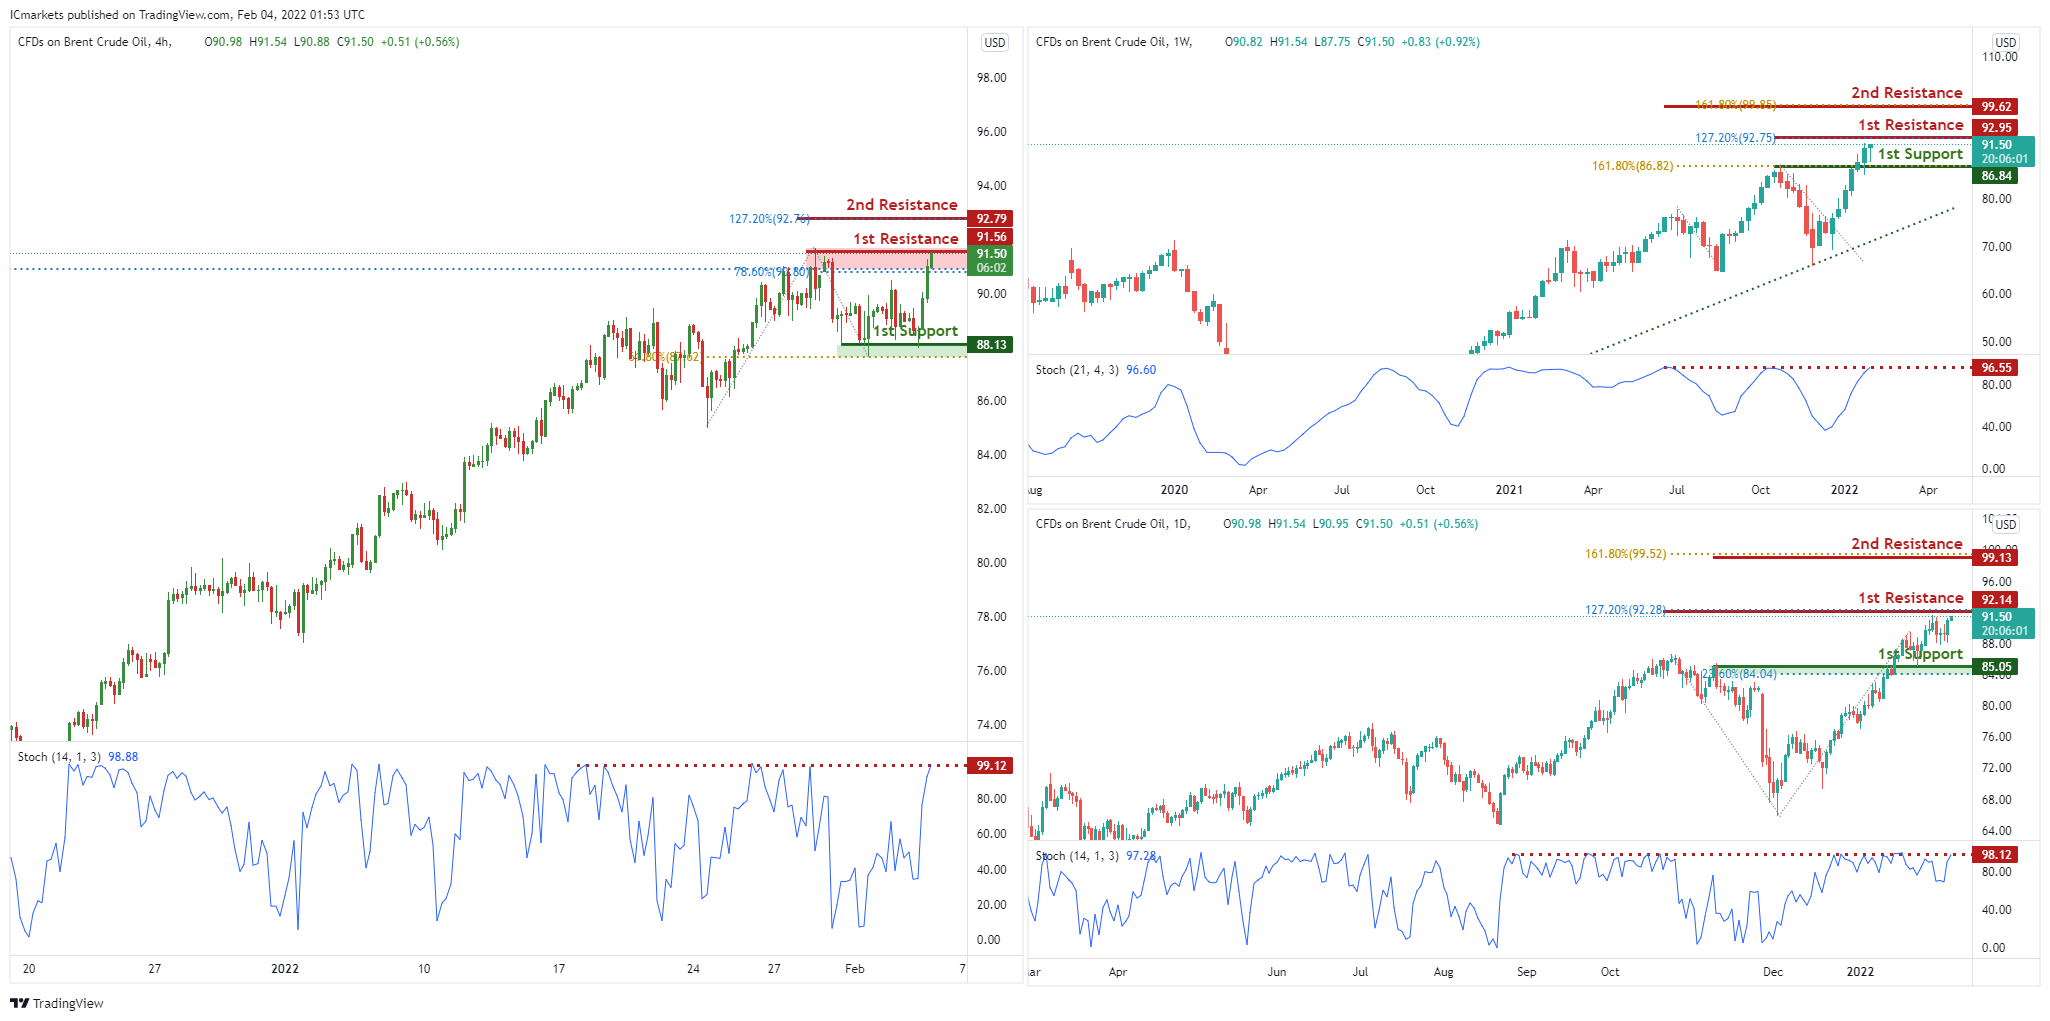
On the Weekly, with price expected to reverse off the stochastics indicator, signifying an overall bearish momentum. We can expect price to drop from our 1st resistance at 92.95 in line horizontal swing high overlap and 127.2% Fibonacci extension towards 1st support in line with horizontal overlap support ,161.8% Fibonacci extension level at 86.84. Alternatively, price may break 1st resistance structure and head for 2nd resistance, which coincides with the horizontal swing high resistance at 99.62. Traders should wait for prices to swing higher or lower before entering.
On the Daily, with price expected to reverse off the stochastics indicator, signifying an overall bearish momentum. We can expect price to drop from our 1st resistance at 92.14 in line horizontal swing high overlap and 127.2% Fibonacci extension towards 1st support in line with horizontal overlap support ,23.6% Fibonacci retracement level at 85.05. Alternatively, price may break 1st resistance structure and head for 2nd resistance, which coincides with the horizontal swing high resistance at 99.13. Traders should wait for prices to swing higher or lower before entering.
On the H4, with price expected to reverse off the stochastics indicator, signifying an overall bearish momentum. We can expect price to drop from our 1st resistance at 91.56 in line horizontal graphical overlap and 78.6% Fibonacci retracement towards 1st support in line with horizontal overlap support ,61.8% Fibonacci retracement level at 88.13. Alternatively, price may break 1st resistance structure and head for 2nd resistance, which coincides with the horizontal swing high resistance at 92.79. Traders should wait for prices to swing higher or lower before entering.
Areas of consideration:
- H4 time frame, 1st resistance of 91.56
- H4 time frame, 1st support of 88.13
Dow Jones Industrial Average:
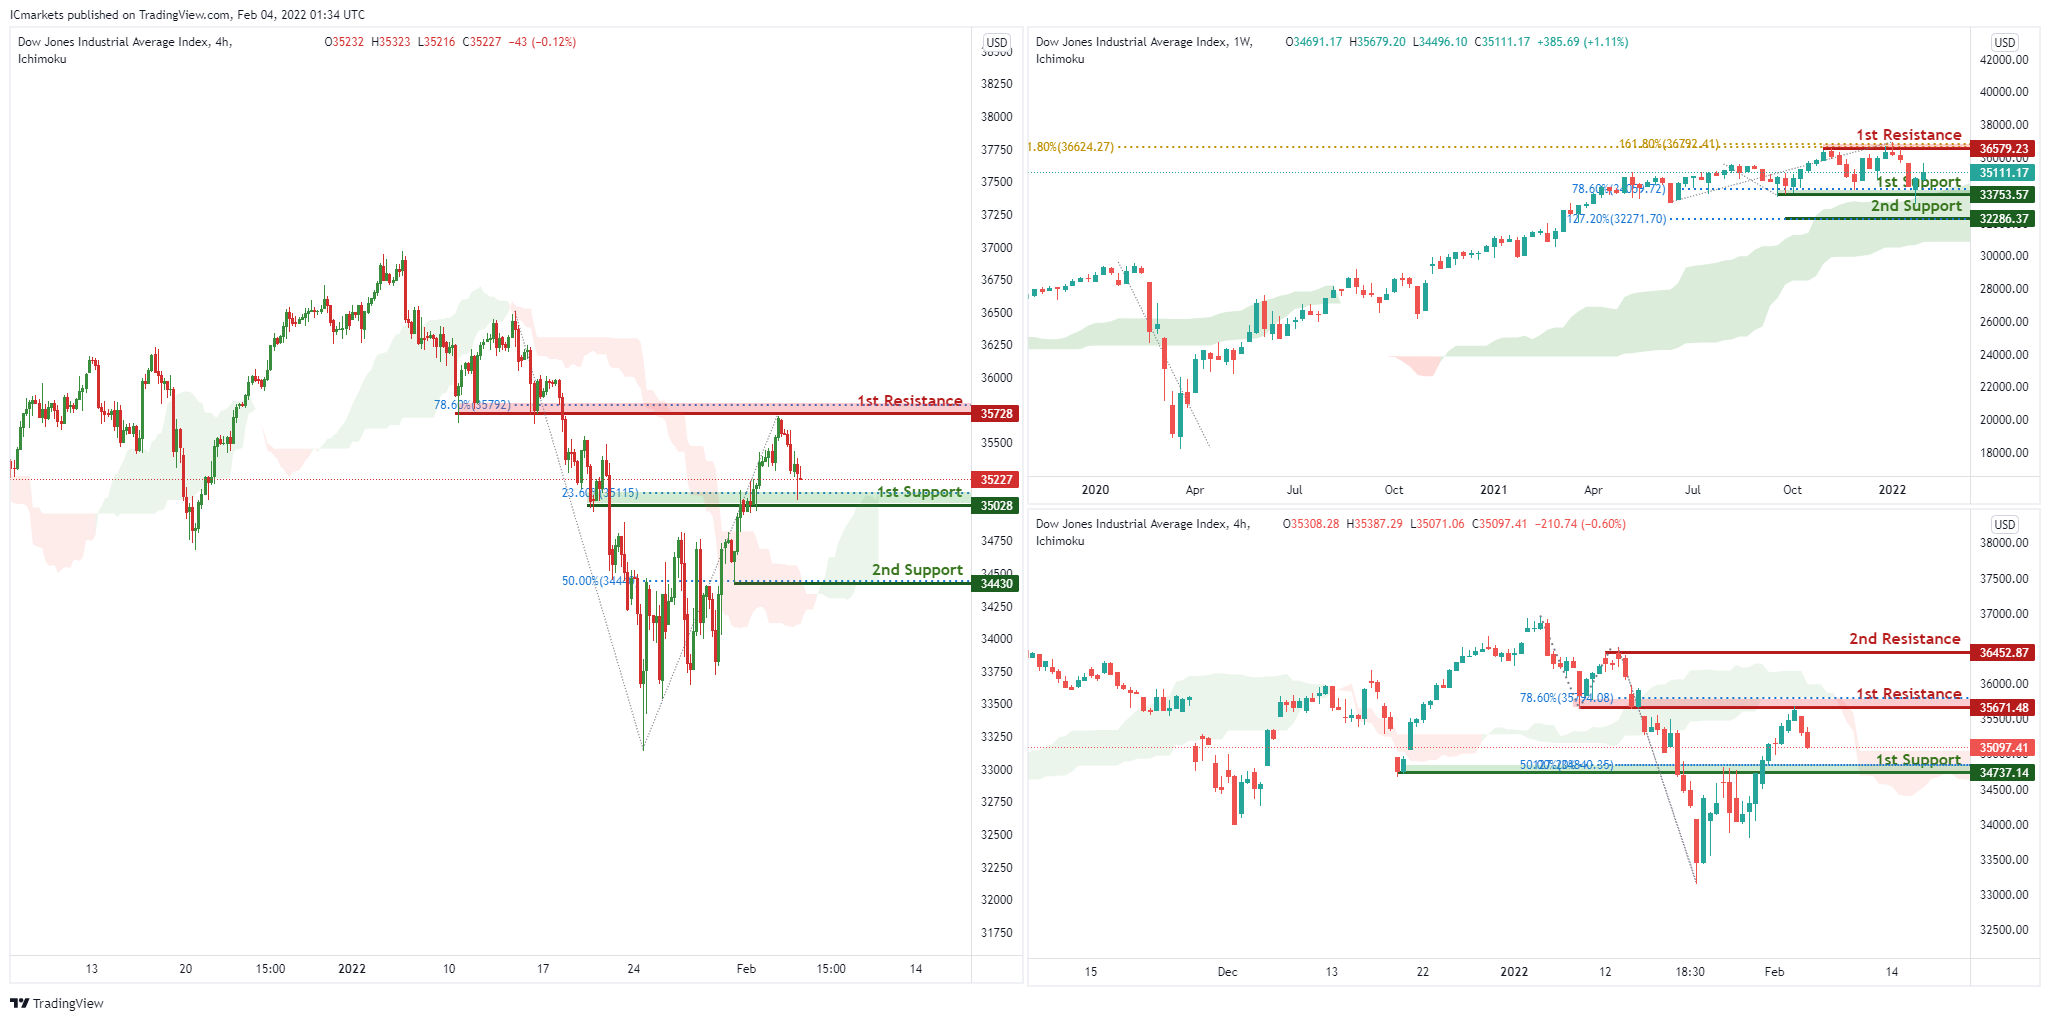
On the Weekly, with price moving above the ichimoku cloud, signifying an overall bullish momentum. We can expect price to rise to our 1st resistance at 36579 in line horizontal graphical swing high resistance and 161.8% Fibonacci extension from our 1st support in line with horizontal overlap support and 78.6% Fibonacci retracement level at 33753. Alternatively, price may break 1st support structure and head for 2nd support, which coincides with 127.2% Fibonacci extension level at 32286.
On the Daily, with price moving below the ichimoku cloud, signifying an overall bearish momentum. We can expect price to drop from our 1st resistance at 36452 in line horizontal graphical swing high resistance and 78.6% Fibonacci retracement towards 1st support in line with horizontal overlap support ,50% Fibonacci retracement level at 34737. Alternatively, price may break 1st resistance structure and head for 2nd resistance, which coincides with the horizontal swing high resistance at 36452. Traders should wait for prices to swing higher or lower before entering.
On the H4, with price moving above the ichimoku cloud, signifying an overall bullish momentum. We can expect price to rise to our 1st resistance at 35728 in line horizontal graphical swing high resistance and 78.6% Fibonacci retracement from our 1st support in line with horizontal overlap support and 23.6% Fibonacci retracement level at 35028. Alternatively, price may break 1st support structure and head for 2nd support, which coincides with 50% Fibonacci retracement level at 34430.
Areas of consideration:
- H4 time frame, 1st resistance of 35728
- H4 time frame, 1st support of 35028
Dollar index shaky as NFP might disappoint
US non-farm payroll report is a major focus today. Markets are expecting 150k job growth in January. Unemployment rate is expected to stay unchanged at 3.90%. Average hourly earnings are expected to grow 0.50% mom.
Looking at related economic data, ADP private job was a big disappointment with -301k losses. ISM manufacturing employment ticked up from 53.9 to 54.5. ISM services employment dropped from 54.9 to 52.3. Four-week moving average of initial jobless claims rose from 205k to 255k. All in all, there are prospects of downside surprise in today's NFP readings, except wages growth.
Dollar index had a steep decline this week, thanks to the strong rebound in EUR/USD. The question now is on whether long term fibonacci level of 61.8% retracement of 102.99 to 89.20 at 97.72 is too much for DXY to overcome.
Sustained break of trend line support at around 95.00 will argue that a medium term top was formed at 97.44, on bearish divergence condition in daily MACD. In this case, DXY would likely drop through 94.62 towards 93.43 resistance turned support before finding a bottom. Reactions to today's NFP could guidance the direction for the rest of the quarter.
BoJ Kuroda: Hard to see inflation sustainably reach target without wages rise
BoJ Governor Haruhiko Kuroda told the parliament today that inflation remains subdued in Japan because of the delay in recovery from pandemic, the public's deflationary mindset and firms' assumption that prices won't rice much.
"In Japan, nominal wages haven't risen much. It's hard to see inflation sustainably reach our 2 per cent target unless wages rise in tandem with prices," he said.
"It's important to maintain powerful monetary easing to support the economy, and help generate steady wage and price growth."
Fed Barkin: Interest rates at pre-pandemic levels are place to reassess
Richmond Fed President Thomas Barkin in a Reuters interview, "it is a straightforward call to say we ought to get rates back into better position. It does not feel to me like there is enough information to say holy cow we have to restrain the economy right now."
Barkin added that the federal funds rate should be raised back to where it was just before the pandemic, that is, a range of 1.50-1.75%. "Pre-pandemic levels are the place to reassess. Where we were pre-pandemic was under every member of the (Federal Open Market Committee's) assessment of where neutral was," he said.
"Then we can look around and say do you want to then start to move into the range ... where we are starting to restrain?"