Sample Category Title
CAD Higher ahead of US Retail Sales
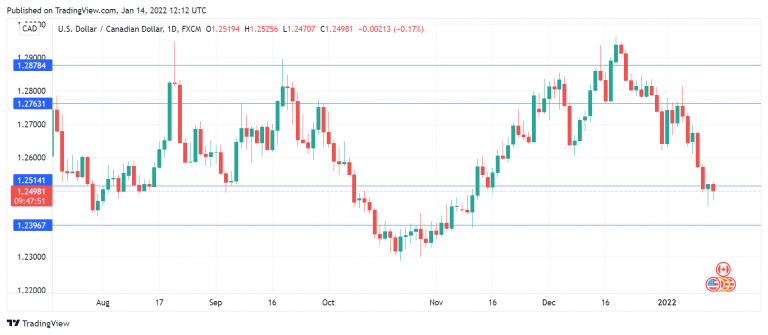
The Canadian dollar is in positive territory and continues to have an excellent week, with gains of 1.28%. The currency is back below 1.25 and is looking to close below this symbolic line for the first time since mid-November.
This week’s robust rally by the Canadian dollar is more a case of greenback weakness rather than loonie strength, as the US dollar has retreated broadly against the major currencies this week. Investors continue to be in a risk-on mode, shrugging off a soft nonfarm payrolls report and a sizzling CPI reading of 7.0% y/y. Fed Chair Jerome Powell managed to soothe concerns of runaway inflation earlier this week, saying that the Fed stood ready to raise rates to combat inflation but that he expected inflation to ease in later in the year. This has kept risk appetite high, but it’s questionable if investors will stay this optimistic if inflationary pressures remain at 40-year levels.
We continue to see a rotation out of US dollars this week, with the majors enjoying gains of around 1% against the retreating US dollar. The driver behind the US dollar’s weakness has been elevated risk appetite, which has not waned despite exploding Omicron cases, a soft nonfarm payrolls report and surging inflation in the US. Still, risk sentiment can change quickly, and I would not be surprised to see the US dollar recover in the near term if Omicron is more damaging than anticipated or if inflation heads even higher.
The week wraps up with US retail sales later today. The headline reading is expected to come in at -0.1%, and a decline could boost the Canadian dollar as it would put pressure on the Fed to hold back from normalizing policy. Investors will also be keeping an eye on UoM Consumer Sentiment, which is expected to drop from 70.6 to 70.0 points. A sharp drop in consumer confidence could raise expectations that the Fed will delay a rate hike, which would be bearish for the US dollar.
USD/CAD Technical
- USD/CAD is testing support at 1.2513. Below, there is support at 1.2396
- There is resistance at 1.2762 and 1.2879
GBPJPY Drifts Across 156 Mark as Bullish Rally Stalls
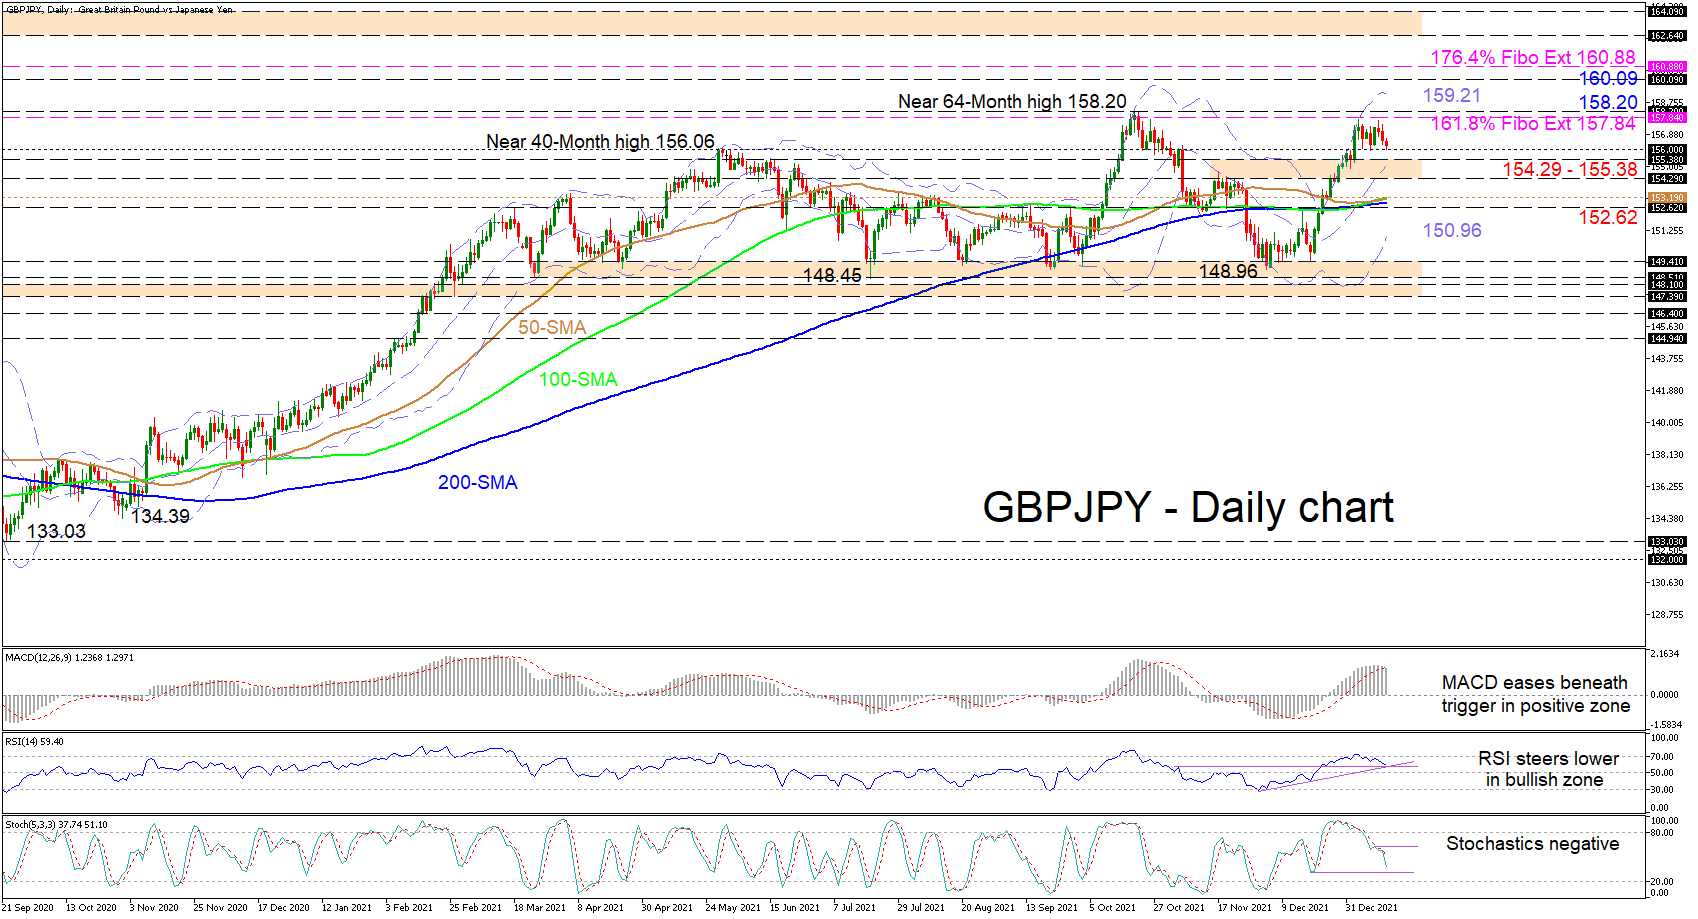
GBPJPY is consolidating between the 156.00 handle and the 157.84 level, which is the 161.8% Fibonacci extension of the down leg from 144.94 until 124.00. The simple moving averages (SMAs) are reflecting a fragile neutral-to-bullish trend in the pair.
That said, the short-term oscillators are indicating that bearish forces are growing. The MACD, deep in the positive region, has faded below its red trigger line, while the RSI is sliding in the bullish territory and is about to face a key support level. The negatively charged stochastic oscillator is promoting a bearish pullback in the pair. Currently, it appears that the 156.00 level may be acting as the immediate barrier, which could restart a price course either lower or higher.
If sellers maintain their slight advantage and dip the price beneath the 156.00 mark, prompt support could arise at the neighbouring 154.29-155.38 border. If this fortified boundary fails to provide footing for buyers, the price may then target a support area formed between the 50-day SMA at 153.19 and the inside swing high of 152.62. Should the SMAs struggle as well to dismiss the price from retracing further, the lower Bollinger band at 150.96 could come into play.
Otherwise, if positive traction develops off the 156.00 level, the 161.8% Fibo extension of 157.84 and the more than five-year high of 158.20 could contest a positive breakout of the sideways market that has gripped the pair for around three-months. If the one-month rally extends higher, the upper Bollinger band at 159.21 may be challenged before buyers tackle the critical 160.09 high from back in June 2016, where the price previously collapsed 16% in a day. Overshooting this, upside momentum could then be tested by the 176.4% Fibo extension of 160.88.
Summarizing, GBPJPY is exhibiting a neutral-to-bullish tone as it holds near the upper end of the three-month trading range. That said, a push below 156.00 or above 158.20 may restart price volatility in the pair.
Japanese Yen Extends Gains
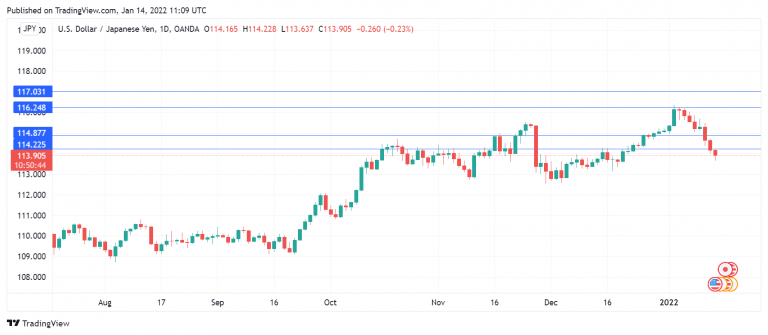
The Japanese yen continues to roll, with gains for a third successive day. USD/JPY has fallen below the 114 line and is now at its lowest level since December 21st. The yen has enjoyed an outstanding week, as USD/JPY is down 1.42%, its sharpest one-week decline since June 2020.
Only a week ago, the USD/JPY punched above the 1.16 line, as US Treasury yields were on a roll and climbed above 1.70%. The yield rally has run out of steam as yields have plateaued, allowing the yen to recover. The yen is very sensitive to the US/Japan rate differential, and if US yields resume their upswing, we can expect USD/JPY to rise as well. This week’s movement is more about the dollar’s broad weakness rather than yen strength, and I would not discount the possibility of a US rebound in the near term.
Japan’s wholesale prices climbed 8.5% in December y/y, after the record-breaking 9.2% gain in November. Wholesale prices have shown growth for 10 straight months, indicative of continuing inflationary pressures. Companies have been hit with a surge in oil and commodity prices, and the gradual passing on of these hikes to consumers is pushing CPI higher.
The Bank of Japan holds a policy meeting on Tuesday. The bank is expected to maintain its ultra-easy policy, but in an acknowledgment of higher inflation, the bank is expected to revise upwards its inflation view for the first time since 2014. Inflation is nowhere near the high levels we are seeing in the US (7%) and UK (5%), but the upswing in inflation is significant, given that Japan has grappled with deflation for years. According to a Reuters report the BoJ is considering eventually raising rates even if the bank’s inflation target of 2% is not reached.
USD/JPY Technical
USD/JPY faces resistance at 116.29. Above, there is resistance at 117.02, which has held since January 2017
There is support at 114.89 and 114.22
Gold and EUR/USD Trade Higher: Elliott Wave Analysis
The USD remains bearish after US CPI figures this week that came out around expectations, while PPI yesterday increased by 0.2%, less than expected. The dollar is down even after some weakness on stocks yesterday during the US session.
So EURUSD is higher, but one of the reasons can be remarks by ECB Vice President Luis de Guindos who said on Thursday that euro zone's inflation spike is not as transitory as earlier thought.
EUR/USD 1h Elliott Wave analysis
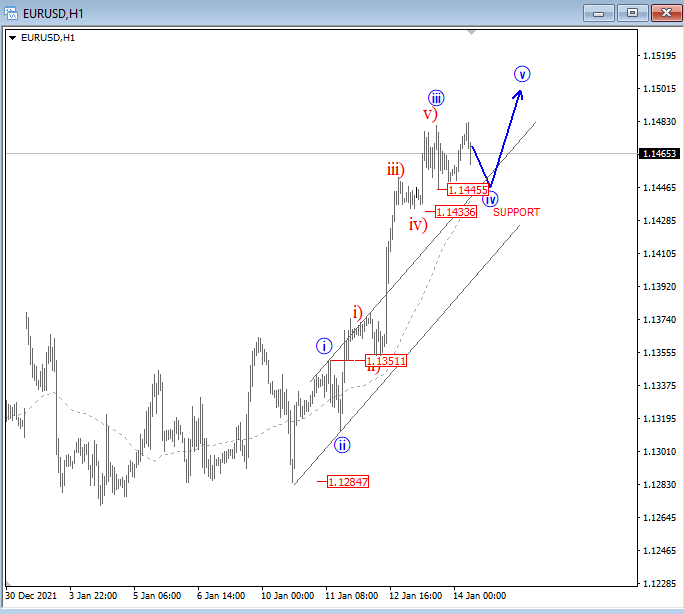
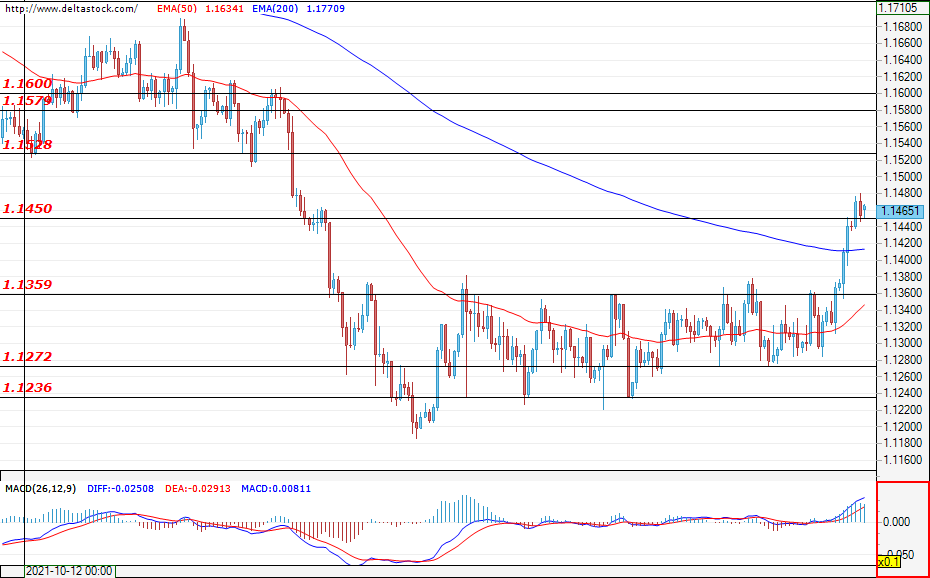
Technically speaking we see EURUSD in uptrend on intraday charts with room for further gains. Support is at 1.1430-1.1450.
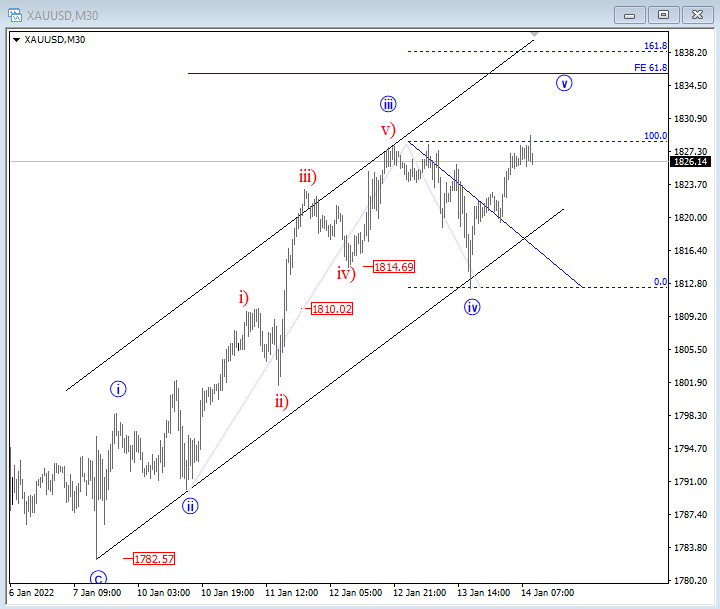
Gold remains in uptrend and is coming nicely higher, as expected away from the 1814 support. We see fifth wave now in progress with a projection up at around 1835/40 area where trend may once again start slowing down.
Gold 30 min Elliott Wave analysis
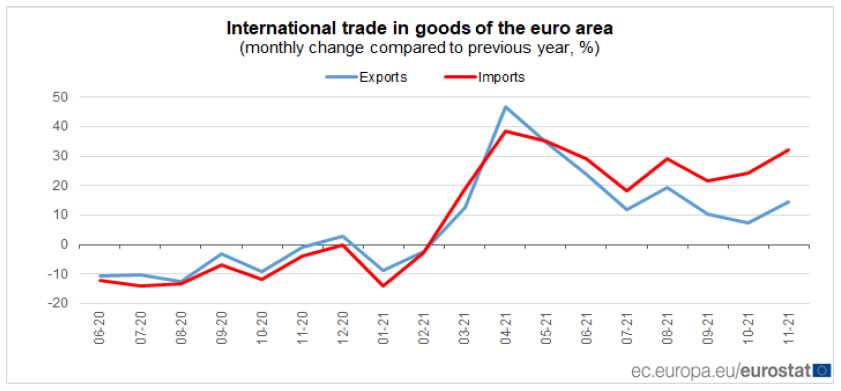
Eurozone exports rose 14.4% yoy in Nov, imports rose 32.0% yoy
Eurozone exports of goods rose 14.4% yoy, to EUR 225.1B in November. Imports rose 32.0% yoy to EUR 226.6B. Trade deficit came in at EUR -1.5B. Intra-Eurozone trade rose 22.1% yoy to EUR 204.3B.
On seasonally adjusted bases, extra-Eurozone exports rose 3.0% mom to EUR 213.2B. Imports rose 4.5% mom to EUR 214.5B. Trade balance turned into EUR -1.3B deficit. Intra-Eurozone trade rose from EUR 192.2B to EUR 193.9B.
EUR/USD Pair is Consolidating Gains above the 1.1450 Level
The Euro started a steady increase from the 1.1320 support zone against the US Dollar. The EUR/USD pair broke the 1.1380 resistance zone to move into a positive zone.
There was also a move above the 1.1400 level and the 50 hourly simple moving average. It is now consolidating gains above the 1.1450 level. An immediate resistance near the 1.1480 level.
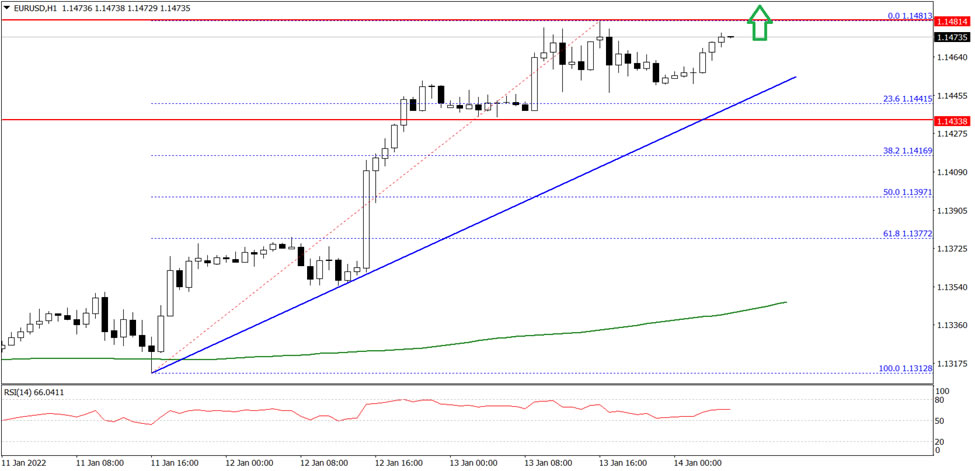
The next major resistance is near the 1.1500 level. A break above the 1.1480 and 1.1500 resistance levels could start a decent increase towards the 1.1550 level in the near term.
On the downside, an initial support is near the 1.1450 level. There is also a key bullish trend line with support near 1.1450 on the hourly chart, below which the pair could extend losses. The next key support is near 1.1420, below the pair could test 1.1400 on FXOpen.
USDCAD Stops Near 200-SMA: Temporary Pause or Bullish Setup?
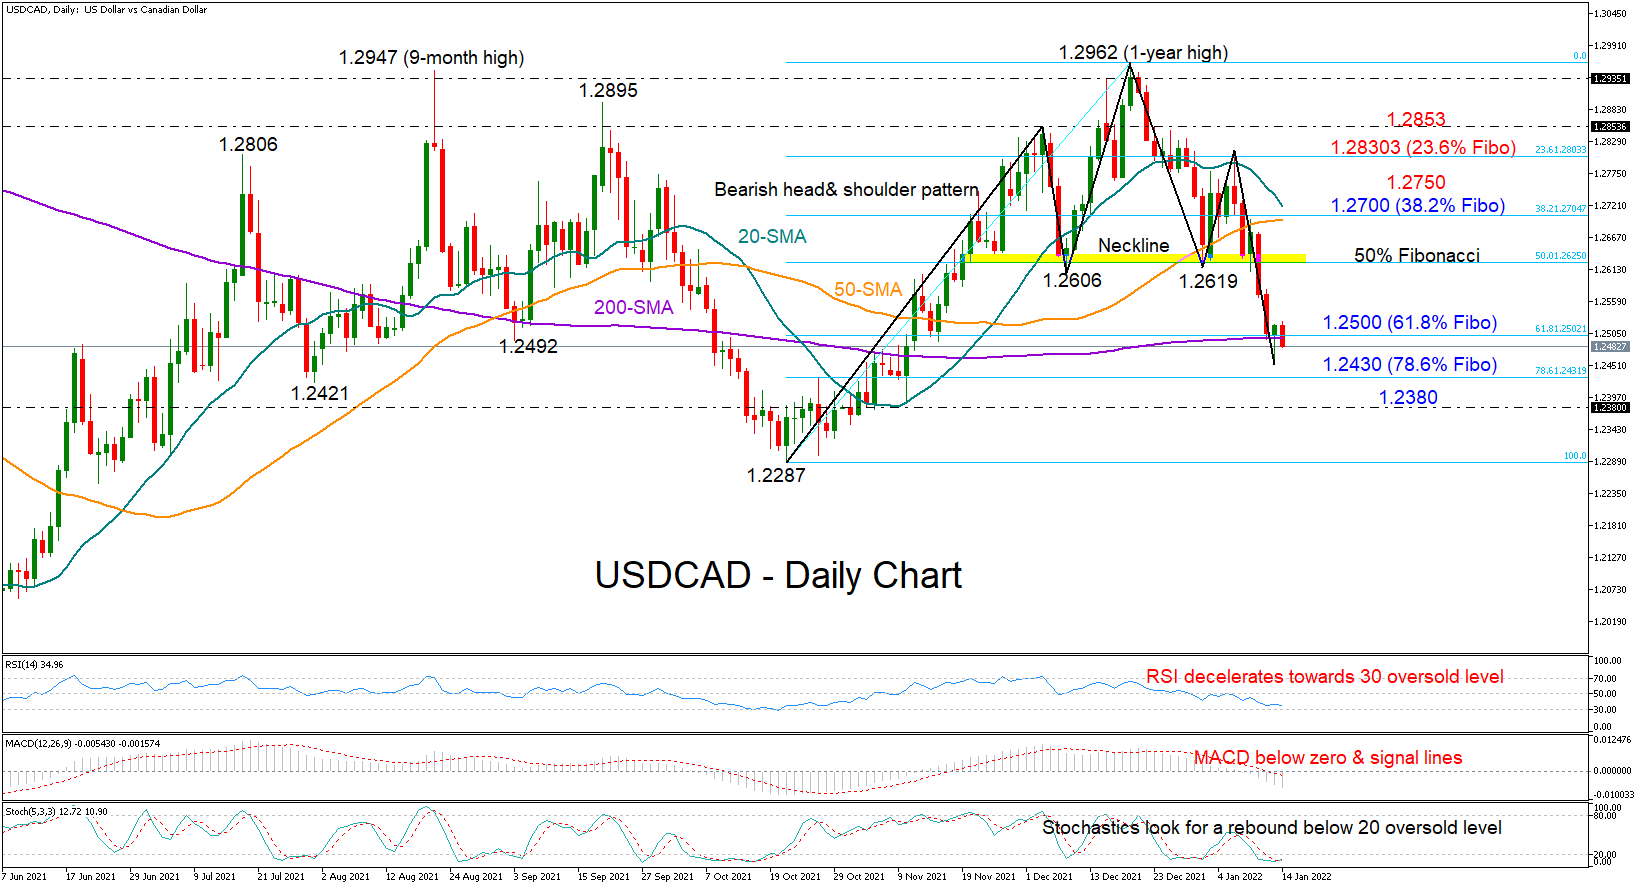
USDCAD slumped towards the 200-day simple moving average (SMA) at 1.2495 after its bullish efforts to cross above the 50-day SMA and enter the 1.2700 territory collapsed, with the pair set to close 1.40% lower this week.
Thursday’s session seems to have formed a bullish hammer candlestick in the chart, which foresees a reversal in price direction, though additional green candlesticks will be needed to confirm that. The Stochastics are also increasing the stakes for an upturn in the coming sessions as the indicator seems to have found a bottom below its 20 oversold level.
Yet, given the persisting negative momentum in the RSI and the MACD, and the fact that the pair has already breached the neckline of a bearish head and shoulder trend pattern, traders may cautiously monitor any upside corrections.
For now, the 61.8% Fibonacci retracement of the 1.2287 – 1.2962 up leg at 1.2500 is guarding the floor around the 200-day SMA, and should the bears violate that bar, selling forces could intensify, turning the spotlight straight to the 78.6% Fibonacci of 1.2430. Steeper declines could drive the price towards the 1.2287 low, unless the 1.2380 handle comes to the rescue.
Alternatively, an improvement in sentiment could lift the pair up to the 50% Fibonacci of 1.2625, but a break above the 1.2700 restrictive area, where the 20- and 50-day SMAs are currently converging, could be a bigger achievement. The 38.2% Fibonacci is also located in the same position. If the bulls knock down that wall, resistance could next emerge somewhere between the 23.6% Fibonacci of 1.2830 and the 1.2850 barrier.
Summarizing, although the latest downfall in USDCAD is showing some signs of exhaustion, the bulls will need to stage a clear bounce around the 1.2500 level to get the upper hand.
GBPUSD Climb Remains Intact Amid Lingering Bullish Forces
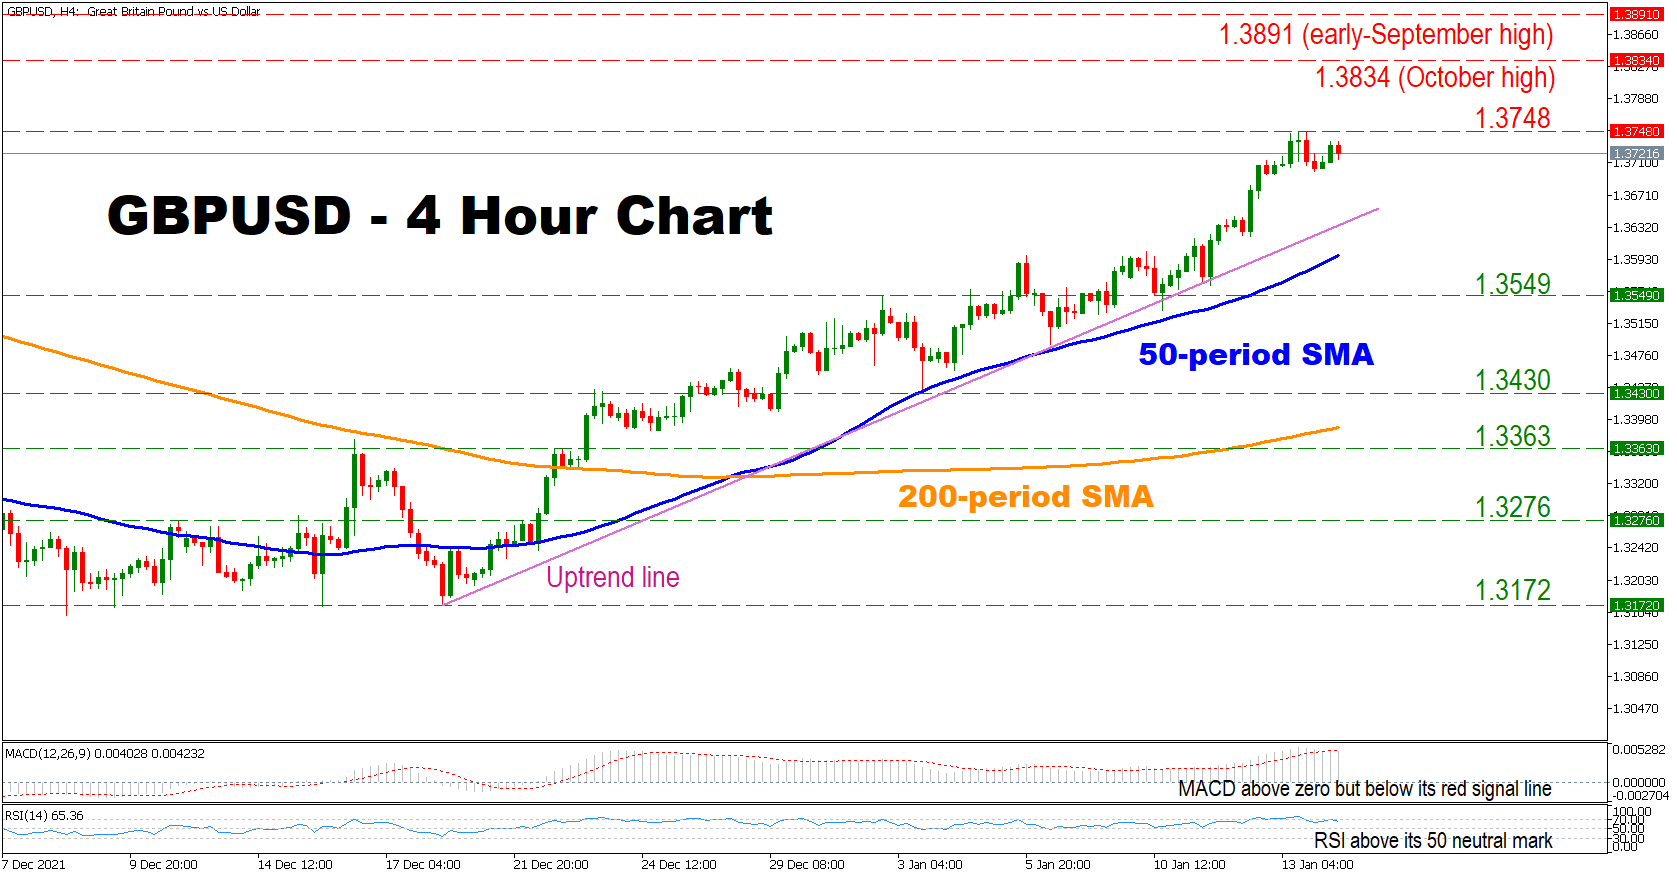
GBPUSD has staged a spectacular uptrend movement from late December amid strengthening positive momentum. Moreover, the pair’s successive higher highs together with the recent golden cross, where the 50-period simple moving average (SMA) has crossed above the 200-period SMA, reinforce the case for a sustained bullish outlook.
Short-term momentum indicators reflect a mixed picture as the RSI is found above its 50 neutral mark. However, despite being above zero, the MACD is located below its red signal line, indicating that the positive momentum might be fading.
Should the bears reassert control, initial resistance might be found at the 1.3748 level. Crossing above the latter could reinforce the pair's positive momentum, opening the door towards the October high at 1.3834, before buyers shift their attention towards the early-September high at 1.3891.
On the flip side, the first major support could be found at the late-December uptrend line before sellers eye the 50-period SMA currently at 1.3597. A break below that level could turn the fortunes around for the pair, pressuring its price towards the 1.3549 hurdle before moving towards the 1.3430 obstacle. Crossing below the latter could open the door towards the 200-period SMA currently at 1.3386.
In brief, the overall outlook for the pair is bullish amid successive higher lows and higher highs. For sentiment to change, sellers would need to drive the price below the 50-period SMA.
Pound Shrugs Off Sharp UK Data
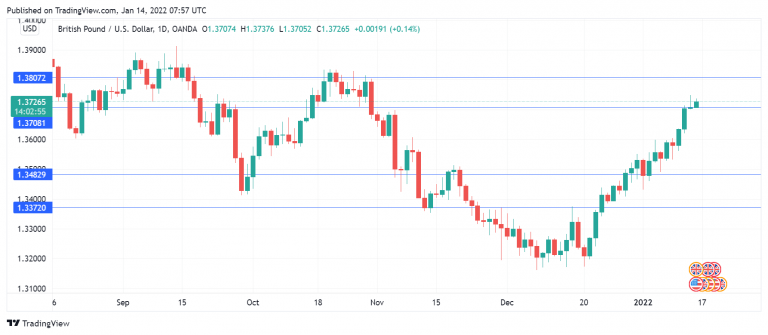
The British pound has posted very slight gains on Friday. In the European session, GBP/USD is trading at 1.3720, up 0.09% on the day.
The pound is yawning despite better than expected UK data today. GDP jumped 0.9% m/m in November, above the consensus of 0.4%, while Manufacturing Production rose 1.1% m/m, crushing the estimate of 0.2%. Both readings were above the October releases, indicating that the UK recovery continues. GDP for Q4 is expected to reach or surpass the pre-Covid level (Q4 2019), barring a disappointing December GDP report.
We continue to see a rotation out of US dollars this week, with the British pound and other majors racking up impressive gains of around 1 percent. The driver behind the US dollar’s weakness has been elevated risk appetite, which has not waned despite exploding Omicron cases, a soft nonfarm payrolls report and a hawkish Federal Reserve. The markets appear to have an answer for all of these developments. The Omicron wave has not wreaked havoc on the global economy, US wage growth is strong, and Fed Chair Jerome Powell is confident that red-hot inflation in the US will ease during the year. Still, risk sentiment can change quickly, and I would not be surprised to see a US dollar comeback in the near term if Omicron is more damaging than anticipated or if inflation heads even higher.
Johnson fighting for political life
Prime Minister Boris Johnson is under intense criticism after revelations that his staff held parties during the height of the Covid lockdowns. One party was apparently held the night before the funeral of Queen Elizabeth’s husband, and a poignant photo of the Queen sitting alone during the funeral has made Party-Gate look even worse. The latest political crisis has not made a dent in the pound’s upswing, perhaps because Johnson is no stranger to controversy or an indication that investors are more concerned about inflation and omicron rather than partying at 10 Downing Street.
GBP/USD Technical Analysis
- There are support lines at 1.3482 and 1.3372.
- GBP/USD continues to test resistance at 1.3708. This is followed by resistance at 1.3818
Daily Technical Analysis
EUR/USD
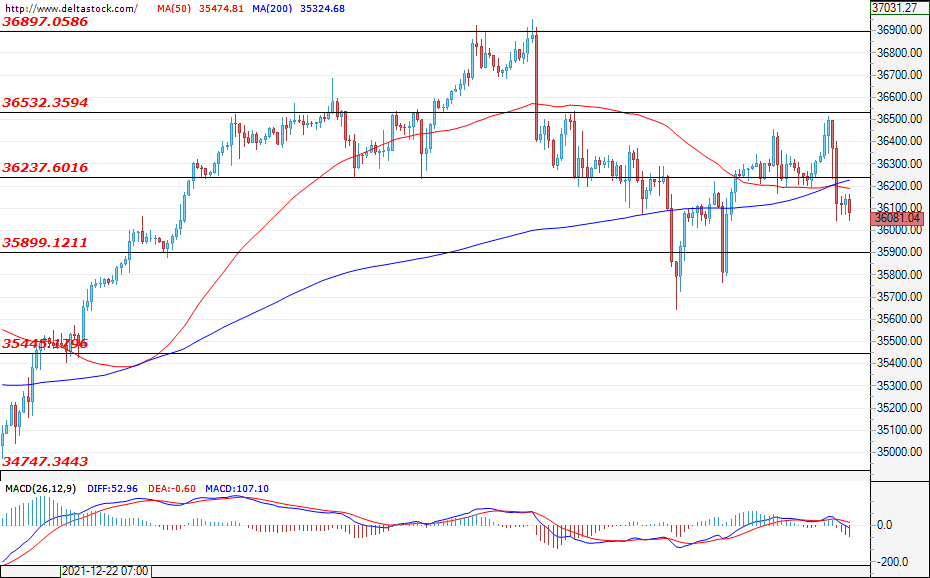
During yesterday's trading session, the U.S. blue-chip index breached the support level of 36237 and the forecast is for the index to test the important support at 35899. A possible breach of this level would deepen the correction, pushing the index towards a test of the support zone of 35445. In case the support at 35899 manages to withhold the bearish pressure, then we may witness a further move towards 36532. Today, increased activity can be expected around the release of the U.S. retail sales data (13:30 GMT).
USD/JPY
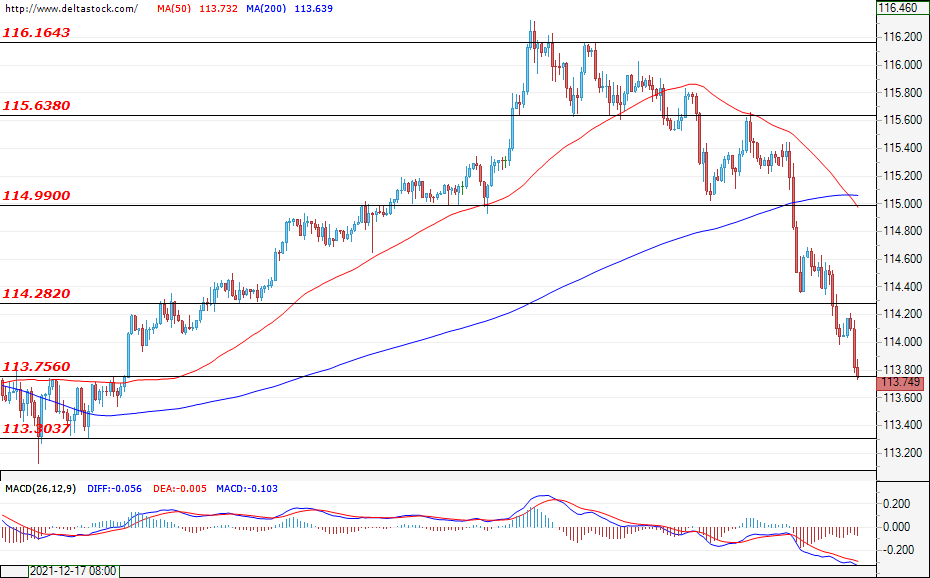
During yesterday's trading session the currency pair breached the support level of 114.28 and, at the time of writing, is headed towards a test at the next support at 113.75. A successful test at this level would deepen the decline, taking the pair towards the support zone at 113.30. In case the support level of 113.75 manages to withold the bearish pressure, then the most likely scenario would be for the pait to enter a consolidation phase in the range between 113.75 and 115.00.
GBP/USD
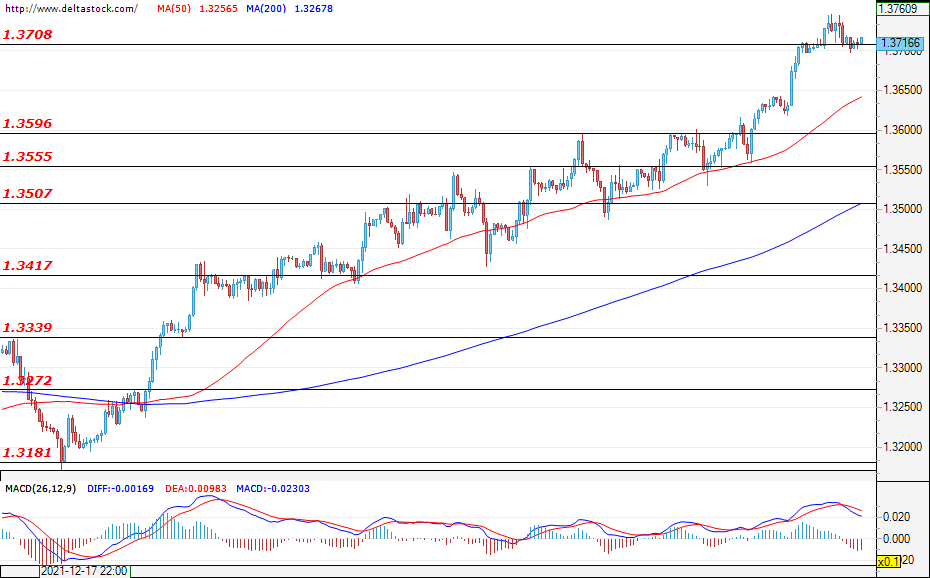
The uptrend of the sterling continues as the Cable breached the psychological level of 1.3700 and, at the time of writing, is consolidating just above this level. The forecast is for the pair to continue its uptrend towards the resistance level of 1.3760, once the consolidation phase is completed. In the negative direction, the first support lies at 1.3596.
EUGERMANY40
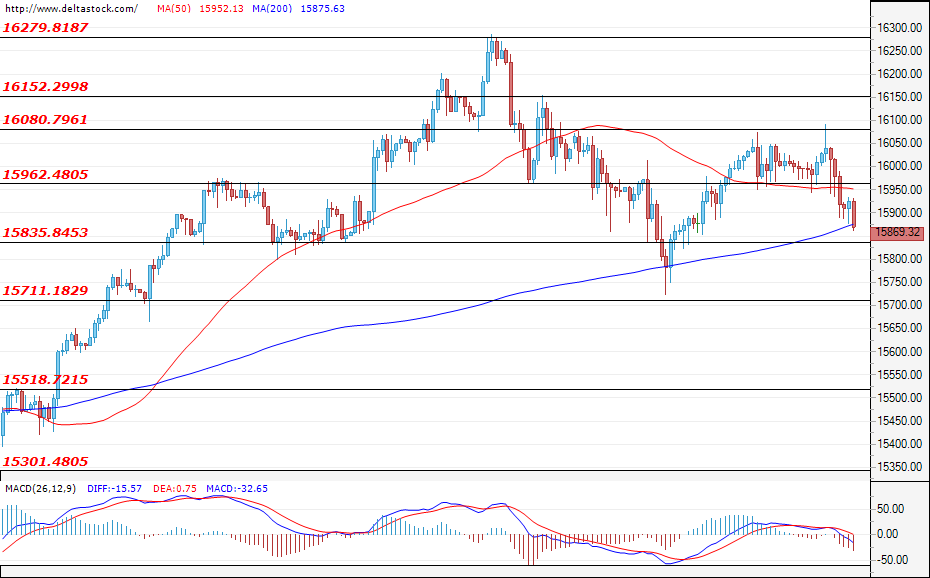
During yesterday's trading session, the German index breached the support level of 15962 and the forecast is for the index to test the important support at 15835. In case the correction ends and the bulls take over the market, then it is possible that we could witness a test of the resistance level of 16080. In case the support at 15835 is violated and the sell-off deepens, then the next targets for the bears would be sitting at 15711 and at 15520, respectively.
US30
During yesterday's trading session, the U.S. blue-chip index breached the support level of 36237 and the forecast is for the index to test the important support at 35899. A possible breach of this level would deepen the correction, pushing the index towards a test of the support zone of 35445. In case the support at 35899 manages to withhold the bearish pressure, then we may witness a further move towards 36532. Today, increased activity can be expected around the release of the U.S. retail sales data (13:30 GMT).