Sample Category Title
EUR/GBP Daily Outlook
Daily Pivots: (S1) 0.8342; (P) 0.8351; (R1) 0.8365; More...
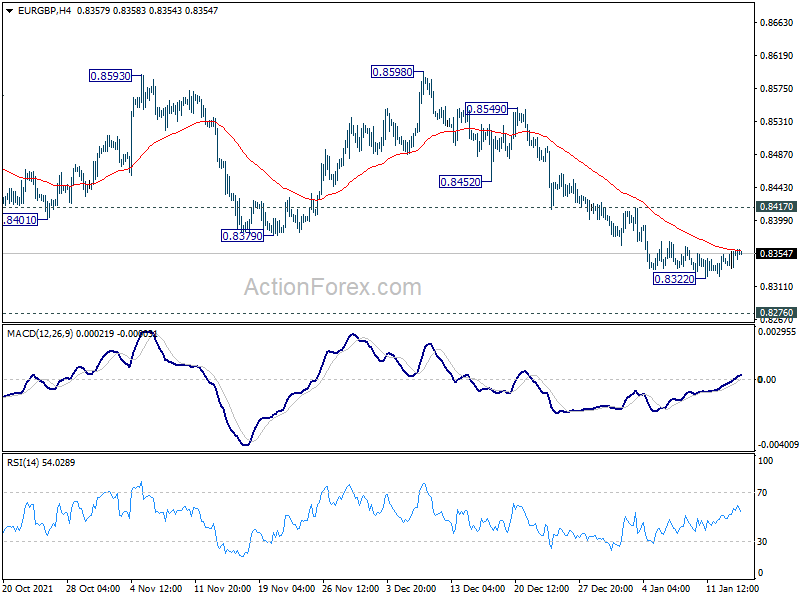
Intraday bias in EUR/GBP stays neutral for consolidation above 0.8322 temporary low. In any case, outlook will stay bearish as long as 0.8417 resistance holds. Below 0.8322 will resume recent down trend to 0.8276 key long term support. On the upside, above 0.8417 will turn bias back to the upside for stronger rebound.
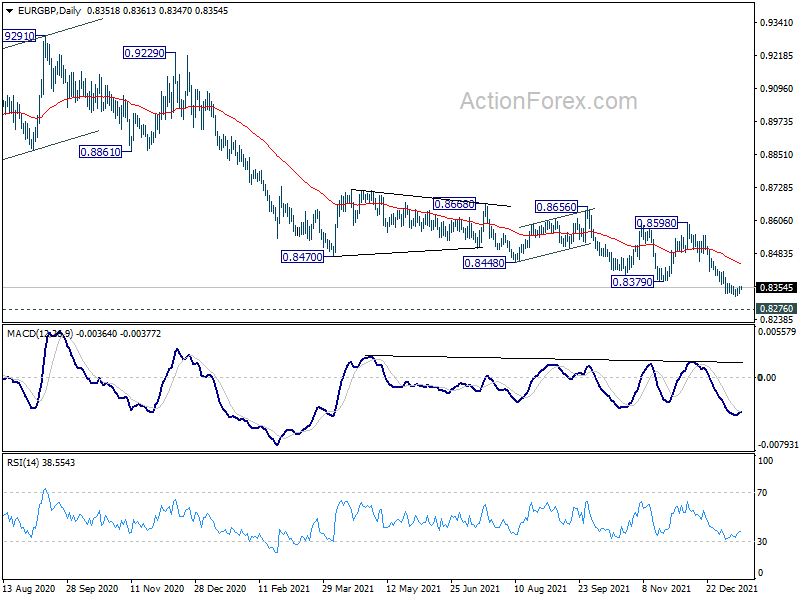
In the bigger picture, price actions from 0.9499 (2020 high) are still seen as developing into a corrective pattern. Deeper fall could be seen as long as 0.8598 resistance holds, towards long term support at 0.8276. We'd look for bottoming signal around there to bring reversal. Meanwhile, firm break of 0.8598 will now be an early sign of medium term bottoming and bring stronger rebound. However, sustained break of 0.8276 will argue that the long term trend has reversed.
EUR/AUD Daily Outlook
Daily Pivots: (S1) 1.5697; (P) 1.5720; (R1) 1.5758; More...
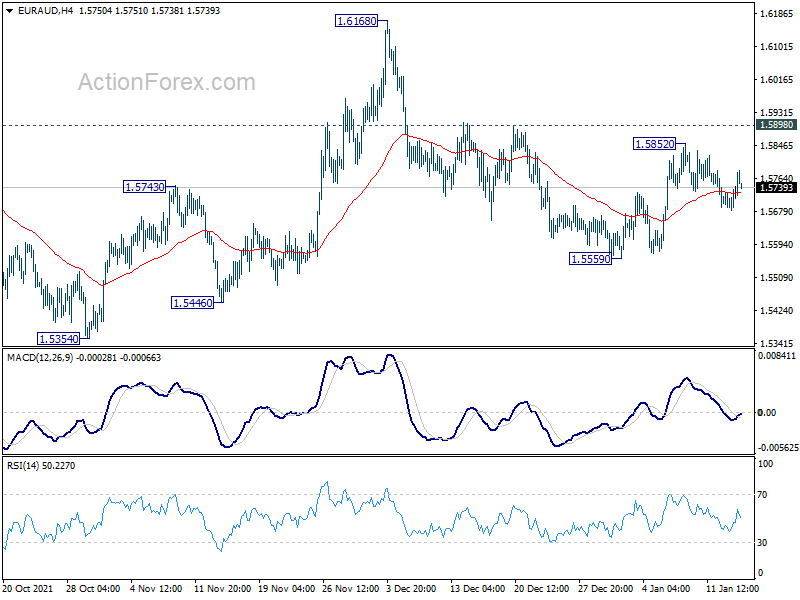
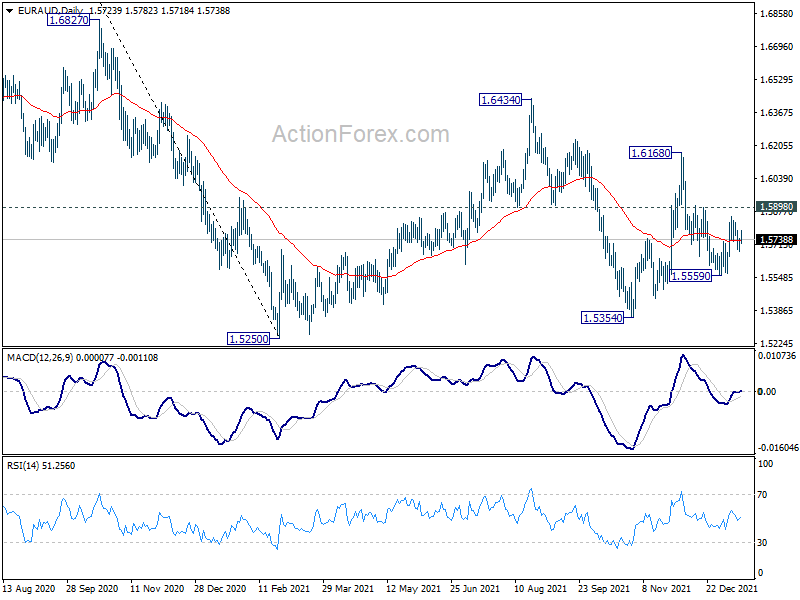
Intraday bias in EUR/AUD remains neutral as range trading continues. On the downside, break of 1.5559 will resume the fall from 1.6168 to retest 1.5250/5354 support zone. On the upside, however, break of 1.5898 will argue that pull back form 1.6168 has completed. Intraday bias will be back to the upside for 1.6168 resistance.
In the bigger picture, rise from 1.5354 is seen as the third leg of the corrective pattern from 1.5250 low. Further rise cannot be ruled out, but even in that case, strong resistance should be seen at 38.2% retracement of 1.9799 to 1.5250 at 1.6988. Larger down trend from 1.9799 is in favor to extend through 1.5250 at a later stage.
EUR/CHF Daily Outlook
Daily Pivots: (S1) 1.0414; (P) 1.0451; (R1) 1.0476; More....
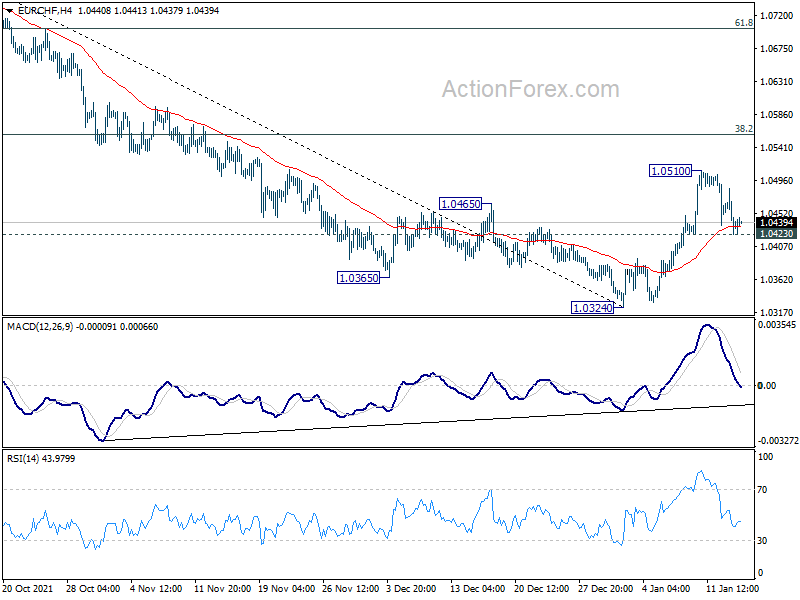
Intraday bias in EUR/CHF remains neutral for the moment. Corrective rebound from 1.0342 could extend higher. But strong resistance should be seen from 38.2% retracement of 1.0936 to 1.0324 at 1.0558 to limit upside. On the downside, below 1.0423 minor support will turn bias back to the downside for retesting 1.0324 low. Break there will resume larger down trend from 1.1149.
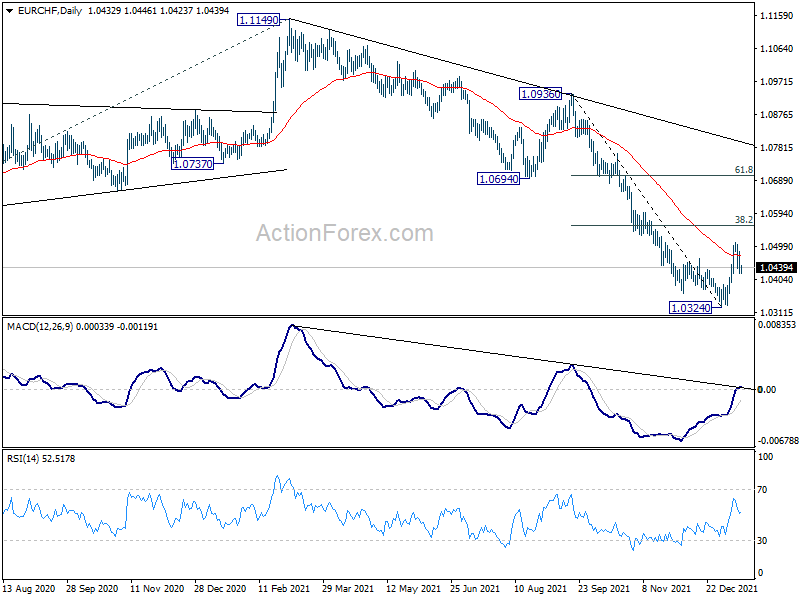
In the bigger picture, long term down trend from 1.2004 (2018 high) is now extending. Next target is 61.8% projection of 1.2004 to 1.0505 to 1.1149 at 1.0223. On the upside, break of 1.0505 support turned resistance is needed to be the first sign of medium term bottoming. Otherwise, outlook will remain bearish even in case of rebound.
Technical Outlook and Review
DXY:
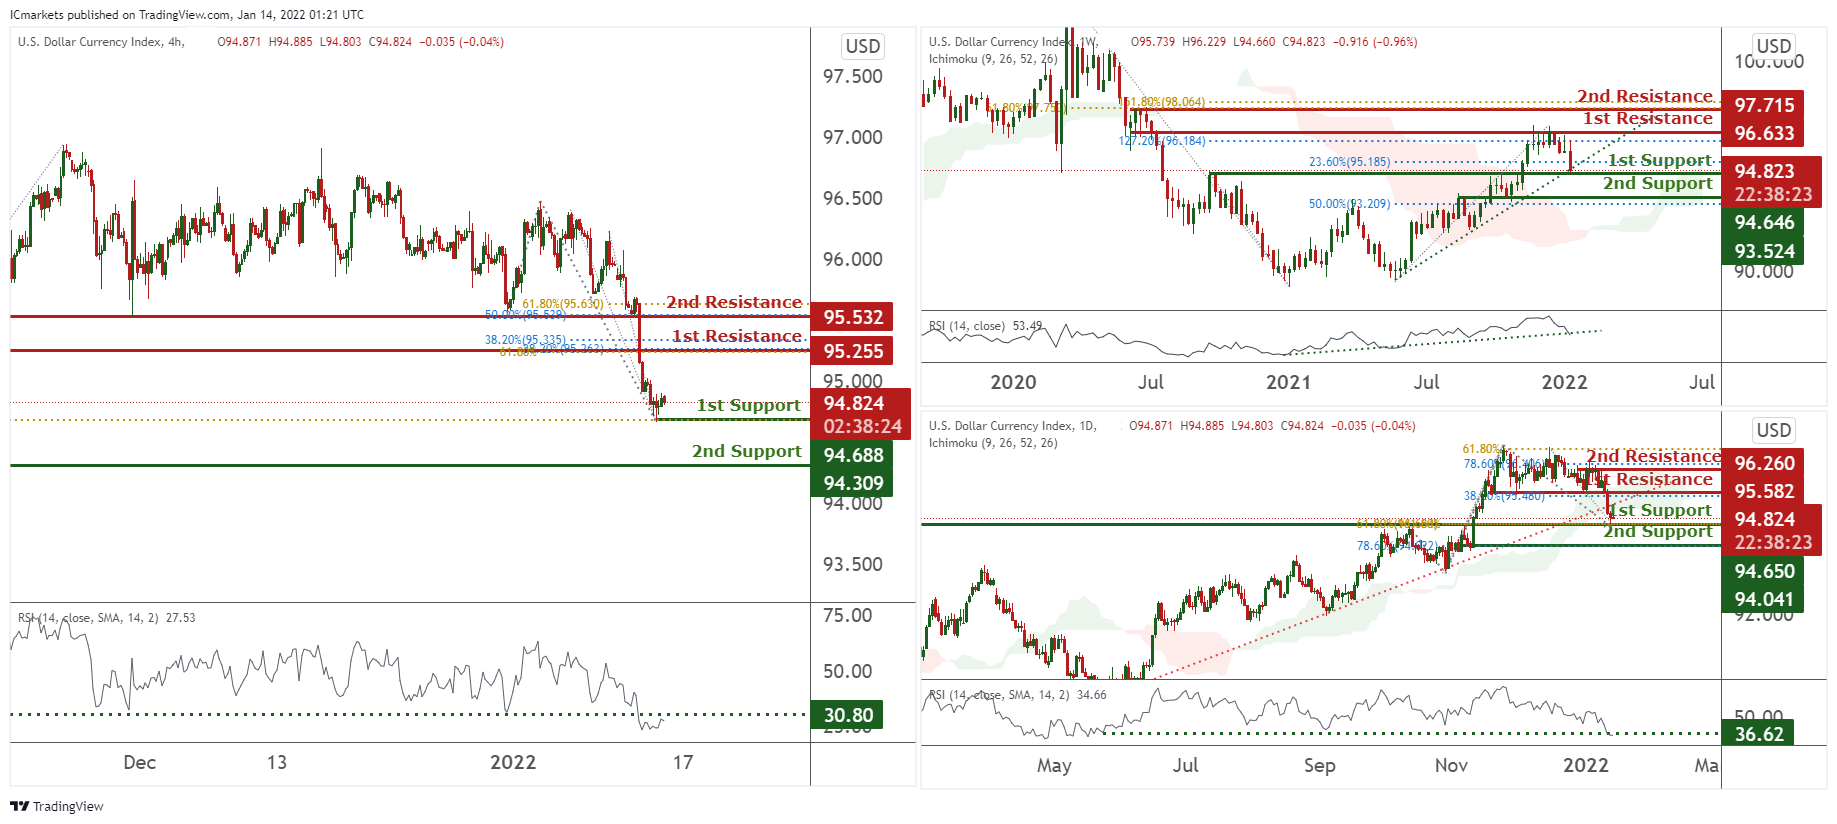
On the weekly, prices are on bullish momentum and abiding to our ascending trendline. We see potential for prices to bounce from our 1st support at 94.646 in line with 23.6% Fibonacci retracement towards our 1st resistance at 96.633 in line with 127.2% Fibonacci extension. Ichimoku clouds are forecasting bullish bounce.
On the daily, prices have recently broken out of our ascending trendline. We see potential for prices to bounce from our 1st support at 94.650 in line with 61.8% Fibonacci retracement and 61.8% Fibonacci extension towards our 1st resistance at 95.582 in line with 38.2 Fibonacci retracement to retest our ascending trendline. RSI is at a level where bounces previously happened.
On the H4 timeframe, prices have reached a graphical swing low. We would expect a bounce from our 1st support at 94.688 in line with 61.8% Fibonacci retracement towards our 1st resistance at 95.255 which is an area of FIbonacci confluences. RSI is at a level where bounces previously occurred.
Areas of consideration:
- H4 time frame, 1st resistance at 95.255
- H4 time frame, 1st support at 94.688
XAU/USD (GOLD):
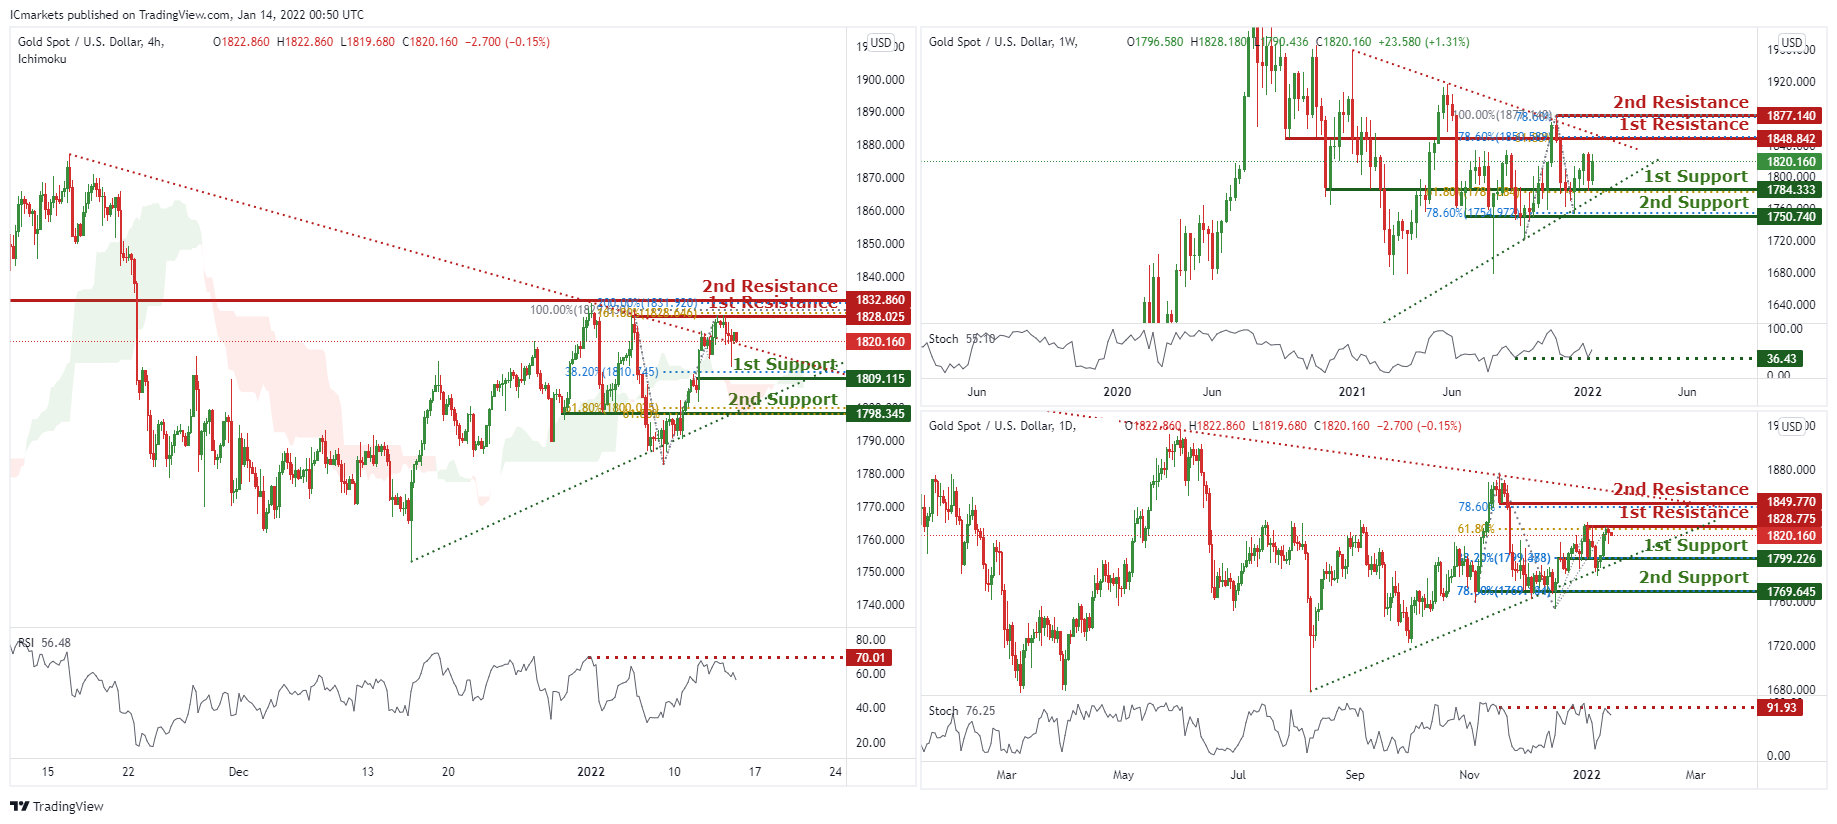
On the weekly, prices are consolidating in a triangle and have the potential to bounce from our 1st support at 1784.333 in line with 61.8% Fibonacci extension towards our 1st resistance at 1848.842 in line with 78.6% Fibonacci retracement and 61.8% Fibonacci extension. Technical indicators are showing bullish momentum.
On the daily, prices are consolidating in a triangle. We see potential for a dip from our 1st resistance at 1828.775 in line with 61.8% Fibonacci retracement and 78.6% Fibonacci retracement towards our 1st support at 1799.226 in line with 38.2% Fibonacci retracement. Our bias is further supported by RSI at a level where dips previously occurred.
On the H4 chart, prices are abiding to our daily bearish trendline. We see potential for prices to dip from our 1st resistance at 1828.025 which is an area of Fibonacci confluences towards our 1st support at 1809.115 in line with 38.2% Fibonacci retracement. RSI is at a level where dips previously occurred. Alternatively, breaking our 1st resistance will find prices climbing further towards our 2nd resistance at 1832.860 which is a graphical overlap.
Areas of consideration:
- 4h 1st support at 1809.115
- 4h 1st resistance at 1828.025
GBP/USD
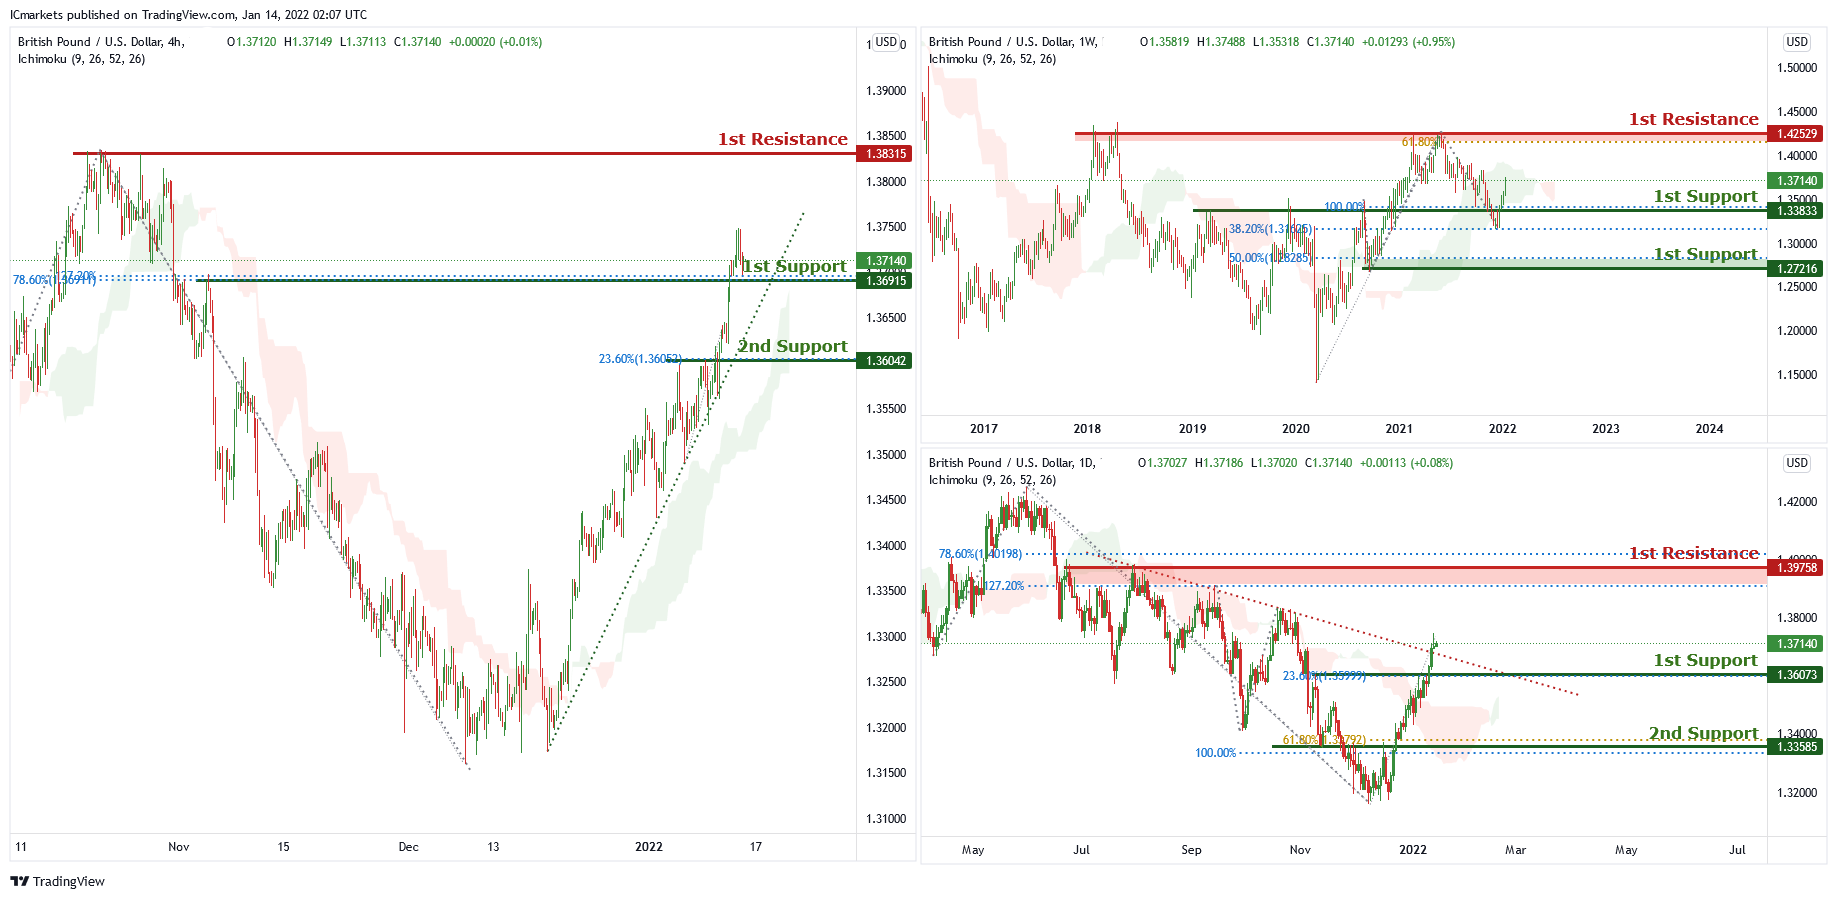
On the weekly chart, price is near the support level of 1.33833 which is also 100% Fibonacci projection and 38.2% Fibonacci retracement. Price can potentially go to the 1st resistance level of 1.42529 which is also 61.8% Fibonacci projection and graphical swing high. Our bullish bias is supported by the ichimoku cloud indicator as price is trading above it.
On the daily chart price has recently broken out of the descending trendline and is near 1st support level of 1.36073 which is also 23.6% Fibonacci retracement. Price can potentially go to the 1st resistance level of 1.39758 which is also 78.6% Fibonacci retracement and 127.2% Fibonacci projection. Our bullish bias is supported by the ichimoku cloud indicator as price is trading above it.
On the H4 chart price is abiding by an ascending trendline and near the first support level of 1.36915 which is also 78.6%% Fibonacci retracement and 127.2% Fibonacci projection . Price can potentially go to the 1st resistance level of 1.38315 which is the graphical swing high level. Our bullish bias is supported by the ichimoku cloud indicator as price is trading above it.
Areas of consideration:
- H4 1st resistance at 1.38315
- H4 1st support 1.36915
USD/CHF
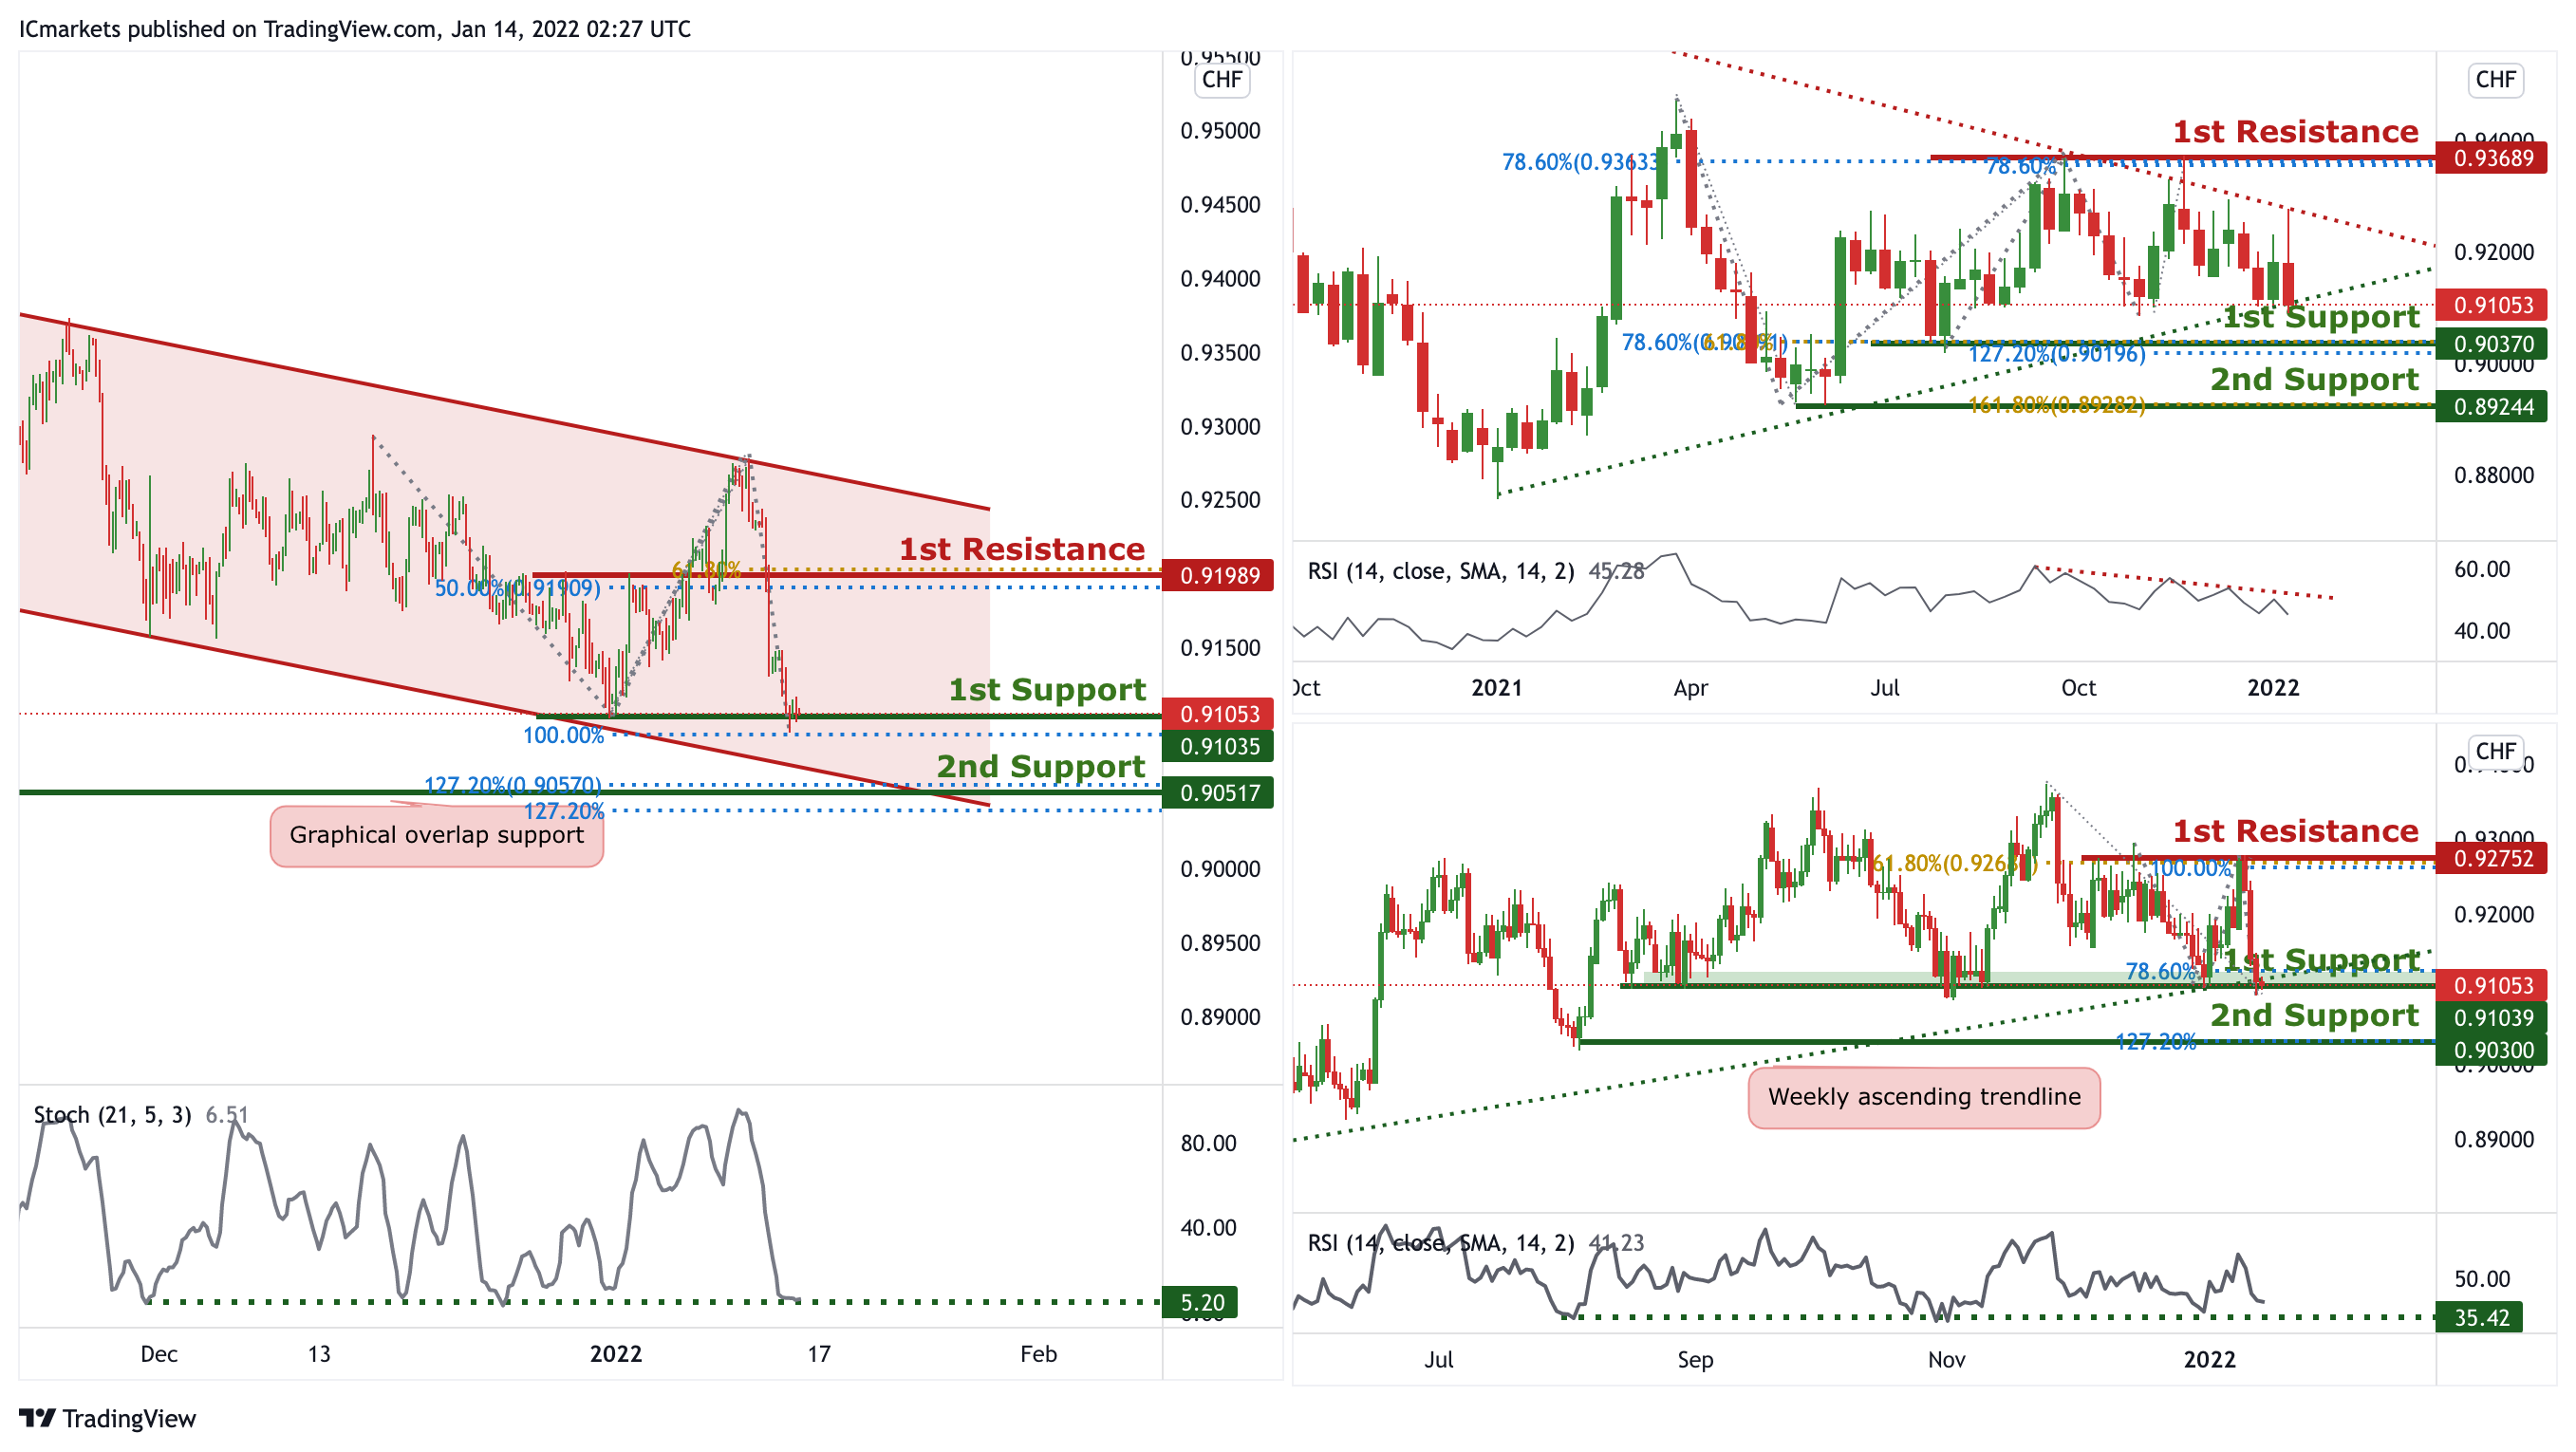
On the Weekly timeframe, price is reacting in a triangle pattern. Traders should wait for the price to swing higher or lower before entering. On the Daily timeframe, price is abiding to the ascending trendline support on the weekly,we can expect an overall bullish momentum. Price could bounce from 1st Support in line with 78.6% Fibonacci retracement and 78.6% FIbonacci projection towards 1st Resistance in line with 61.8% Fibonacci retracement and 100% Fibonacci projection. Our bullish bias is further supported by the RSI indicator where it is at the support level.
On the H4 timeframe, price is abiding to a descending channel, signifying a bearish momentum. Price is approaching a support level, we can expect price to make a short-term bullish bounce in line with 78.6% Fibonacci Projection and 161.8% Fibonacci retracement towards 1st Resistance in line with 78.6% Fibonacci projection. Our short-term bullish bias is further supported by the stochastic indicator where the %K line is approaching the support level.
Areas of consideration:
- Watch 1st Support at 0.91113
- Watch 1st Resistance at 0.92698
EUR/USD :
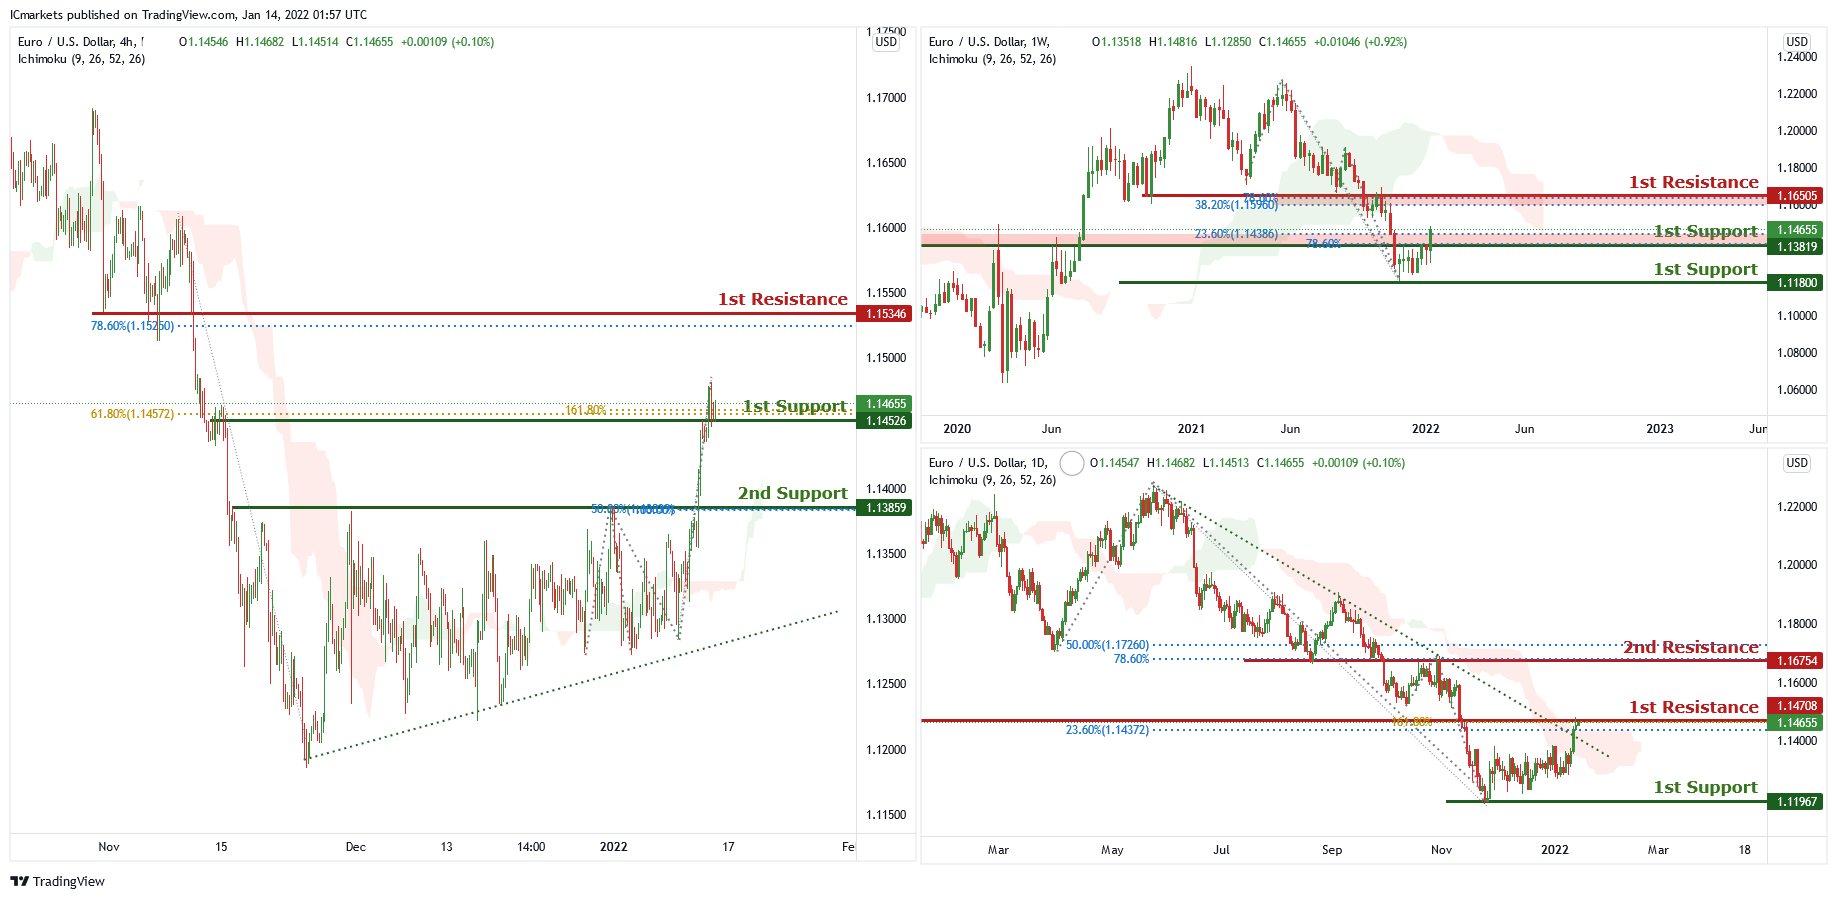
On the weekly chart, price is near the 1st support level of 1.13819 which is also 23.6% Fibonacci retracement and 78.6% Fibonacci projection. Price can potentially go to the 1st resistance level of 1.16505 which is also 78.6% Fibonacci projection and 38.2% Fibonacci retracement. Our bullish bias is supported by the stochastic indicator as it is near support level.
On the daily chart, price has recently broken out of the descending trendline and is near 1st resistance level of 1.14708 which is also 23.6% Fibonacci retracement. Price can potentially go to the graphical overlap resistance level of 1.16754 which is also 50% Fibonacci retracement and 78.6% Fibonacci projection. Our bullish bias is supported by the ichimoku cloud indicator as price is trading above it.
On the H4 chart , price is abiding by an ascending trendline and is near 1st support level of 1.14526 which is also 161.8% Fibonacci projection and 61.8% Fibonacci retracement. Price can potentially go to the 1st resistance level of 1.15346 which is also 78.6% Fibonacci retracement. Our bullish bias is supported by the ichimoku cloud indicator as price is trading above it.
Areas of consideration:
- H4 1st resistance at 1.15346
- H4 1st support at 1.14526
USD/JPY
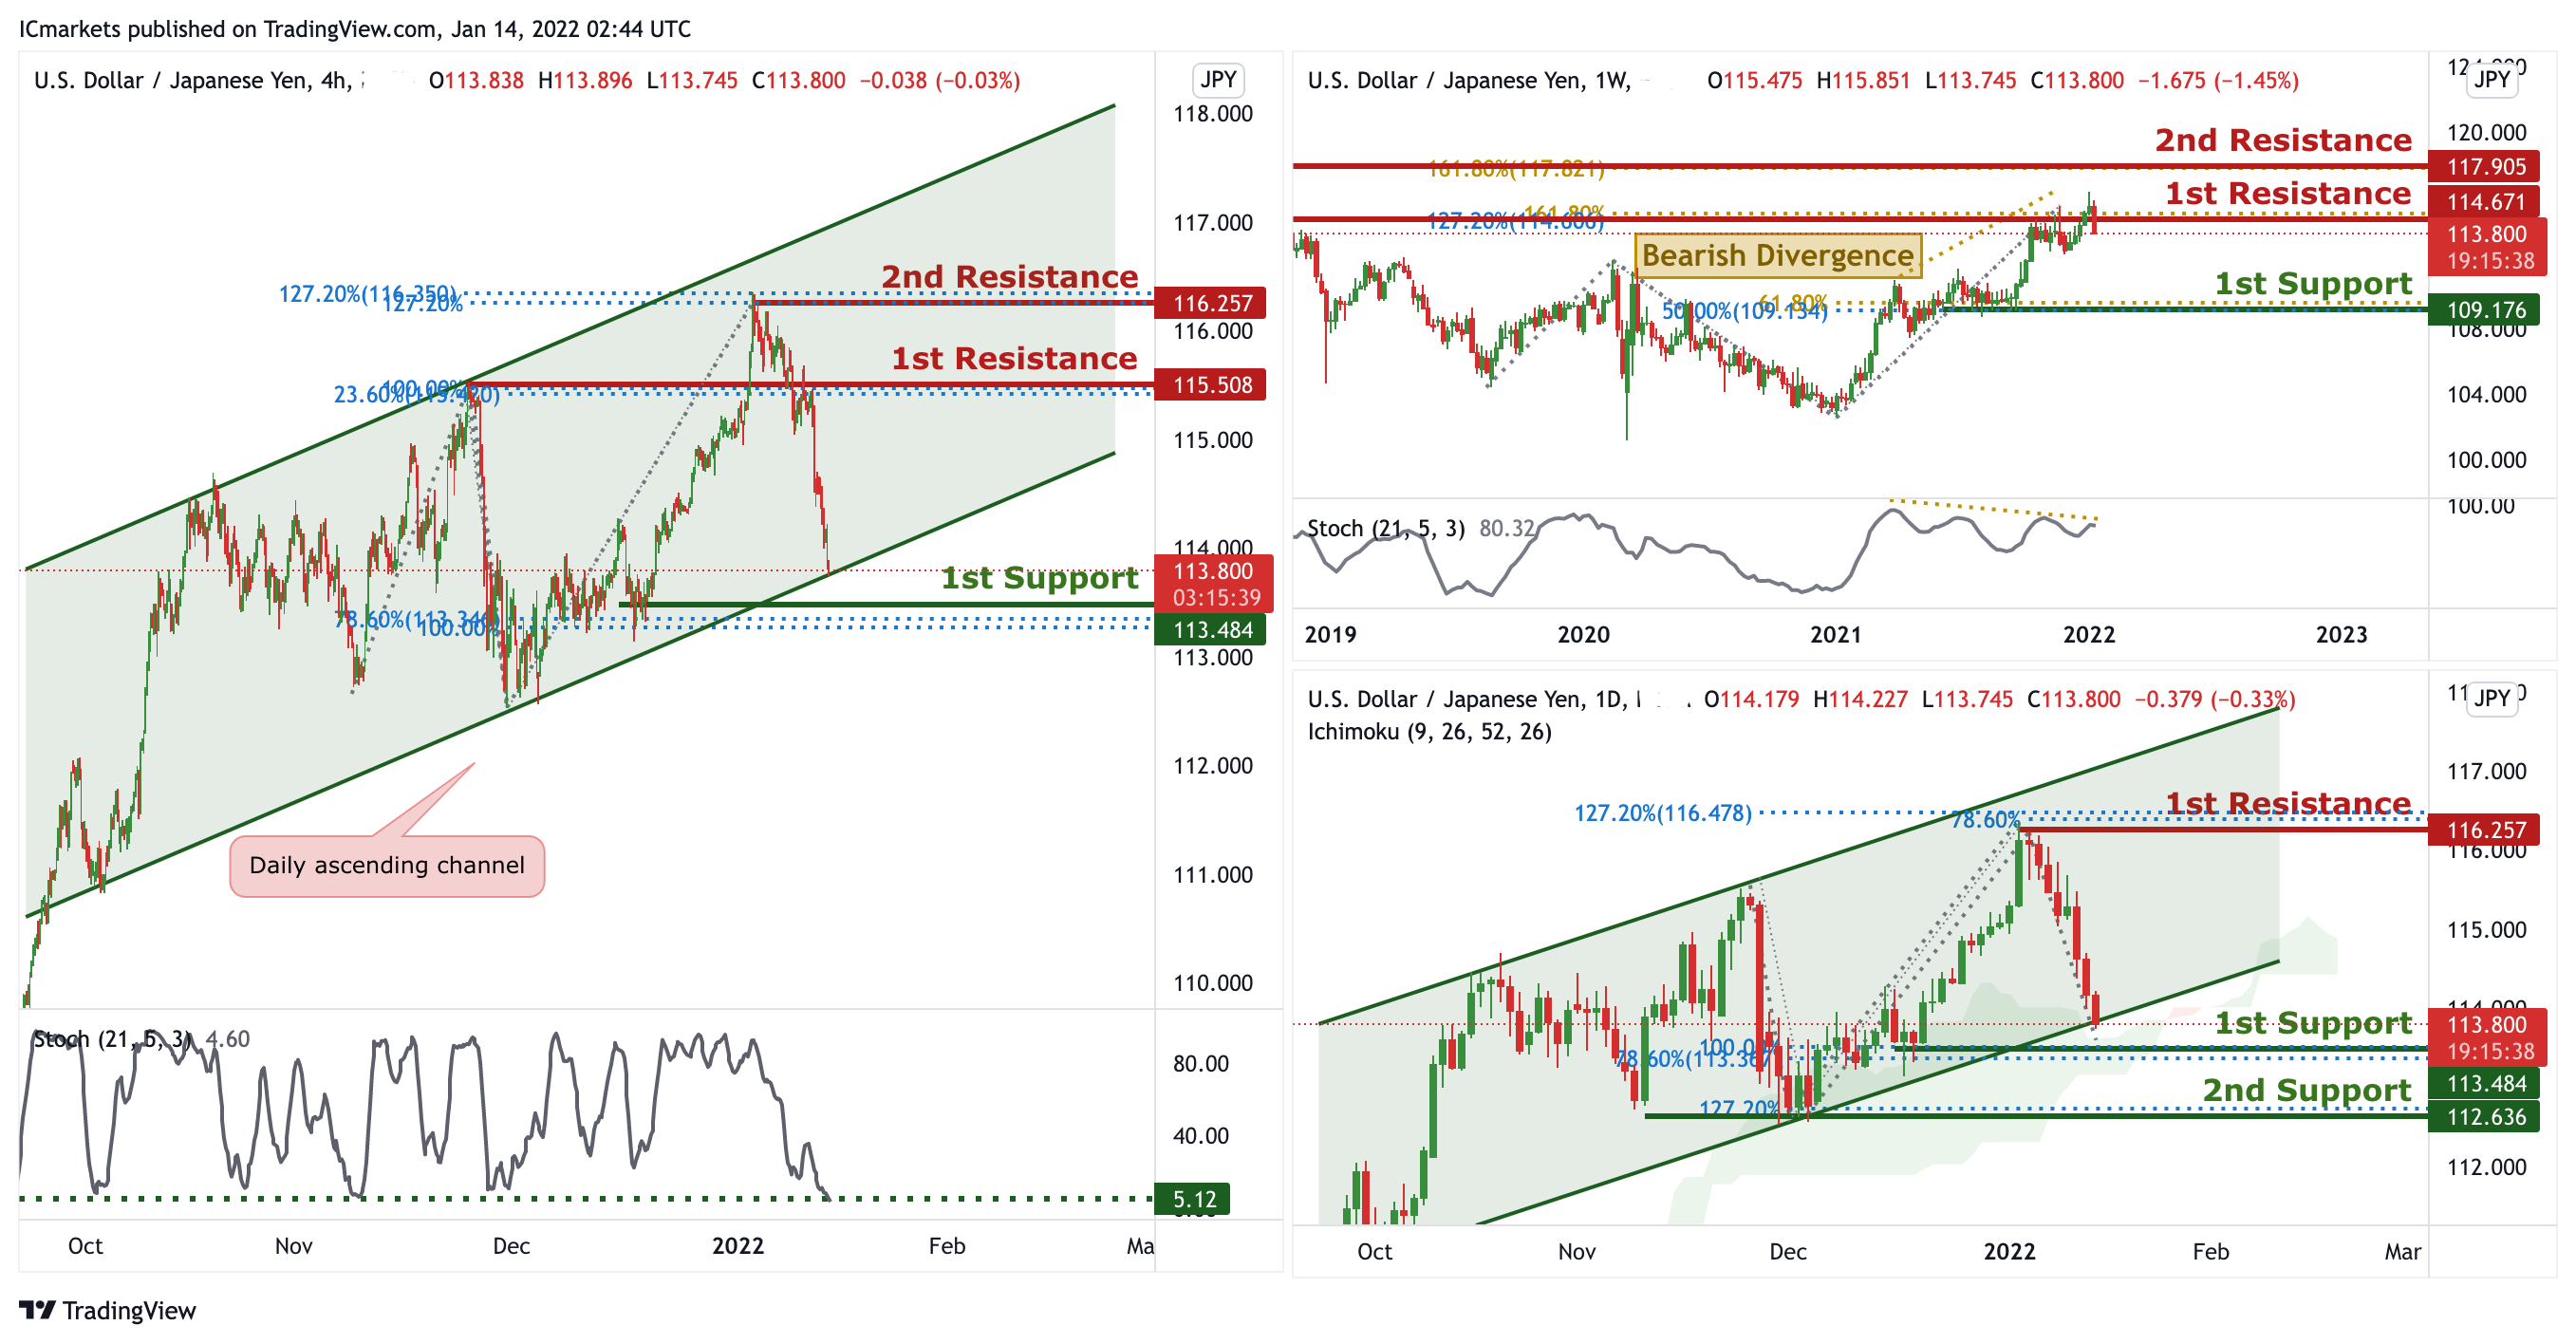
On the Weekly timeframe, we can see that price touched the 1st resistance in line with horizontal swing highs and 127.2% FIbonacci Retracement and 161.8% Fibonacci Projection. We can expect the price to drop from the 1st Resistance towards the 1st Support in line with 61.8% Fibonacci projection and 50% Fibonacci retracement. Our short-term bearish momentum is further supported by the stochastic %K line holding below the descending trendline resistance and bearish divergence spotted. In reference to last week’s analysis, on the Daily timeframe price indeed dropped to the 1st Support. Price is now abiding to the ascending channel, we can expect price to bounce from 1st Support in line with 100% Fibonacci projection and 78.6% Fibonacci extension towards 1st Resistance in line with previous swing high, 127.2% Fibonacci expansion and 78,6% Fibonacci projection. Our bullish bias is further supported by the Ichimoku cloud acting as a support level.
In reference to yesterday’s analysis, price indeed moved down nicely to the 1st Support. On the H4 timeframe, is abiding to the ascending channel on the daily, signifying an overall bullish momentum. We can now expect price to bounce from 1st Support in line with daily support, 78.6% Fibonacci retracement and 100% FIbonacci projection. Our bullish bias is further supported by the stochastic indicator where the %K line is at the support level.
Areas of consideration:
- H4 1st resistance level 115.508
- H4 1st support level 113.484
AUD/USD:
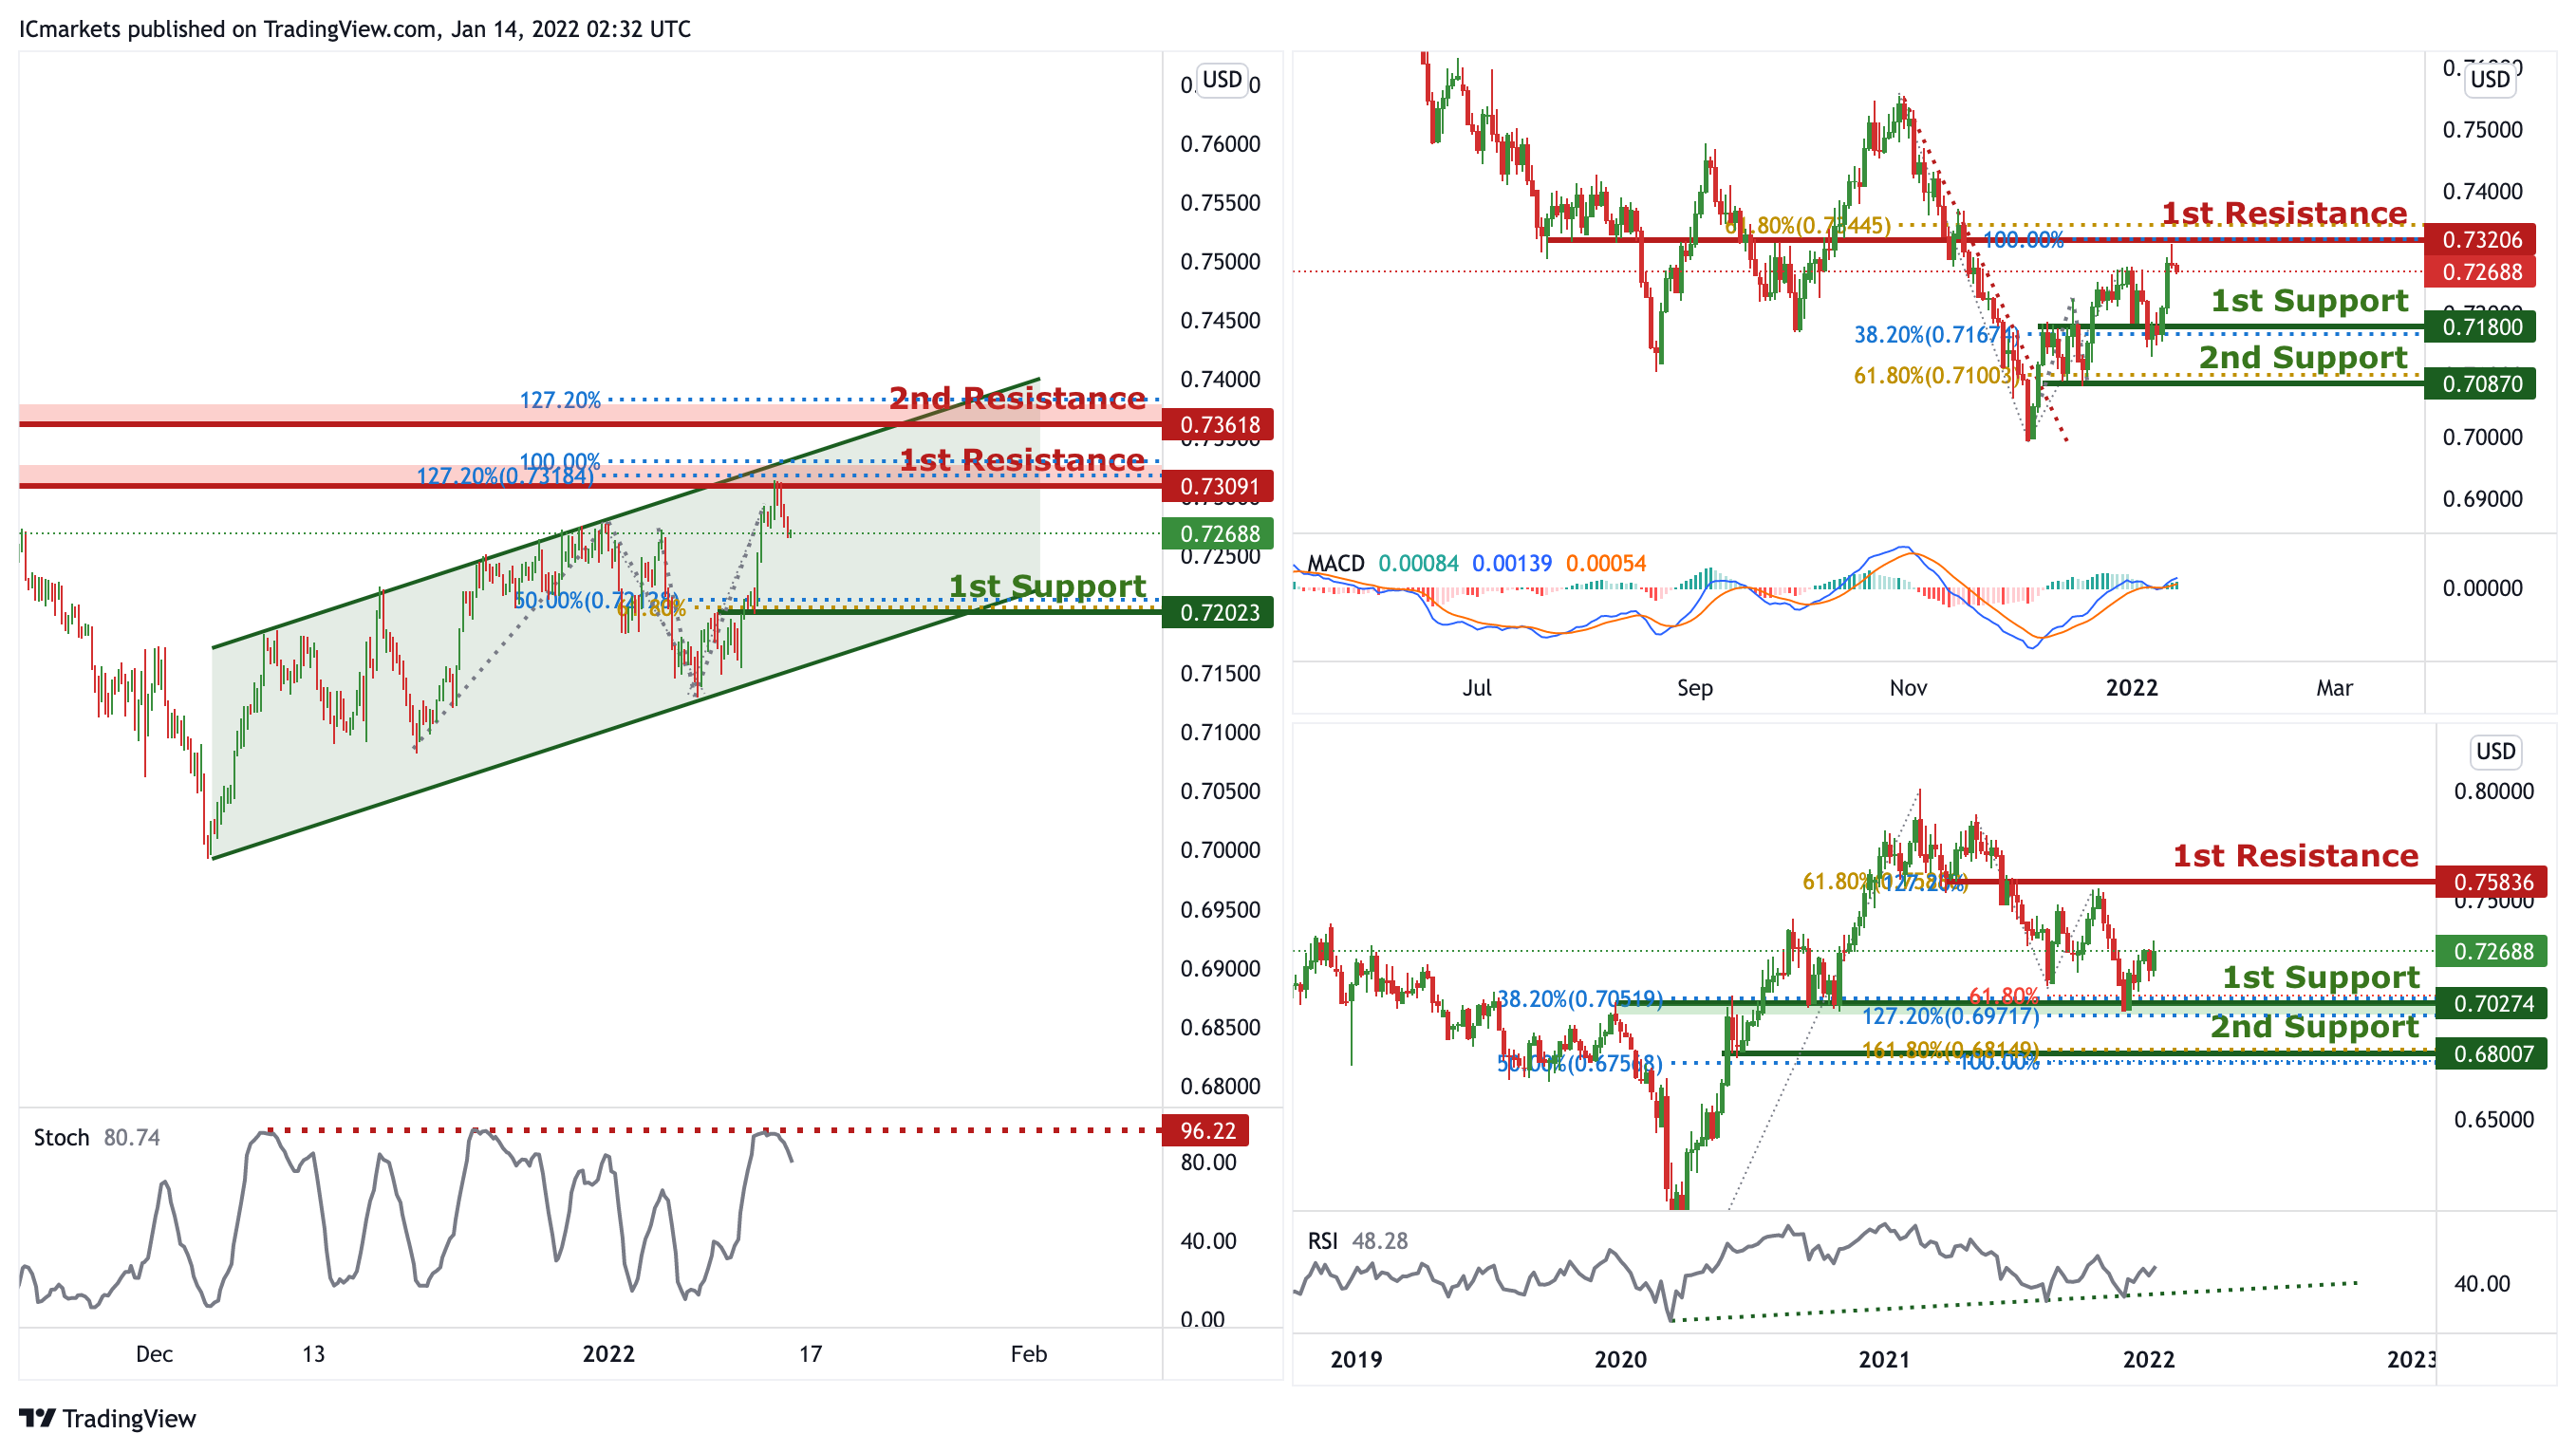
In reference to last week’s analysis, price has bounced nicely on the 1st Support. On the weekly, we can now expect the price to continue to push higher from the 1st Support in line with 61.8% Fibonacci projection, 38.2 % FIbonacci retracement and 127.2% Fibonacci extensions. Our bullish bias is further supported by the RSI indicator abiding to an ascending trendline. Traders should wait for prices to swing higher or lower before entering again. In reference to last week’s analysis price indeed bounced nicely on the 1st Support on the daily timeframe. On the Daily, the price is at the 1st support, we can expect the price to continue to push higher from 1st Support in line with 38.2% Fibonacci retracement towards 1st Resistance in line with 100% Fibonacci projection and 61.8% Fibonacci retracement. Our bullish bias is further supported by the MACD indicator where the MACD line is above the signal line.
On the H4, price is reacting within the ascending channel, signifying an overall bullish momentum. Price is approaching the 1st Resistance, we can expect to see price make a short-term bearish drop from 1st Resistance in line with 127.2% Fibonacci extension and 100% Fibonacci projection towards 1st Support in line with 50% Fibonacci retracement and 61.8% Fibonacci projection. Our short-term bearish bias is further supported by the stochastic indicator where the %K line is at the resistance level.
Areas of consideration:
- H4 1st Support level 0.72023
- H4 1st resistance level 0.73091
NZD/USD:
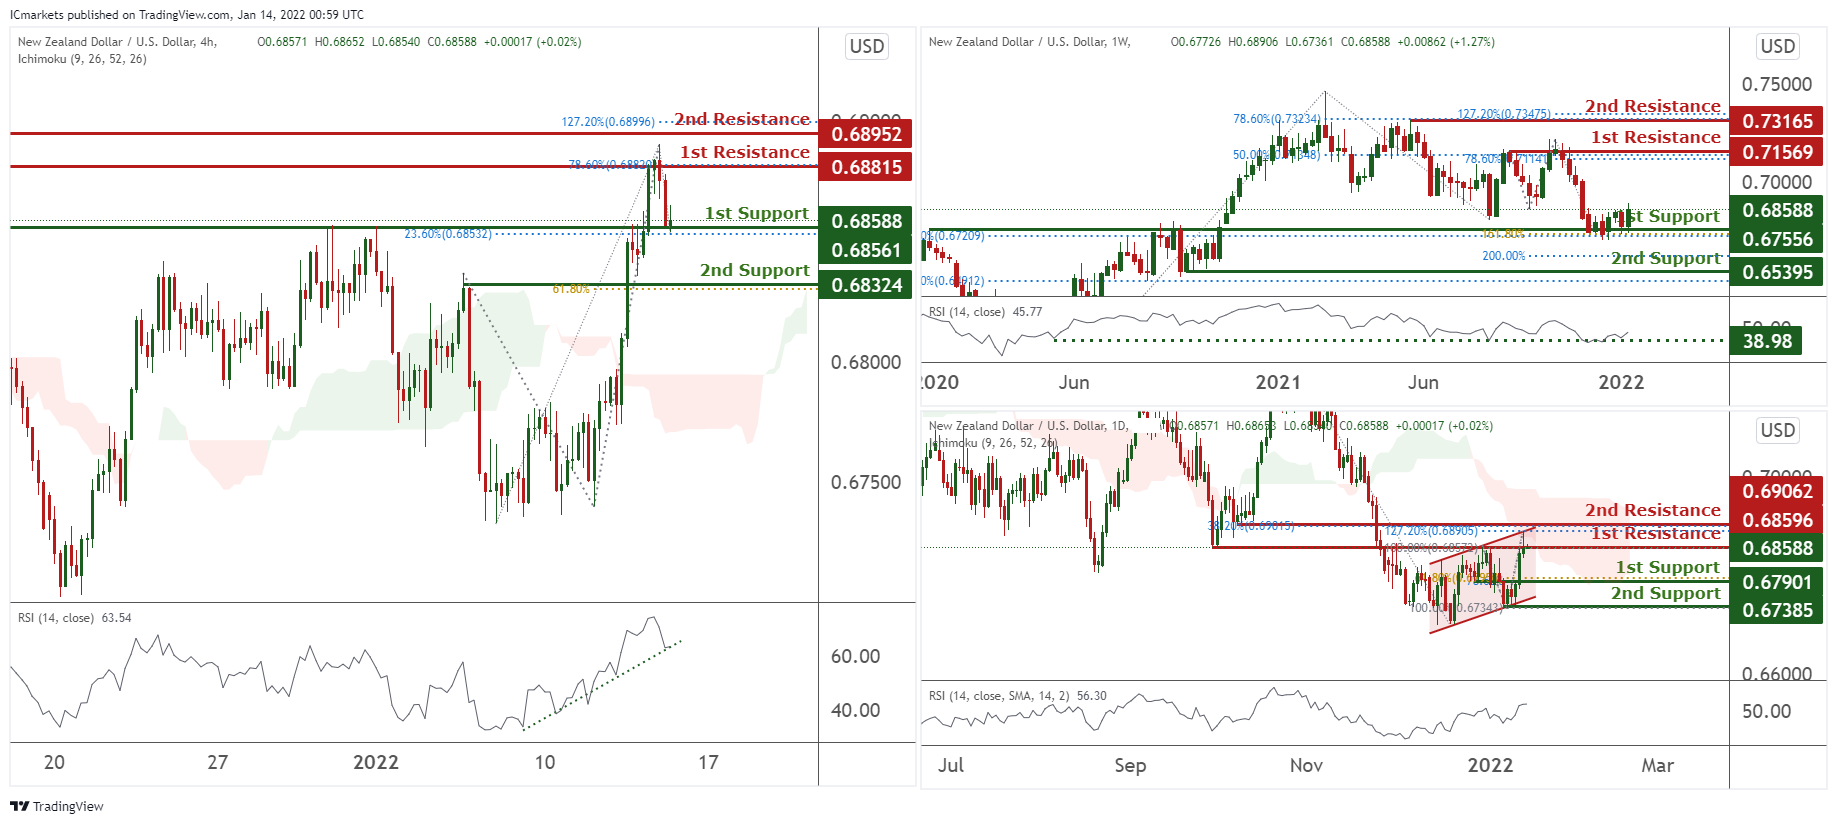
On the weekly, prices are on a bullish momentum. We see potential for a bounce at 1st support at 0.67556 in line with 23.6% Fibonacci retracement towards 1st resistance at 61.8% Fibonacci retracement. Technical indicators are showing bullish momentum. Alternatively, if prices break our 1st support, we might find it dipping towards our 2nd support at 0.69794 in line with 61.8% and 78.6% Fibonacci retracement.
On the daily, prices are consolidating in a channel. We see potential for prices to dip from our 1st resistance at 0.68596 in line with 100% Fibonacci retracement towards our 1st support at 0.67901 in line with 61.8% Fibonacci retracement. Ichimoku clouds are forecasting the dips.
On the H4 timeframe, prices are at a daily support and strong graphical overlap. We see potential for prices to bounce from our 1st support at 0.68588 in line with 23.6% Fibonacci retracement towards our 1st resistance at 0.68815 in line with 78.6% Fibonacci extension. Our bias is further supported by the Ichimoku Clouds forecasting bullish momentum and also RSI portraying an upward trend. If prices break our 1st support, we can potentially find prices dipping towards our 2nd support at 0.68324 in line with 61.8% Fibonacci retracement.
Areas of consideration:
- H4 time frame, 1st resistance at 0.68815
- H4 time frame, 1st support at 0.68588
USD/CAD:
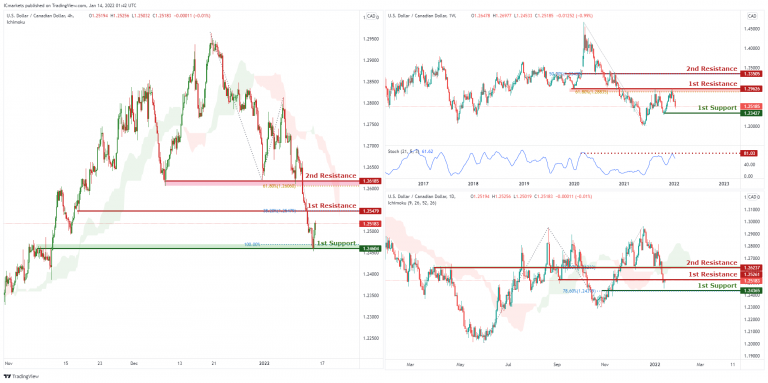
On the Weekly, with price reversing from the resistance of the stochastics, we have a bearish bias that price will from from our 1st resistance at 1.29626 which is in line with horizontal overlap resistance and 61.8% Fibonacci retracement to 1st support at 1.23427, which is in line with horizontal swing low support. Alternatively, price may break 1st resistance structure and head for 2nd resistance at 1.33505, which coincides with horizontal overlap resistance and 50% Fibonacci retracement.
On the Daily, with price moving below the ichimoku cloud, we have a bearish bias that price will from from our 1st resistance at 1.25261 which is in line with horizontal overlap resistance to 1st support at 1.24365, which is in line with horizontal overlap support and 78.6% Fibonacci retracement level. Alternatively, price may break 1st resistance structure and head for 2nd resistance at 1.26237, which coincides with horizontal overlap resistance and 50% Fibonacci retracement.
On the H4, with price moving below the ichimoku cloud, we have a bearish bias that price will from from our 1st resistance at 1.25479 which is in line with horizontal overlap resistance and 38.2% Fibonacci retracement to 1st support at 1.24604, which is in line with horizontal overlap support and 100% Fibonacci projection level. Alternatively, price may break 1st resistance structure and head for 2nd resistance at 1.26185, which coincides with horizontal overlap resistance and 61.8% Fibonacci retracement.
Areas of consideration:
- H4 time frame, 1st support at 1.24604
- H4 time frame, 1st resistance at 1.25479
OIL:
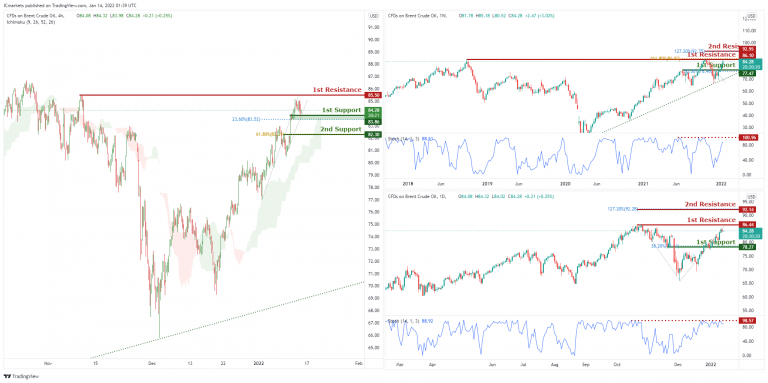
On the Weekly, with price approaching the resistance of the stochastics, we have a bearish bias that price will from from our 1st resistance at 86.10 which is in line with horizontal swing high resistance and 161.8% Fibonacci projection to 1st support at 77.47, which is in line with horizontal overlap support and 50% Fibonacci retracement level. Alternatively, price may break 1st resistance structure and head for 2nd resistance at 92.95, which coincides with horizontal swing high resistance and 127.2% Fibonacci extension level.
On the Daily, with price at the resistance of the stochastics zone, we have a bearish bias that price will from from our 1st resistance at 86.44 which is in line with horizontal swing high resistance to 1st support at 78.27, which is in line with horizontal overlap support and 38.2% Fibonacci retracement level. Alternatively, price may break 1st resistance structure and head for 2nd resistance at 92.14, which coincides with horizontal swing high resistance and 127.2% Fibonacci extension level.
On the H4, with price moving above the ichimoku cloud, we have a bullish bias that price will rise to our 1st resistance at 85.5 which is in line with horizontal swing high resistance from 1st support at 83.86, which is in line with horizontal overlap support and 23.6% Fibonacci retracement level. Alternatively, price may break 1st support structure and head for 2nd support at 82.30, which coincides with horizontal swing low support and 61.8% Fibonacci retracement level .
Areas of consideration:
- H4 time frame, 1st resistance of 85.5
- H4 time frame, 1st support of 83.86
Dow Jones Industrial Average:
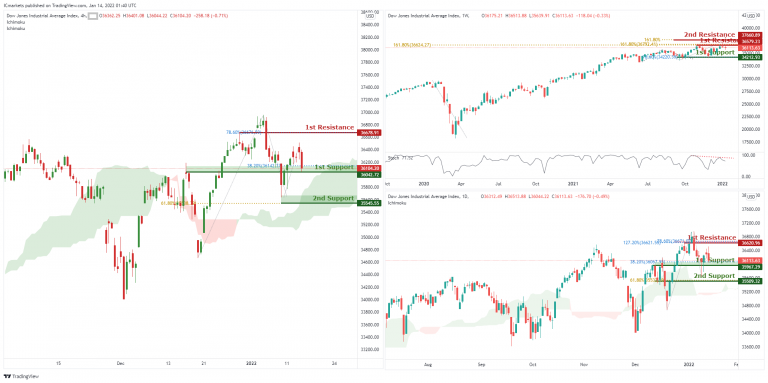
On the Weekly, with price reacting off the resistance of the stochastics, we have a bearish bias that price will from from our 1st resistance at 36579 which is in line with horizontal swing high resistance and 161.8% Fibonacci projection level to 1st support at 34212, which is in line with horizontal swing low support and 78.6% Fibonacci retracement level. Alternatively, price may break 1st resistance structure and head for 2nd resistance at 37660, which coincides with horizontal swing high resistance and 161.8% Fibonacci projection level.
On the Daily, with price moving above the ichimoku cloud, we have a bullish bias that price will rise to our 1st resistance at 36620 which is in line with horizontal swing high resistance, 78.6% Fibonacci projection and 127.2% Fibonacci extension from 1st support at 35967, which is in line with horizontal overlap support and 38.2% Fibonacci retracement level. Alternatively, price may break 1st support structure and head for 2nd support at 35509, which coincides with horizontal overlap support and 61.8% Fibonacci retracement level.
On the H4, with price moving above the ichimoku cloud, we have a bullish bias that price will rise to our 1st resistance at 36678 which is in line with horizontal swing high resistance and 78.6% Fibonacci retracement level from 1st support at 36042, which is in line with horizontal overlap support and 38.2% Fibonacci retracement level. Alternatively, price may break 1st support structure and head for 2nd support at 35545, which coincides with horizontal swing low support and 61.8% Fibonacci retracement level.
Areas of consideration:
- H4 time frame, 1st resistance of 36678
- H4 time frame, 1st support of 36042
AUD/USD Daily Report
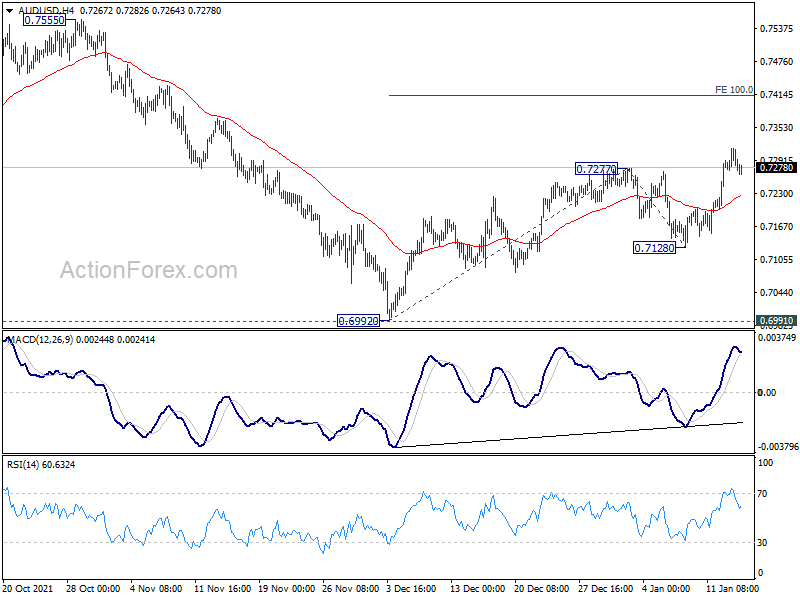
Daily Pivots: (S1) 0.7265; (P) 0.7289; (R1) 0.7305; More...
Intraday bias in AUD/USD remains on the this point. Correction from 0.8006 could have completed after defending 0.6991. Further rise should be seen to 100% projection of 0.6992 to 0.7277 from 0.7128 at 0.7413 first. For now, further rally will remain in favor as long as 0.7128 support holds, in case of retreat.
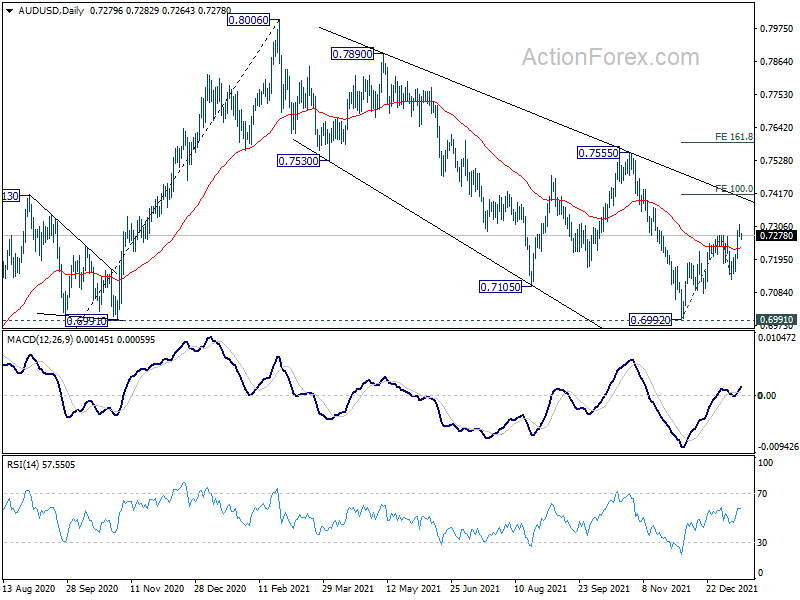
In the bigger picture, strong rebound from 0.6991 key structural support will retain medium term bullishness. That is, whole up trend from 0.5506 is still in progress. Firm break of 0.7555 resistance will target 0.8006 high and above. However, sustained break of 0.6991 will argue that the whole up trend from 0.5506 might be finished at 0.8006, after rejection by 0.8135 long term resistance. Deeper decline would then be seen back to 61.8% retracement of 0.5506 to 0.8006 at 0.6461.
USD/CAD Daily Outlook
Daily Pivots: (S1) 1.2475; (P) 1.2497; (R1) 1.2541; More...
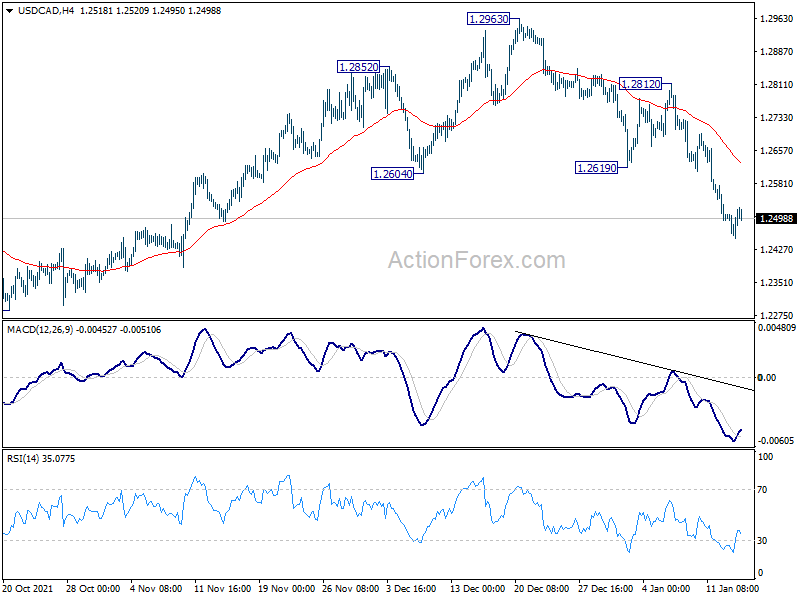
Intraday bias in USD/CAD remains on the downside for the moment. As noted before, rise from 1.2286 is finished at 1.2963, and possibly the whole pattern from 1.2005 too. Deeper decline would be seen back to 1.2286 support first. Break there will target 1.2005 low. For now, risk will stay on the downside as long as 1.2812 resistance holds, in case of recovery.
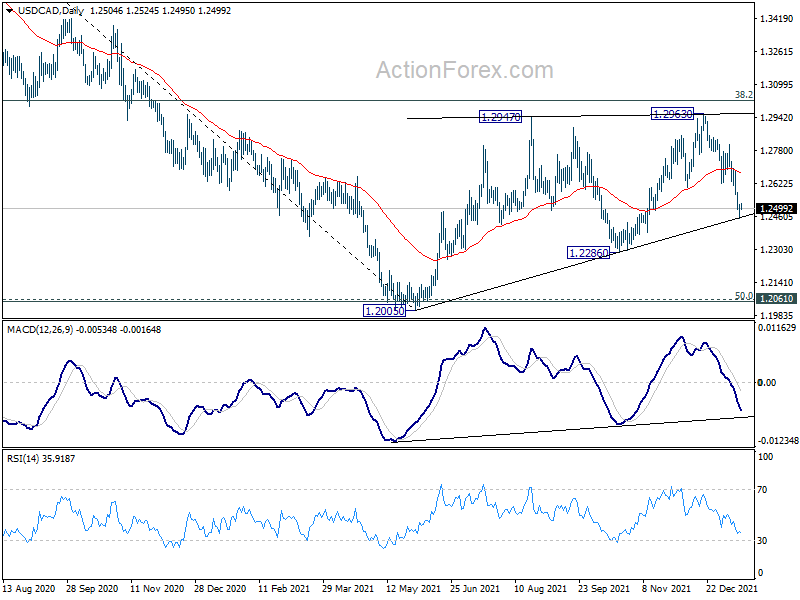
In the bigger picture, focus will be on 38.2% retracement of 1.4667 (2020 high) to 1.2005 (2021 low) at 1.3022. Sustained break there should confirm that the down trend from 1.4667 has completed after defending 1.2061 long term cluster support. Further rise would then be seen towards 61.8% retracement at 1.3650. However, rejection by 1.3022 will maintain medium term bearishness. Break of 1.2005 will resume the down trend form 1.4667 and that carries larger bearish implications too.
EUR/USD Daily Outlook
Daily Pivots: (S1) 1.1433; (P) 1.1458; (R1) 1.1479; More...
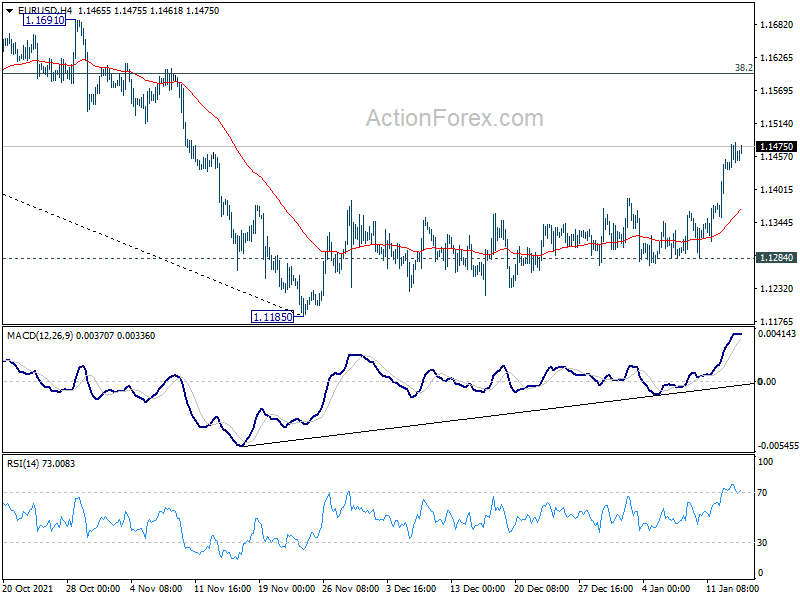
Intraday bias in EUR/USD remains on the upside as rebound from 1.1185 is still in progress. Further rise would target 38.2% retracement of 1.2265 to 1.1185 at 1.1598. As we're tentatively treating is as a corrective move, we'd look for strong resistance from 1.1598 to bring down trend resumption. On the downside, below 1.1284 support will bring retest of 1.1185 low. However, sustained break of 1.1598 will argue that the trend is reversing already.
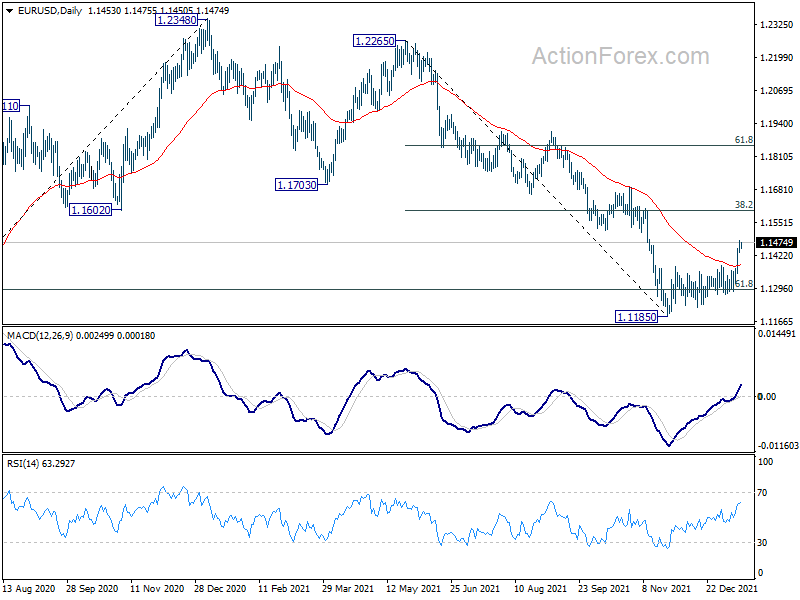
In the bigger picture, there are various ways of interpreting the fall from 1.2348 (2021 high). It could be a correction to rise from 1.0635 (2020 low), the fourth leg of a sideway pattern from 1.0339 (2017 low), or resuming long term down trend. In any case, outlook will now stay bearish as long as 1.1703 support turned resistance holds. Sustained break of 61.8% retracement of 1.0635 to 1.2348 at 1.1289 would pave the way back to 1.0635.
GBP/USD Daily Outlook
Daily Pivots: (S1) 1.3690; (P) 1.3720; (R1) 1.3738; More...
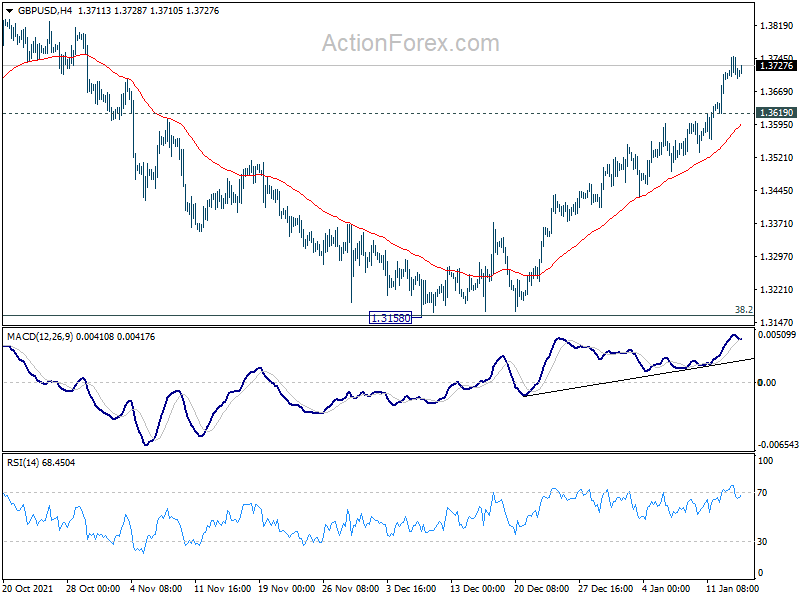
Intraday bias in GBP/USD remains on the upside for 1.3833 resistance first. As noted before, corrective fall from 1.4282 should have completed with three waves down to 1.3158, after hitting 1.3164 medium term fibonacci level. Sustained break of 1.3833 will pave the way back to retest 1.4248 high. On the downside, below 1.3619 minor support will turn intraday bias neutral first. But further rise will remain in favor as long as 55 day EMA (now at 1.3479) holds.
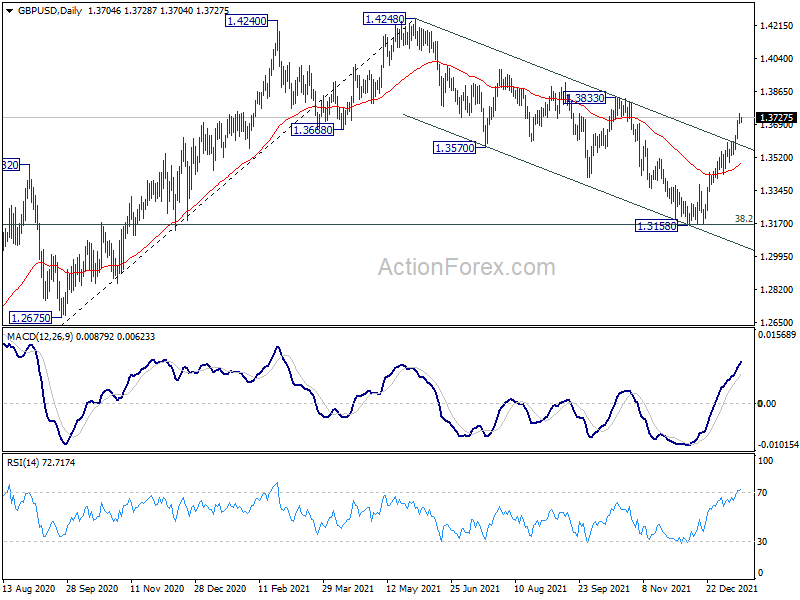
In the bigger picture, strong support was seen from 38.2% retracement of 1.1409 to 1.4248 at 1.3164. The development suggests that up trend from 1.1409 (2020 low) is still in progress. On resumption, next target will be 38.2% retracement of 2.1161 to 1.1409 at 1.5134. Nevertheless sustained break of 1.3164 will argue that whole rise from 1.1409 has completed and bring deeper fall to 61.8% retracement at 1.2493.
USD/CHF Daily Outlook
Daily Pivots: (S1) 0.9087; (P) 0.9118; (R1) 0.9143; More....
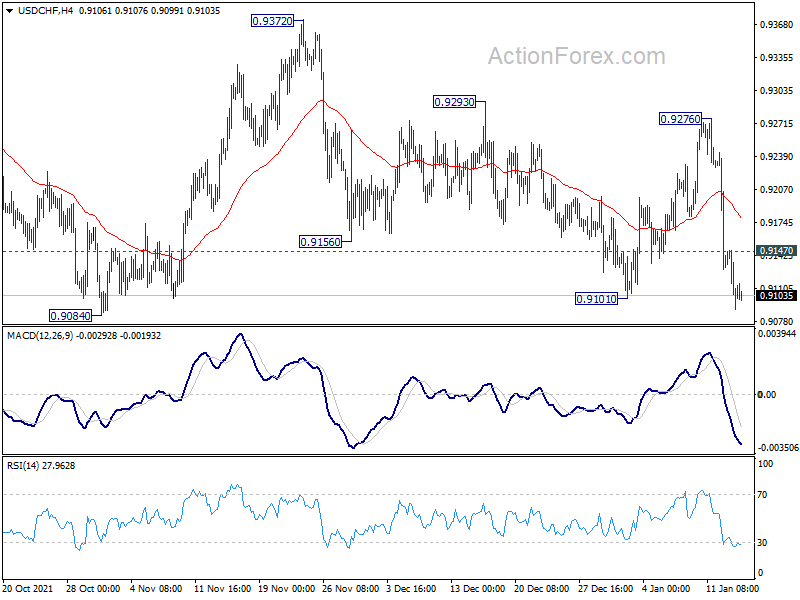
Intraday bias in USD/CHF remains on the downside at this point. Firm break of 0.9084/0.9101 support zone will argue that choppy rise from 0.8925 has completed. Fall from 0.9471 might be ready to resuming. Further decline would be seen back to 0.8925 support first. On the upside, above 0.9147 minor resistance will turn intraday bias neutral first.
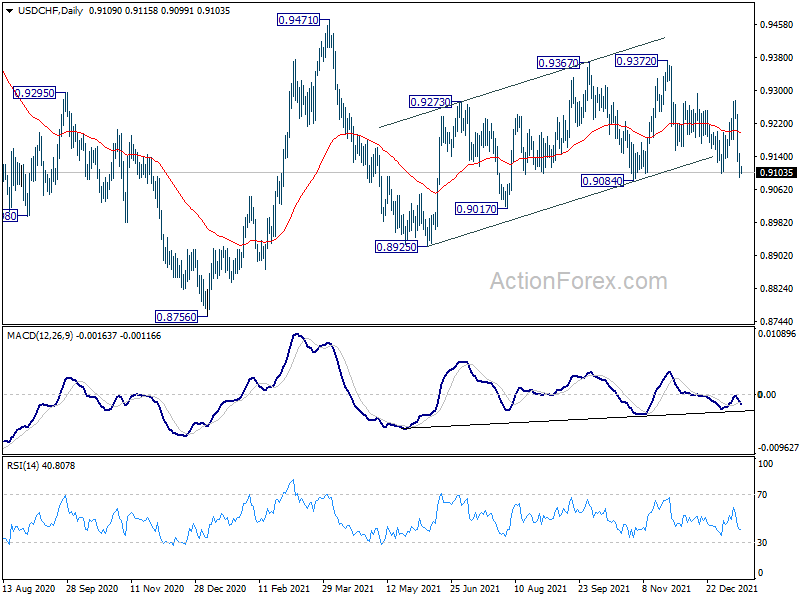
In the bigger picture, the corrective structure of the rebound from 0.8925 argues that fall from 0.9471 is not complete yet. It could either be the second leg of pattern from 0.8756 (2021 low), or resuming larger down trend from 1.0237 (2018 high). We'd pay attention to the downside momentum and assess the odds later. But for now, medium term outlook will be neutral at best as long as 0.9471 resistance holds.
USD/JPY Daily Outlook
Daily Pivots: (S1) 113.88; (P) 114.29; (R1) 114.59; More...
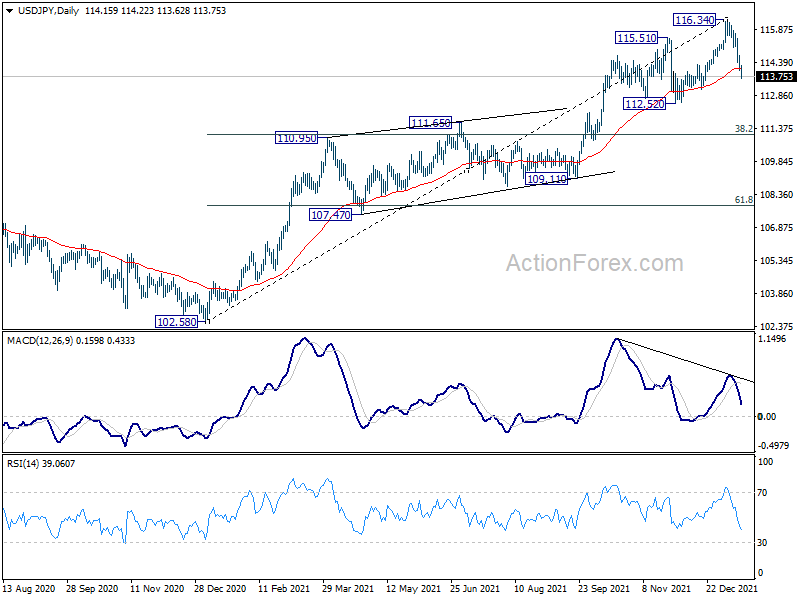
Intraday bias in USD/JPY remains on the downside as fall form 116.34 is accelerating towards 112.52 support. considering bearish divergence condition in in daily MACD, break of 112.52 will confirm that it's already in correction to the up trend from 102.58. Deeper fall would be seen to 38.2% retracement of 102.58 to 116.34 at 111.08. on the upside, above 114.37 minor resistance will turn intraday bias neutral first.
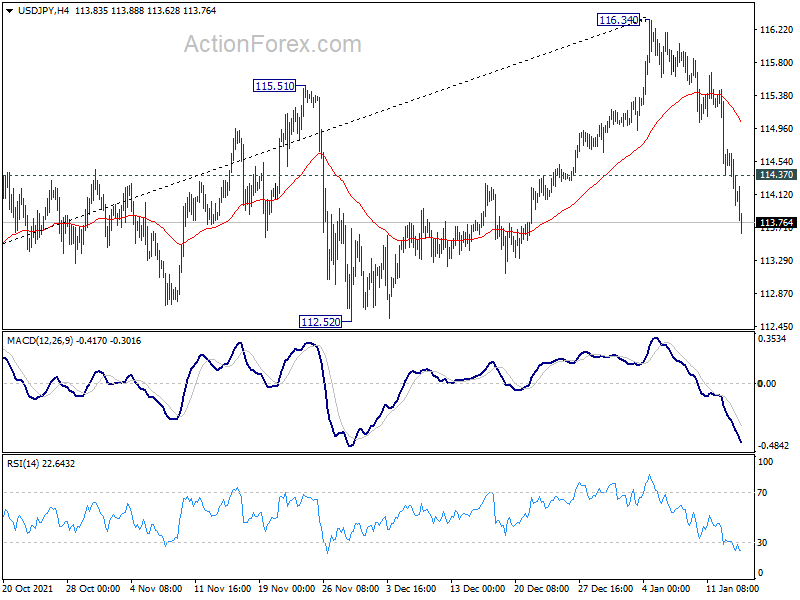
In the bigger picture, no change in the view that rise from 102.58 is the third leg of the up trend from 101.18 (2020 low). Such rally should target a test on 118.65 (2016 high). Sustained break there will pave the way to 120.85 (2015 high) and raise the chance of long term up trend resumption. However, firm break of 112.52 support will dampen this bullish case and we'll assess the outlook based on subsequent price actions later.