Sample Category Title
AUD/USD Falls Despite Hawkish RBA Minutes as Markets Doubt August Hike
The Australian Dollar barely reacted to the hawkish sets of RBA minutes. Instead, AUD/USD drifted lower in Asian trading, suggesting investors are no longer judging the Reserve Bank by what it says, but by what they believe it can realistically do.
On paper, the minutes kept August very much alive. Policymakers reiterated that monetary policy "needed to remain restrictive" and made clear they were prepared to raise the cash rate again "if necessary." Yet markets had already priced in that rhetoric. What stood out instead was the Board's emphasis on using time to assess how previous tightening is flowing through the economy. Investors interpreted that not as a prelude to another hike, but as confirmation that the RBA is firmly in watch-and-wait mode.
The market's skepticism reflects growing concern about Australia's domestic economy rather than any loss of confidence in the RBA's commitment to fighting inflation. Consumer sentiment remains close to its weakest level in half a century, while the housing market is showing increasingly clear signs of cooling after three rate hikes this year. Those conditions raise the economic cost of further tightening. As a result, many investors view the RBA's tough language as a form of "open-mouth operations"—using hawkish communication to restrain inflation expectations without necessarily intending to follow through with another immediate rate increase.
That leaves the Australian Dollar dependent on developments abroad rather than at home. Thursday's US Non-Farm Payrolls report may prove far more important for AUD/USD than the RBA minutes themselves. A strong payrolls report would reinforce the Dollar's advantage and could push the pair through the key 0.6832 support level. A weaker report, however, could allow AUD/USD to stabilize, although a sustained recovery may still require investors to regain confidence that the RBA is capable—not just willing—to tighten policy again.
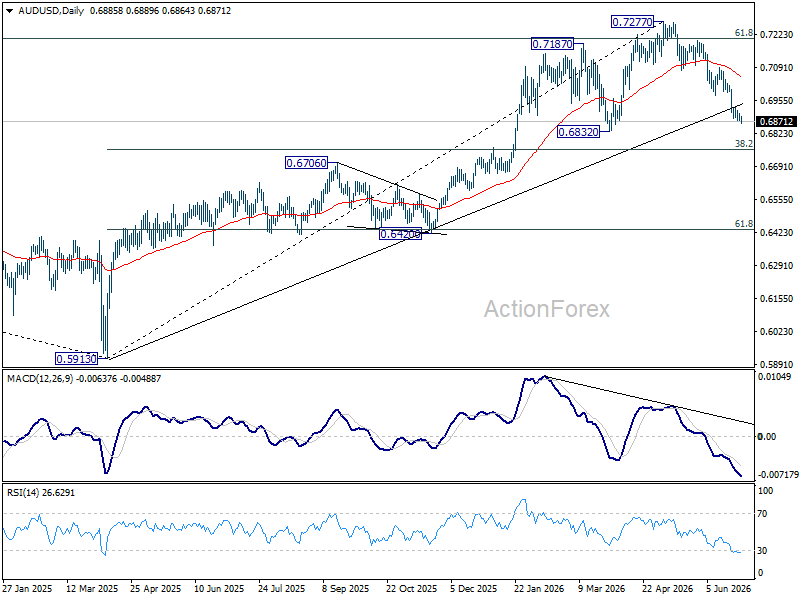
Technically, the decline from the 0.7277 medium-term high remains in progress, with 0.6832 acting as the next major support level. A decisive break there would expose 38.2% retracement of 0.5913 to 0.7277 at 0.6756.
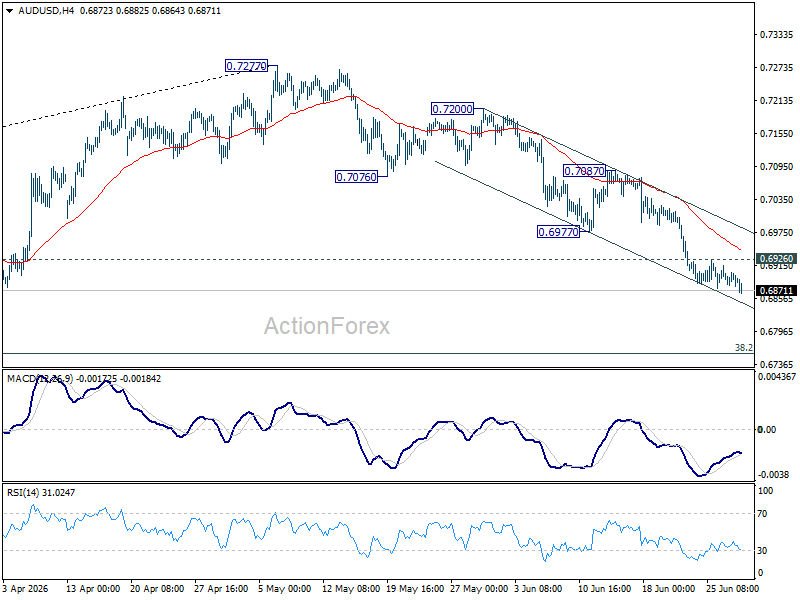
For now, however, the broader pullback is still viewed as a correction within the larger uptrend from the 2024 low at 0.5913, suggesting strong buying interest could emerge around the 0.6756 area. Initial resistance is seen at 0.6926, while 0.6977, a former support level, is expected to cap any recovery.
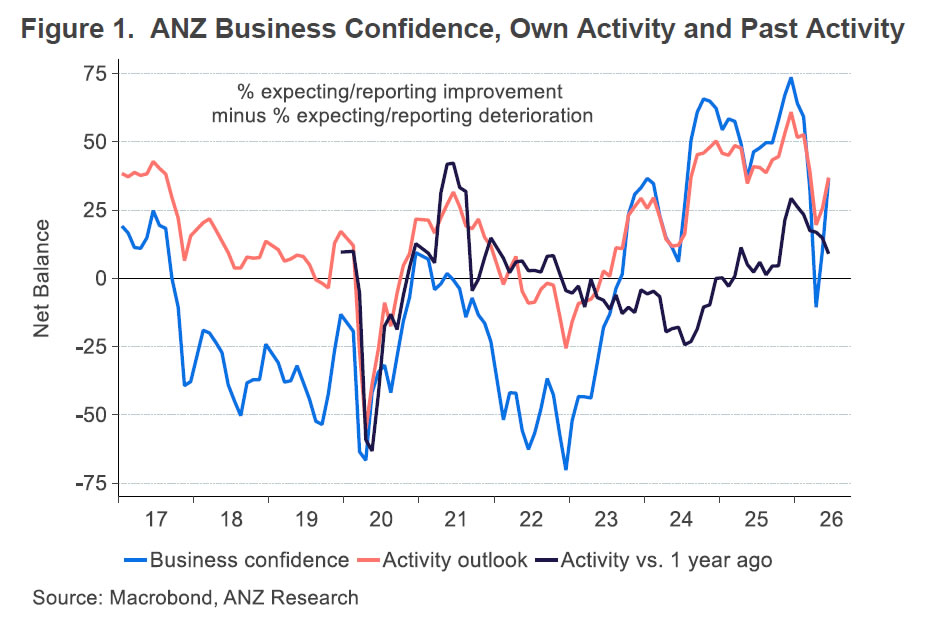
First Impressions: NZ Business Confidence, June 2026 — Inflation Pressures Easing Ahead of RBNZ Interest Rate Review
Business confidence continues to recover as cost pressures ease. This reinforces our expectations for an on-hold decision from the RBNZ next week.
Key Results, June 2026
- Business confidence: 36.6 (Prev: 10.0)
- Expectations for own activity: 36.9 (Prev: 25.6)
- Activity vs same month one year ago: 9.0 (Prev: 14.8)
- Inflation expectations: 3.36% (Prev: 3.63%)
- Pricing intentions: 50.7 (Prev: 56.7)
Activity Expectations Continuing to Recover
The June business outlook survey pointed to a further decline in the proportion of firms reporting an increase in activity from year-earlier levels. However, encouragingly, confidence in the economic outlook has continued to recover in the latest survey, as have businesses expectations for their own trading activity over the coming year. That improvement comes against the backdrop of easing global tensions and a related sharp fall in oil prices.
The survey's activity gauges, including those for trading activity, hiring and investment spending, all remain noticeably below the levels we saw in February before the Middle East conflict. However, they have retraced much of their recent declines. That's consistent with the economy gradually regaining momentum as we enter the second half of the year.
Pricing Pressures Easing…
Importantly, the survey's various inflation gauges have been dropping back. That includes expectations for inflation over the year ahead which fell from 3.63% in May back to 3.36% this month. We also saw a fall in the number of firms who are planning on raising prices. Firms' forecasts for wage growth remained at subdued levels in June.
…Which Will Help to Assuage the RBNZ's Concerns About the Inflation Outlook Ahead of Next Week's Interest Rate Meeting
All of the survey's inflation measures remain higher than the levels we saw prior to the Middle East conflict, which is consistent with the still high level of domestic fuel prices.
However, the easing in these measures over the past couple of months is still important for the RBNZ. At the time of the RBNZ's last policy meeting, several members of the Monetary Policy Committee voted to keep rates on hold and wanted to see if the rise in fuel costs was going to lead to a more widespread and persistent lift in inflation. With oil prices down sharply and gauges of businesses pricing plans dropping back, the RBNZ is likely to be less concerned about a lift in longer term inflation. As a result, we continue to expect the RBNZ will keep the OCR on hold at next week's interest rate review.
As we noted in our recent forecast update, we still expect the OCR will rise over the coming months, but at a gradual data-dependent pace. We expect 25bp hikes in September and December.
RBA Minutes: Board Chose Patience, Not a Policy Pivot
Minutes of the Reserve Bank of Australia's June meeting showed policymakers opted to leave the cash rate unchanged not because the inflation battle has been won, but because they wanted more time to assess how previous tightening and recent oil supply disruptions are feeding through the economy. The Board unanimously kept the cash rate at 4.35%, describing the decision as the best way to balance its inflation and employment objectives amid heightened uncertainty.
The minutes reiterated that inflation remains the central concern. Members observed that "inflation was still materially above the Board's target" and that staff continued to expect "underlying inflation to increase in the June quarter." They also noted that labour and non-labour cost pressures remained widespread, adding that monetary policy "needed to remain restrictive to unwind current excess demand through a period of below-trend growth." While members acknowledged that Australian financial conditions had become "somewhat restrictive," they judged it was still too early to fully assess the cumulative effects of policy tightening since February.
The Board also devoted considerable attention to developments in the Middle East. Although members acknowledged "the emergence of a potential path to resolution of the conflict," they cautioned that commodity supply constraints would take time to unwind even if peace proves durable. As a result, they concluded the conflict still posed "material upside risks for inflation and downside risks for growth," warning that sustained high oil prices could continue to influence firms' pricing decisions and wage-setting behaviour even after fuel prices moderate.
Looking ahead, the minutes left little doubt that the tightening cycle has not necessarily ended. Members agreed there was merit in "using the space provided by the Board's earlier decisions" to assess how the economy adjusts, but they also reaffirmed the Board would "do what it considers necessary to achieve" price stability and full employment, "including increasing the cash rate target if necessary." The minutes therefore reinforce the view that the June pause represented patience rather than a policy pivot, with incoming data likely to determine whether another rate increase becomes necessary in the months ahead.
Bitcoin Looks Vulnerable as Downside Risks Continue to Mount
Key Highlights
- Bitcoin extended losses below $60,000 before it found some support.
- BTC/USD could be following a bearish flag with resistance at $61,500 on the 4-hour chart.
- Ethereum settled well below $1,650 with a bearish angle.
- XRP tested the $1.00 support and shows signs of consolidation.
Bitcoin Price Technical Analysis
Bitcoin price extended losses and traded below $60,000 against the US Dollar. BTC tested the $58,000 zone and recently started a minor recovery wave.
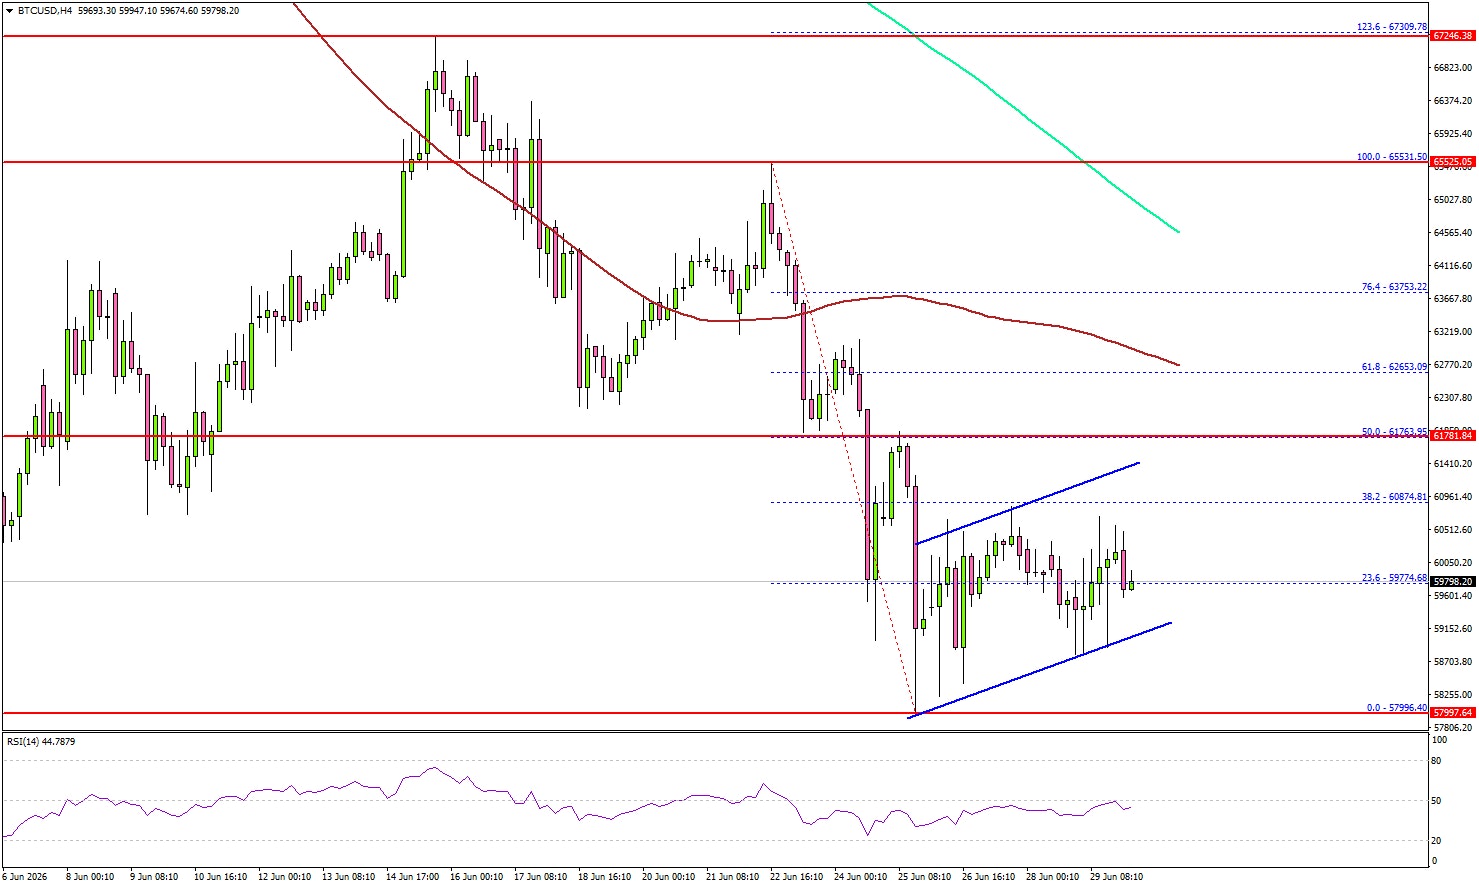
Looking at the 4-hour chart, the price settled well below $62,000, the 100 simple moving average (red, 4-hour), and the 200 simple moving average (green, 4-hour). The price started a minor recovery wave above the 23.6% Fib retracement level of the downward move from the $65,531 swing high to the $57,996 low.
However, the bears might remain active below the $62,000 pivot level. On the upside, an immediate resistance could be $60,850. The first major resistance might be $61,500.
There is also a bearish flag forming with resistance at $61,500. The main resistance sits near $62,000 and the 50% Fib retracement level. A close above $62,000 could send the price toward $62,800. Any more gain might call for a test of $65,000.
If there is a fresh decline, immediate support might be $59,000. The first key support could be $58,200. The main breakdown support could be $58,000. A downside break below $58,000 might start another decline. The next major support might be $56,500, below which BTC could decline toward $55,000.
Looking at Ethereum, the price started a consolidation phase and could face many hurdles near $1,620 and $1,650.
Today’s Key Economic Releases
- US Housing Price Index for April 2026 (MoM) - Forecast +0.1%, versus +0.1% previous.
- Chicago Purchasing Manager’s Index for June 2026 – Forecast 60.0, versus 62.7 previous.
(RBA) Minutes of the Monetary Policy Meeting of the Reserve Bank Board
Sydney – 15 and 16 June 2026
Members present
Michele Bullock (Governor and Chair), Andrew Hauser (Deputy Governor and Deputy Chair), Marnie Baker AM, Renée Fry-McKibbin, Ian Harper AO, Carolyn Hewson AO, Bruce Preston, Iain Ross AO, Jenny Wilkinson PSM
Others present
Sarah Hunter (Assistant Governor, Economic), Christopher Kent (Assistant Governor, Financial Markets)
Anthony Dickman (Secretary), David Norman (Deputy Secretary)
Meredith Beechey Osterholm (Head, Monetary Policy Strategy), David Jacobs (Head, Domestic Markets Department), Michael Plumb (Head, Economic Analysis Department), Michelle Wright (Deputy Head, Communications Department)
Financial conditions
Members observed that financial conditions abroad had eased somewhat since the previous meeting, in response to progress towards resolving the conflict in the Middle East. Expectations for central bank policy rates had generally declined, oil prices had fallen significantly and equity prices had risen in many countries. Members acknowledged the indications of a potential resolution of the conflict but noted the ongoing uncertainty over the final outcome and the implications for energy markets.
Even after the recent easing in financial conditions, policy interest rate expectations across many advanced economies remained higher than before the start of the conflict in the Middle East. Members noted that the European Central Bank and Norges Bank had both raised interest rates to contain the second-round effects of higher oil prices and address broader concerns about above-target inflation. The US Federal Reserve and Bank of England – both of which had been expected by financial market participants before the conflict to have lowered their policy rates by now – had decided to maintain their policy rates. Financial market participants expected both to lift these rates later in 2026. More generally, financial markets continued to expect that many advanced economy central banks would tighten monetary policy before the end of 2026 in response to above-target inflation and concerns about the inflationary effects of the conflict.
Bond yields in many advanced economies, including Australia, had unwound some of their earlier increase since the previous meeting. These falls were in response to both lower oil prices and the flow of economic data. However, yields had risen in the United States and Japan, reflecting stronger economic data. Short-term inflation compensation measures had generally eased but remained higher than before the onset of the conflict in the Middle East. Longer term market expectations for inflation had remained generally stable and consistent with central banks’ targets.
The Australian dollar had depreciated a little since the previous meeting, in line with a decline in yield differentials (particularly against the United States) and a modest fall in commodity prices. The trade-weighted exchange rate nevertheless had remained comparable to its level at the onset of the conflict and broadly consistent with its estimated long-run equilibrium level.
Equity prices had risen in most advanced economies and spreads on corporate bonds had remained tight. These outcomes had been supported by strong earnings expectations, most notably in the United States. In contrast, Australian equity prices had remained flat, as they had been for some time, reflecting only modest upward revisions to the outlook for company earnings. Members noted that this was likely to reflect a range of factors, including limited productivity growth, recent increases in the cash rate target, the expected impact of announced tax changes on bank lending and the more limited participation by Australian companies in the artificial intelligence (AI) boom compared with companies in some other countries.
In China, the household and property sectors both remained weak, which was weighing on household borrowing. The authorities’ economic strategy appeared to be prioritising strategic sectors, including AI, rather than providing additional support to domestic activity more broadly.
Turning to Australia, members noted that financial conditions had tightened since the start of the year following three increases in the cash rate target. However, financial market participants’ expectations for the future path of monetary policy had eased noticeably since May in response to lower global oil prices and weaker-than-expected data for both the labour market and headline inflation in Australia in April.
Members agreed that financial conditions were now probably somewhat restrictive. They discussed updates made by the staff to some models of the neutral rate, noting that these did not materially alter their assessment of financial conditions. The cash rate target sat at around the top of the range of these model estimates, and above the range of market economists’ estimates of the neutral rate. Members observed that estimates of the real neutral rate had risen over preceding years – consistent with a global trend, which probably reflected factors such as increased investment in the energy transition, defence and, more recently, data centres – and were a little higher than when the cash rate target was previously at its current level. Members nevertheless emphasised that assessments of the neutral rate are inherently uncertain and do not provide a direct guide for monetary policy.
Members continued their assessment of the tightness of financial conditions by considering evidence from a broader range of indicators. These generally showed that the tightening in monetary policy was starting to be transmitted to the economy through various channels. Conditions in the established housing market had softened and housing credit growth looked set to slow in the period ahead. This reflected the pass-through of monetary policy tightening and, more recently, tax changes for housing investors announced in the Australian Government budget. Business debt growth had remained relatively strong over prior months, some of which reflected syndicated lending for the construction of data centres.
Banks had passed the higher cash rate through to lending and deposit rates, and scheduled mortgage payments had risen. Compared with household disposable incomes, scheduled mortgage payments were a little lower than the previous episode when the cash rate was at current levels, reflecting the fact that growth in income had outpaced growth in credit in the intervening period. Members discussed how to assess the net impact on the economy of monetary policy easing in 2025 and tightening in 2026, noting the lags in the effect of monetary policy.
Members noted that the cash rate target was widely expected by market participants to remain on hold at the present meeting. Market pricing at the time implied a 50 per cent chance of a further 25 basis points increase in the cash rate by the end of 2026, having priced in about 40 basis points of increase immediately after the May meeting. Some market economists expected the cash rate to be increased again in 2026 because of ongoing inflationary pressures from both domestic and international factors. Others expected monetary policy to remain on hold in 2026 and then to be eased from around mid-2027, given restrictive financial conditions currently, signs of a slowing in aggregate demand and an anticipated decline in inflation.
Economic conditions
Members observed that the latest domestic data for the March quarter had confirmed that capacity pressures remained elevated in that period, albeit at a slightly lower level than previously assessed, and inflation was still above target. Indicators of economic activity since March had been mixed but appeared to show the economy easing broadly as expected.
Members discussed the March quarter national accounts. As expected, GDP had increased by 2.5 per cent over the year to the March quarter. Underlying momentum in household consumption had started to ease before the onset of the conflict in the Middle East, and public demand growth had been weaker than anticipated in the quarter. However, private business investment had been much stronger than expected, largely driven by investment in data centres. Members discussed the broader implications of the strength in investment in data centres, noting that such spending can be difficult to forecast and that in the United States it had repeatedly surprised analysts. Members noted that, while much investment in data centre requires imported components, it also requires some domestic inputs. They discussed the potential for continued strength in such activity to exacerbate capacity pressures and skills shortages in other parts of the economy.
Members noted that the national accounts had revealed further weakness in economy-wide productivity growth. They discussed both the associated measurement challenges and the broader implications for the supply side of the economy. Regarding wages, members noted that growth in the Wage Price Index had been in line with expectations. Measures of average earnings from the national accounts had been a little softer than anticipated, but weak productivity growth meant that growth in unit labour costs remained above its average over the inflation-targeting period.
Members turned to developments in the global economy. The recent announcement of an interim peace agreement between the United States and Iran was a welcome development but this was only the first stage of resolving the conflict in the Middle East. The associated decline in global energy prices had left the oil price futures curve broadly in line with the May baseline forecast assumptions. Members noted that inventory drawdowns and increased supply from elsewhere had continued to buffer the impact of energy supply disruptions in the Middle East on global energy markets. Domestic retail fuel prices had been a little lower than expected, though some of the recent decline would be reversed if the temporary fuel excise reduction expired on 30 June as currently legislated. Members noted that, even if a lasting agreement to end the conflict were reached, it would take some time for global production and distribution of oil and affected commodities to return to more typical levels.
Growth in Australia’s major trading partners had been resilient and broadly as expected, supported by AI-related spending. In China, exports had been resilient but growth in domestic activity had slowed in April. Higher energy prices had pushed headline inflation up in most countries in April. Although the extent of the increase varied, in part because of differing policy responses, inflation was above central bank targets in around two-thirds of countries. Producer prices had generally increased by more than consumer prices, and surveys suggested some margin pressures for firms. Core consumer price inflation in most countries had been little changed but was expected to increase in coming months as cost pressures are passed through.
Returning to the domestic economy, members noted that timely data had been somewhat mixed but broadly consistent with the May baseline forecasts, which incorporated a slowing in demand growth this year.
Underlying CPI inflation in April had been consistent with the staff’s earlier expectation for the June quarter. Within that total, market services, rent and durable goods price inflation were all broadly in line with expectations, groceries inflation was lower, and new dwellings price inflation was considerably higher as firms passed on some of the cost impost of higher oil prices. By contrast, headline inflation had been weaker than expected by market economists, reflecting weakness in international travel prices and a larger-than-expected decline in fuel prices. Business surveys and liaison pointed to elevated and broad-based cost pressures, and there were signs that some firms were passing these on to higher prices of their goods and services. Members noted that short-term inflation expectations had increased in prior months, notwithstanding a small decrease in the weeks preceding the meeting; this increase had been larger than would be expected from their past relationship with inflation and fuel prices. Longer term measures had remained consistent with achieving the inflation target, although unions’ long-term inflation expectations were an exception, having picked up sharply in May, as they had in 2022.
Members discussed the labour market data for April. Some key indicators had been weaker than expected (most notably the unemployment rate and total employment), while others (such as total hours worked and the underemployment rate) pointed to more resilient labour market conditions. Leading indicators, such as job ads, suggested labour demand had been broadly stable. On balance, the staff assessed that labour market conditions were a little weaker than had been expected in May but cautioned against reading too much into monthly data outcomes, which can be volatile. Members also discussed the Fair Work Commission’s announced increase in all modern award wages from 1 July. Although the outcome was moderately higher than had been assumed in the staff’s May forecasts, members noted that the increase applied to the lowest wage earners. Views differed on the extent to which the outcome might indirectly influence other wage negotiations, but members agreed that this would depend in part on the tightness of the labour market and expectations for inflation.
Members concluded their discussion of domestic economic conditions by considering the momentum in activity. Despite consumer sentiment remaining very low, household spending growth had not softened materially; members noted that, historically, the relationship between these two variables was quite weak and typically close to contemporaneous, suggesting that weak consumer sentiment does not necessarily signal future weakness in consumption. Likewise, business confidence had been weak but surveyed business conditions and capacity utilisation had declined only modestly and investment intentions had been revised a little higher. Recent federal and state budgets had not significantly altered the staff’s outlook for public demand. However, members noted that conditions in the housing market had eased by more than expected, reflecting the recent increases in the cash rate, tax changes announced in the Australian Government budget and the broader economic environment.
Considerations for monetary policy
Turning to considerations for the monetary policy decision, members noted that information received since the previous meeting had supported the view that the economy was operating with excess demand and widespread inflationary pressures. Inflation was still materially above the Board’s target and the staff’s expectation remained for underlying inflation to increase in the June quarter. Labour and non-labour cost pressures remained widespread. Consumer and business sentiment remained very weak but members agreed that the overall data on activity implied that economic growth was easing broadly as expected.
Members acknowledged the emergence of a potential path to resolution of the conflict in the Middle East but observed that this was still at an early stage. Global oil prices had eased in prior weeks but remained higher than before the onset of the conflict. Members agreed that even if the resolution proves enduring, global commodity supply constraints would take some time to resolve.
Members judged that Australian financial conditions were now somewhat restrictive, although this remained uncertain. It would take some time to assess the ultimate impact on the economy of the tightening in monetary policy since February but, at this stage, it appeared to be having broadly the expected effect. Housing demand had eased, which also reflected the broader economic environment and recently proposed tax changes.
In light of these observations, members agreed that leaving the cash rate target unchanged at this meeting would best balance the Board’s inflation and employment objectives. Inflation remained materially above the Board’s target, and members noted that the staff’s May forecasts (which were based on available data and conditioned on market expectations for interest rates at that time) envisaged that it would be a further two years before inflation returned sustainably to target. Against that backdrop, members agreed that monetary policy needed to remain restrictive to unwind current excess demand through a period of below-trend growth. While the most recent data and forward-looking indicators suggested somewhat mixed signals about how quickly momentum in economic activity was slowing, members judged the easing in growth to be broadly in line with earlier expectations.
Members agreed that leaving the cash rate target unchanged was appropriate given the ongoing uncertainty related to developments in the Middle East. They noted that, if the emerging path to resolution of the conflict proves enduring, it could reduce the extent to which firms pass on higher costs to consumer prices. However, they acknowledged that, even in that case, it was still likely that underlying inflation would increase to some extent in response to recent fuel supply disruptions.
Taking these considerations together, members judged that there was merit in using the space provided by the Board’s earlier decisions to raise the cash rate target to assess how the economy was adjusting and the impact of disruptions to oil supply.
After deciding to keep the cash rate target unchanged at this meeting, members discussed the main risks that could have a bearing on future decisions.
One set of risks related to developments in the Middle East. Members noted that there were still credible scenarios for the evolution of the conflict that could result in higher inflation and lower activity than in the May baseline forecasts. Members noted the potential for sustained high oil prices to feed through more fully into price- and wage-setting behaviour, even if fuel prices subsequently abate. Moreover, they agreed that it would take considerable time to restore oil supply to its pre-conflict level, even if the current resolution proves enduring, and noted that demand for oil could be buoyed for a time if countries seek to rebuild their inventories. These considerations led members to assess that the Middle East conflict still posed material upside risks for inflation and downside risks for growth.
A second set of risks discussed by members was domestically focused. Members noted the implications of persistently weak productivity growth for the economy’s supply capacity and sustainable growth rate. While members expressed somewhat differing views about the extent of current capacity pressures, they agreed that persistently weaker-than-expected productivity growth could impede progress on returning inflation to target. Members also noted the risks associated with a potentially material weakening in housing markets, including if this were to inhibit growth in consumption.
In finalising its statement, the Board agreed to remain attentive to the data and the evolving assessment of the outlook and risks when making its decisions. The Board will remain focused on its mandate to deliver price stability and full employment and will do what it considers necessary to achieve that outcome, including increasing the cash rate target if necessary.
The decision
The Board decided unanimously to leave the cash rate target unchanged at 4.35 per cent.
Framework for additional monetary policy tools
Following discussion and in-principle approval of the framework for additional monetary policy tools at the previous meeting, and subsequent feedback from the RBA’s Governance Board, the Board approved the final version of the framework. Members noted that the Governance Board had viewed the governance and risk elements of the framework as appropriate, while emphasising that the framework and any future advice to use specific tools should clearly identify the materiality of the use of that tool’s potential impact on the RBA’s balance sheet.
Members approved the framework and agreed to it being published alongside a speech by the Assistant Governor (Financial Markets) at the end of June. They noted that future work would focus on further developing aspects related to risk management and operational readiness.
China PMIs Edge Higher as Export Demand Offsets Weak Domestic Recovery
China's manufacturing activity expanded at a slightly faster pace in June, with official data pointing to a modest improvement in both factory and services sectors. The NBS PMI Manufacturing rose from 50.0 to 50.3, slightly above expectations of 50.2, while the Non-Manufacturing PMI edged up from 50.1 to 50.2, beating forecasts of 49.9. The Composite PMI also improved from 50.5 to 50.6, indicating the economy continued to expand at a moderate pace.
The improvement in manufacturing was supported primarily by resilient export demand, as overseas buyers accelerated orders amid uncertainty surrounding the Middle East conflict and the earlier surge in oil prices. However, that tailwind may prove temporary. With the US and Iran reaching a peace agreement and oil prices retreating to pre-conflict levels, the urgency to front-load imports is likely to diminish, potentially reducing external support for Chinese manufacturers in the coming months.
Separate industrial profit data released over the weekend underscored the uneven nature of China's recovery. Profits continued to grow strongly in upstream industries, as well as sectors linked to artificial intelligence and renewable energy, while downstream manufacturers remained under pressure from subdued domestic demand. Together, the latest data suggest exports continue to underpin growth, but a broader and more durable recovery will likely require a stronger improvement in household consumption and domestic spending.
| Indicator | Previous | Latest | Consensus |
|---|---|---|---|
| NBS PMI Manufacturing | 50.0 | 50.3 | 50.2 |
| NBS PMI Non-Manufacturing | 50.1 | 50.2 | 49.9 |
| NBS PMI Composite | 50.5 | 50.6 | — |
NZ ANZ Business Confidence Jumps to 36.6 While Inflation Indicators Cool
New Zealand business confidence strengthened sharply in June, while inflation indicators moderated, offering encouraging signs that economic activity is recovering without a renewed acceleration in price pressures. ANZ Business Confidence jumped from 10.0 to 36.6, while firms' Own Activity Outlook rose from 25.6 to 36.9, pointing to growing optimism about the near-term outlook.
The improvement was accompanied by softer inflation measures across the survey. Inflation expectations eased from 3.63% to 3.36%, firms' cost expectations fell from 90 to 85, and pricing intentions declined from 56.7 to 50.7, their lowest level since November.
ANZ noted that the pickup in activity was already evident early in the month, before oil prices collapsed, suggesting the recovery reflects improving underlying business conditions rather than a temporary boost from cheaper energy. Likewise, the moderation in inflation indicators was already underway before the sharp fall in oil prices gathered pace.
The survey presents a constructive backdrop ahead of next week's Reserve Bank of New Zealand policy decision. While ANZ continues to expect a 25 basis point rate hike, it believes policymakers are likely to proceed cautiously thereafter as they assess both the economy's ability to regain momentum and the persistence of inflation following the earlier oil price shock.
| Indicator | Previous | Latest |
|---|---|---|
| ANZ Business Confidence | 10.0 | 36.6 |
| Own Activity Outlook | 25.6 | 36.9 |
| Inflation Expectations | 3.63% | 3.36% |
| Cost Expectations | 90 | 85 |
| Pricing Intentions | 56.7 | 50.7 |
Full ANZ business confidence release here.
Japan Industrial Output Rises Again as Labor Market Stays Tight
Japan's industrial production rose 0.5% mom in May, slightly below expectations of 0.6% mom, according to preliminary data released by the Ministry of Economy, Trade and Industry. The seasonally adjusted production index rose to 103.0 against the 2020 base of 100, extending the recovery in manufacturing activity despite the modest downside surprise.
Production gains were led by transport equipment, which increased 4.6% mom, and inorganic and organic chemicals, up 3.7% mom. Looking ahead, manufacturers remain optimistic, forecasting output to rise 3.7% in June before leveling off in July. The outlook suggests factories expect production to remain supported despite lingering uncertainty over global demand and trade conditions.
Separate labor market data showed the unemployment rate holding steady at 2.5% in May, while the job availability ratio eased slightly from 1.18 to 1.17, indicating there were still 117 job openings for every 100 job seekers.
| Indicator | Previous | Latest | Consensus |
|---|---|---|---|
| Industrial Production (MoM) | 0.5% | 0.5% | 0.6% |
| Manufacturers' Output Forecast (June) | — | +3.7% | — |
| Manufacturers' Output Forecast (July) | — | 0.0% | — |
| Transport Equipment Output (MoM) | — | +4.6% | — |
| Inorganic & Organic Chemicals Output (MoM) | — | +3.7% | — |
| Unemployment Rate | 2.5% | 2.5% | 2.5% |
| Job Availability Ratio | 1.18 | 1.17 | — |
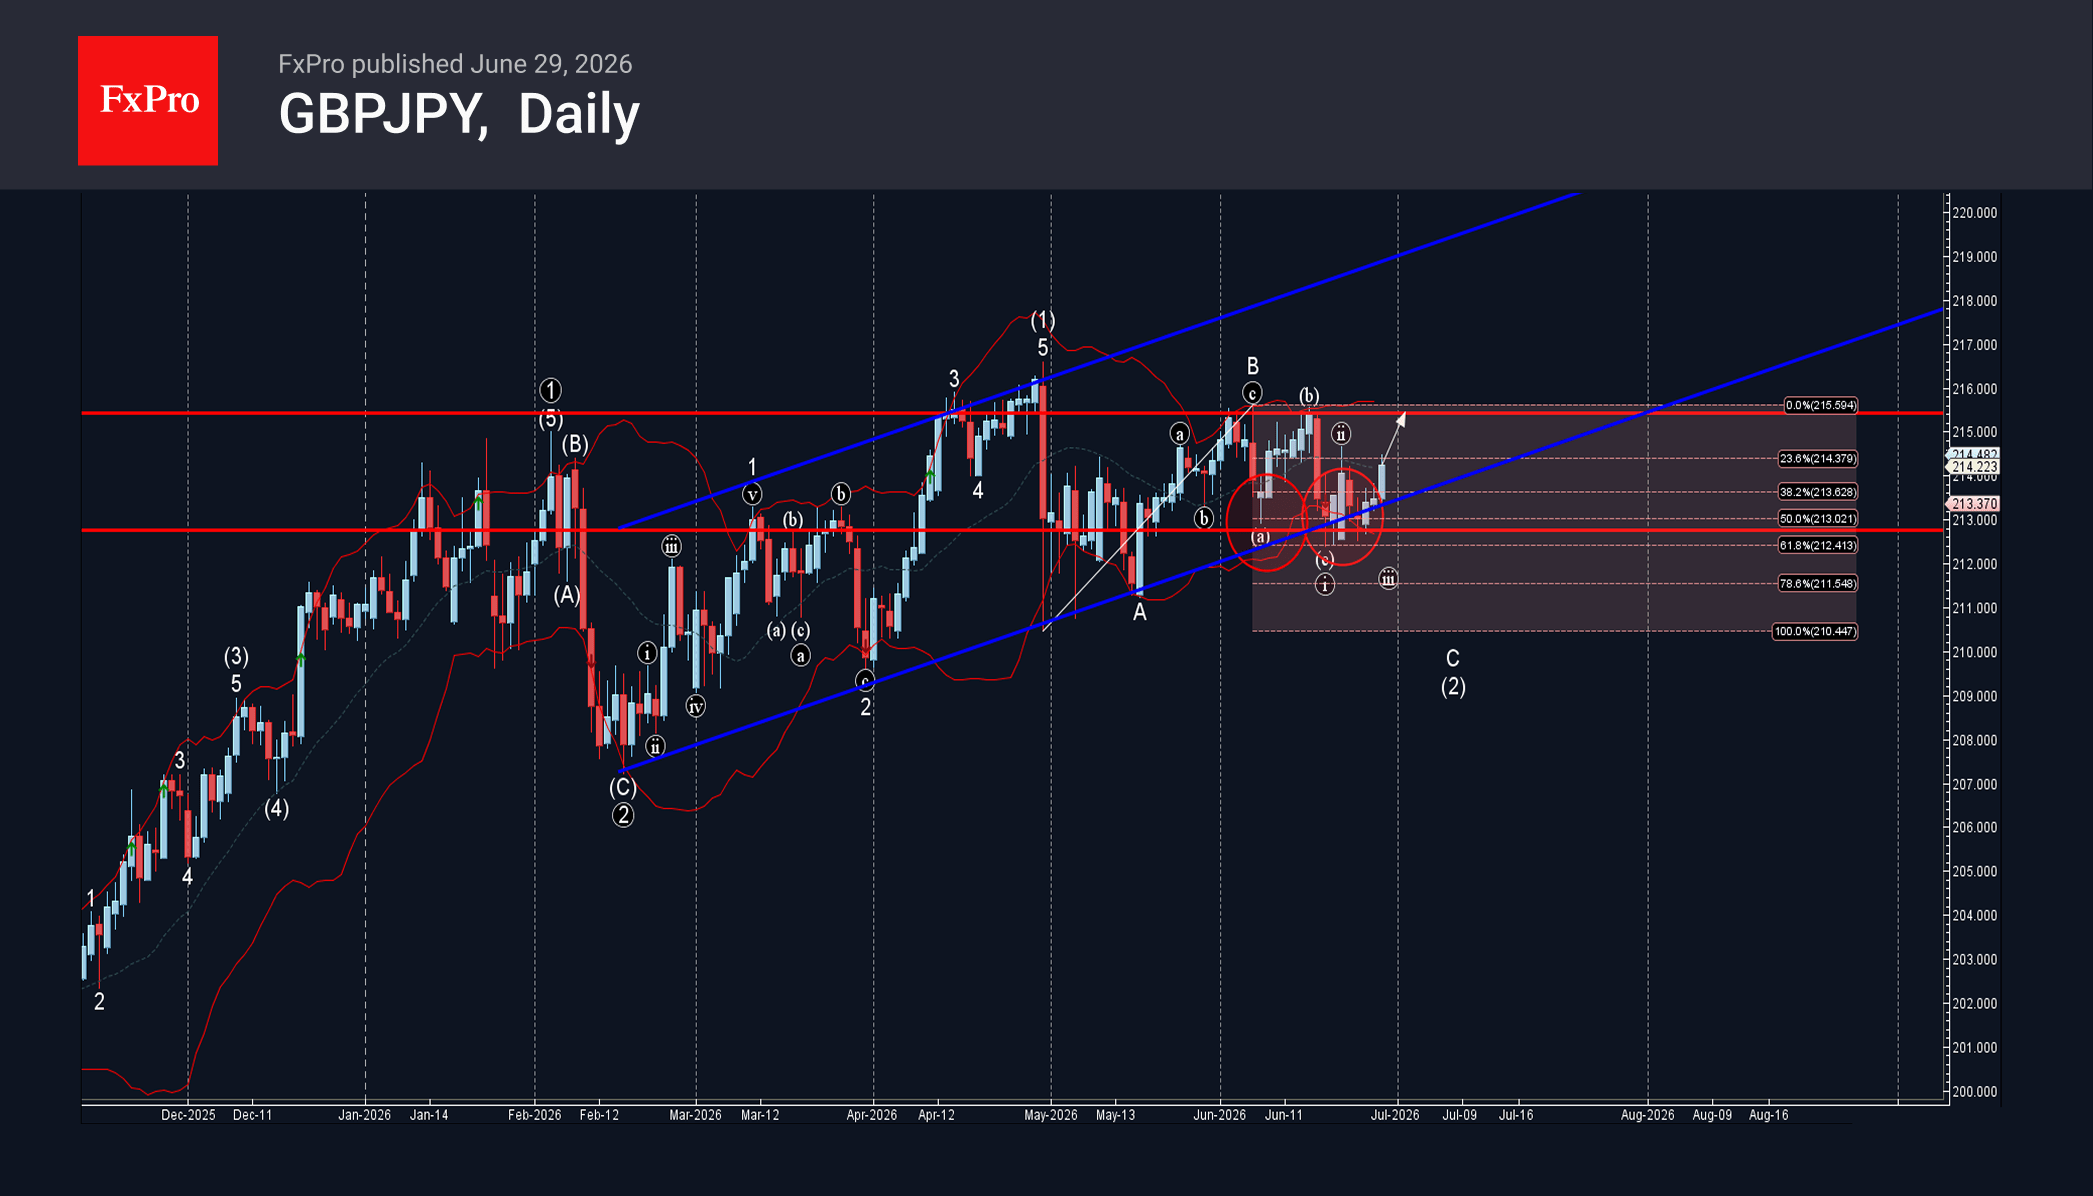
GBPJPY Wave Analysis
GBPJPY: ⬆️ Buy
– GBPJPY reversed from support area
– Likely to rise to resistance level 215.40
GBPJPY currency pair earlier reversed from the support area between the support level 213.00 (which has been reversing the price from the middle of May), 61.8% Fibonacci correction of the upward impulse from April and the support trendline of the daily up channel from February.
The upward reversal from this support area continues the clear uptrend that can be seen on the daily GBPJPY charts.
Given the continuation of the widespread yen sales, GBPJPY currency pair can be expected to rise to the next resistance level 215.40 (that stopped earlier waves B and b).
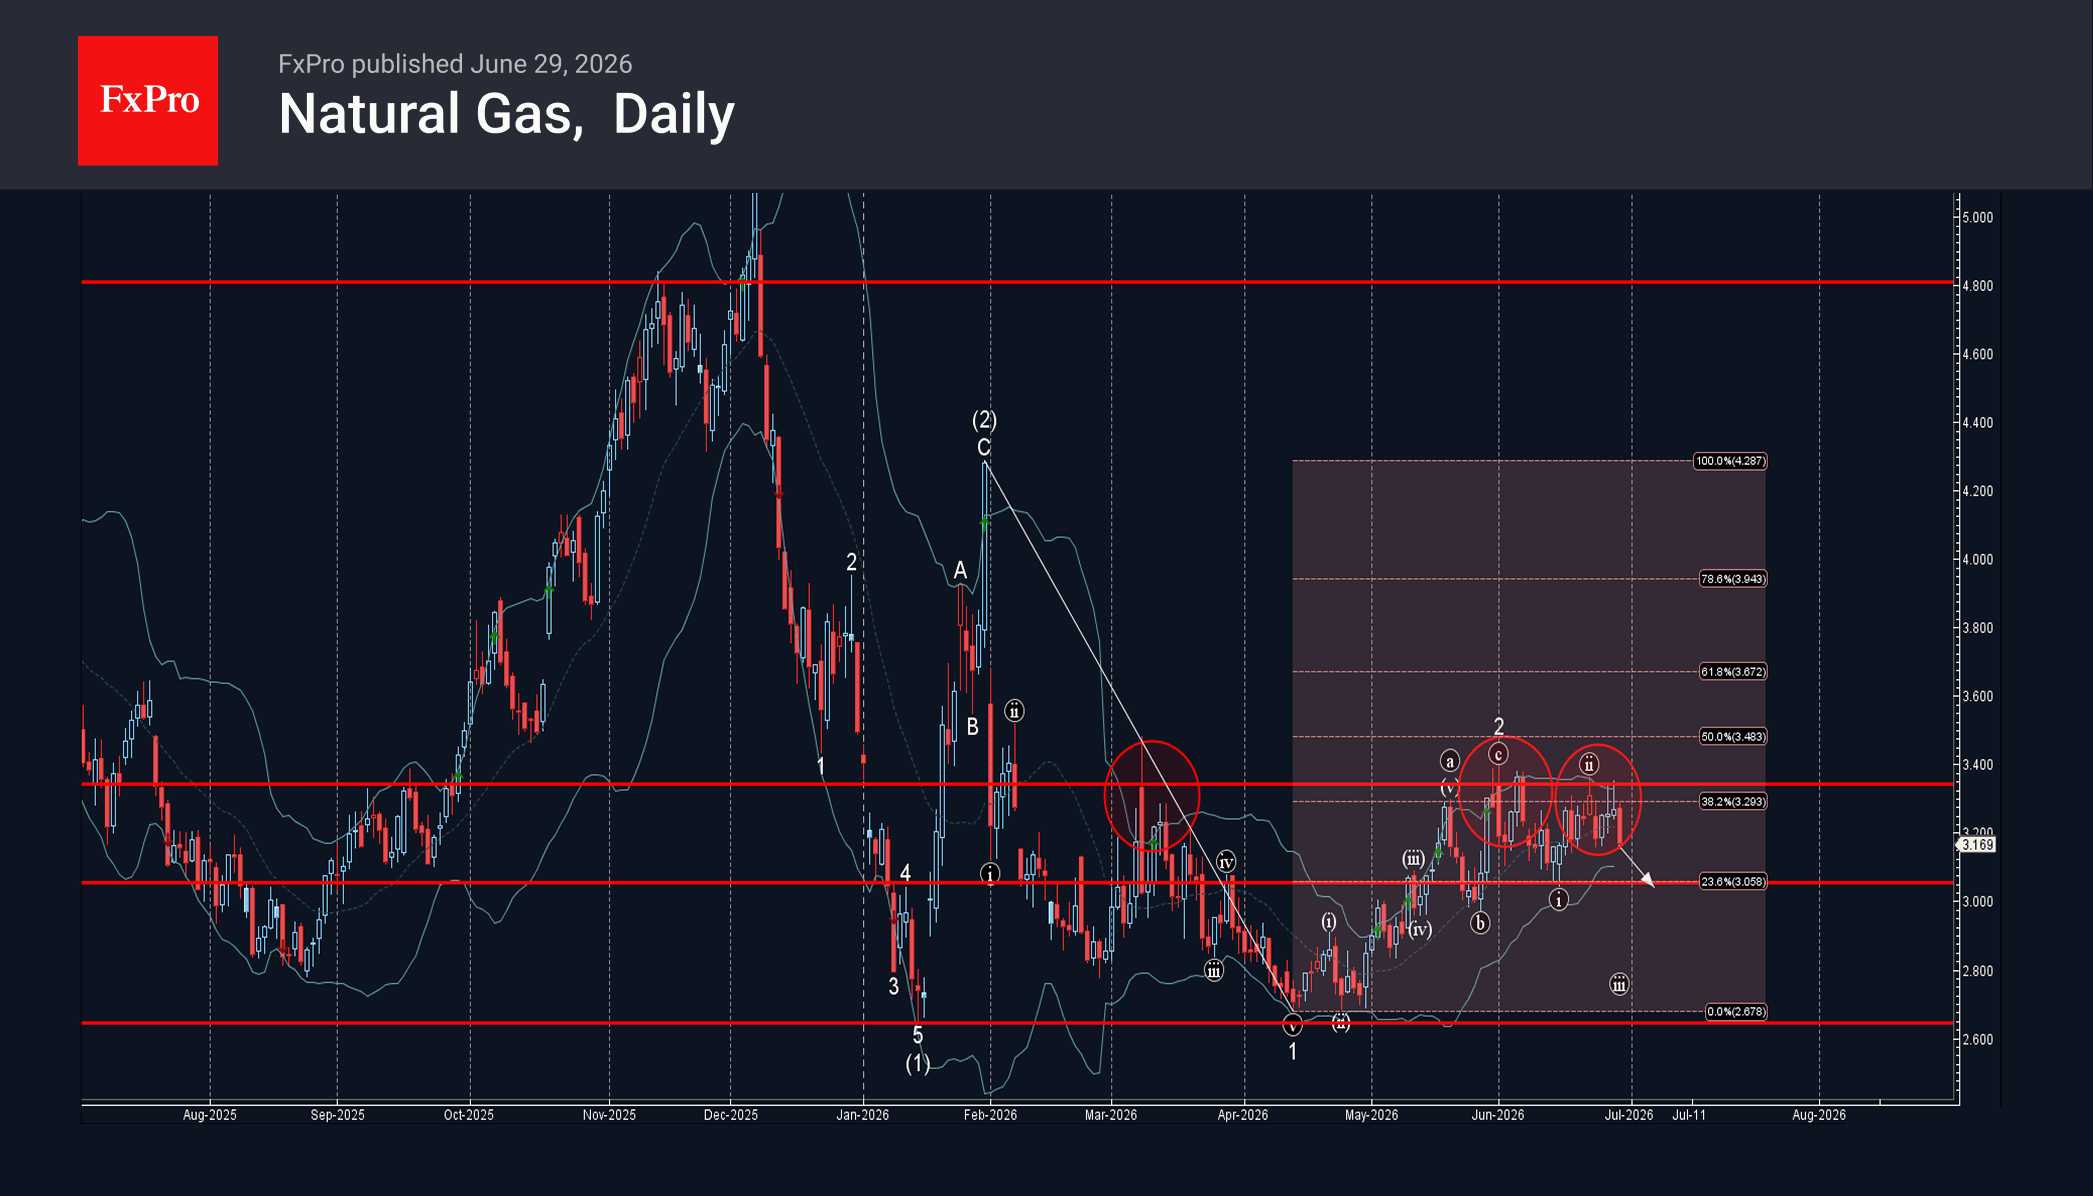
Natural Gas Wave Analysis
Natural Gas: ⬇️ Sell
– Natural Gas reversed from resistance zone
– Likely to fall to support level 3.055
Natural Gas recently reversed from the resistance zone between the pivotal resistance level 3.34 (which has been reversing the price from March), 38.2% Fibonacci correction of the downward impulse from January and the upper daily Bollinger Band.
The downward reversal from this resistance zone is likely to form the daily Japanese candlesticks reversal pattern Evening Star.
Given the clear daily downtrend, Natural Gas can be expected to fall to the next support level 3.055 (low of the previous minor impulse wave i).