Sample Category Title
EUR/JPY Daily Outlook
Daily Pivots: (S1) 173.17; (P) 173.80; (R1) 174.20; More...
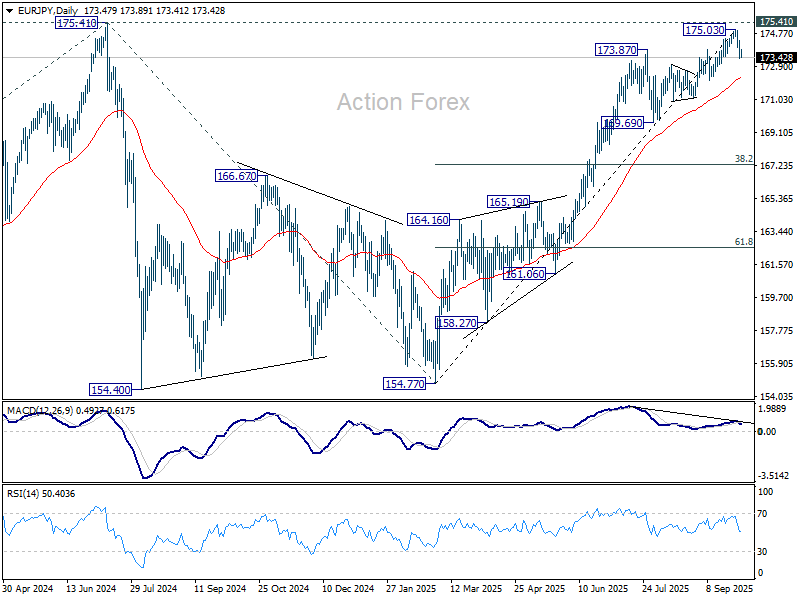
Intraday bias in EUR/JPY stays on the downside for the moment. Fall from 175.03 short term bottom is in progress for 55 D EMA (now at 172.24). Sustained break there will argue that whole five-wave rally from 154.77 has also completed. On the upside, above 174.39 will turn bias neutral first. But risk will stay on the downside as long as 175.03 resistance holds, in case of recovery.
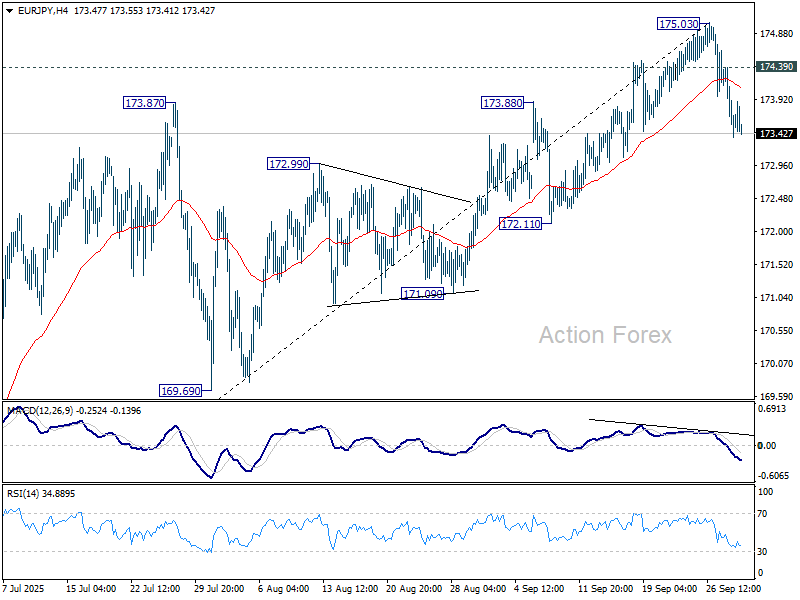
In the bigger picture, current rally from 154.77 is still tentatively seen as resuming the larger up trend. Firm break of 175.41 (2024 high) will confirm and target 61.8% projection of 124.37 (2022 low) to 175.41 from 154.77 (2025 low) at 186.31. However, sustained break of 55 D EMA will delay this bullish case, bring deeper pullback to 169.69 support first.
Yen Stays Firm on Tankan Resilience, Broader Markets Subdued
Trading was relatively subdued in Asia today, with China and Hong Kong closed for holidays and little reaction seen across the rest of the region. Equity markets were mixed, reflecting a cautious tone after Wall Street managed to end slightly higher overnight despite a fresh government shutdown in the US.
Gold edged to another record high but with far less momentum than in recent sessions. The lack of follow-through reflects both subdued regional liquidity and some restraint among investors, who are weighing the potential fallout of the US fiscal standoff.
The US government formally shut down much of its operations on Wednesday after President Donald Trump and Congressional leaders failed to agree on a short-term funding deal through November 21. This marks the 15th shutdown since 1981, though markets typically treat such events as temporary and relatively immaterial.
This episode, however, carries additional risk. Trump suggested his administration could use the shutdown to push broader policy actions, including cuts to government benefits for “large numbers of people.” That raises the possibility of a mini-labor market shock, which markets cannot entirely dismiss.
Currency markets were livelier, with Yen leading gains for the week. Today’s Tankan survey signaled resilience in large manufacturers despite tariff headwinds, lending credibility to speculation that the BoJ will resume rate hikes later this year.
Aussie was the next strongest, though it is consolidating after sharp gains earlier this week. Reports around China’s state-run iron ore buyer CMRG briefly unsettled markets, with Bloomberg suggesting it had instructed steelmakers to halt new purchases from BHP. But Mysteel disputed the claims, calling the report “not true,” leaving traders uncertain.
At the bottom, Dollar is currently the weakest performer, though still above last week’s lows. Loonie was the next weakest, while European majors and the Kiwi held mid-pack.
In Asia, at the time of writing, Nikkei is down -0.92%. Hong Kong and China are on holiday. Singapore Strait Times is up 0.63%. Japan 10-year JGB yield is down -0.003 at 1.648. Overnight, DOW rose 0.18%. S&P 500 rose 0.41%. NASDAQ rose 0.30%. 10-year yield rose 0.007 to 4.418.
Japan's Tankan shows resilience, supports BoJ tightening outlook
Japan’s Q3 Tankan survey showed large manufacturers growing more confident, with the index rising from 13 to 14, in line with expectations and the highest since Q4 2024. While the manufacturing outlook held steady at 12, suggesting some softening ahead, sentiment remains resilient despite trade headwinds.
Non-manufacturing confidence also stayed firm, with the index unchanged at 34, beating forecasts, and the outlook improving to 28 from 27.
Large firms signaled robust investment plans, projecting a 12.5% increase in capital expenditure for the fiscal year to March 2026, up from June’s forecast of 11.5%.
The results suggest Japan’s economy is weathering tariff pressures and steady domestic demand continues to support activity. For the Bank of Japan, the data bolster expectations that further tightening is coming — the debate is less about if and more about when policymakers will move.
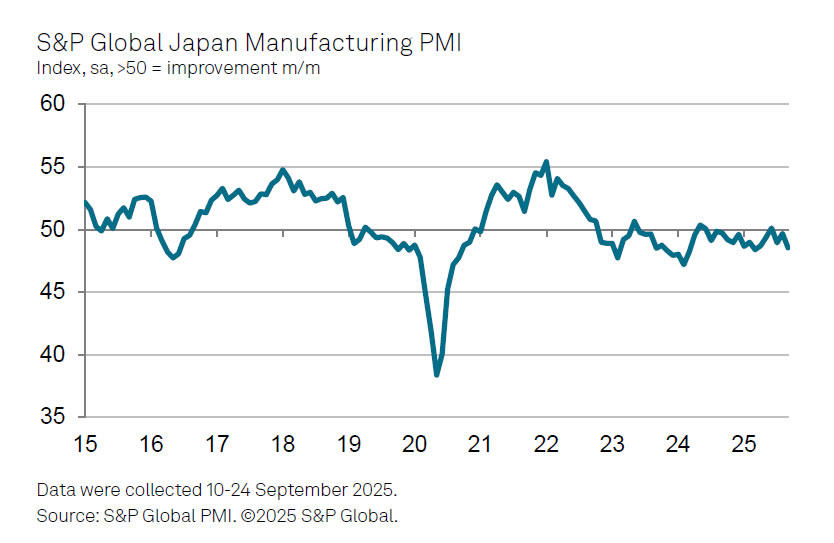
Japan PMI manufacturing finalized at 48.5, weak demand from China and US
Japan’s manufacturing sector contracted further in September, with the PMI finalized at 48.5, down from August’s 49.7. S&P Global’s Annabel Fiddes said the sector ended Q3 “on a weaker note,” as output and new orders declined at a faster pace, driven by softer demand across key markets such as China and the drag from US tariffs.
Weaker demand weighed on business confidence, leading firms to scale back activity. Employment expanded at the slowest pace since February, while purchasing activity dropped at the second-steepest rate since early 2024. The cautious stance underscores concern that the sector may “struggle to see much growth in the near term.”
Price dynamics offered some relief, with cost pressures “less pronounced” than earlier in the year. Still, selling prices rose at a "historically strong pace" as firms sought to protect margins.
EUR/JPY Daily Outlook
Daily Pivots: (S1) 173.17; (P) 173.80; (R1) 174.20; More...
Intraday bias in EUR/JPY stays on the downside for the moment. Fall from 175.03 short term bottom is in progress for 55 D EMA (now at 172.24). Sustained break there will argue that whole five-wave rally from 154.77 has also completed. On the upside, above 174.39 will turn bias neutral first. But risk will stay on the downside as long as 175.03 resistance holds, in case of recovery.
In the bigger picture, current rally from 154.77 is still tentatively seen as resuming the larger up trend. Firm break of 175.41 (2024 high) will confirm and target 61.8% projection of 124.37 (2022 low) to 175.41 from 154.77 (2025 low) at 186.31. However, sustained break of 55 D EMA will delay this bullish case, bring deeper pullback to 169.69 support first.
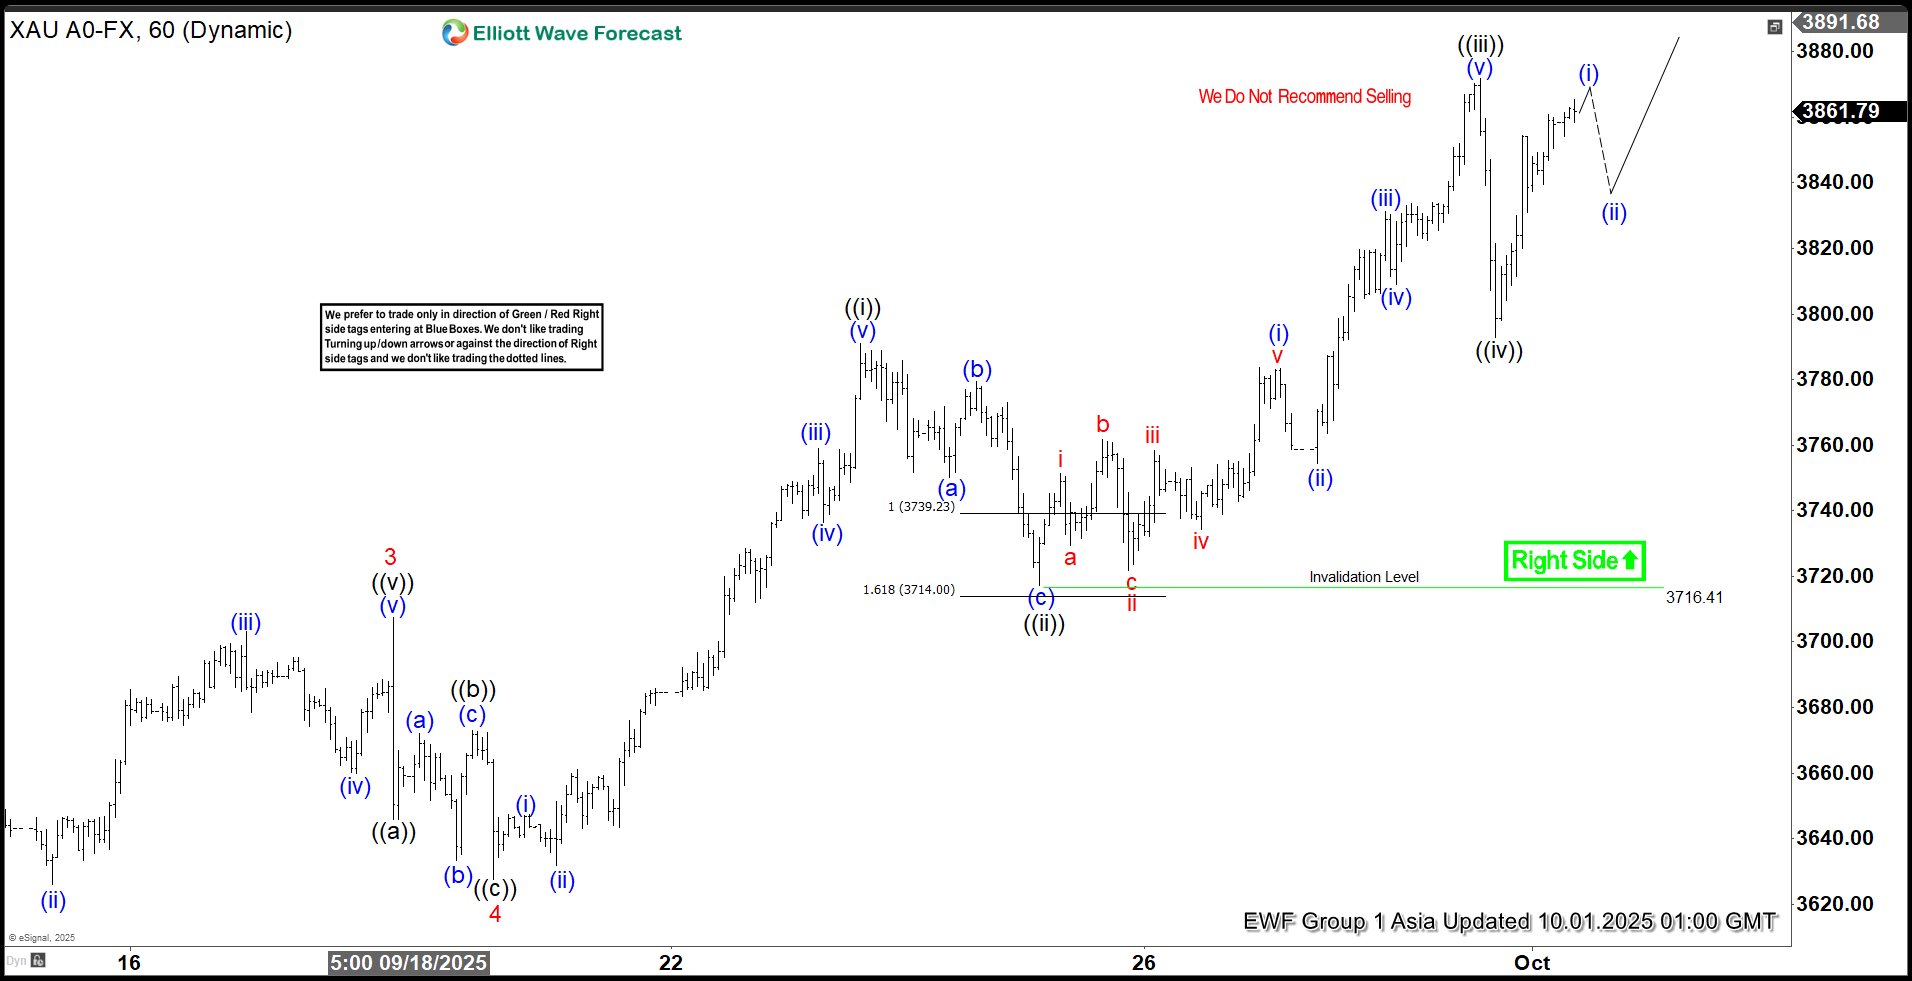
Gold (XAUUSD) Soars to All-Time Highs: Elliott Wave Outlook and Next Target
The short-term Elliott Wave analysis for Gold (XAUUSD) indicates that the cycle starting from the September 18, 2025 low is unfolding as a five-wave impulse. From that low, wave (i) advanced to $3647.32, followed by a corrective wave (ii) that concluded at $3631.94. Gold then surged in wave (iii) to $3759.16, with a subsequent dip in wave (iv) ending at $3736.45. The final leg, wave (v), peaked at $3791.08, completing wave ((i)) on a higher degree.
A corrective pullback in wave ((ii)) reached $3716.41, unfolding as a zigzag Elliott Wave structure. From the wave ((i)) high, wave (a) declined to $3750.29, wave (b) rallied to $3779.41, and wave (c) dropped to $3716.41, finalizing wave ((ii)). Gold has since resumed its upward trajectory in wave ((iii)), reaching $3871.73, with a minor pullback in wave ((iv)) concluding at $3792.88. As long as the pivot at $3716.41 remains intact, expect Gold to continue its ascent.
Gold (XAUUSD) – 60 Minute Elliott Wave Technical Chart:
XAUUSD – Elliott Wave Technical Video:
https://www.youtube.com/watch?v=wKdzGnoMUAE
GBP/USD Faces Hurdles – Is Market Preparing For A Fresh Decline?
Key Highlights
- GBP/USD started a recovery wave above 1.3350 and 1.3400.
- A major bearish trend line is forming with resistance near 1.3475 on the 4-hour chart.
- EUR/USD is struggling to clear the 1.1750 and 1.1780 resistance levels.
- Gold extended gains to a new record high above $3,870.
GBP/USD Technical Analysis
The British Pound found support near 1.3320 and recovered versus the US Dollar. GBP/USD climbed above the 1.3350 and 1.3400 resistance levels.
Looking at the 4-hour chart, the pair managed to recover above the 23.6% Fib retracement level of the downward move from the 1.3726 swing high to the 1.3323 low. However, the pair faces many hurdles on the upside.
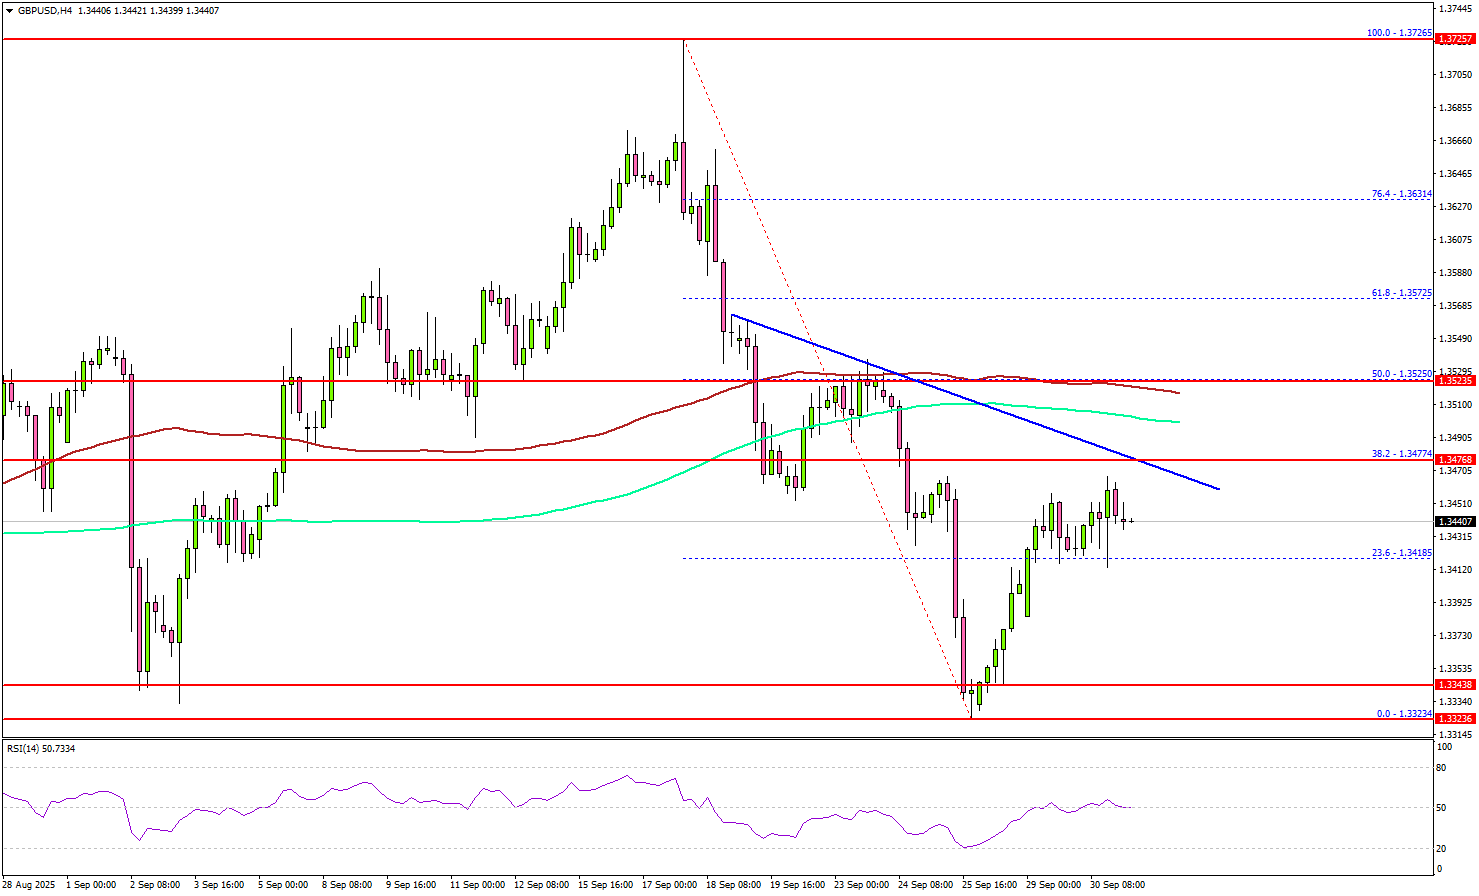
Immediate resistance could be 1.3470. There is also a major bearish trend line forming with resistance near 1.3475 on the same chart. A clear move above the trend line could send the pair toward the 1.3525 resistance.
The 100 simple moving average (red, 4-hour) and the 200 simple moving average (green, 4-hour) are near 1.3520 to act as a barrier along with the 50% Fib retracement level of the downward move from the 1.3726 swing high to the 1.3323 low.
A close above 1.3525 could open the doors for a fresh increase. If not, GBP/USD could decline again. On the downside, there is key support at 1.3400.
The next area of interest might be 1.3350. The main support could be 1.3320. Any more losses might increase selling pressure and send the pair toward 1.3250.
Looking at EUR/USD, the pair attempted to recover but the bears are still active below the 1.1800 pivot level.
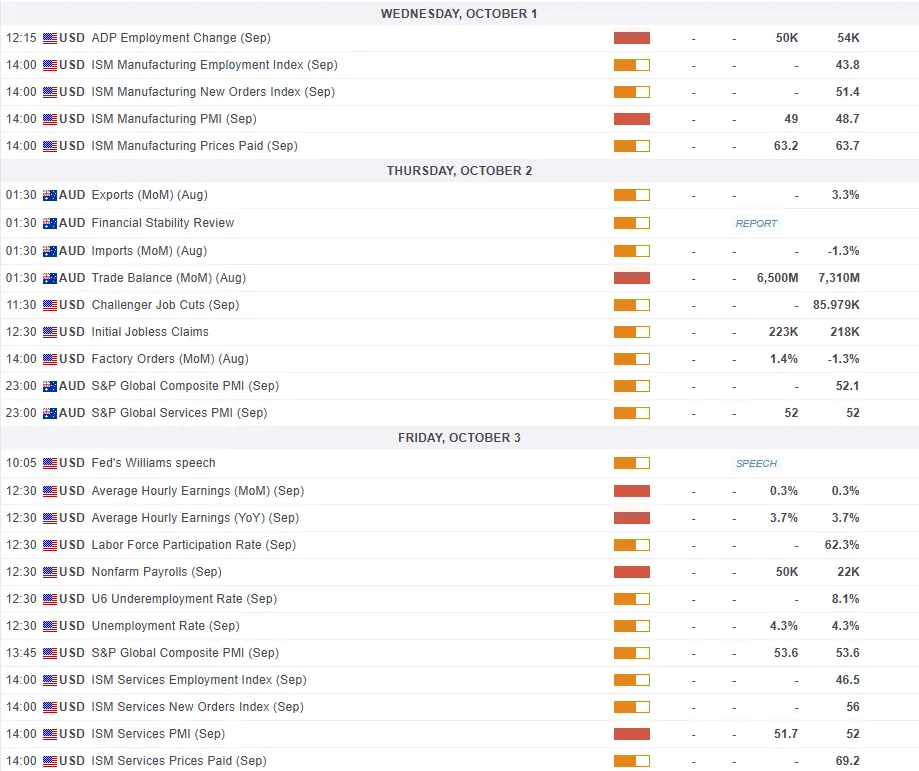
Upcoming Key Economic Events:
- Euro Zone Manufacturing PMI for Sep 2025 – Forecast 49.5, versus 49.5 previous.
- UK Manufacturing PMI for Sep 2025 – Forecast 46.2, versus 46.2 previous.
- US ISM Manufacturing Index for Sep 2025 – Forecast 49.0, versus 48.7 previous.
Japan PMI manufacturing finalized at 48.5, weak demand from China and US
Japan’s manufacturing sector contracted further in September, with the PMI finalized at 48.5, down from August’s 49.7. S&P Global’s Annabel Fiddes said the sector ended Q3 “on a weaker note,” as output and new orders declined at a faster pace, driven by softer demand across key markets such as China and the drag from US tariffs.
Weaker demand weighed on business confidence, leading firms to scale back activity. Employment expanded at the slowest pace since February, while purchasing activity dropped at the second-steepest rate since early 2024. The cautious stance underscores concern that the sector may “struggle to see much growth in the near term.”
Price dynamics offered some relief, with cost pressures “less pronounced” than earlier in the year. Still, selling prices rose at a "historically strong pace" as firms sought to protect margins.
Japan’s Tankan shows resilience, supports BoJ tightening outlook
Japan’s Q3 Tankan survey showed large manufacturers growing more confident, with the index rising from 13 to 14, in line with expectations and the highest since Q4 2024. While the manufacturing outlook held steady at 12, suggesting some softening ahead, sentiment remains resilient despite trade headwinds.
Non-manufacturing confidence also stayed firm, with the index unchanged at 34, beating forecasts, and the outlook improving to 28 from 27.
Large firms signaled robust investment plans, projecting a 12.5% increase in capital expenditure for the fiscal year to March 2026, up from June’s forecast of 11.5%.
The results suggest Japan’s economy is weathering tariff pressures and steady domestic demand continues to support activity. For the Bank of Japan, the data bolster expectations that further tightening is coming — the debate is less about if and more about when policymakers will move.
AUD/USD Forecast: Are Fresh Highs Incoming After RBA Rate Hold?
AUD/USD has risen 0.6% from its Tuesday low of 0.6572 as the US Dollar continued its slide. The Dollar struggle is partly linked to a potential US Government shutdown with Congress needing to agree to temporary funding before 04h00 GMT on Wednesday.
RBA Rate Hold Boosts Aussie Dollar
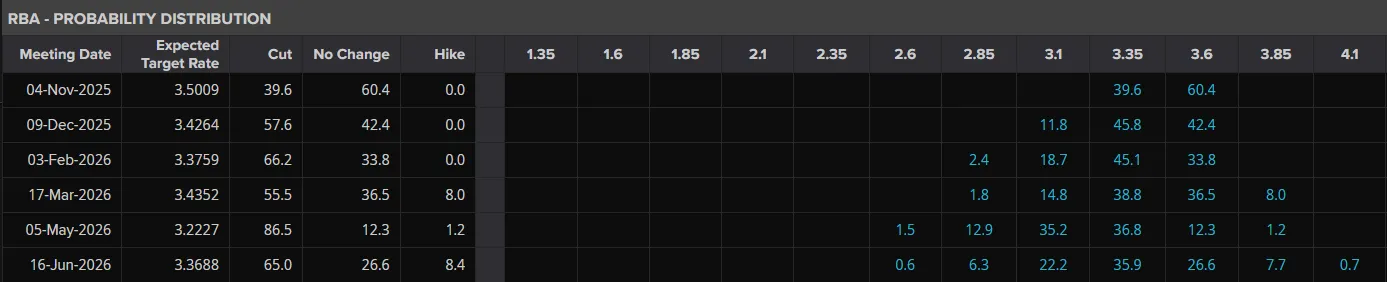
The Reserve Bank of Australia (RBA) decided to keep its main interest rate, known as the cash rate, unchanged at 3.6%. This decision was expected by the markets and indicates a more cautious approach by the central bank.
This careful stance is due to concerns that overall inflation is starting to creep up toward the top of the RBA's target range of 2% to 3%. Because of this decision, the chances of the RBA cutting rates at its next meeting in November are now much lower, which is helping to keep the Australian dollar strong.
According to LSEG data, markets are now pricing in a 60% probability of a rate hold from the RBA at the November meeting.
Source: LSEG
The recent rise in annual CPI inflation to 3% is causing uncertainty about whether it is just a temporary spike or a sign of deeper, lasting inflation problems.
Specifically, prices for housing-related items, like rent and new homes, showed renewed strength, which might suggest the housing market is reacting to the RBA's earlier rate cuts.
Furthermore, the sharp increase in prices for services, such as holidays, travel, and insurance, points to a rebound in consumer spending.
As things stand, the RBA would like to see inflation pushing lower toward the 2.5% mark and sustainably so. If this happens, there is a chance that a rate cut in November could yet materialize.
In the interim though, the Aussie Dollar should get a boost from the RBA decision and rhetoric.
US Data and Government Shutdown Now in Focus
The rest of the week will see attention shift to the US Dollar and its reaction to a potential US Government shutdown. A shutdown could lead to the NFP data release being delayed and that could bring about some form of volatility.
If temporary funding is agreed, then attention will immediately shift to NFP and jobs data from the US. A weaker NFP print could aid the AUD/USD to rise further and test the YTD high.
For all market-moving economic releases and events, see the MarketPulse Economic Calendar. (click to enlarge)
Technical Analysis - AUD/USD
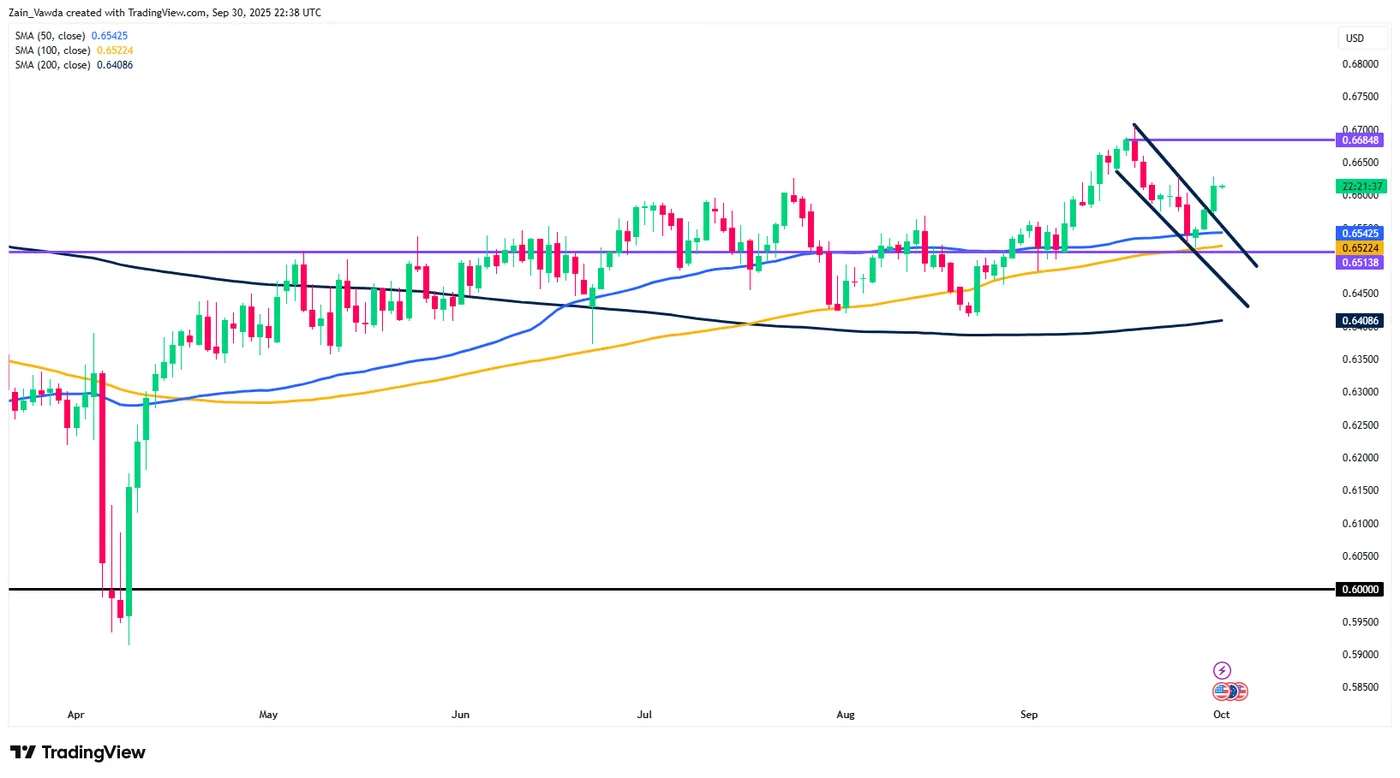
From a technical point of view, AUD/USD is on a three day winning streak after bouncing off support at the 100-day MA.
Structure has been broken with Tuesday's daily candle closing above the recent swing high at 0.6600.
Further strengthening the case for further upside, is the bull flag breakout which occurred on Tuesday as well.
Immediate resistance rests at 0.6684 before the 0.6750 and 0.7000 psychological level comes into focus.
If AUD/USD pushes lower from here, immediate support rests at 0.6542, 0.6522 and 0.6500. A break below 0.6500 could open up a retest of the 200-day MA, which rests at the 0.6408 handle.
AUD/USD Daily Chart, September 30, 2025
Source: TradingView.com
Japanese Yen Could Be One of the Best Performers for the End of the Year
The Japanese yen is stepping into the FX spotlight, battling the Australian dollar for top weekly performer — with the AUD lifted by the RBA’s hawkish pause and firm domestic data.
A rare sight in 2025, the yen is beginning to dominate broader currency performance, as fundamentals start to assemble in its favor.
Political momentum is shifting, with LDP contenders Takaichi and Koizumi pulling ahead in Friday’s LDP party leadership race and hinting at a possible renegotiation of Japan’s trade deal with the US.
Both stances, seen as less supportive of Abenomics and Ishibanomics’ era of ultra-low rates, fuel growing speculation that BoJ hikes may be closer than expected.
Economic data has been mixed for Japan — stronger GDP, firm retail sales and low unemployment point, even as some sectors still show weakness — inflation momentum building also gives some reasons for the BoJ to move.
Recent remarks from Noguchi and other officials underline that policy has entered a phase demanding “careful assessment,” as hawks and doves grow more divided.
With US rate differentials projected to narrow on the back of FOMC cuts, and the BoJ inching toward normalization, the yen’s case for strength into year-end looks interesting.
Let's explore USDJPY multi-timeframe charts (and a few other yen crosses) to see where the it stands.
USDJPY multi-timeframe analysis
Daily Chart
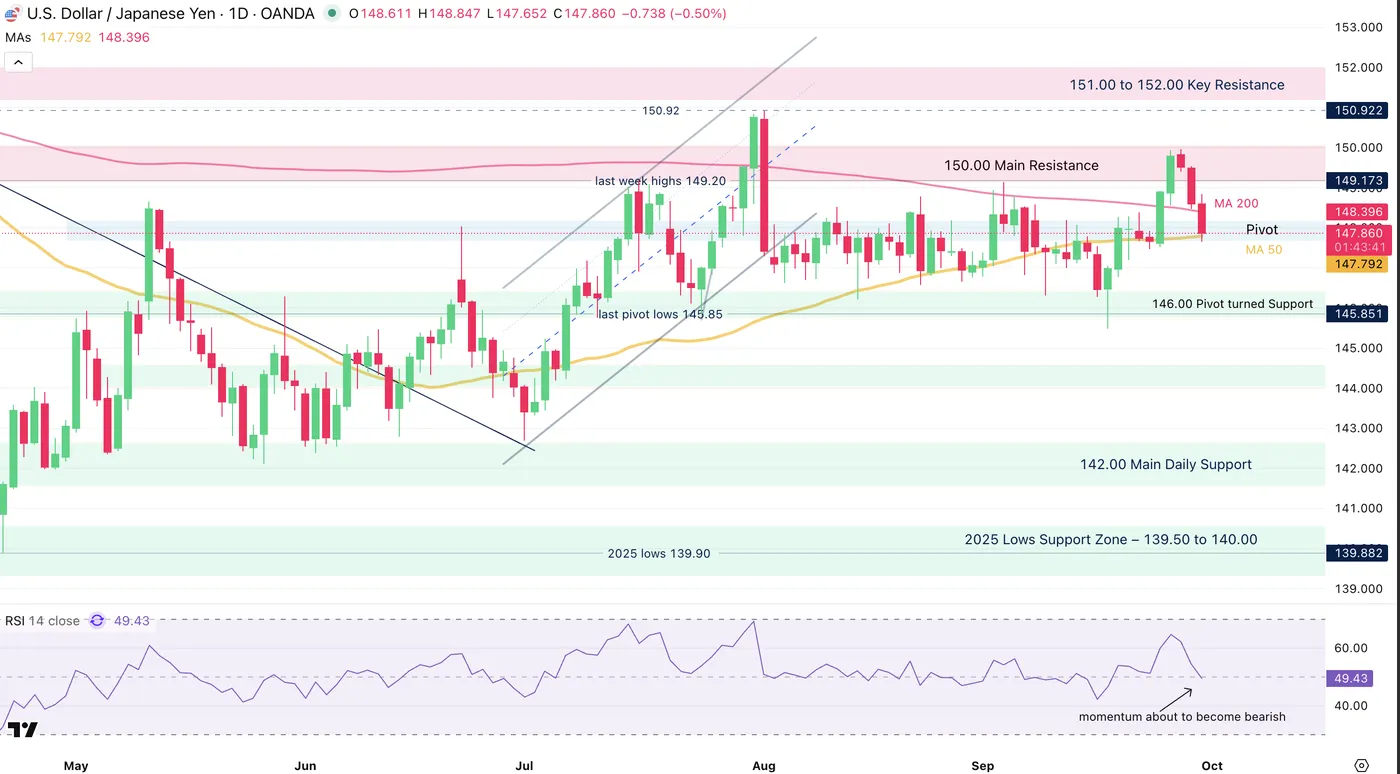
USDJPY Daily Chart, September 30, 2025 – Source: TradingView
Combined with a sudden u-turn in the USD, the yen started to price a more hawkish BoJ policy going forward forming the most consistent selloff in the pair since May 2025.
The three daily candles took prices from a failed test of the 150.00 handle (149.960 Monday highs) to two handles lower as we speak.
The 50-Day Moving average is coming at the mid-range pivot and will be one of the last level for USDJPY bulls to show up.
Daily momentum is turning negative, and when looking at these candles closing at their lows, it seems that this is the beginning of a move.
Of course, the 146.00 to 150.00 range holds until it breaks, but fundamentals could be pointing to a breakout
USDJPY 2H Chart and levels
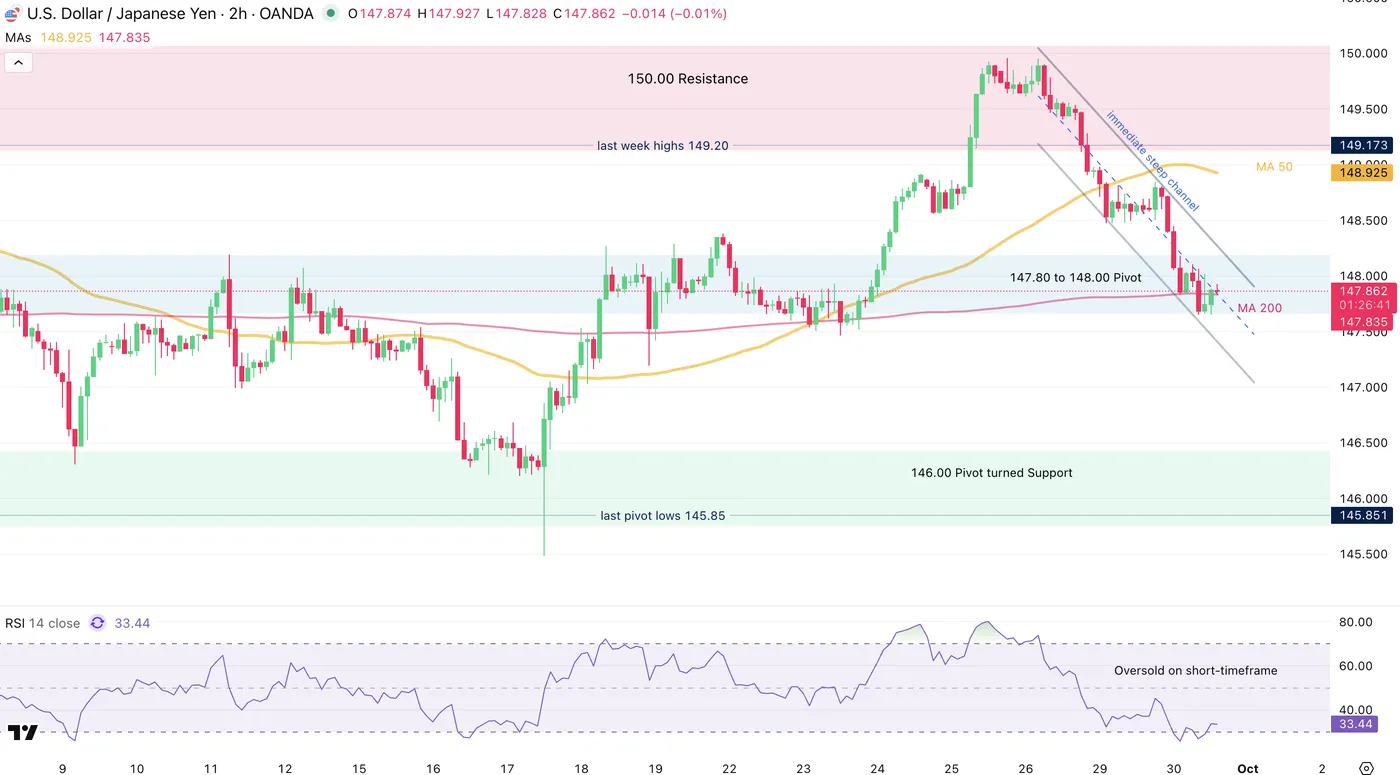
USDJPY 2H Chart, September 30, 2025 – Source: TradingView
The pair is evolving in an intraday steep downward channel, with prices now becoming oversold.
With the tight price action, it would be surprising to see a sudden reversal higher (if it does, look for a breakout of the channel) – The overall bearish flows and daily outlook are strong so keep that in mind.
Month-end flows could also be coming into play – Watch the reactions at a potential break of the 50-Day MA (147.75).
Levels of interest for USDJPY trading:
Resistance Levels
- Top of channel and 4H MA 50 – 148.350
- May range extremes and past week highs from 148.70 to 149.50
- 150.00 psychological resistance
- 150.90 July highs
Support Levels
Immediate pivot, mid-range and 50-day MA 147.80 to 148.00 (testing)
- 146.50 range support
- 145.00 psychological support
- 142.35 low of the May range, main support
Other yen crosses showing at key levels
GBPJPY now way below 200.00
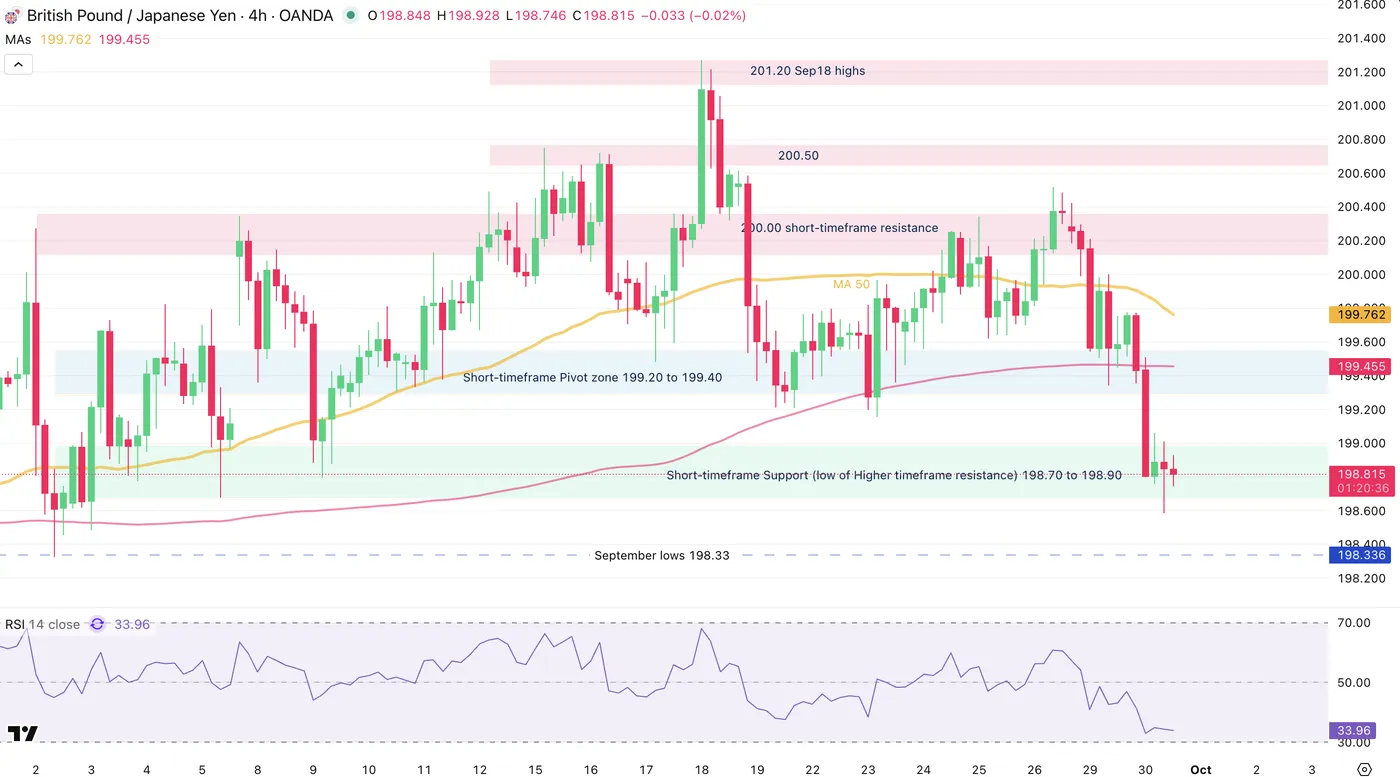
GBPJPY 4H Chart, September 30, 2025 – Source: TradingView
A gigantic weekly bearish divergence in CHFJPY
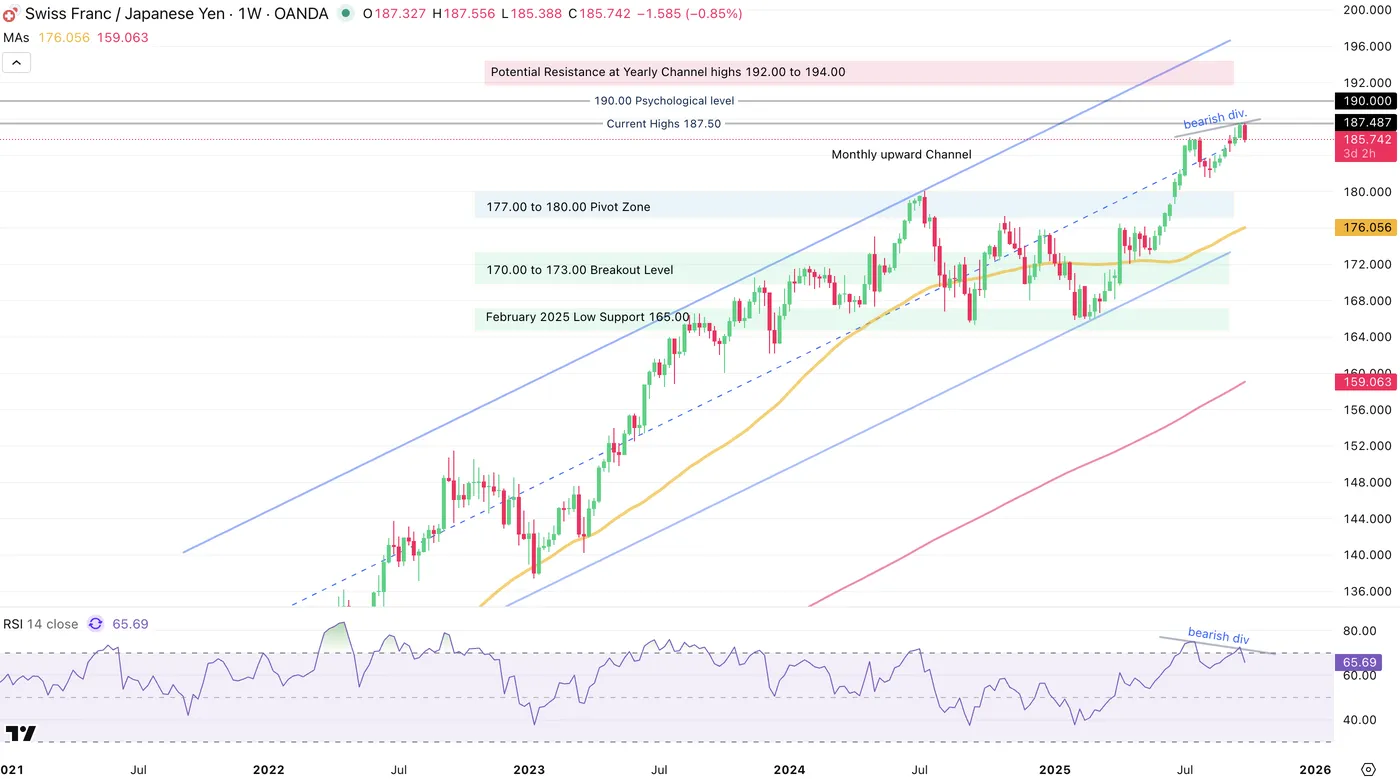
CHFJPY Weekly Chart, September 30, 2025 – Source: TradingView
Safe Trades!
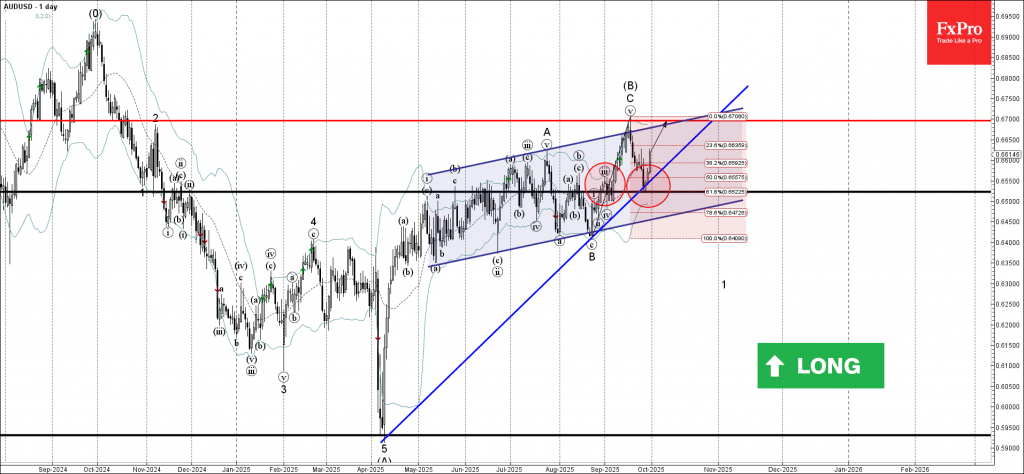
AUDUSD Wave Analysis
AUDUSD: ⬆️ Buy
- AUDUSD reversed from support area
- Likely to rise to resistance level 0.6700
AUDUSD currency pair recently reversed from the the support area between the support level 0.6525, support trendline from April and by the 61.8% Fibonacci correction of the upward impulse C from the end of August.
The upward reversal from this support area created the daily Japanese candlesticks reversal pattern Morning Star.
Given the clear daily uptrend and the strongly bullish Australian dollar sentiment seen across the FX markets today, AUDUSD can be expected to rise to the next resistance level 0.6700 (top of the previous wave C).
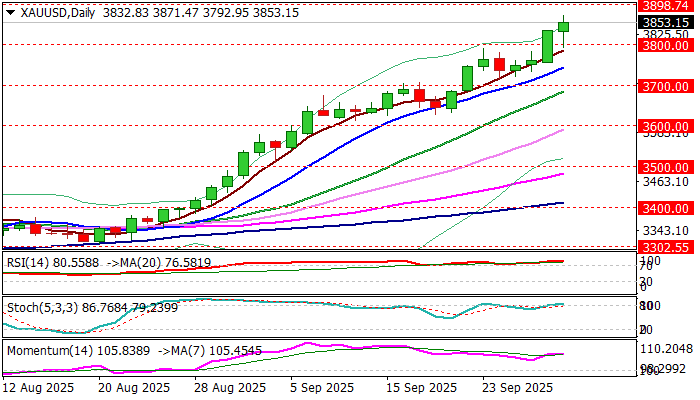
Gold – Limited Correction Under New Record High Seen as Positioning for Fresh Move into Uncharted Territory
Gold spiked to new record high at $3871 on Tuesday, in extension of Monday’s strong acceleration higher when the metal advanced 2%, in a biggest daily gain since May 6.
Mounting concerns about potential US government shutdown on Oct 1 and expectations for further Fed rate cuts sparked fresh wave of strong safe-haven demand.
The yellow metal extended its larger and steep uptrend in August after a three-month consolidation, with strong acceleration in September resulting in the massive gains (gold was up around 11% for the month.
Worsening geopolitical situation, fragile conditions in most developed economies and deepening political crisis in the number of countries, contribute to the cocktail of factors that continue to prompt investors into safety.
The fact that bulls took only six days to rise from $3700 to $3800 and rose near $3900 in just two days, points to the strength of bullish sentiment and a pace of metal’s price rise.
Bulls already eye magic $4000 barrier, which, I believe will be reached before the end of the year.
Monday’s pullback from new all-time high, could be described as limited correction of strong rally previous day and positioning for fresh push into uncharted territory, as initial and solid supports at $3800 zone contained today’s dip, keeping broader bullish bias and subsequent bounce has so far retraced the largest part of today’s correction.
Focus remains at the upside, with $3871 peak being immediate target ahead of psychological $3900.
However, caution on developments with US government, as well as potential month-end profit-taking.
Res: 3871; 3880; 3900; 3920
Sup: 3841; 3830; 3820; 3800