Sample Category Title
AUD/USD: Bulls Hold Grip, Fed Expected to Provide Fresh Positive Signal
AUDUSD keeps firm tone and trades just under new 2025 high (0.6668) on Monday, in attempts to extend last week’s 1.4% advance (the biggest weekly gain since the third week of June).
Aussie dollar enjoyed strong support from weaker US dollar, anticipating Fed’s 25 basis points rate cut this week, with markets focusing on comments from Fed chief Powell which could provide more details about the central bank’s actions in coming months.
Bulls may accelerate if Fed keeps firm dovish stance, as markets started to speculate about possible 50 basis points cut and see potential for total cuts of 1% by early 2026.
Immediate barrier lays at 0.6675 (falling 200WMA), followed by 0.6700 (round figure / Fibo 76.4% of 0.6942/0.5914), violation of which to expose peaks of July/Aug 2024 at 0.6798 and 0.6823 respectively.
Technical picture on daily chart is firmly bullish, with the latest positive signal on formation of 20/55DMA bull-cross, additionally underpinning the action.
However, bulls may stay on hold for some time as daily stochastic is overbought and markets slowed the pace ahead of key decisions and signals from Fed.
Daily higher base at 0.6630 (lows on today / last Friday) and July 24 peak (0.6625) mark immediate supports, followed by rising 10DMA (0.6587) which should keep the downside protected.
Res: 0.6675; 0.6700; 0.6798; 0.6823.
Sup: 0.6625; 0.6600; 0.6587; 0.6650.
Crypto Market Hesitant to Rewrite Highs Until FOMC
Market Overview
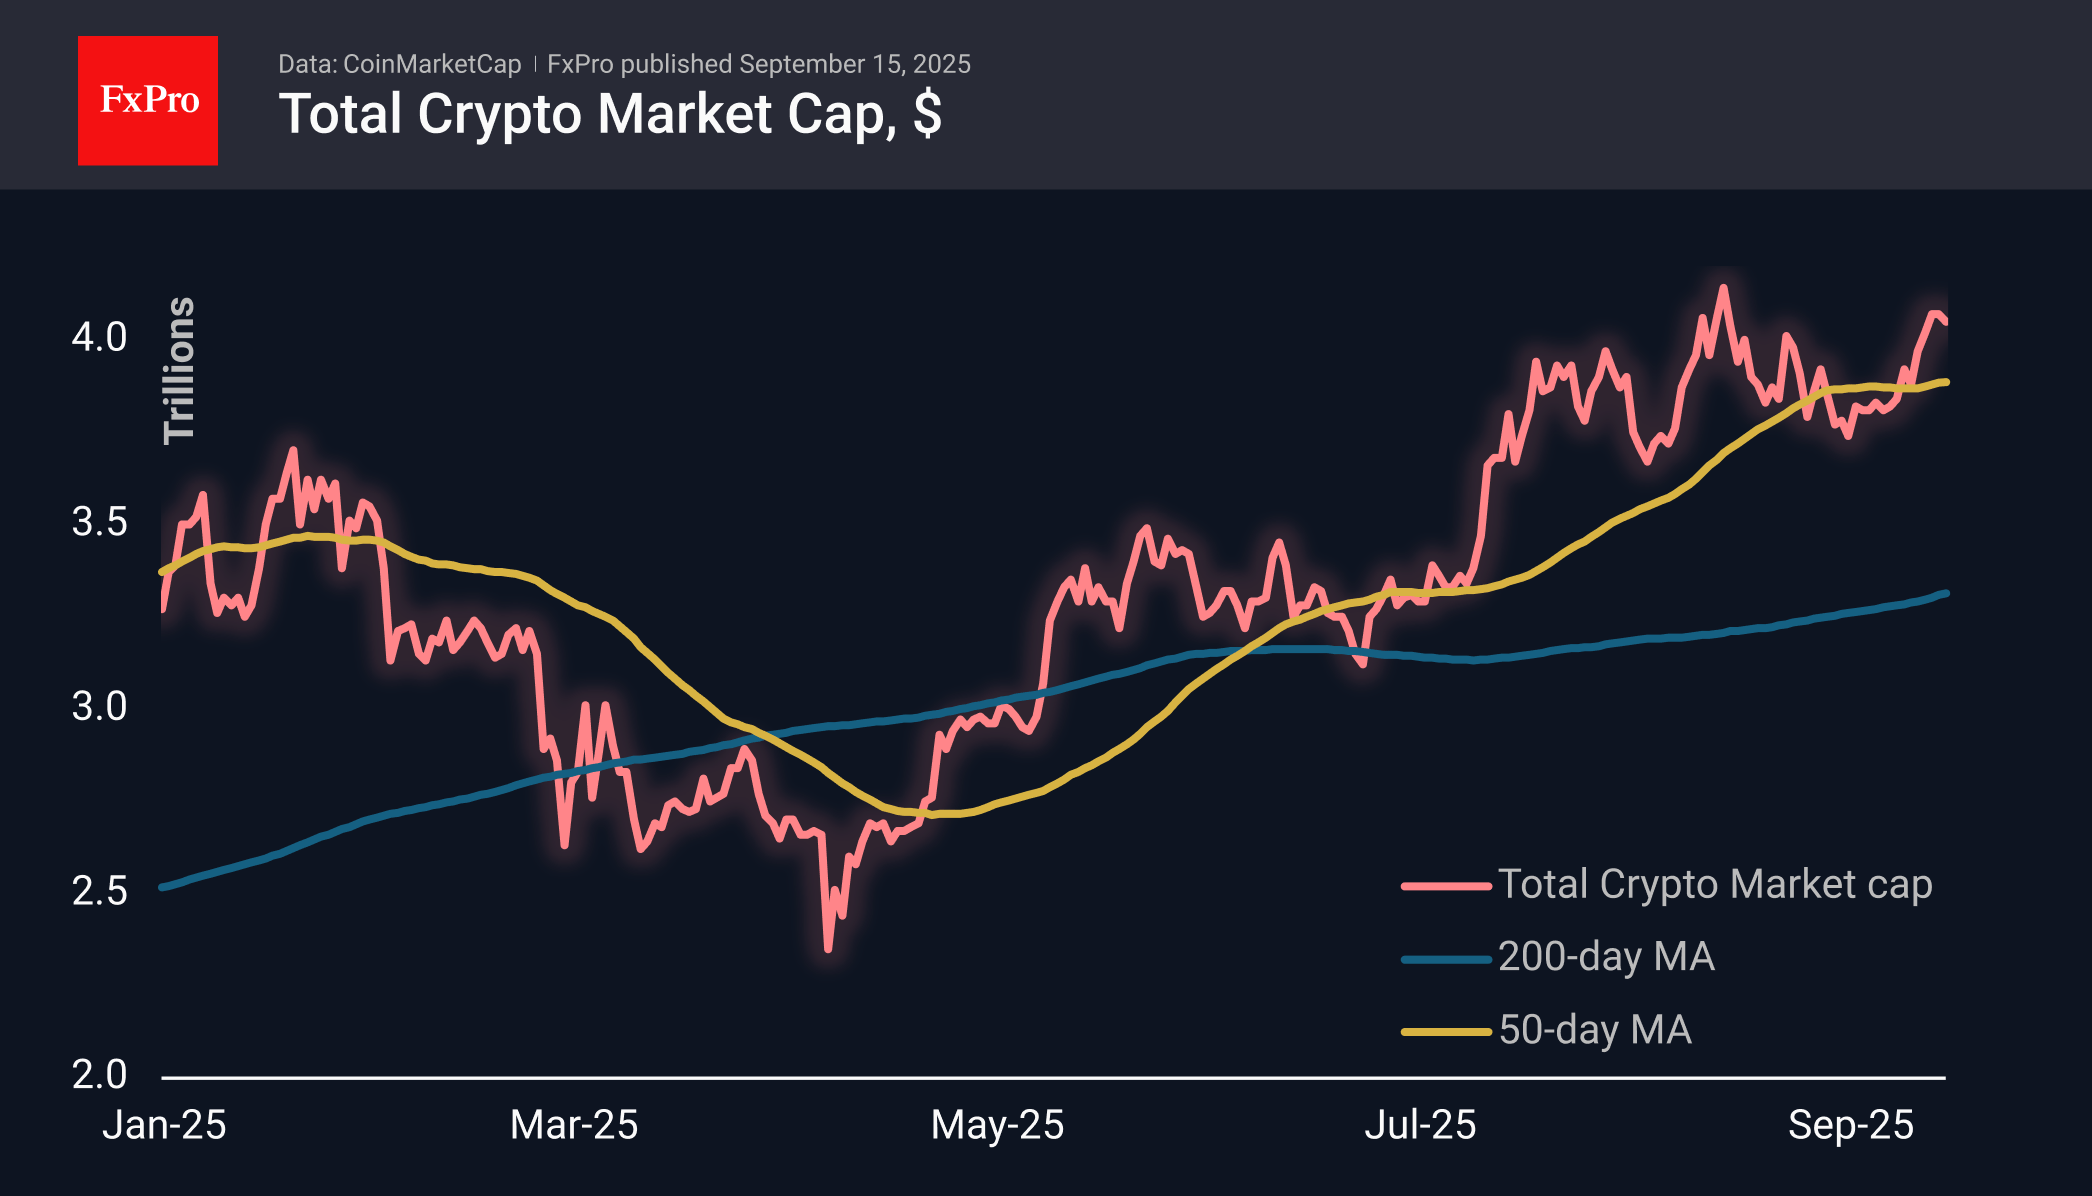
The crypto market cap reached $4.09 trillion over the weekend, approaching the peak levels set a month earlier. The initial impetus came from positive dynamics in the US stock market on Friday, thanks to technology sector stocks. However, retail traders used the moment to take profits in BTC and major altcoins, except for Solana, which went down on Monday. As a result, the market level fell back to $4.05 trillion.
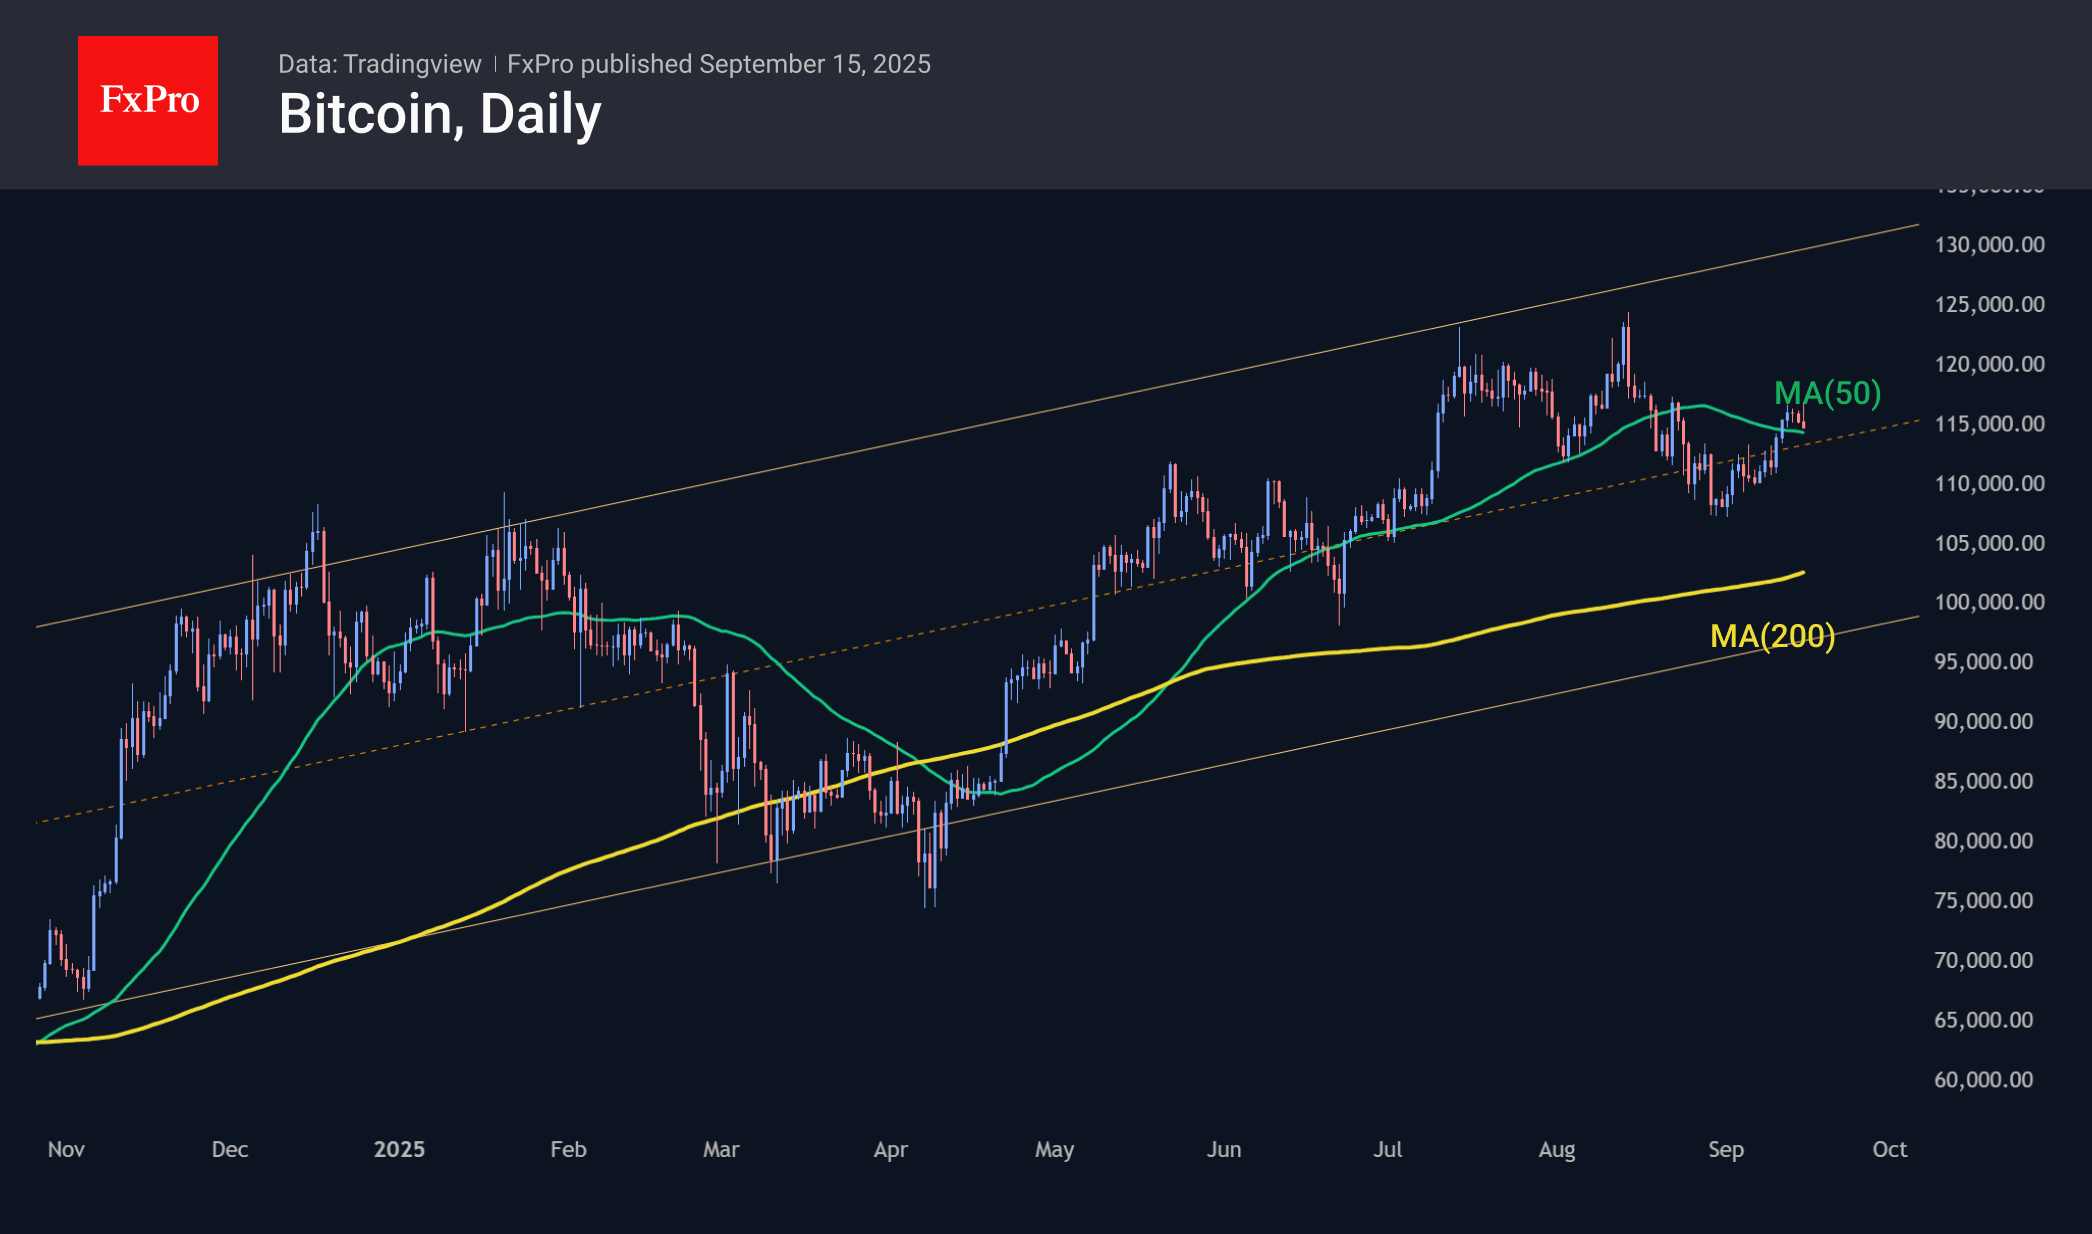
Bitcoin ran into resistance at $116K, but the sell-off is drying up as it approaches $114K, turning the 50-day moving average back into a support line. It seems that Bitcoin has found a temporary balance until the FOMC meeting results are announced. A quarter-point cut is already clearly priced in, but the driver will be the tone of comments regarding the Fed’s future actions. A willingness to further cut rates in the foreseeable future could inspire BTC to march toward new all-time highs.
News Background
According to SoSoValue, net weekly inflows into spot BTC ETFs jumped nearly 10-fold to $2.34 billion, the highest since mid-July. Total inflows since the approval of Bitcoin ETFs in January 2024 have increased to $56.83 billion. On Wednesday, the indicator recouped all of the previous week’s losses.
Inflows into spot Ethereum ETFs in the US resumed last week, amounting to $637.7 million, offsetting 80% of the previous week’s outflows. The cumulative net inflow since the ETF’s launch in July 2024 has grown to $13.36 billion.
Investors should give up hope of quick profits from their investments in the first cryptocurrency, said BitMEX founder Arthur Hayes. In his opinion, Bitcoin was created to protect against inflation, not to make a profit here and now.
The US SEC has postponed its decision on applications from BlackRock, Fidelity, and Franklin Templeton, which wanted to add a staking feature to their spot Ethereum ETFs until the end of October or November.
According to Galaxy Digital CEO Mike Novogratz, the crypto industry has entered the “Solana season.” A key factor was Forward Industries’ launch of the largest SOL treasury, worth $1.6 billion. Against this background, Galaxy Digital purchased 2.31 million SOL worth $536 million for its reserves.
The Winklevoss brothers’ Gemini crypto exchange raised $425 million during its IPO. The event caused a stir among investors, creating more than 20 times oversubscription for the shares.
Tether introduced the USAT stablecoin for the US market. It is backed by dollars and fully compliant with US regulations. The stablecoin will use Tether’s Hadron RWA platform technology.
Gold Price Stabilises Ahead of Central Bank Decisions
Following the ECB’s decision last week to leave interest rates unchanged, traders will closely monitor this week’s monetary policy announcements from the US Federal Reserve, the Bank of England, the Bank of Japan, and other central banks from Toronto to Taipei.
As the XAU/USD chart shows today, the gold price has stabilised after its recent record highs, with investors adopting a wait-and-see stance. The ADX indicator is trending lower, suggesting a diminishing directional momentum.
Key Drivers Influencing Gold Prices
Market participants are almost fully convinced that the Federal Reserve will cut rates by a quarter point this week, while also pricing in the likelihood of further reductions next year amid signs of labour market weakness. Lower rates are generally seen as supportive for gold, making it a more attractive asset relative to yield-bearing US Treasuries.
Additional factors underpinning bullish sentiment include:
→ Weakness in the US dollar.
→ Persistent geopolitical tensions.
→ Pressure on the Fed from Donald Trump, who recently attempted to dismiss Board Governor Lisa Cook.
→ Central bank gold purchases.
On the other hand, profit-taking could dampen demand. Nevertheless, gold prices remain elevated.
Technical Analysis of XAU/USD
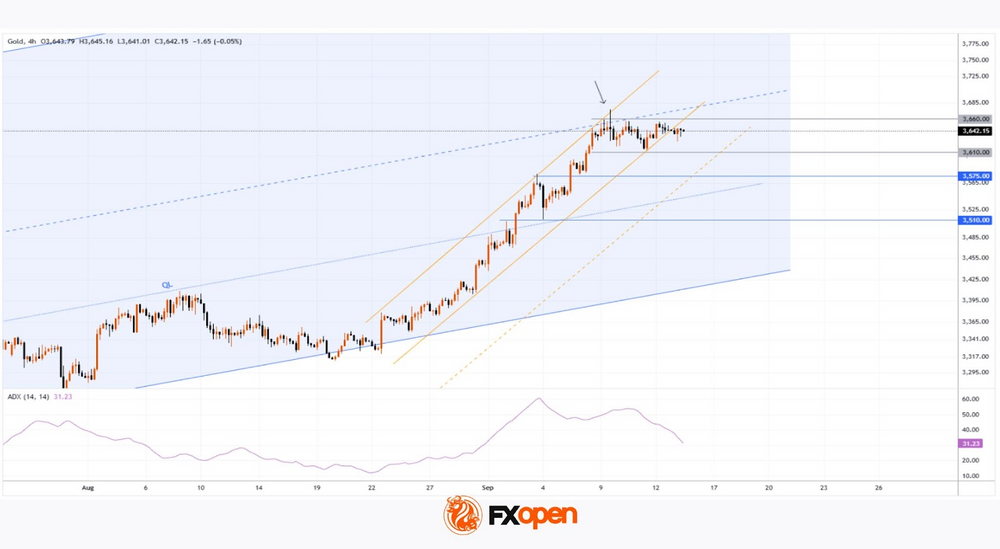
Recently, we outlined three reasons why gold’s rally might pause. Since then, the price has consolidated within the $3,610–3,660 range.
This has confirmed the assumption that the median line of the long-term ascending channel is acting as resistance. The steep upward channel (marked with orange lines) has been broken.
What Could Happen Next
→ From a bullish perspective, the resistance levels at $3,510 and $3,575 have been broken to the upside and successfully retested – a sign of strong demand.
→ From a bearish perspective, the candlestick’s long upper shadow, where gold set its record high, reflects aggressive selling pressure.
An attempt to break below the $3,575 support level and the orange dotted line (an additional support trendline plotted beneath the orange channel) could happen.
However, whether this scenario materialises will largely depend on upcoming central bank announcements. Traders should brace for heightened volatility.
Start trading commodity CFDs with tight spreads. Open your trading account now or learn more about trading commodity CFDs with FXOpen.
This article represents the opinion of the Companies operating under the FXOpen brand only. It is not to be construed as an offer, solicitation, or recommendation with respect to products and services provided by the Companies operating under the FXOpen brand, nor is it to be considered financial advice.
China’s Economy Slips, Australian Dollar Edges Higher
The Australian dollar is coming off its best week since April, posting gains of 1.4%. In the European session, AUD/USD is trading at 0.6657, up 0.12% on the day.
China's industrial production, retail sales slip in August
China posted disappointing data in September, as the second largest economy in the world continues to cool. Industrial production expanded 5.2% y/y, down from 5.8% in August and below the market estimate of 5.7%. This was the lowest pace of growth since August 2024, as manufacturing activity slowed and domestic remained weak.
China's retail sales rose 3.4% y/y in September, below 3.7% in August and the market estimate of 3.8%. This was the slowest pace since November 2024 and the third straight month of acceleration. There was more bad news on the labor front, as the unemployment rate ticked up to 5.3% from 5.2%, the highest level since February.
The US-China trade war is weighing on China's economy and the government is pushing exporters to find news markets. If that boosts economic activity, it will be good news for Australia, as China is its largest trading partner.
Investors are keeping an eye on the Federal Reserve, which is virtually certain to lower rates on Wednesday. The Fed hasn't cut rates since December 2024, which means that a cut will be a significant move, even if it has been priced in by the markets. With the US labor market showing signs of strain, the Fed could cut again before the end of the year, likely in December. Inflation remains above the 2% target but the Fed considers the weakening job market a bigger threat to the economy than inflation.
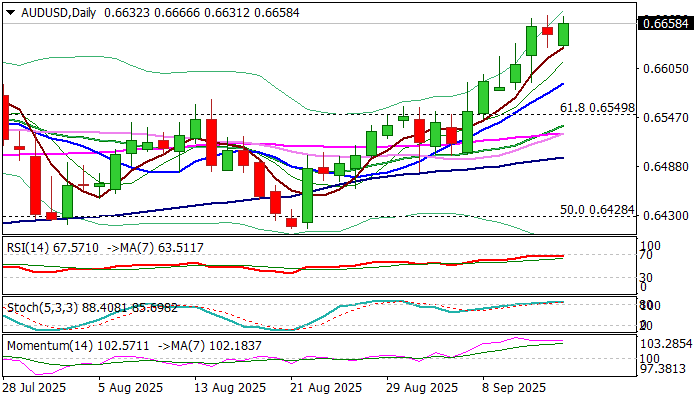
AUD/USD Technical
- AUDUSD is testing resistance at 0.6650. Above, there is resistance at 0.6668
- 0.6630 and 0.6612 are the next support levels
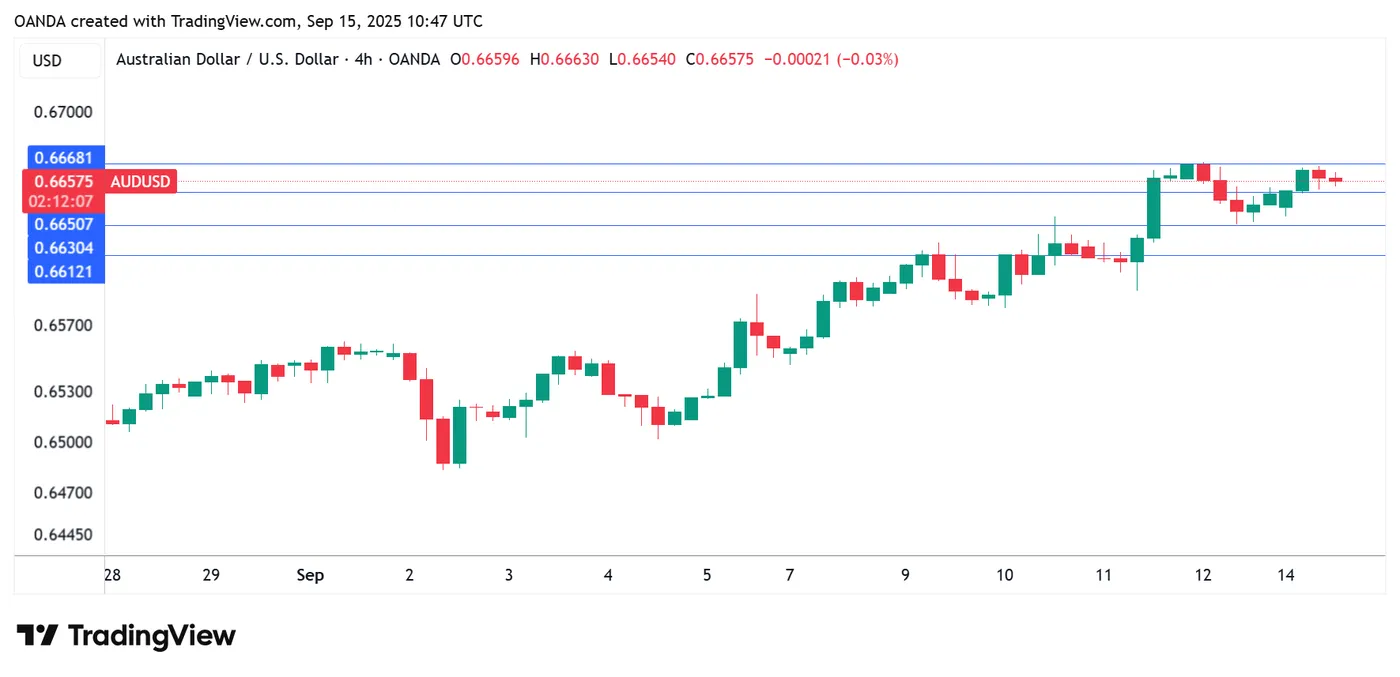
AUDUSD 1-Day Chart, September 15, 2025
Eurozone posts EUR 12.4B trade surplus, EU faces export weakness to US, China
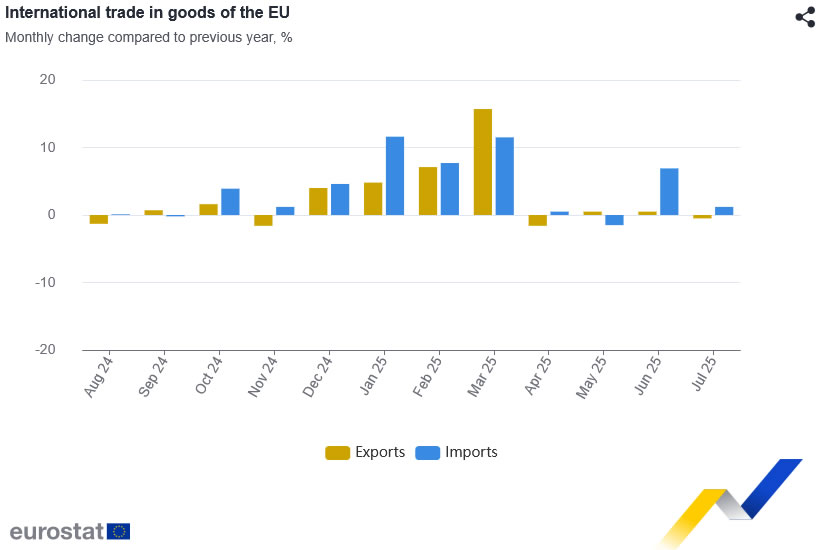
Eurozone trade data were stable in July, with exports edging up 0.4% yoy to EUR 251.5B while imports rose 3.1% yoy to EUR 239.1B. That produced a EUR 12.4B surplus. Intra-Eurozone trade grew 1.9% yoy to EUR 226.1B. The numbers reflect the bloc’s continued reliance on internal demand to cushion against weaker global flows.
The EU as a whole painted a softer picture, with exports down -0.5% yoy to EUR 227.7B against imports up 1.2% yoy to EUR 215.6B. The resulting EUR 12.1B surplus was still positive but underscored the relative drag from external markets. Intra-EU trade proved firmer, rising 2.9% yoy to EUR 349.2B.
Bilateral trends showed notable divergences. EU exports to the US fell -4.4% yoy and to China -6.6% yoy, underscoring pressure from global trade frictions. By contrast, exports to the UK rose 2.9% yoy and to Switzerland surged 9.4% yoy. On the import side, flows to the EU from the US jumped 10.7% yoy, from China rose 3.9% yoy, from Switzerland 6.8% yoy, and from the UK a modest 0.6% yoy.
GBP/USD Retains Gains While EUR/GBP Falls
GBP/USD is showing positive signs above 1.3520. EUR/GBP declined and is now consolidating losses below 0.8660.
Important Takeaways for GBP/USD and EUR/GBP Analysis Today
- The British Pound is attempting a fresh increase above 1.3520.
- There is a key bullish trend line forming with support near 1.3555 on the hourly chart of GBP/USD at FXOpen.
- EUR/GBP is trading in a bearish zone below the 0.8650 pivot level.
- There is a major declining channel forming with resistance near 0.8655 on the hourly chart at FXOpen.
GBP/USD Technical Analysis
On the hourly chart of GBP/USD at FXOpen, the pair remained well-bid above 1.3495. The British Pound started a decent increase above 1.3530 against the US Dollar.
The bulls were able to push the pair above the 50-hour simple moving average and 1.3550. The pair even climbed above 1.3580 and traded as high as 1.3582. Recently, there was a pullback below 1.3555 and the 50% Fib retracement level of the upward move from the 1.3495 swing low to the 1.3582 high.

However, the bulls were active near the 1.3530 support since it coincides with the 61.8% Fib retracement. The pair is again rising above 1.3555. There is also a key bullish trend line forming with support near 1.3555.
On the upside, the GBP/USD chart indicates that the pair is facing resistance near 1.3580. The next hurdle for the bulls could be 1.3590. A close above 1.3590 could open the doors for a move toward 1.3640. Any more gains might send GBP/USD toward 1.3700.
On the downside, the bulls might remain active near the same trend line at 1.3555. If there is a downside break below 1.3555, the pair could accelerate lower.
The first major support is at 1.3530, below which the pair could test 1.3495. The next key area for the bulls could be 1.3475, below which the pair could test 1.3440. Any more losses could lead toward 1.3420.
EUR/GBP Technical Analysis
On the hourly chart of EUR/GBP at FXOpen, the pair started a steady decline from well above 0.8680. It even declined below 0.8650 and the 50-hour simple moving average. A low was formed at 0.8629 and the pair is now consolidating losses. There was a move above 0.8640 and the 23.6% Fib retracement level of the downward move from the 0.8684 swing high to the 0.8629 low.
The pair is now facing resistance near a declining channel at 0.8655 and the 50% Fib retracement. The next major barrier for the bulls could be 0.8662.

A close above 0.8662 might accelerate gains. In the stated case, the bulls may perhaps aim for a test of 0.8685. Any more gains might send the pair toward the 0.8740 pivot.
Immediate support sits near 0.8640. The first key zone is at 0.8620. A downside break below 0.8620 might call for more downsides. In the stated case, the pair could drop toward 0.8580.
Trade over 50 forex markets 24 hours a day with FXOpen. Take advantage of low commissions, deep liquidity, and spreads from 0.0 pips. Open your FXOpen account now or learn more about trading forex with FXOpen.
This article represents the opinion of the Companies operating under the FXOpen brand only. It is not to be construed as an offer, solicitation, or recommendation with respect to products and services provided by the Companies operating under the FXOpen brand, nor is it to be considered financial advice.
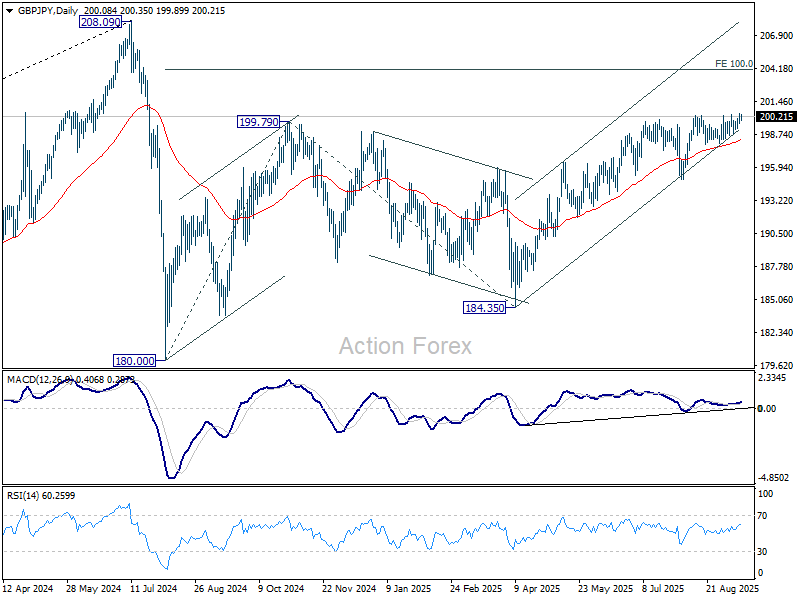
GBP/JPY Daily Outlook
Daily Pivots: (S1) 199.75; (P) 200.12; (R1) 200.56; More...
Intraday bias in GBP/JPY is mildly on the upside as rise from 184.35 is trying to resume. Sustained trading above 200.32 will target 100% projection of 180.00 to 199.79 from 184.35 at 204.14. Nevertheless, break of 199.57 minor support will delay the bullish case and turn intraday bias neutral again.
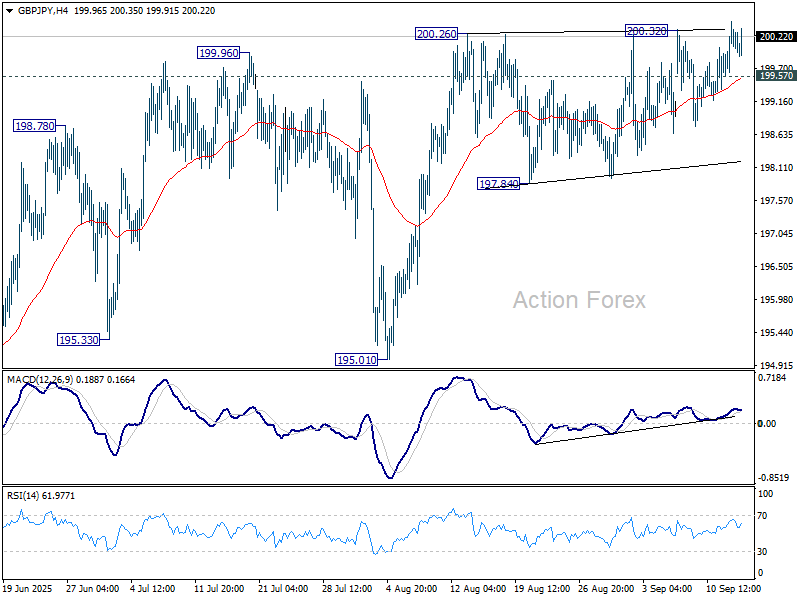
In the bigger picture, price actions from 208.09 (2024 high) are seen as a correction to rally from 123.94 (2020 low). The pattern might still extend with another falling leg. But in that case, strong support should be seen from 38.2% retracement of 123.94 to 208.09 at 175.94 to contain downside. Meanwhile, decisive break of 208.09 will confirm long term up trend resumption.
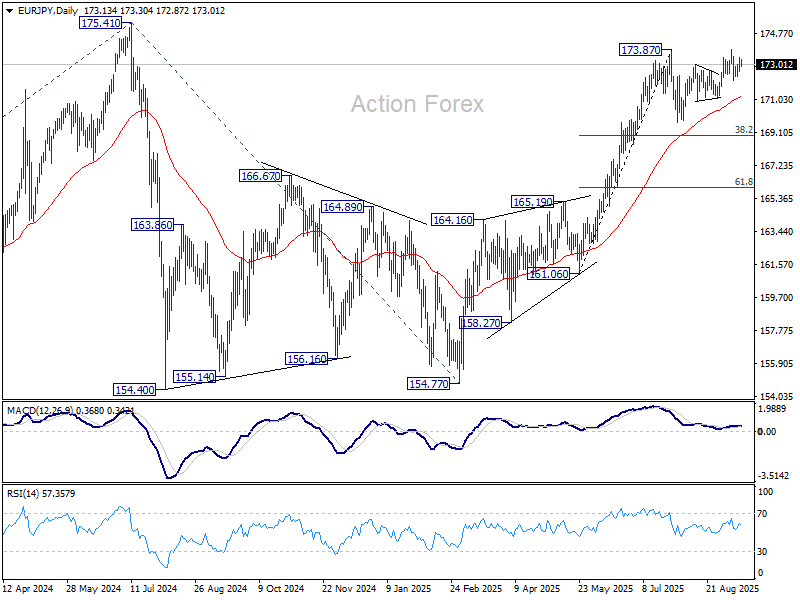
EUR/JPY Daily Outlook
Daily Pivots: (S1) 172.70; (P) 173.07; (R1) 173.65; More...
Intraday bias in EUR/JPY remains neutral for consolidations below 173.87/88. Further rise is in favor as long as 172.11 support holds. On the upside, firm break of 173.87/8 will resume the rally from 154.77 to retest 175.41 high. However, break of 172.11 will extend the corrective pattern from 173.87 with another fall. Bias will be back to the downside for 171.09 support first.
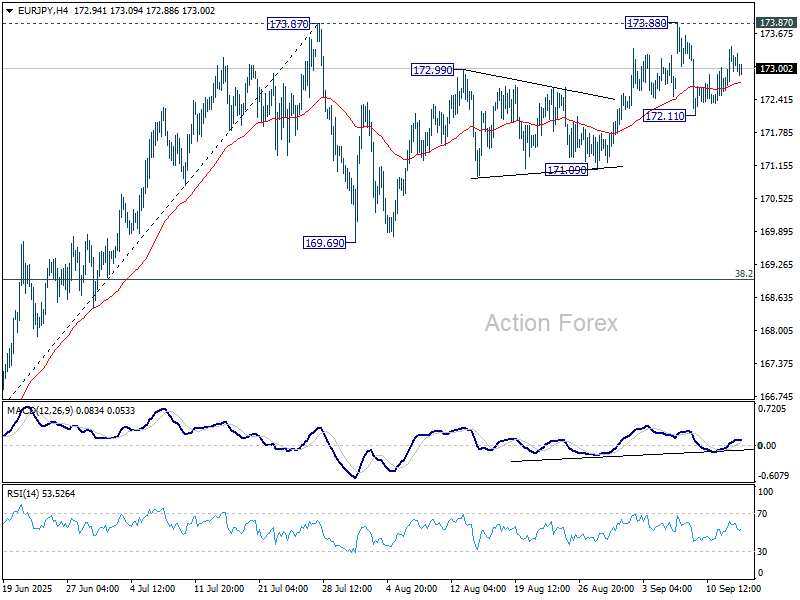
In the bigger picture, current rally from 154.77 is still tentatively seen as resuming the larger up trend. Firm break of 175.41 (2024 high) will confirm and target 61.8% projection of 124.37 to 175.41 from 154.77 at 186.31. However, sustained break of 38.2% retracement of 161.06 to 173.87 at 168.97 will delay this bullish case, and probably extend the correction from 175.41 with another fall.
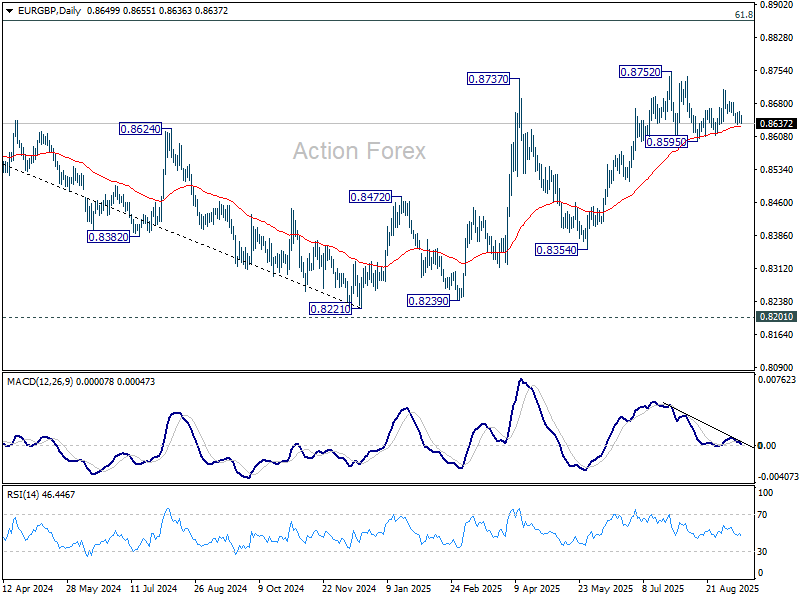
EUR/GBP Daily Outlook
Daily Pivots: (S1) 0.8642; (P) 0.8653; (R1) 0.8667; More...
Intraday bias in EUR/GBP stays neutral at this point. On the upside, break of 0.8683 minor resistance will extend the rebound from 0.8595 through 0.8711 to retest 0.8752 high. However, firm break of 0.8636 will turn bias to the downside for 0.8595 support instead.
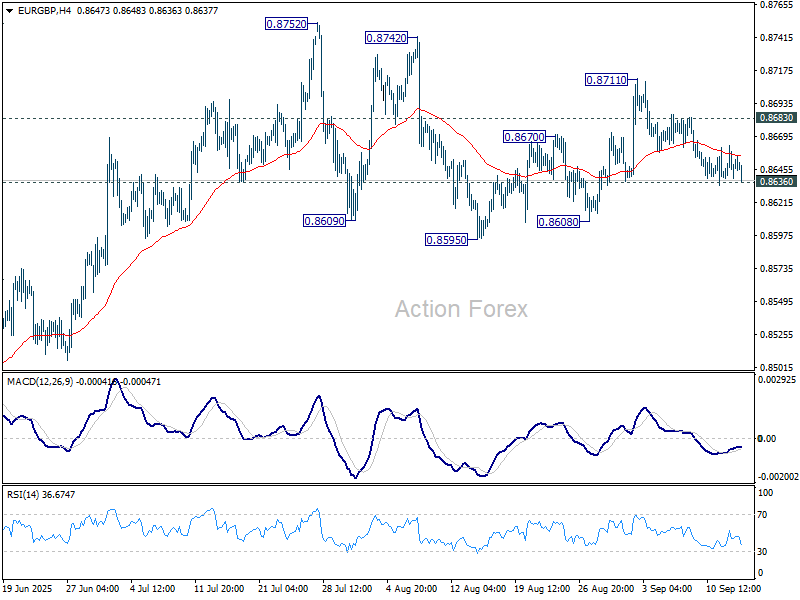
In the bigger picture, the structure from 0.8221 medium term bottom are not impulsive enough to suggest that it's reversing the down trend from 0.9267 (2022 high). But even if it's a correction, further rise could still be seen to 61.8% retracement of 0.9267 to 0.8221 at 0.8867. Nevertheless, sustained trading below 55 W EMA (now at 0.8518) will argue that the pattern has completed and bring retest of 0.8221 low.
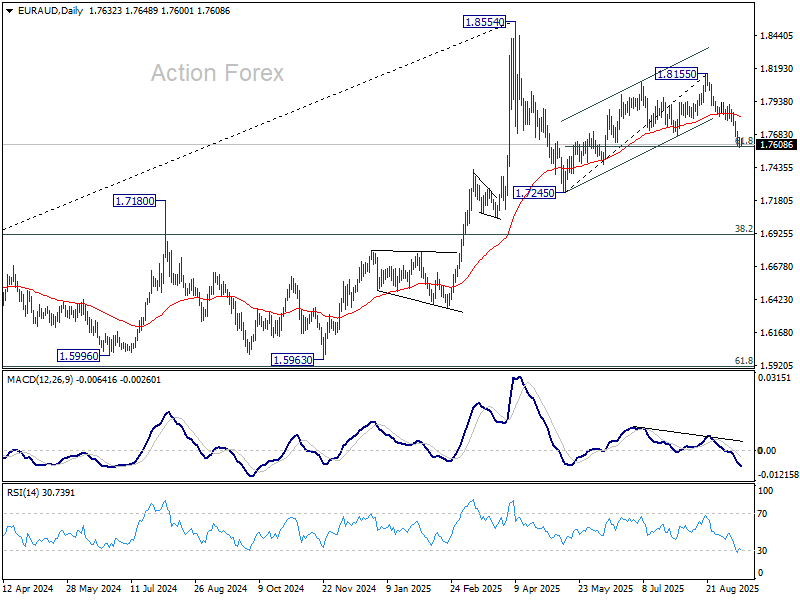
EUR/AUD Daily Outlook
Daily Pivots: (S1) 1.7605; (P) 1.7634; (R1) 1.7677; More...
Intraday bias in EUR/AUD stays neutral and and more consolidations could be seen above 1.7588. Another recovery cannot be ruled out, but further decline expected as long as 55 D EMA (now at 1.7813) holds. Corrective pattern from 1.8554 is in the third leg. Sustained trading below 61.8% retracement of 1.7245 to 1.8155 at 1.7593 will target 1.7245 support and possibly below.
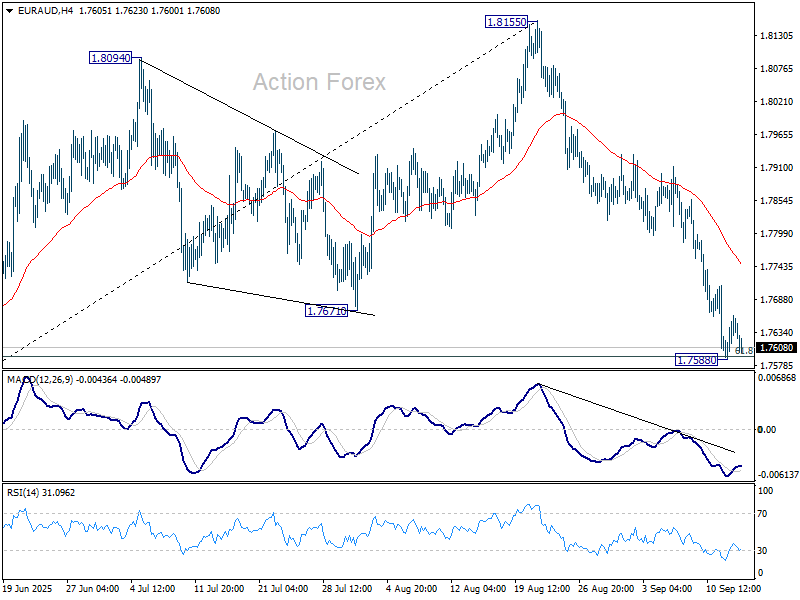
In the bigger picture, price actions from 1.8554 medium term top are seen as a corrective pattern. Deeper fall could be seen as the pattern extends, but downside should be contained by 38.2% retracement of 1.4281 (2022 low) to 1.8554 at 1.6922 to bring rebound. Uptrend from 1.4281 is expected to resume at a later stage.