Sample Category Title
Risk Appetite Anchored by Fed Cut Bets, Aussie Outshines Peers
Markets entered last week with elevated anticipated and left with even sharper convictions. Weak U.S. labor data tilted sentiment decisively toward faster Fed easing, while equity markets used that prospect as a springboard to yet another round of record highs.
Bond markets echoed that view. US 10-year yield broke briefly below 4%, sending a signal that investors are ready to front-load expectations for deeper easing. In the currency markets, Dollar failed to reclaim ground, leaving the stage open for other majors to shine.
At the front of the pack, Aussie surged ahead, powered additionally by strong regional risk-on sentiment. Kiwi followed closely, while Sterling also managed to climb, finding just enough support to offset the weight of ongoing fiscal worries.
In stark contrast, Yen languished as domestic risk appetite overshadowed the support from falling US yields. Loonie and Dollar also slipped to the bottom tier. In between, Euro and Swiss Franc provided a measure of balance. Both benefitted modestly from Dollar weakness but stopped short of major gains.
Wall Street Extends Record Run, 10-Year Yield Presses 4%
U.S. equities extended their uptrend last week, with all three major indexes notching fresh record highs. NASDAQ led the charge, finishing Friday at a new peak, while S&P 500 recorded its best weekly performance since early August and its fifth advance in six weeks. DOW slipped slightly on Friday but comfortably held above the 46,000 mark for the first time in history.
The rally was powered by deepening conviction that the Fed will accelerate its easing cycle. Markets interpreted weak labor data — most notably the surge in initial jobless claims to a four-year high — as confirmation that the economy requires additional support. “Bad news was good news” for risk assets, with traders confident that the Fed will prioritize its employment mandate.
Inflation developments added to the dovish mood. August’s CPI matched expectations and showed no fresh escalation in core pressures. PPI undershot forecasts, hinting that tariff-related cost increases may not be passing through as aggressively as feared. Combined, the data reinforced the view that the Fed has room to cut without stoking inflationary risks.
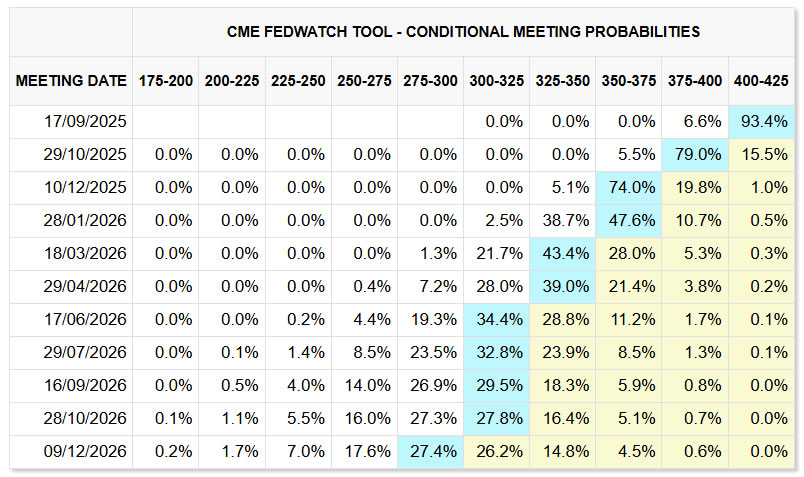
For the September 17 meeting, a 25bps rate cut is fully priced in. Markets now assign roughly an 85% probability to another move in October and an 80% chance of a December cut. If the Fed’s updated projections and Chair Jerome Powell’s remarks align with this path, equities could find further fuel for gains into year-end.
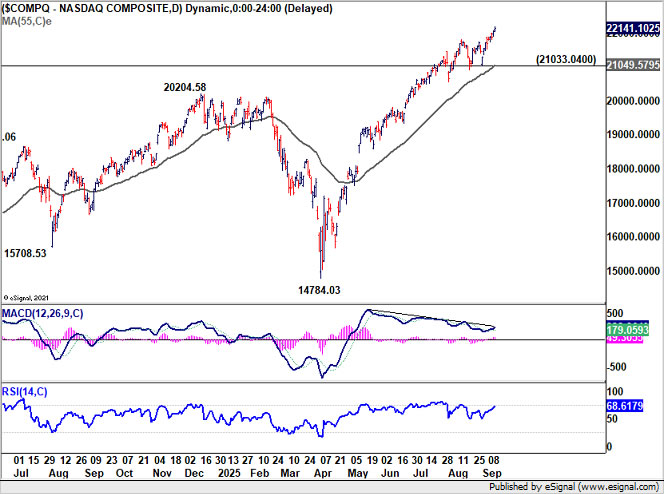
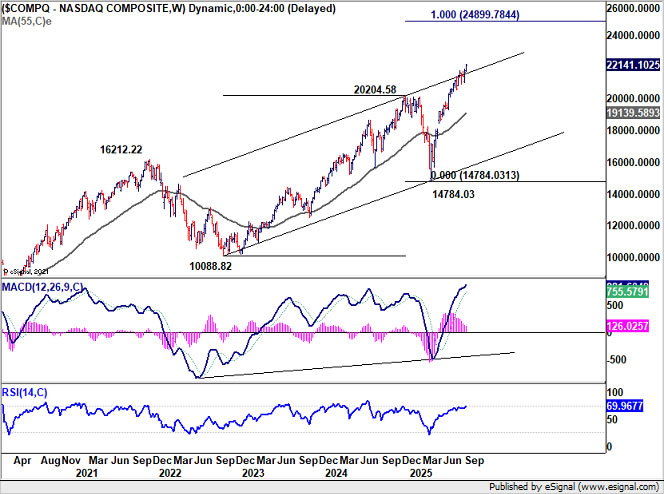
Technically, NASDAQ is attempting to move away from its long-term ascending channel. Sustained trading above the resistance could trigger a new wave of buying, and push NASAQ to 100% projection of 10088.82 to 20204.58 from 14784.03 at 24899.78, which is close to 25k psychological level.
On the other hand, stretched conditions are emerging in the stock markets, as seen in overbought condition in W RSI, and bearish divergence condition in D MACD. Break of 21033.04 support would suggest the rally is tiring, opening the door for consolidation before any renewed push higher.
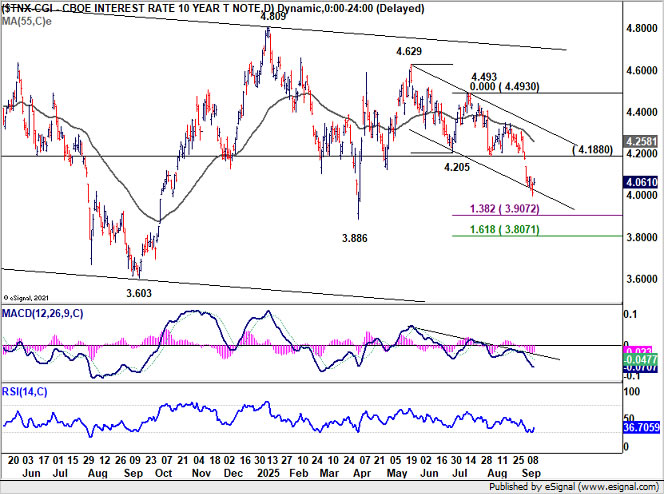
In fixed income, U.S. Treasuries also reflected the dovish tilt. 10-year yield dipped briefly to 3.996 before drawing support from near term falling channel, and recovered to close to 4.061%. While 10-year yield might still try to defend the 4% psychological level, any recovery should be capped below 4.188 support turned resistance.
The next directional move hinges on how the Fed frames its easing cycle. A signal of faster cuts or a lower terminal rate would likely drive yields down further. Next target is 138.2% projection of 4.629 to 4.205 from 4.493 at 3.907, or even further at 161.8% projection at 3.807.
Euro Sluggishness Limits Dollar Index Selloff
It was a classic bearish cocktail for Dollar last week — falling Treasury yields, firm risk appetite, and rising expectations for aggressive Fed easing. Yet Dollar Index ended the week only marginally lower, signaling hesitation among sellers despite the fundamental backdrop. The biggest factor preventing a steeper Dollar decline has been the sluggish Euro. Normally Dollar’s most liquid counterpart, the single currency has struggled to gather momentum.
Last week’s ECB meeting provided no spark, even though the Governing Council unanimously kept the deposit rate unchanged at 2.00% and President Christine Lagarde tried to sound upbeat. Lagarde emphasized that risks to growth had become “more balanced” following the U.S.–EU trade deal that trimmed tariff uncertainty. She argued that while higher tariffs, a stronger Euro, and rising global competition would weigh on activity this year, these headwinds should fade in 2026.
But the narrative was drowned out by France’s worsening political crisis. The ouster of Prime Minister François Bayrou underscored the fragility of President Emmanuel Macron’s government and revived fiscal sustainability fears at a time when long-term French yields are already elevated. At the same time, Germany continues to struggle with industrial malaise.
Sentix investor confidence confirmed this fragile backdrop. The index fell sharply in September to its weakest since April, with the survey blaming a toxic mix of French political instability, prolonged German weakness, an unfavorable tariff arrangement with the U.S., and the war in Ukraine. It warned that the modest summer recovery in sentiment had “disintegrated at a rapid pace” and saw little chance of an autumn rebound.
Against this backdrop, Euro’s inability to rally has blunted what could have been a more pronounced Dollar selloff. Dollar Index continues to lean lower, but without Euro strength, it lacks momentum to break decisively through critical support levels.
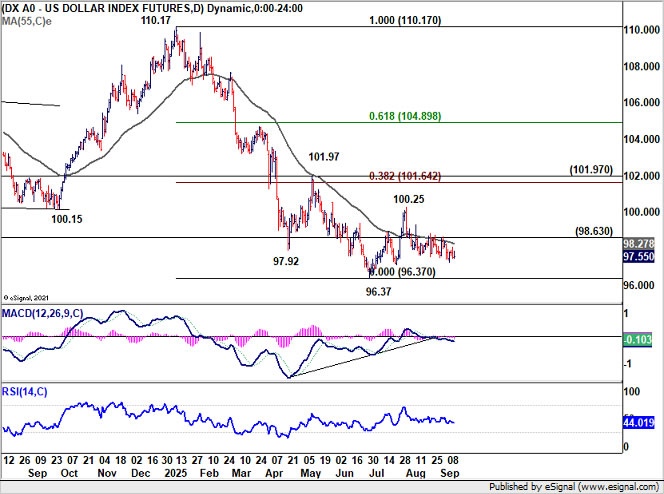
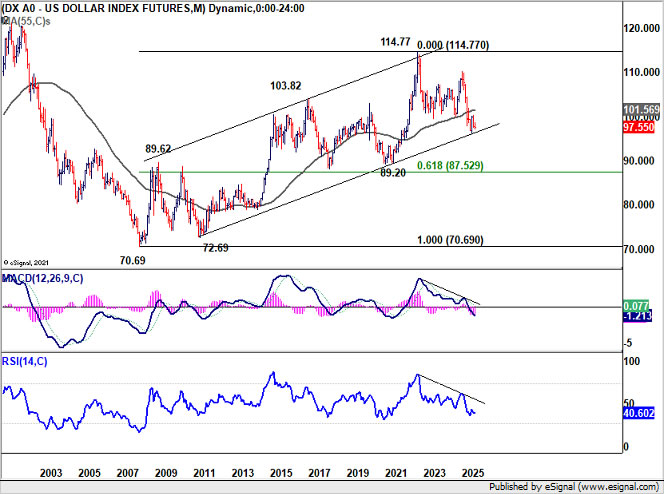
Technically, as long as resistance at 98.63 caps rebounds, the near term bias for Dollar Index is for another test of 96.37 low. That level could hold on the first attempt and trigger a bounce.
However, decisive break of 96.37 would firstly confirm resumption of whole down trend from 114.77. More importantly, sustained trading below the multi-decade channel floor at around 96 would have major bearish implications. It would open up deeper medium term down trend to 61.8% retracement of 70.69 (2008 low) to 114.77 (2022 high) at 87.52.
AUD/JPY Tops Weekly FX Performers Amid Asia Equity Boom
Asian stock markets also ended last week on a strong note, with bullish sentiment most evident in Japan and Hong Kong. The combination of softer U.S. yields, mounting Fed rate-cut expectations, and local catalysts created powerful momentum across the region, pushing indexes to multi-year and record highs.
In Tokyo, Nikkei surged more than 4% for the week, marking yet another record. The rally was fueled by multiple factors: Tech and AI-linked shares tracking NASDAQ’s strength, optimism over Fed easing, and renewed political hopes at home. The emergence of former economic security minister Sanae Takaichi as a frontrunner for the LDP presidency injected a uniquely domestic bullish factor, as investors looked for a potential return to Abenomics-style policies favoring fiscal support and monetary accommodation.
Trade developments added another tailwind. Japan recently secured a reduction in U.S. auto tariffs, easing a critical pressure point for the country’s key export sector. Together, these drivers made for a rare alignment of global and local positives, giving the Nikkei its strongest weekly performance in months.
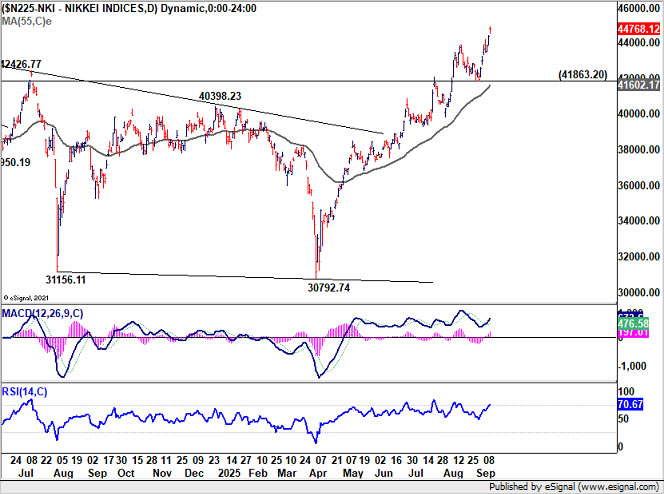
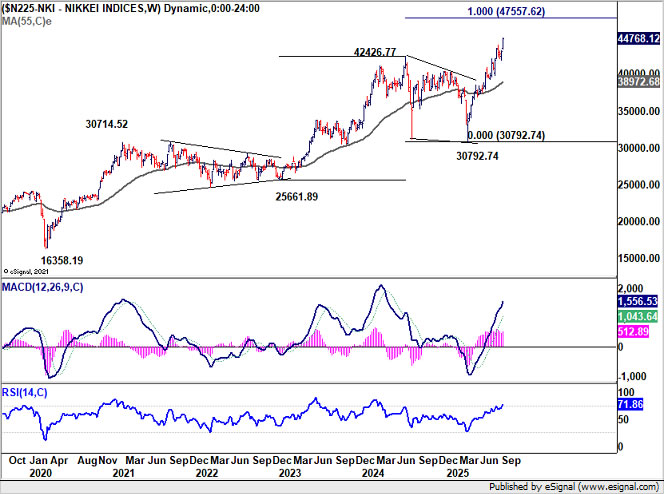
Technically, Nikkei remains on track to 100% projection of 25661.89 to 42426.77 from 30792.74 at 47557.62. Outlook will stay bullish as long as 41863.20 support holds, in case of retreat.
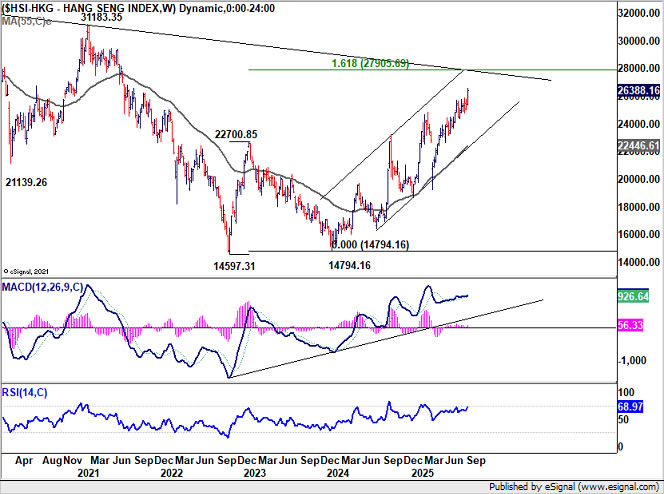
Hong Kong’s Hang Seng Index also impressed, posting its largest weekly gain in six months and closing at the highest level since August 2021. The rally was supported by improving liquidity conditions, as well as the prospect that a U.S. rate cut could prompt the People’s Bank of China to ease policy further. Such a move could encourage mainland savers to rotate deposits into equities, bolstering valuations.
Additionally Hong Kong stocks remain undervalued relative to mainland peers, which recently rallied to decade highs. With additional “southbound inflows” from mainland investors using the stock connect program, liquidity conditions are likely to stay supportive, feeding optimism that the HSI still has room to catch up.
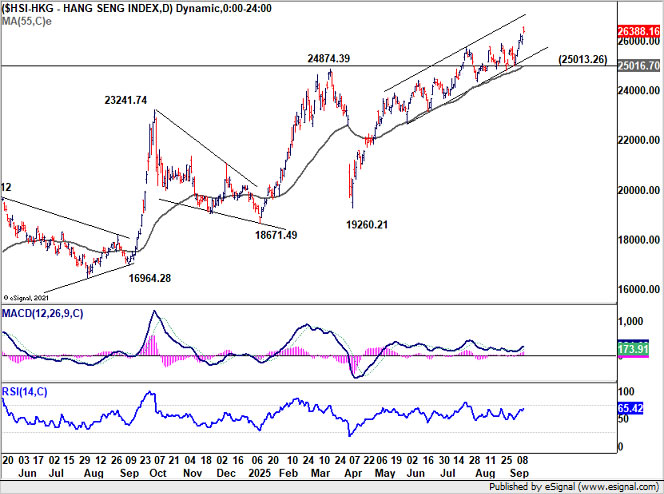
Technically, HSI is on track towards 161.8% projection of 14597.31 to 22700.85 from 14794.16 at 27905.69. For the near term, outlook will stay bullish as long as 25013.26 support holds, in case of retreat.
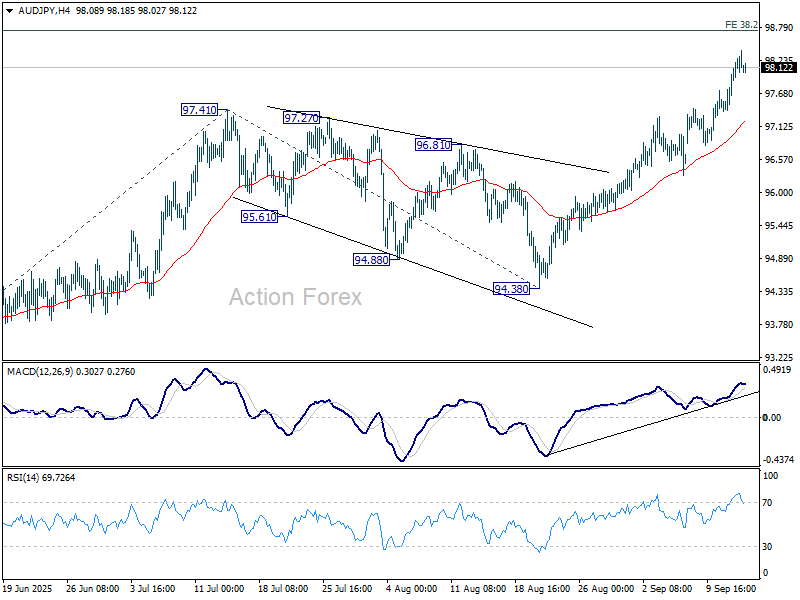
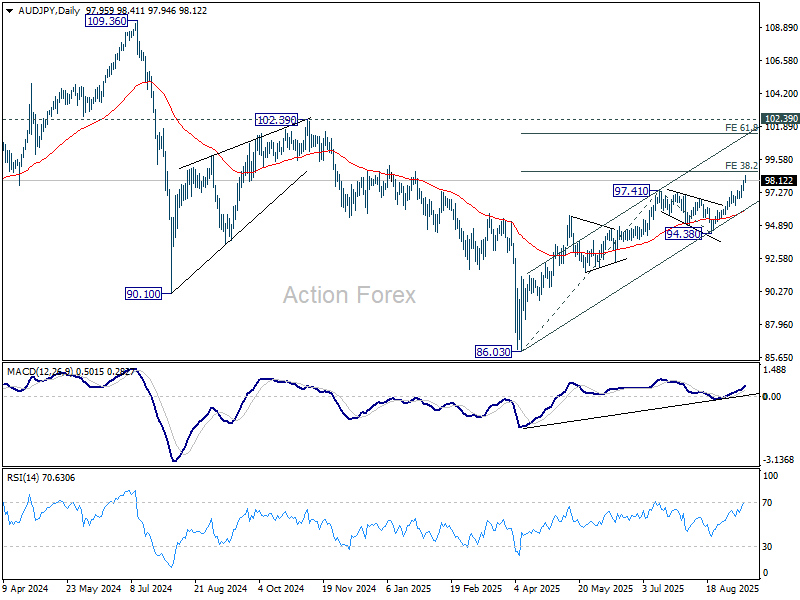
In currency markets, the risk-on tone spilled over in the region. AUD/JPY emerged as the week’s best-performer, closing 1.59% higher. Immediate focus is now on 38.2% projection of 86.03 to 97.41 from 94.38 at 98.72. Firm break there will pave the way to 61.8% projection at 101.41 next. Nevertheless, break of 97.38 support will bring consolidations first, before staging another rise.
AUD/USD Weekly Report
AUD/USD's rise from 0.5913 resumed through 0.6624 resistance last week. There is no sign of topping yet, and initial bias stays on the upside. Next target is 0.6713 fibonacci level. Firm break there will carry larger bullish implications. On the downside, below 0.6589 minor support will turn bias neutral and bring consolidations first, before staging another rally.
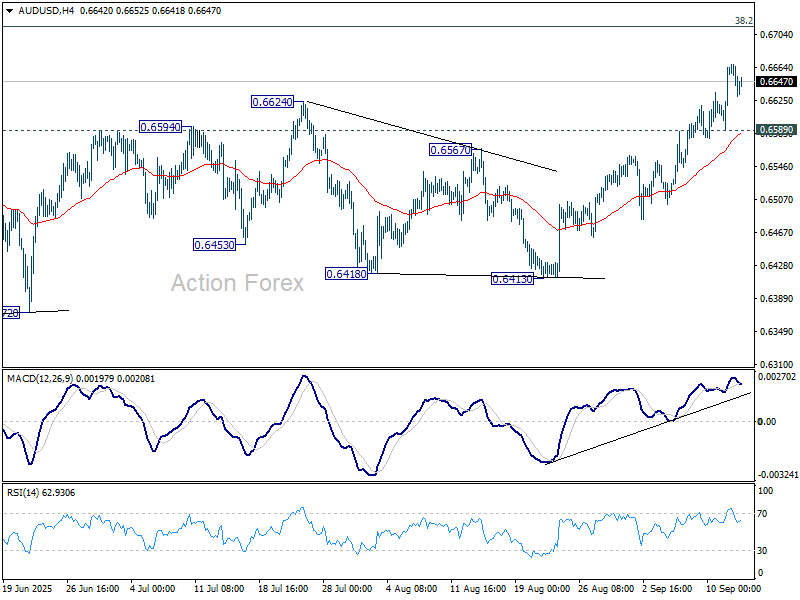
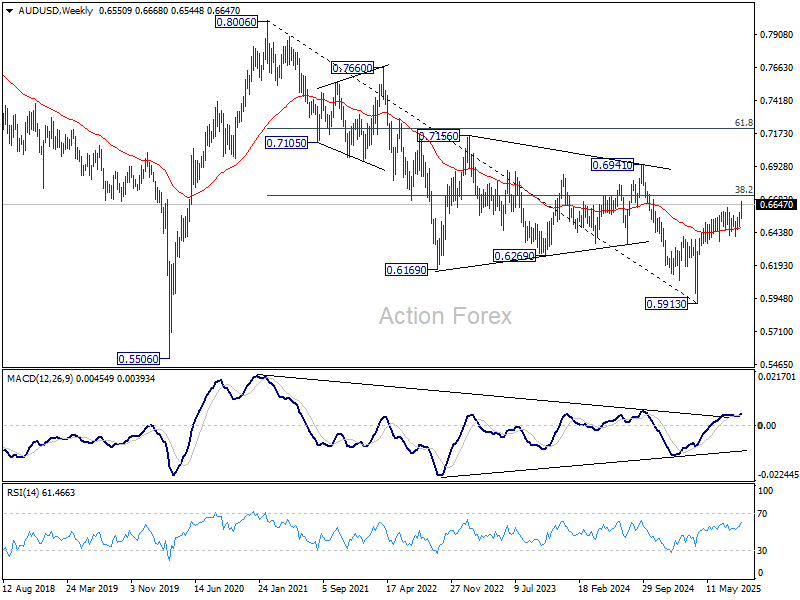
In the bigger picture, there is no clear sign that down trend from 0.8006 (2021 high) has completed. Rebound from 0.5913 is seen as a corrective move. While stronger rally cannot be ruled out, outlook will remain bearish as long as 38.2% retracement of 0.8006 to 0.5913 at 0.6713 holds. Nevertheless, considering bullish convergence condition in W MACD, sustained break of 0.6713 will be a strong sign of bullish trend reversal, and path the way to 0.6941 structural resistance for confirmation.
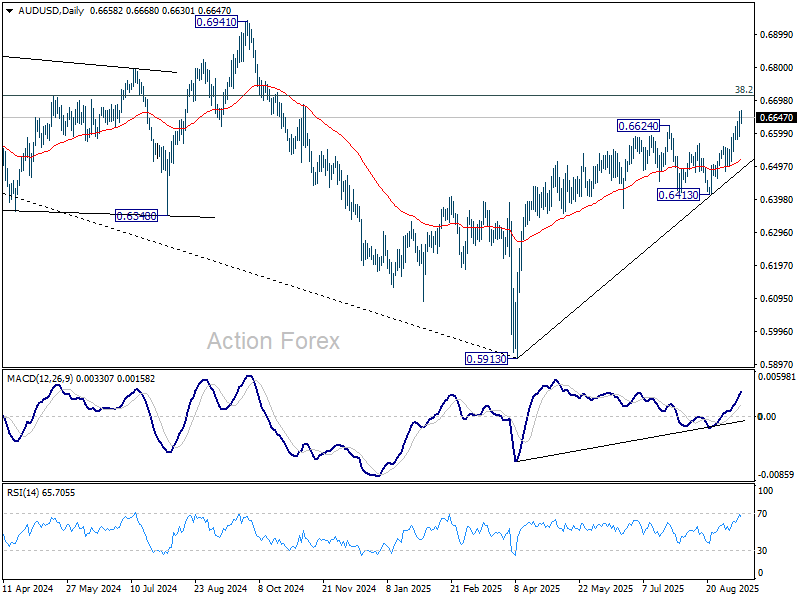
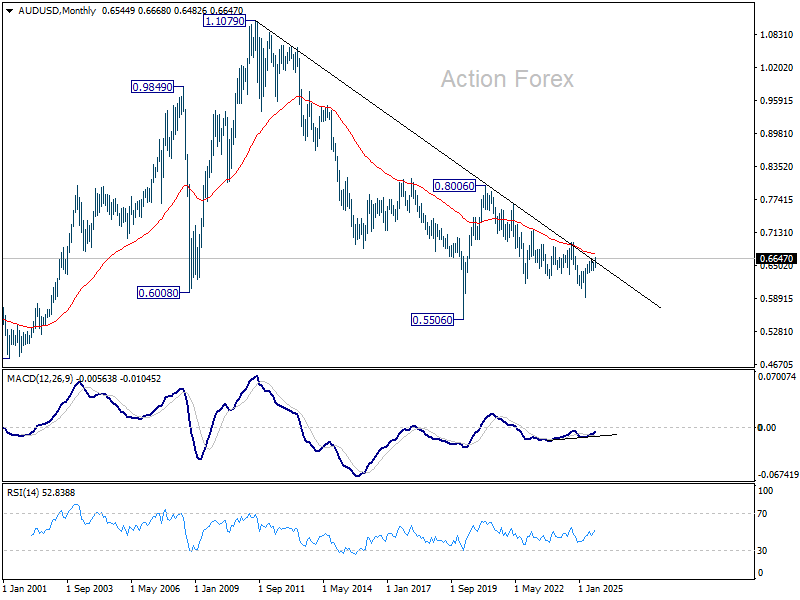
In the long term picture, fall from 0.8006 is seen as the second leg of the corrective pattern from 0.5506 long term bottom (2020 low). Hence, in case of deeper decline, strong support should emerge above 0.5506 to contain downside to bring reversal. On the upside, firm break of 0.6941 will argue that the third leg has already started back to 0.8006.
EUR/USD Weekly Outlook
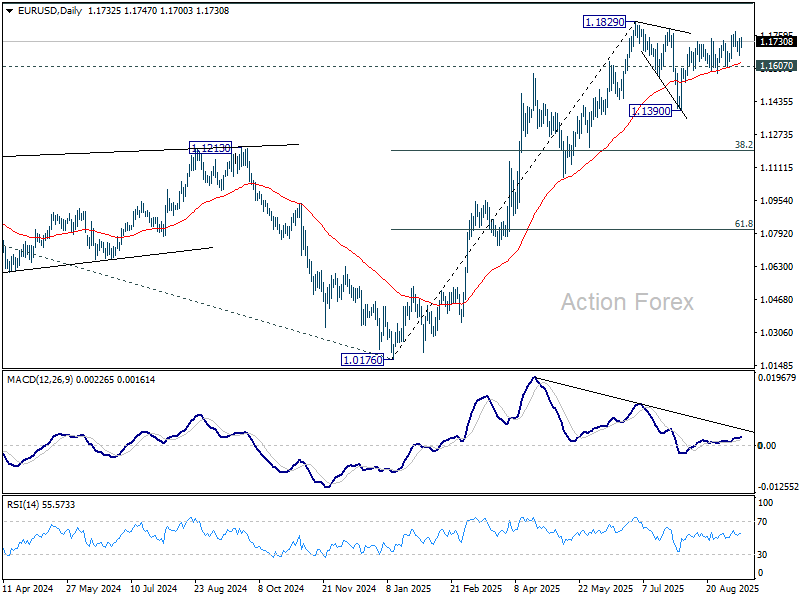
EUR/USD edged higher to 1.1779 last week but turned sideway since then. Initial bias remains neutral this week first, and further rise is expected as long as 1.1607 support holds. Above 1.1779 will target a retest of 1.1829 high. Firm break there will resume larger up trend to 1.1916 projection level next.
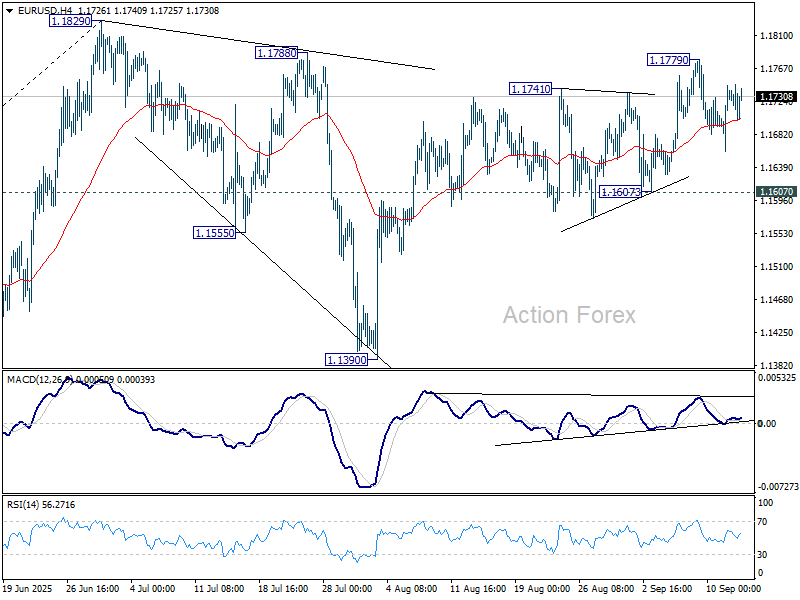
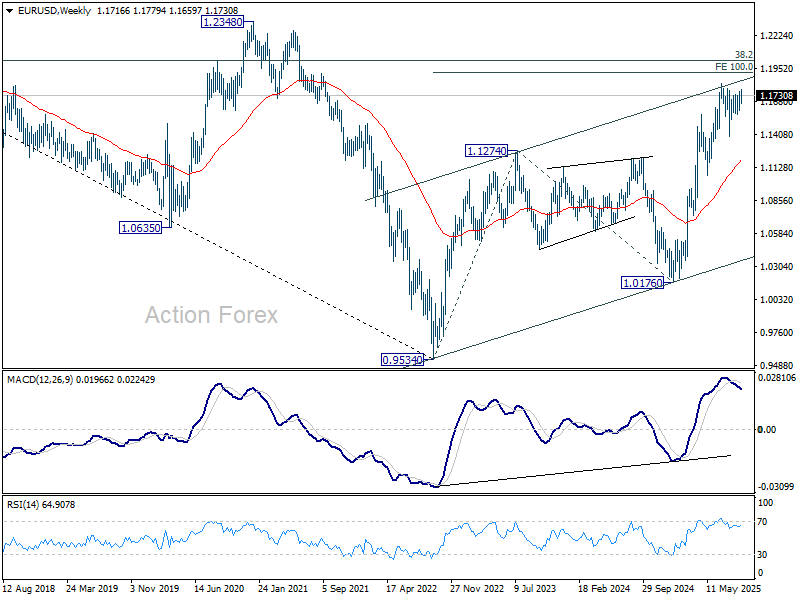
In the bigger picture, rise from 0.9534 (2022 low) long term bottom could be correcting the multi-decade downtrend or the start of a long term up trend. In either case, further rise should be seen to 100% projection of 0.9534 to 1.1274 from 1.0176 at 1.1916. This will remain the favored case as long as 55 W EMA (now at 1.1174) holds.
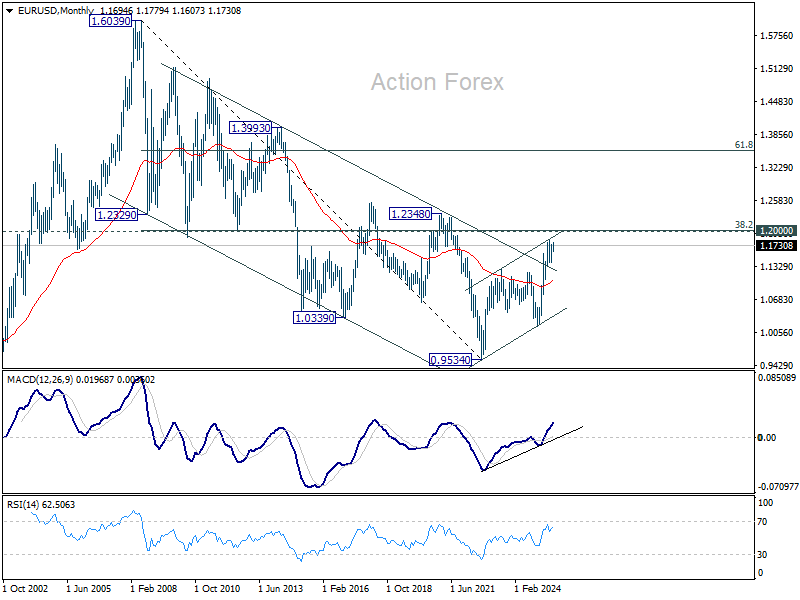
In the long term picture, a long term bottom was in place already at 0.9534, on bullish convergence condition in M MACD. Further rise should be seen to 38.2% retracement of 1.6039 (2008 high) to 0.9534 at 1.2019. Rejection by 1.2019 will keep the price actions from 0.9534 as a corrective pattern. But sustained break of 1.2019 will suggest long term bullish trend reversal, and target 61.8% retracement at 1.3554.
USD/JPY Weekly Outlook
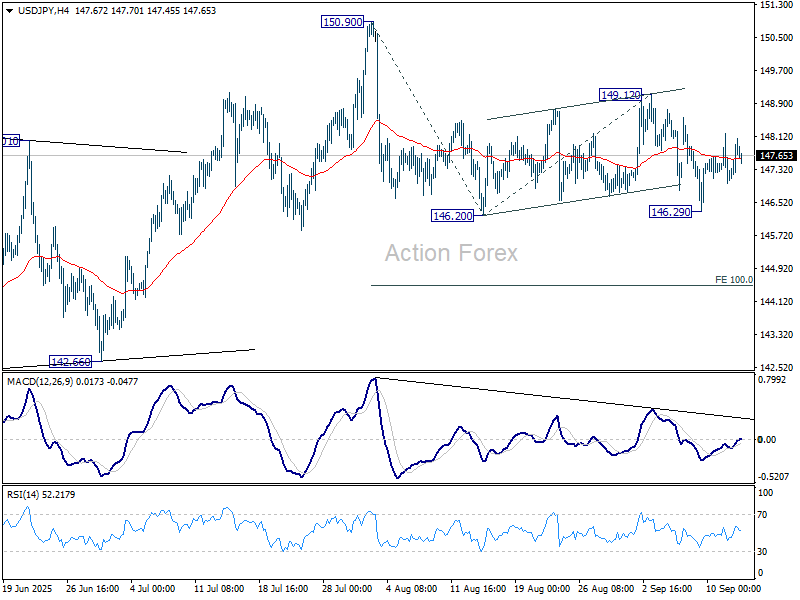
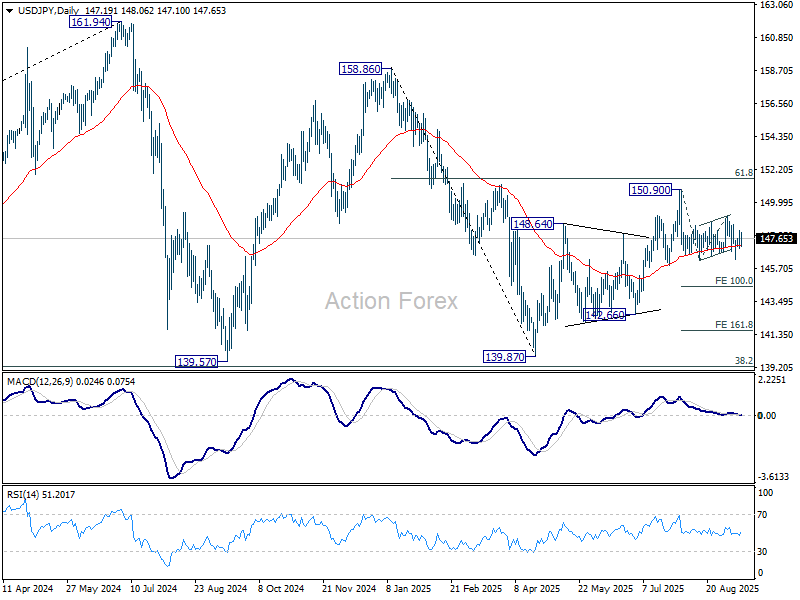
USD/JPY edged lower to 146.29 last week but quickly recovered. Initial bias remains neutral this week first. Further fall is in favor as long as 149.12 resistance holds. Firm break of 146.29 will solidify the case that whole rebound from 139.87 has completed with three waves up to 150.90. Deeper decline should then be seen to 100% projection of 150.90 to 146.20 from 149.12 at 144.42.
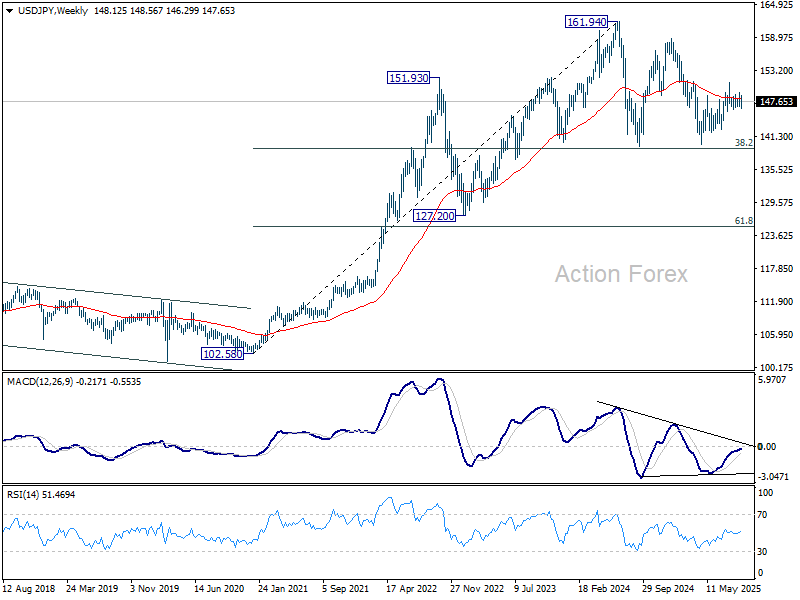
In the bigger picture, price actions from 161.94 (2024 high) are seen as a corrective pattern to rise from 102.58 (2021 low). Decisive break of 61.8% retracement of 158.86 to 139.87 at 151.22 will argue that it has already completed with three waves at 139.87. Larger up trend might then be ready to resume through 161.94 high. In case the corrective pattern extends with another fall, strong support is expected from 38.2% retracement of 102.58 to 161.94 at 139.26 to bring rebound.
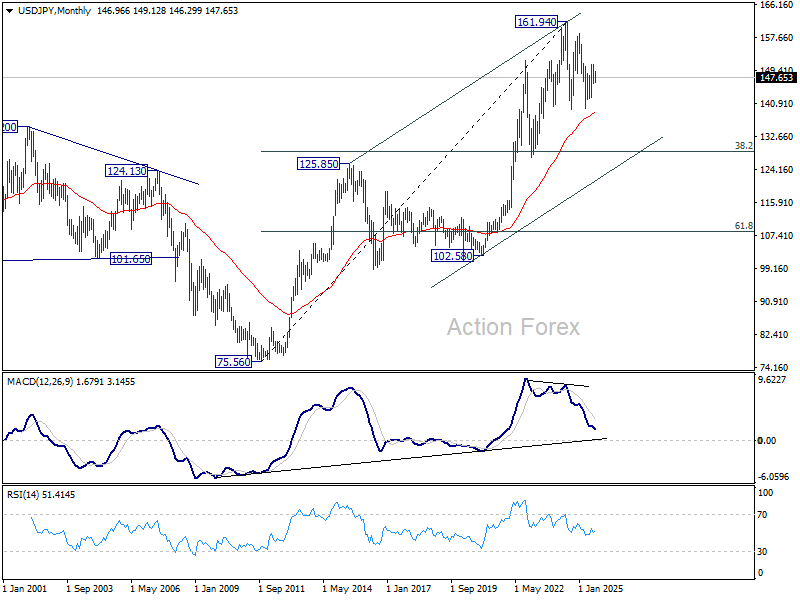
In the long term picture, there is no sign that up trend from 75.56 (2011 low) has completed. But then, firm break of 161.94 is needed to confirm resumption. Otherwise, more medium term range trading could still be seen.
GBP/USD Weekly Outlook
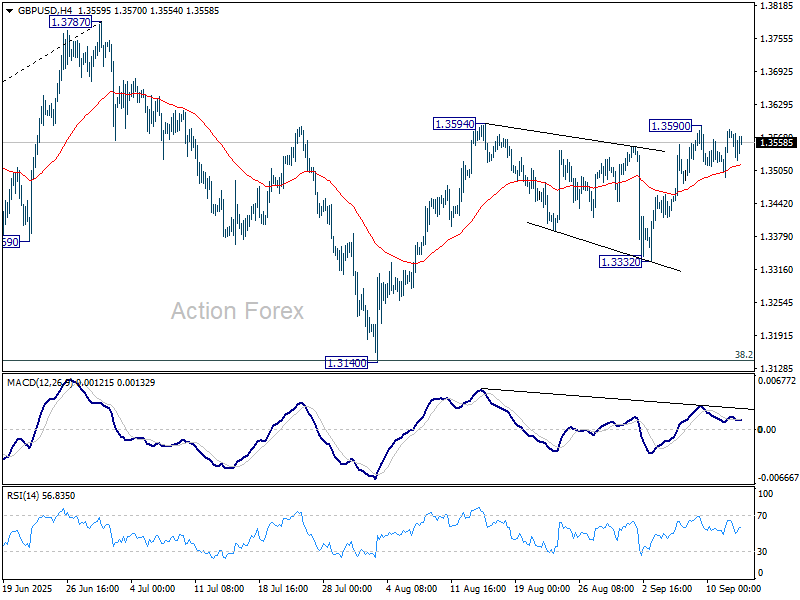
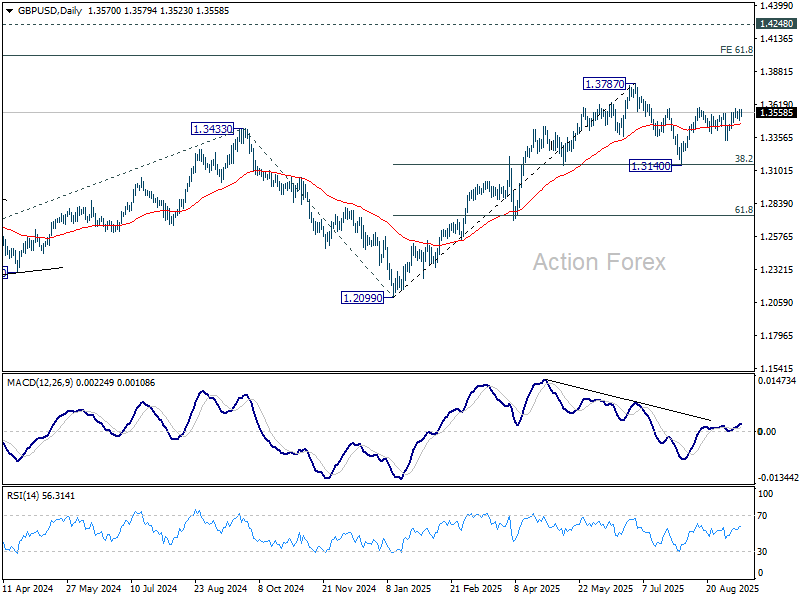
GBP/USD failed to break through 1.3594 resistance last week and turned sideway. Initial bias remains neutral this week first. Further rally is expected as long as 1.3332 support holds. Firm break of 1.3594 will resume the rebound from 1.3140 to retest 1.3787 high. Decisive break there will resume larger up trend.
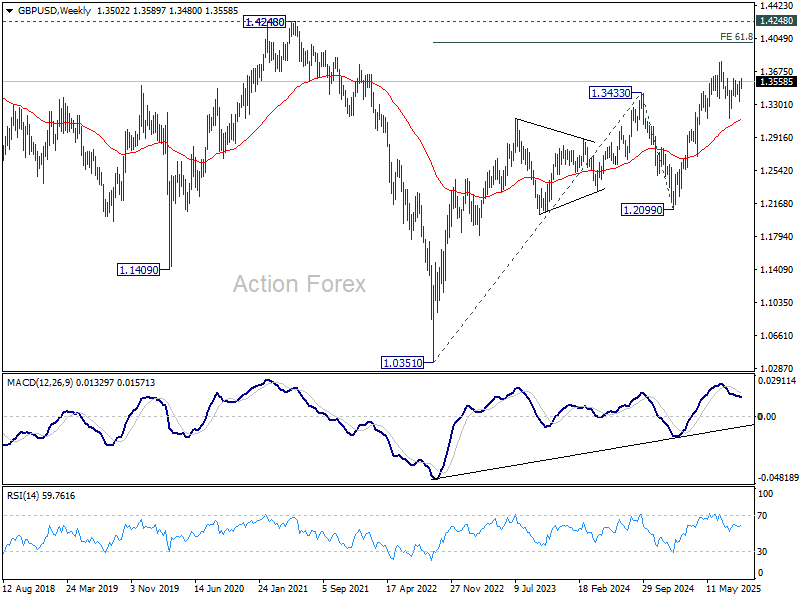
In the bigger picture, up trend from 1.3051 (2022 low) is in progress. Next medium term target is 61.8% projection of 1.0351 to 1.3433 from 1.2099 at 1.4004. Outlook will now stay bullish as long as 55 W EMA (now at 1.3118) holds, even in case of deep pullback.
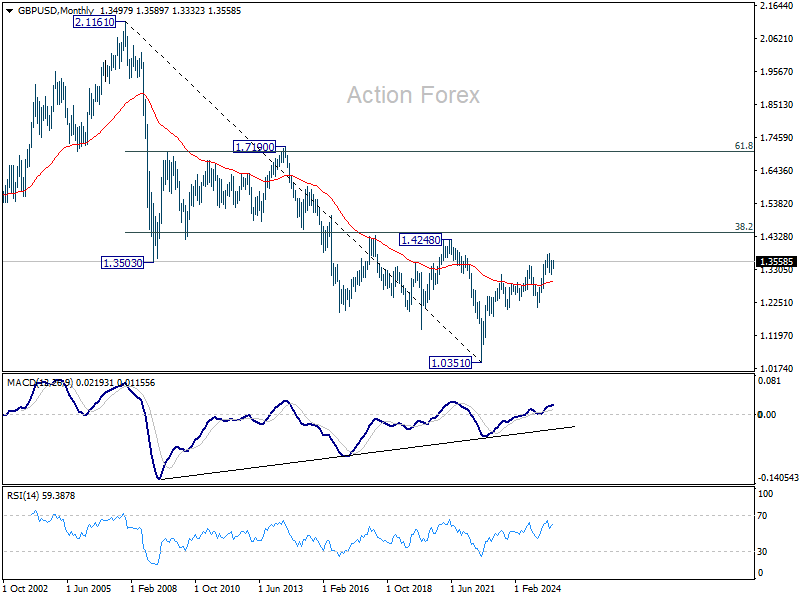
In the long term picture, for now, price actions from 1.0351 (2022 low) are still seen as a corrective pattern to the long term down trend from 2.1161 (2007 high) only. However, firm break of 1.4248 resistance (38.2% retracement of 2.1161 to 1.0351 at 1.4480) will be a strong sign of long term bullish reversal.
USD/CHF Weekly Outlook
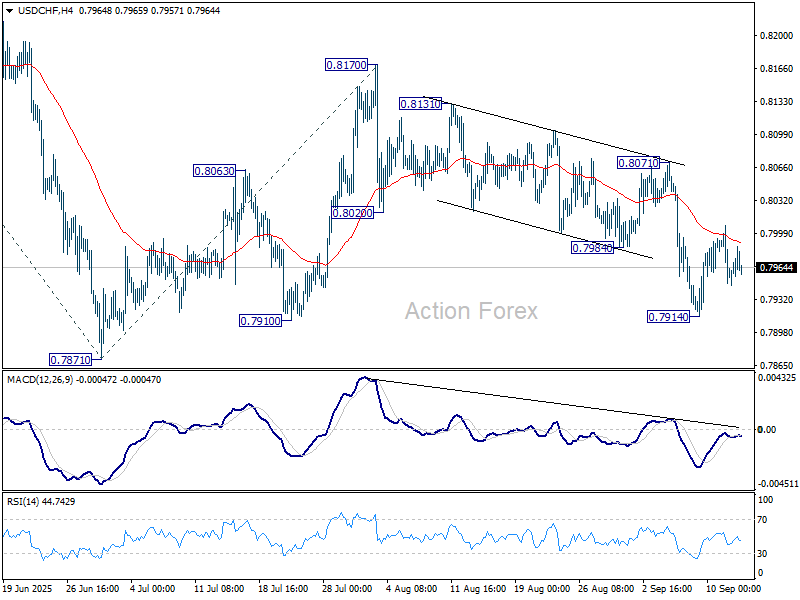
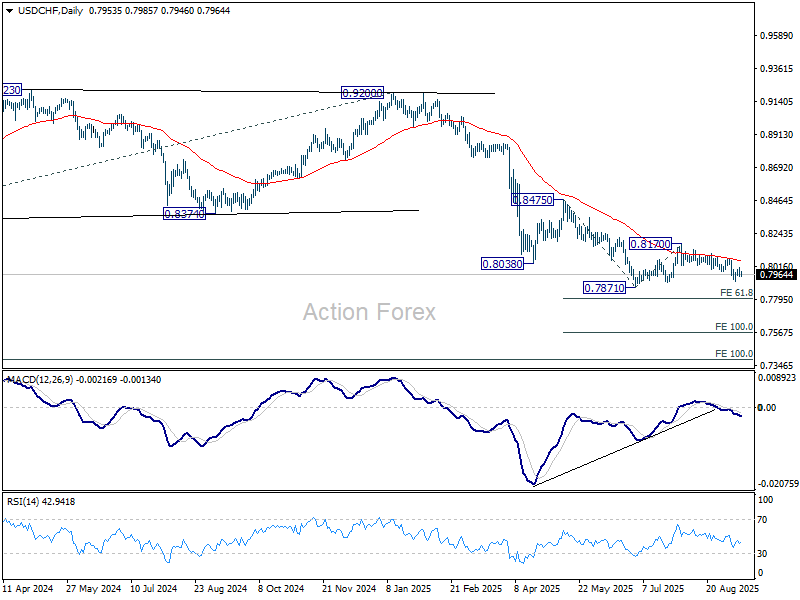
USD/CHF edged lower to 0.7914 last week but recovered since then. Initial bias remains neutral this week for some more consolidations. But further fall is expected as long as 0.8071 resistance holds. Below 0.7914 will bring retest of 0.7871 low. Decisive break there will resume larger down trend to 61.8% projection of 0.8475 to 0.7871 from 0.8170 at 0.7797.
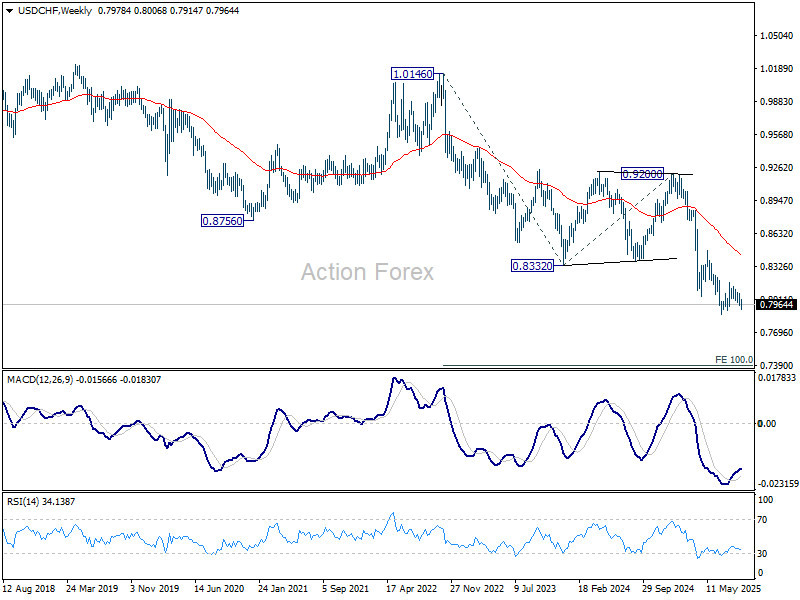
In the bigger picture, long term down trend from 1.0342 (2017 high) is still in progress. Next target is 100% projection of 1.0146 (2022 high) to 0.8332 from 0.9200 at 0.7382. In any case, outlook will stay bearish as long as 0.8332 support turned resistance holds.
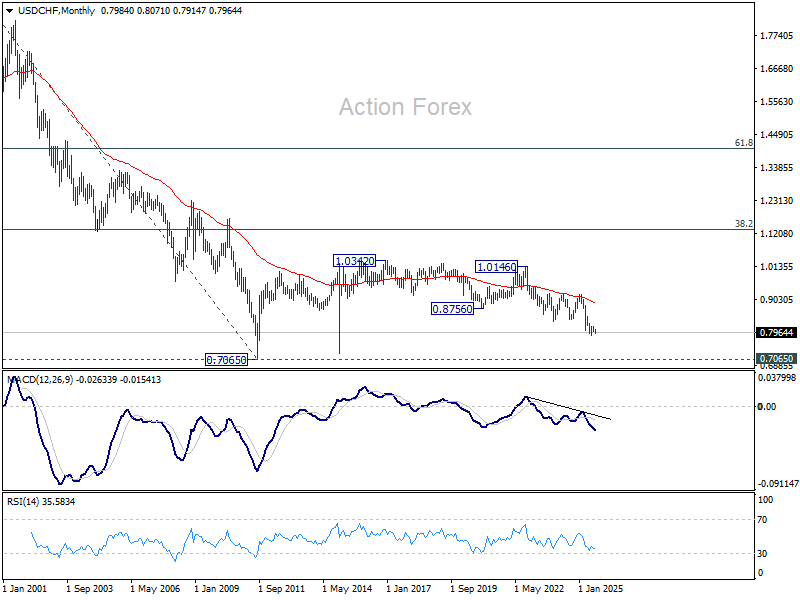
In the long term picture, price action from 0.7065 (2011 low) are seen as a corrective pattern to the multi-decade down trend from 1.8305 (2000 high). It's uncertain if the fall from 1.0342 is the second leg of the pattern, or resumption of the downtrend. But in either case, outlook will stay bearish as long as 0.9200 resistance holds. Retest of 0.7065 should be seen next.
AUD/USD Weekly Report
AUD/USD's rise from 0.5913 resumed through 0.6624 resistance last week. There is no sign of topping yet, and initial bias stays on the upside. Next target is 0.6713 fibonacci level. Firm break there will carry larger bullish implications. On the downside, below 0.6589 minor support will turn bias neutral and bring consolidations first, before staging another rally.
In the bigger picture, there is no clear sign that down trend from 0.8006 (2021 high) has completed. Rebound from 0.5913 is seen as a corrective move. While stronger rally cannot be ruled out, outlook will remain bearish as long as 38.2% retracement of 0.8006 to 0.5913 at 0.6713 holds. Nevertheless, considering bullish convergence condition in W MACD, sustained break of 0.6713 will be a strong sign of bullish trend reversal, and path the way to 0.6941 structural resistance for confirmation.
In the long term picture, fall from 0.8006 is seen as the second leg of the corrective pattern from 0.5506 long term bottom (2020 low). Hence, in case of deeper decline, strong support should emerge above 0.5506 to contain downside to bring reversal. On the upside, firm break of 0.6941 will argue that the third leg has already started back to 0.8006.
USD/CAD Weekly Outlook
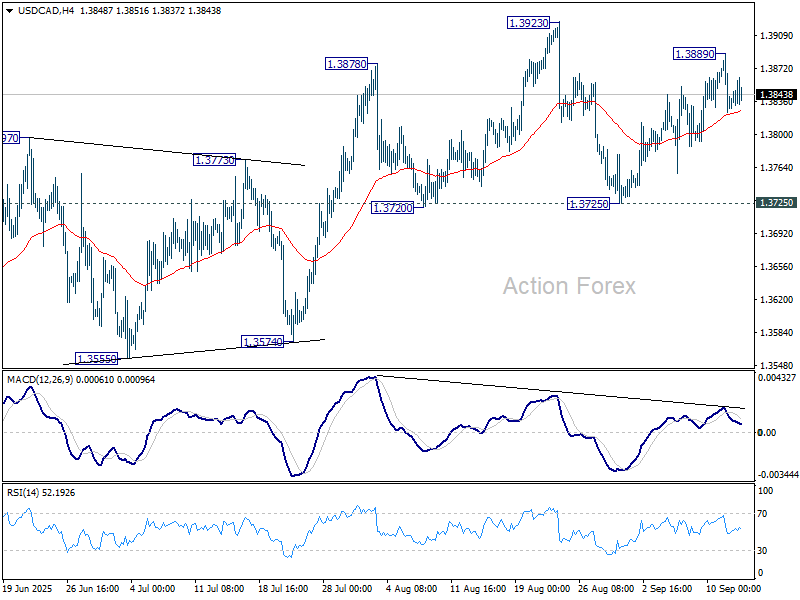
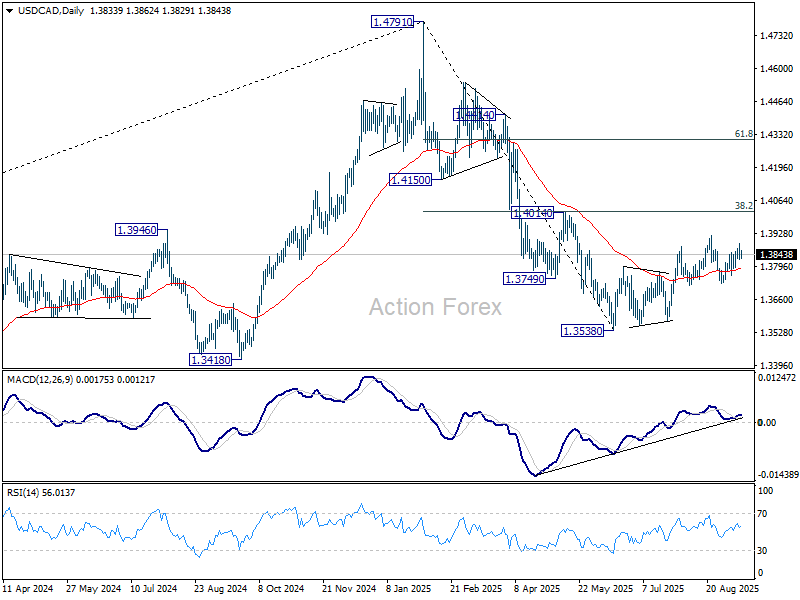
USD/CAD recovered to 1.3889 last week but lost momentum since then. Initial bias remains neutral this week first. On the downside, firm break of 1.3725 support will indicate that corrective rebound from 1.3538 has already completed, and turn near term outlook bearish. However, break of 1.3923 will resume the rebound towards 1.4014 cluster resistance.
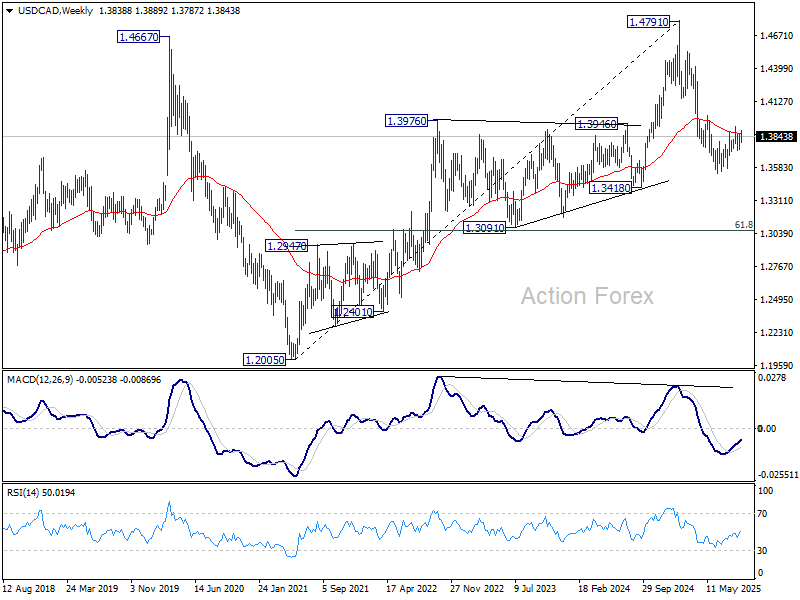
In the bigger picture, price actions from 1.4791 medium term top could either be a correction to rise from 1.2005 (2021 low), or trend reversal. In either case, further decline is expected as long as 1.4014 cluster resistance (38.2% retracement of 1.4791 to 1.3538 at 1.4017) holds. Next target is 61.8% retracement of 1.2005 (2021 low) to 1.4791 at 1.3069.
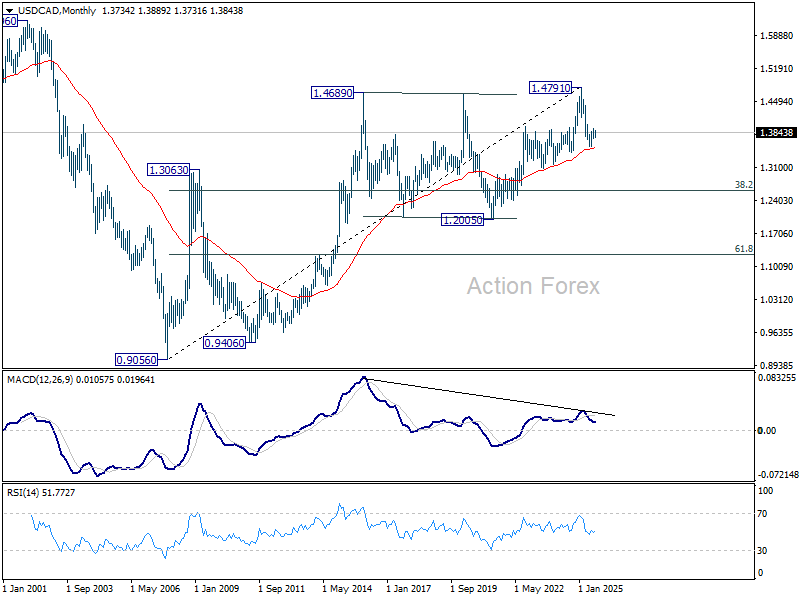
In the long term picture, considering bearish divergence condition in M MACD, up trend from 0.9506 (2027 low) might have completed with five waves up to 1.4791. Sustained trading below 55 M EMA (now at 1.3511) will solidify this case and bring deeper medium term fall to 38.2% retracement of 0.9056 to 1.4791 at 1.2600, even as a correction. Nevertheless, strong rebound from the 55 E MEA will retain bullishness for up trend resumption through 1.4791 later.
GBP/JPY Weekly Outlook
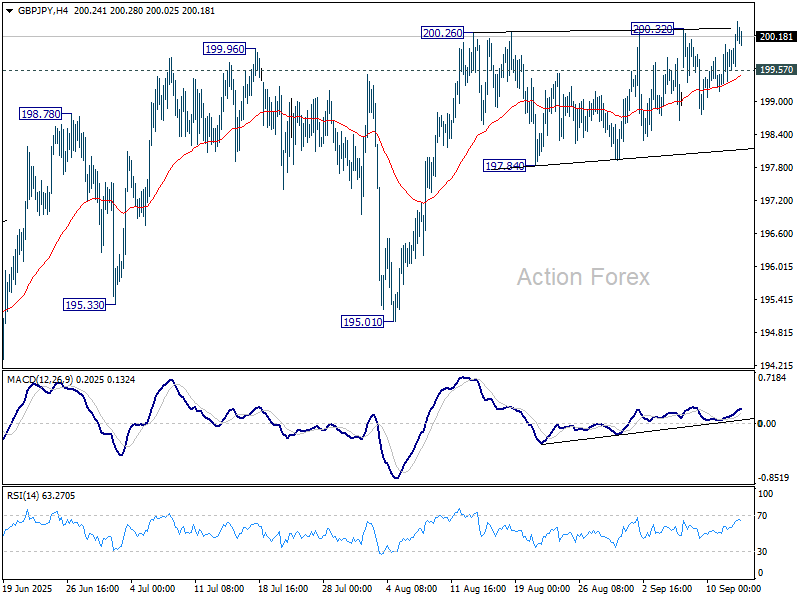
GBP/JPY's late breach of 200.26/32 resistance suggests that rise from 184.35 is resuming. Initial bias is mildly on the upside this week. Sustained trading above 200.32 will target 100% projection of 180.00 to 199.79 from 184.35 at 204.14. Nevertheless, break of 199.57 minor support will delay the bullish case and turn intraday bias neutral again.
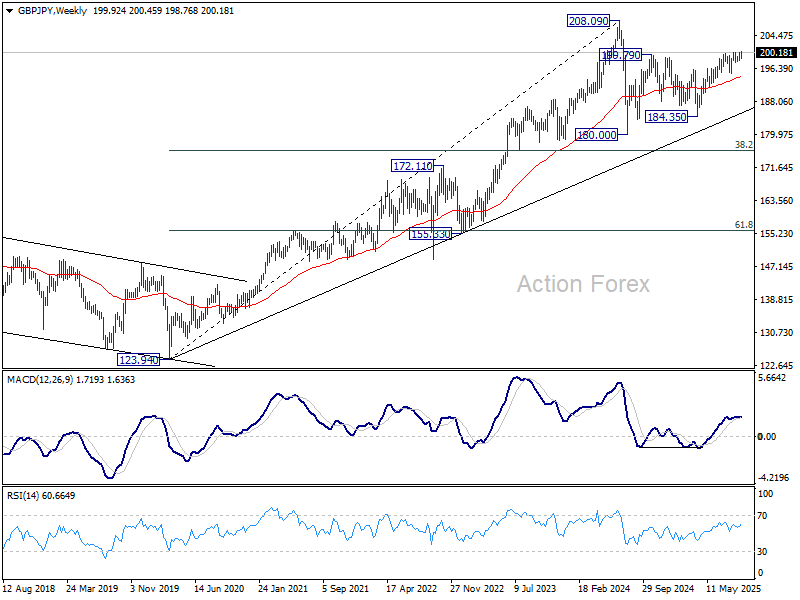
In the bigger picture, price actions from 208.09 (2024 high) are seen as a correction to rally from 123.94 (2020 low). The pattern might still extend with another falling leg. But in that case, strong support should be seen from 38.2% retracement of 123.94 to 208.09 at 175.94 to contain downside. Meanwhile, decisive break of 208.09 will confirm long term up trend resumption.
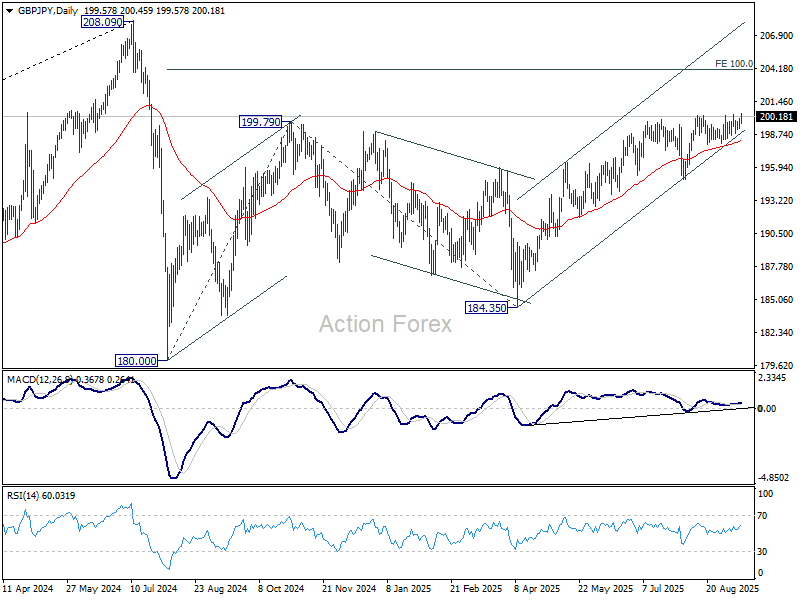
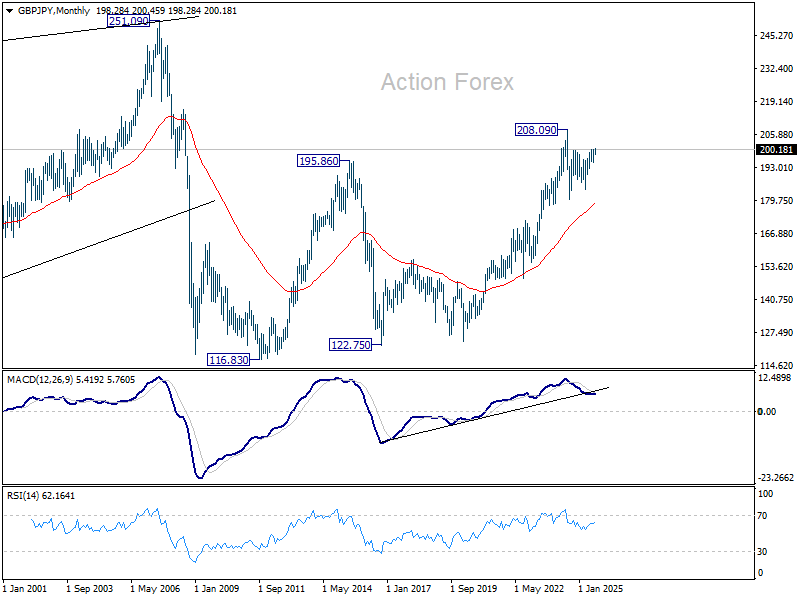
In the long term picture, there is no sign that the long term up trend from 122.75 (2016 low) has concluded. But firm break of 208.09 is needed to confirm resumption. Otherwise, more medium term range trading could still be seen.
EUR/JPY Weekly Outlook
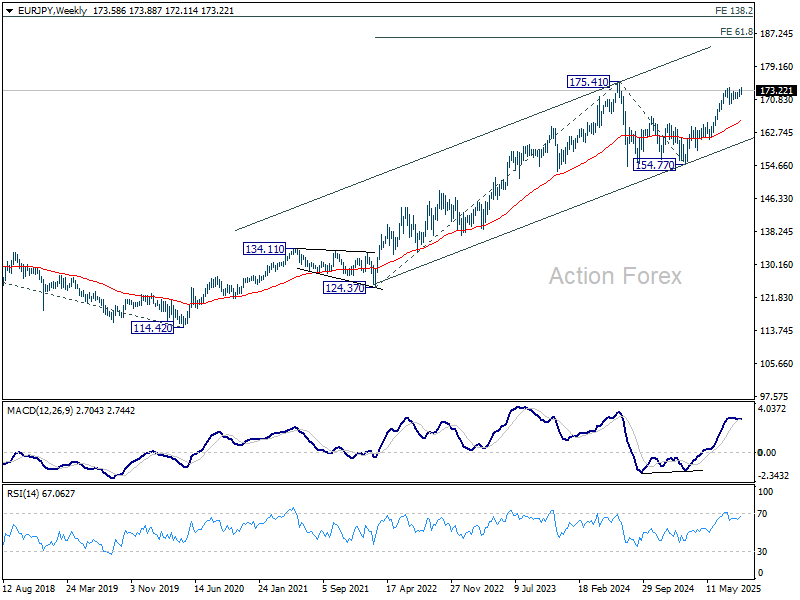
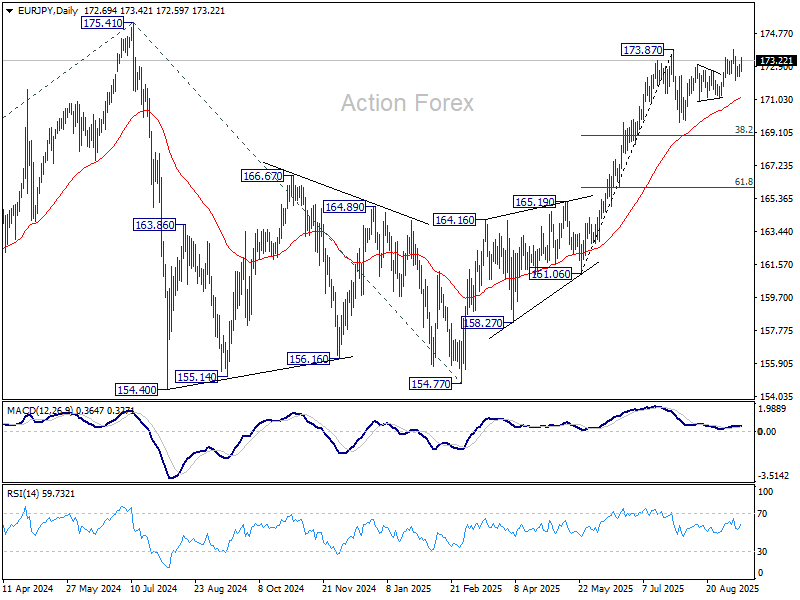
EUR/JPY edged higher to 173.88 last week, but was rejected by 173.87 resistance and retreated. Initial bias stays neutral this week first. On the upside, firm break of 173.87/8 will resume the rally from 154.77 to retest 175.41 high. However, break of 172.11 will extend the corrective pattern from 173.87 with another fall. Bias will be back to the downside for 171.09 support first.
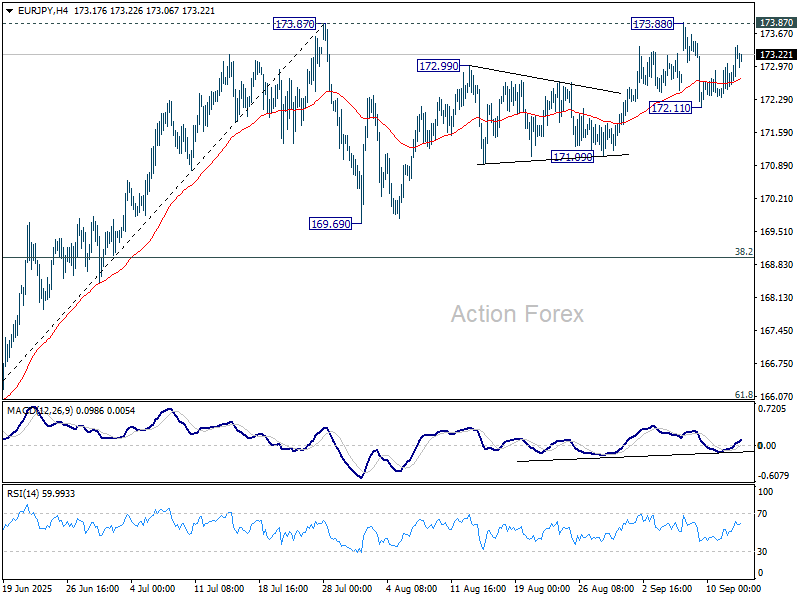
In the bigger picture, current rally from 154.77 is still tentatively seen as resuming the larger up trend. Firm break of 175.41 (2024 high) will confirm and target 61.8% projection of 124.37 to 175.41 from 154.77 at 186.31. However, sustained break of 38.2% retracement of 161.06 to 173.87 at 168.97 will delay this bullish case, and probably extend the correction from 175.41 with another fall.
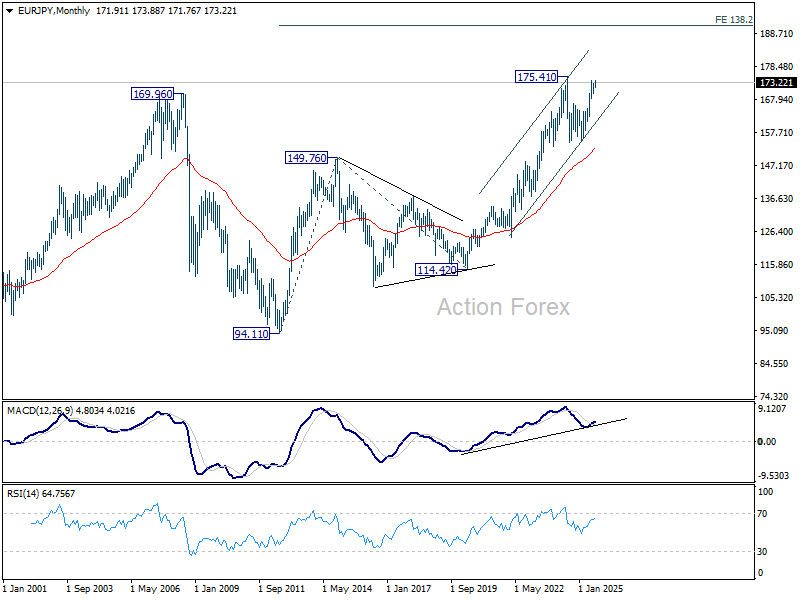
In the long term picture, up trend from 94.11 (2021 low) is still in progress. On resumption, next target is 138.2% projection of 94.11 to 149.76 (2014 high) from 114.42 (2020 low) at 191.32.