Sample Category Title
Markets Rally as Fed Dovish Shift Seen Certain, TikTok Framework Struck
Risk appetite in the U.S. stayed strong overnight, with both S&P 500 and NASDAQ closing at fresh record highs. Traders leaned further into risk assets as confidence grew that the Federal Reserve will restart its easing cycle this week. Additional support came from news that Washington and Beijing had reached a “framework” agreement over TikTok, easing one source of bilateral tension.
The Fed narrative remains central. Markets are almost certain the FOMC will cut rates, a view reinforced by Monday’s confirmation of Trump nominee Stephen Miran to the Fed Board. His participation in this week’s meeting makes a rate cut even more certain.
At the same time, a U.S. appeals court ruled that Trump cannot remove Governor Lisa Cook before the decision. While that ensures her vote is also in play, it shouldn't deter Fed from the expected rate move.
Currency markets reflected the dovish Fed theme, with broad Dollar weakness persisting. The selloff helped propel Gold to a fresh record high too. Among majors, Aussie and Kiwi traded slightly softer, the Loonie showed surprise strength, and Yen found support. European currencies were mixed in the middle. Though positioning remains fluid heading into event-heavy sessions.
On the trade front, Treasury Secretary Scott Bessent announced that the U.S. and China had reached a “framework” agreement on TikTok, which could pave the way toward U.S.-controlled ownership of the platform. Chinese negotiator Li Chenggang confirmed the framework, though he urged Washington not to continue suppressing Chinese companies.
Looking ahead, the data calendar is busy. UK employment and Germany’s ZEW survey headline the European session, while Canada’s CPI and U.S. retail sales are the main attractions later in the day. UK jobs and Canadian inflation carry the most potential to move markets. But all eyes remain on the Fed, where policy direction will set the tone for global markets into year-end.
In Asia, at the time of writing, Nikkei is up 0.59%. Hong Kong HSI is up 0.08%. China Shanghai SSE is down -0.10%. Singapore Strait Times is down -0.07%. Japan 10-year JGB yield is flat at 1.603. Overnight, DOW rose 0.11%. S&P 500 rose 0.47%. NASDAQ rose 0.94%. 10-year yield fell -0.027 to 4.034.
RBA’s Hunter: Inflation near target, monitoring consumer strength
RBA Assistant Governor Sarah Hunter said today the central bank is “close to getting inflation to target,” with risks around the outlook now appearing "balanced". She emphasized that monetary policy works with a delay and must remain forward looking.
Hunter also noted that household spending has “picked up a bit,” with consumption showing signs of improvement and the broader position “beginning to turn over.” She added the RBA is “very closely monitoring” the underlying strength of consumer demand as it seeks to keep the economy near full employment.
July’s CPI outcome was partly affected by timing of rebates, she explained, while core inflation appears broadly in line with forecasts.
EUR/USD Daily Outlook
Daily Pivots: (S1) 1.1728; (P) 1.1751; (R1) 1.1786; More...
Intraday bias in EUR/USD is back on the upside with breach of 1.1779 resistance. Rise from 1.1390 should extend to retest 1.1829 high. Firm break there will resume larger up trend to 1.1916 projection level next. On the downside, below 1.1715 minor support will turn intraday bias neutral again first.

In the bigger picture, rise from 0.9534 (2022 low) long term bottom could be correcting the multi-decade downtrend or the start of a long term up trend. In either case, further rise should be seen to 100% projection of 0.9534 to 1.1274 from 1.0176 at 1.1916. This will remain the favored case as long as 55 W EMA (now at 1.1215) holds.

GBP/USD Price Action – Bulls In Control, More Gains Possible
Key Highlights
- GBP/USD extended gains and traded above 1.3550.
- It cleared a contracting triangle with resistance at 1.3575 on the 4-hour chart.
- EUR/USD might continue to rise if it clears the 1.1800 resistance.
- The UK Claimant count could change by 20.3K in Aug 2025.
GBP/USD Technical Analysis
The British Pound started a fresh increase above 1.3500 against the US Dollar. GBP/USD gained bullish momentum above 1.3550 before it faced some resistance.
Looking at the 4-hour chart, the pair remained supported and settled above the 1.3550 level, the 100 simple moving average (red, 4-hour), and the 200 simple moving average (green, 4-hour). If the bulls remain in action, there could be more gains.
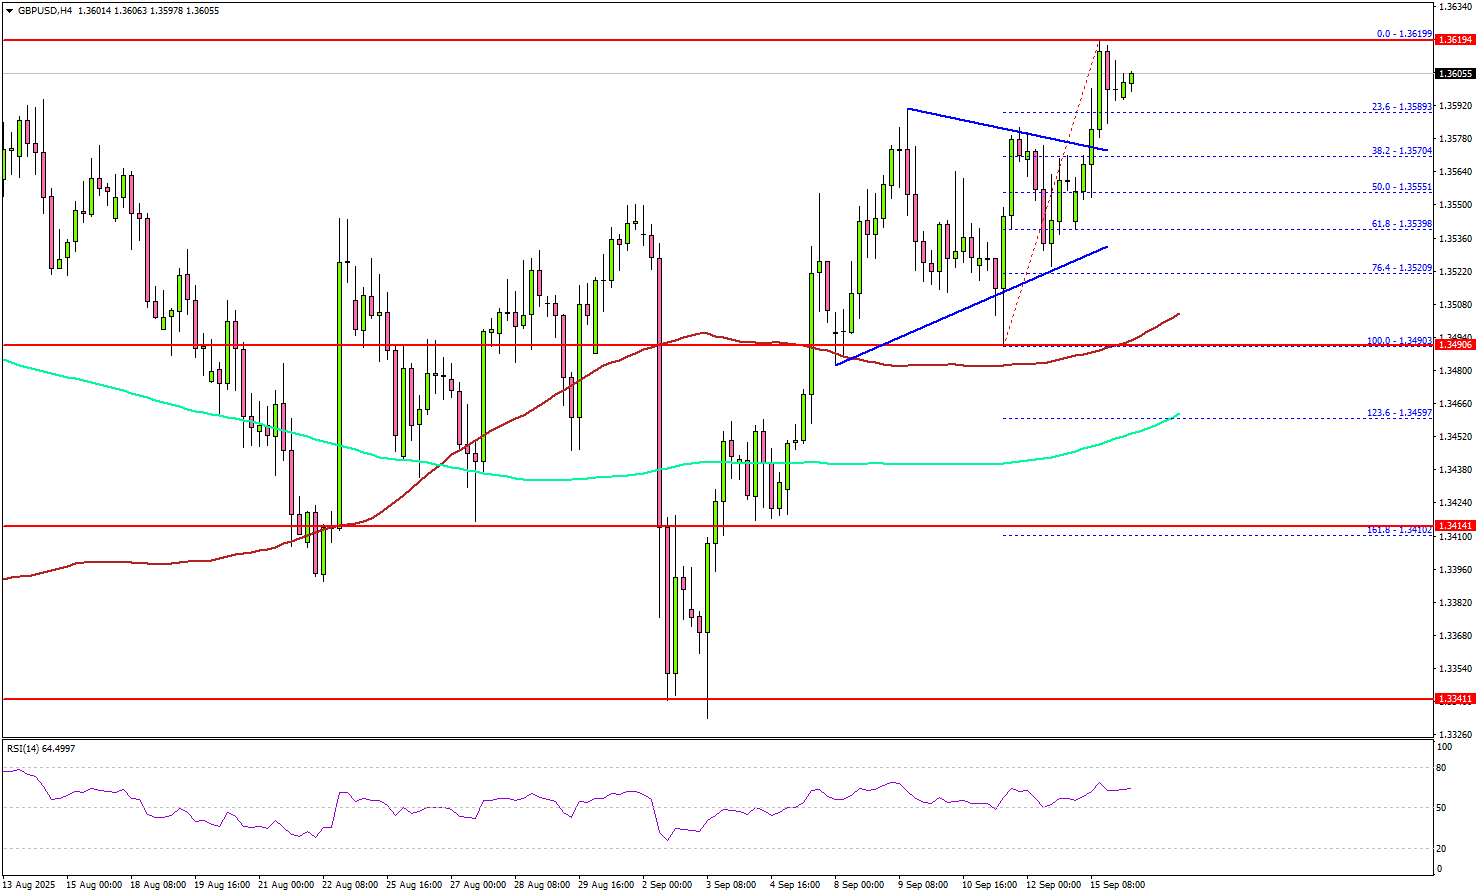
On the upside, the pair could face resistance near the 1.3620 level. The first major hurdle for the bulls could be 1.3650. A close above 1.3650 could set the pace for another increase.
In the stated case, the pair could rise toward 1.3800, above which the bulls could aim for a move toward 1.3840. Any more upsides could send the pair toward 1.3950.
On the downside, immediate support is 1.3570. The next key area of interest might be near the 1.3550 zone and the 50% Fib retracement level of the upward move from the 1.3490 swing low to the 1.3619 high.
The main support could be at 1.3500 and the 100 simple moving average (red, 4-hour). Any more losses might increase selling pressure and send GBP/USD toward 1.3440.
Looking at EUR/USD, the bulls remained in action, and they were able to push the price above the 1.1750 resistance zone.
Upcoming Key Economic Events:
- UK Claimant Count Change for Aug 2025 – Forecast 20.3K, versus -6.2K previous.
- UK ILO Unemployment Rate for July 2025 (3M) – Forecast 4.7%, versus 4.7% previous.
- US Retail Sales for August 2025 (MoM) – Forecast +0.3%, versus +0.5% previous.
RBA’s Hunter: Inflation near target, monitoring consumer strength
RBA Assistant Governor Sarah Hunter said today the central bank is “close to getting inflation to target,” with risks around the outlook now appearing "balanced". She emphasized that monetary policy works with a delay and must remain forward looking.
Hunter also noted that household spending has “picked up a bit,” with consumption showing signs of improvement and the broader position “beginning to turn over.” She added the RBA is “very closely monitoring” the underlying strength of consumer demand as it seeks to keep the economy near full employment.
July’s CPI outcome was partly affected by timing of rebates, she explained, while core inflation appears broadly in line with forecasts.
Guide to FOMC Statement and September SEP: Key Takeaways and What to Watch
The most important day in a few trading months is coming up fast (two days left!).
The September FOMC rate decision is part of four quarterly meetings where key economic projections (SEP or Summary of Economic Projections) are published (don't forget the 4 other meetings). They take place in March, June, September and December.
These quarterly meetings tend to hold higher weight on potential changes to the FED's tone. With Wednesday's meeting in focus, markets are preparing for a change in tone and changing SEPs.
While the decision itself may not surprise (25 bps is heavily priced in and should be the basis except for any surprise), the details in the projections and Powell’s tone at the press conference will dictate the market reaction.
One good thing to do is to also follow any pre-FOMC post from Wall Street Journal's Nick Timiraos who re-guided wrongly priced markets during the 2022 hike cycle and is considered as an insider. The FED "leaks" their own info that way to avoid shaking markets too suddenly, with the US dollar's central role in the global economy – As a reminder, FED members cannot speak on the Economic or financial outlook two weeks before the FOMC meeting in what is called the "Blackout period".
Don't forget to also check out our freshly released Podcast with discussions on the upcoming FOMC.
(and Too Long, Didn't Read recap further down if needed).
What to take from the previous meeting
At the previous meeting (July 30, 2025), Powell struck a balanced but cautious tone amid still high tariff uncertainty.
He acknowledged progress on disinflation but highlighted tariff-driven risks to the inflation outlook. His remarks left the door open to cuts later in the year, but the Fed emphasized it would remain data-dependent.
The June last SEP reflected this stance: inflation forecasts were nudged slightly lower, growth remained resilient, and the famous dot plot still suggested two cuts before year-end — a point markets have since debated heavily.
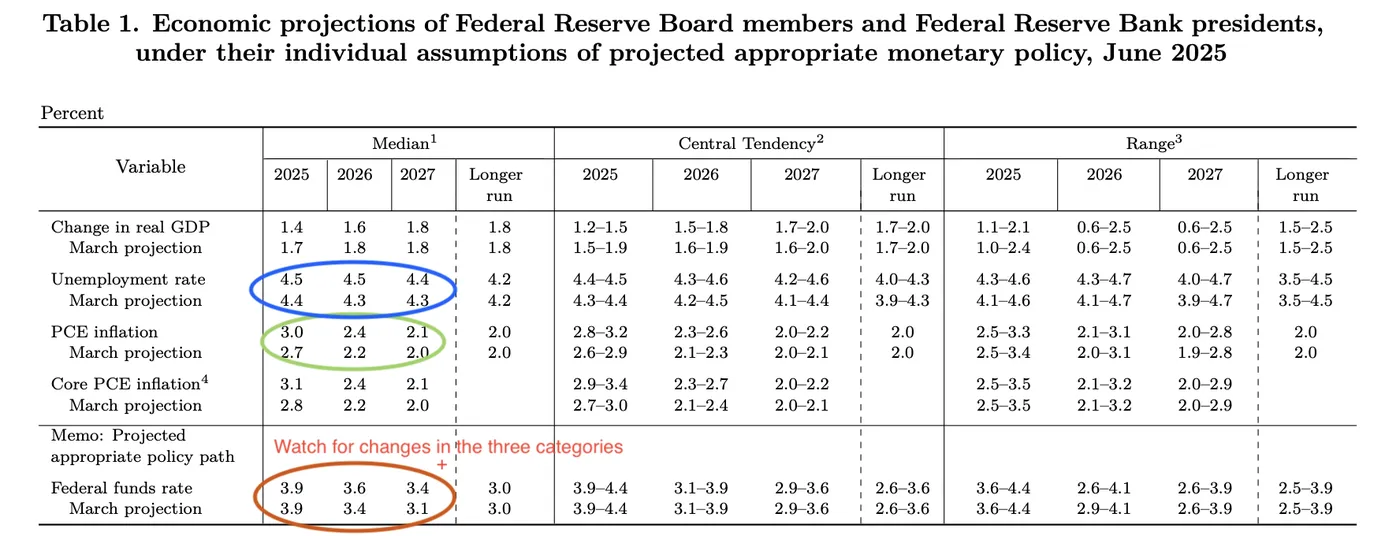
June 2025 SEP, source: Federal Reserve
What to watch in the September SEP
- Dot Plot: The median projection for rate cuts will be the market’s first checkpoint. A shift from two cuts to one would reinforce a hawkish narrative, while holding steady would keep the Fed aligned with current pricing.
- Inflation forecasts (Core PCE, PCE): Expect markets to scrutinize whether tariffs are raising the Fed’s inflation expectations. Any upward revision would challenge the softening CPI and PPI figures released this week and the change in tone from Powell's Jackson Hole speech. The inflation projections might be revised upward in 2025 and down in later year: Major key is to watch 2026 PCE projections and onwards to get a glimpse of 2026 cut pricing (currently 140 bps are priced in).
- Unemployment rate: A move higher would confirm the gradual softening already seen in recent jobs reports – A sudden rise in this could shift the pace of cuts priced in.
What was said in Powell's previous FOMC speech?
You can access Powell's July FOMC speech right here. I also invite you to balance these comments with what was said in his Jackson Hole speech (link available just above).
Through his July speech, Powell emphasized the FED's dual mandate (inflation and maximum employment) and could be expected to put an extra emphasis on the employment mandate with the Labor market data degrading.
He also emphasized a moderating economic activity with tariff uncertainty (uncertainty should be expected to get less mentions).
Reading Jerome Powell’s speech.
Markets know by now that Powell’s tone matters as much as the text. Expect sharp reactions to how he balances:
- Confidence in inflation trending lower vs. caution about tariff pass-through.
- Reassurance on labor market strength vs. acknowledgment of weakness in recent payrolls.
- Whether he hints at future financial stability concerns, particularly with equities and crypto markets surging.
Analysts tend to highlight the number of mentions for elements like: Employment/unemployment, inflation, tariffs etc to spot what the FED will focus on looking forward.
Market dynamics
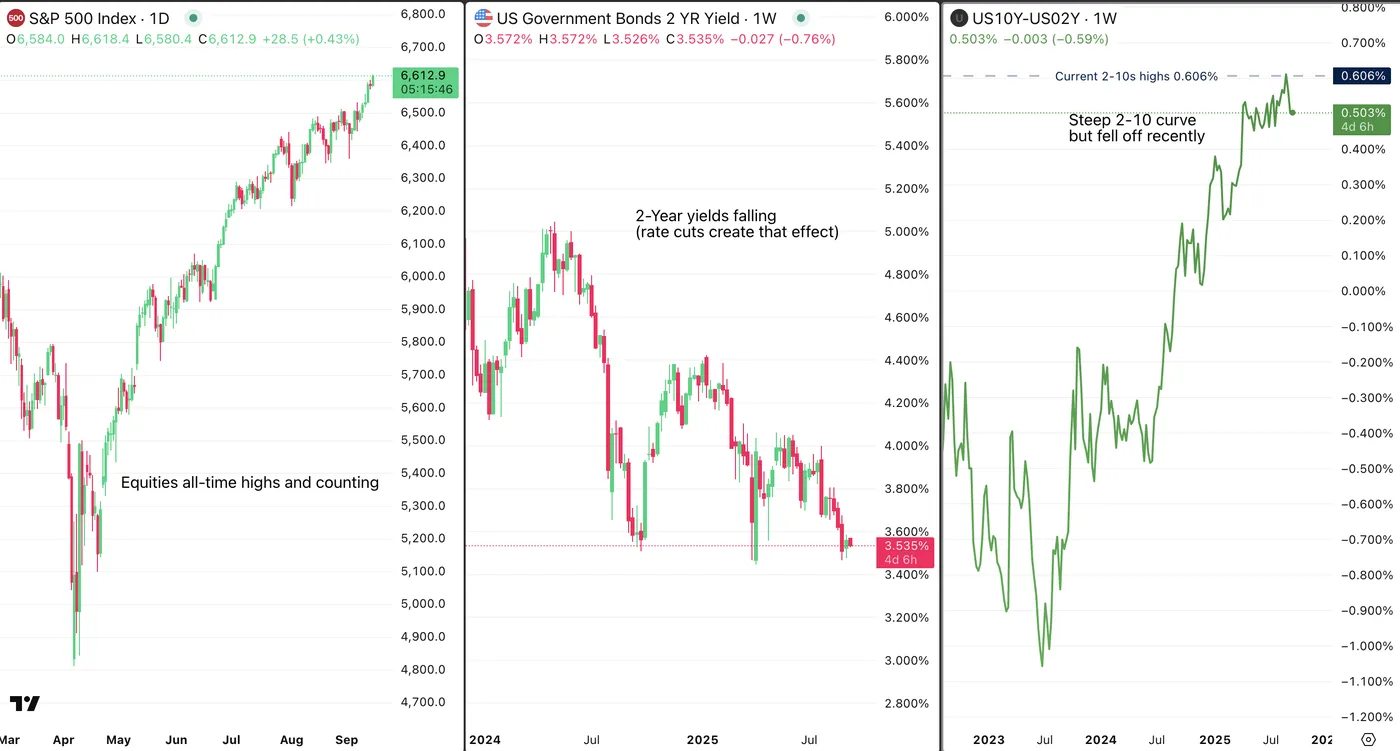
Current state of Markets, September 15, 2025 – Source: TradingView
Bond yields have already been retreating, with the 2Y at its lowest since April’s “Liberation Day” trough. Don't forget to take a look at the 2-10s curve: Currently very steep due to higher short-term cut expectations but higher inflation (= higher long term rates)
Risk assets are at all-time highs, therefore the Markets hold high expectations for a dovish tone, watch out for disappointments !
FX markets remain rangebound, leaving the Dollar Index exposed to any surprises in the dot plot or Powell’s tone – One of the thesis I had been holding is the Seller's inability to reach new lows in a hesitant Dollar, but its reaction is still binary.
With high expectations of a dovish speech, Powell could balance out recent dovish pricing with a more hawkish stance which would strengthen the US Dollar and hurt Equities a bit.
TLDR conclusion: What to focus on for the upcoming FOMC
TL,DR:
- For now a bit less than 75 bps priced in through 25 bps at every meeting.
- SEP: Particularly expected Fed Funds rate in end 2025 and 2026 (Neutral rate should be priced in until then for now) and Core PCE projections.
- More or less mentions of tariffs: Any hints of one time price hikes could bring more cuts in the future. More mentions of uncertainty = less hikes in 2026.
- Labor market and unemployment rate: If see more mentions of degrading employment, it could add more rate cuts more suddenly – Particularly if the FED balances out its dual mandate more towards employment.
- Any hawkishness to balance out the most recent dovish comments and give back some credibility to the FED's independence
Safe trades and a successful FOMC week!
Dollar Falls Which Takes EUR to August Highs – EURUSD and DXY Outlooks
The US dollar finally breaks its range ahead of Wednesday's FOMC as market participants keep placing their pre-Meeting bets.
After holding between 97.50 to 98.50 since August 11th, the Dollar Index has failed to hold support to start this week to regain lows reached in the previous week's downward fakeout.
With Equities rallying to their continued highs, hopes for a dovish cut are extremely optimistic which could lead to some furious reactions.
This move notably weakening the US Dollar also assisted majors like the British Pound and the Aussie to reach new highs.
As a matter of fact, despite the odds for 50 bps retracting from 10% to 4% since Thursday, the US dollar still broke support which could be due to position closing or hedging (more on this in the EURUSD analysis) – Some mean-reversion buying is happening as I write this piece which deserves a close look.
The Euro is also getting close to its August 22 peak which got reached right after Jerome Powell's Jackson Hole speech – As the FOMC approaches, let's have a look at levels for the EURUSD and the Dollar Index.
EURUSD 4H Chart – close to new monthly highs but forms a convergence
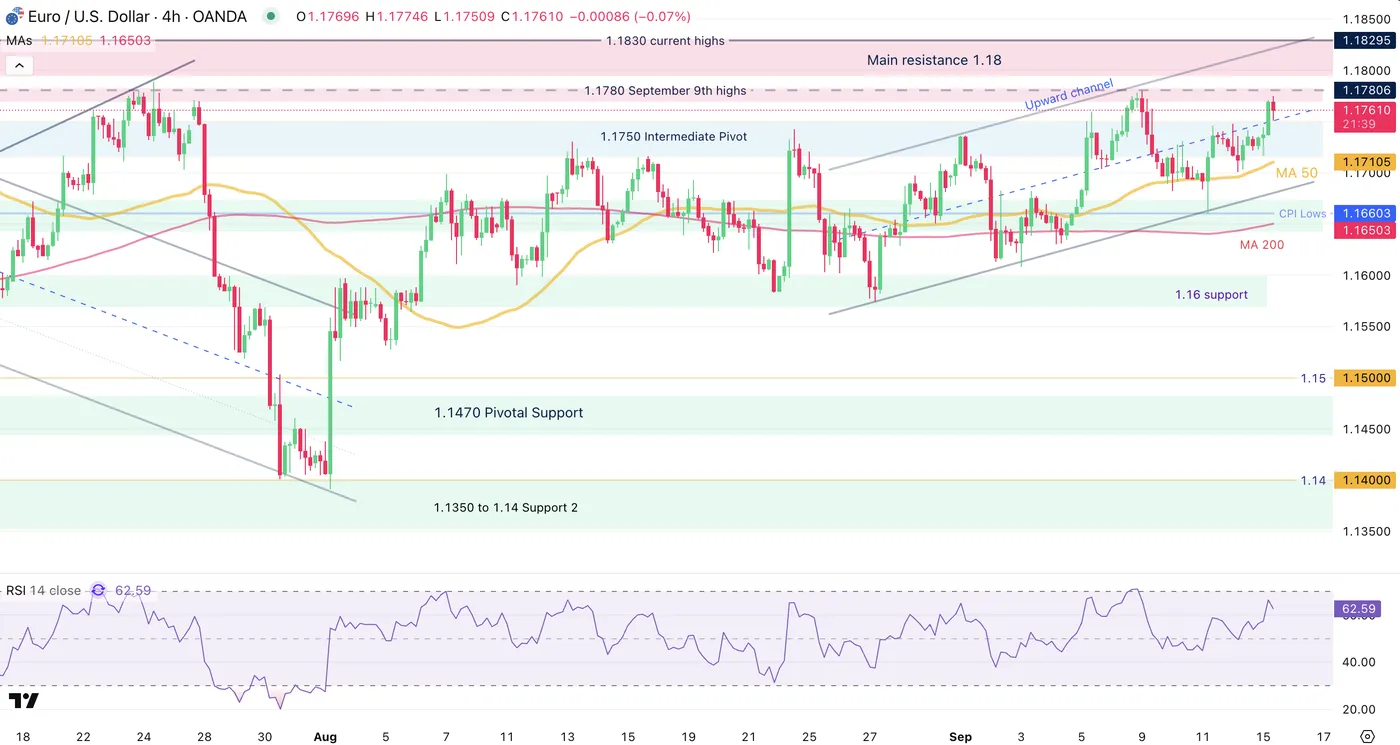
EURUSD 4H Chart, September 15, 2025 – Source: TradingView
Buyers took the most traded currency pair to about 120 pips from its Monthly highs and will have to do more work to reach new highs.
A short-term bearish convergence (where a lower high in price = lower high in RSI) could prevent further movement – Don't forget that even if Market had to retrace from here, rangebound consolidation could impede much movement before.
Nonetheless, the action is still evolving in an upward channel which should be monitored for breakout/continuation scenarios.
A dovish cut from the FED could easily propulse the pair to new yearly highs (currently 1.1830) and vice-versa, but looking at the charts and recent price action, downside reactions could be heavier on a hawkish FED (which would also trigger many other Markets to revert).
Keep a close eye on pre-FOMC trading in the pair, the highest it goes, the more dovish the expectations for Wednesday.
Levels of interest for EURUSD trading:
Resistance Levels:
- 1.1780 September 9th highs
- Main resistance 1.18 to 1.1830 (yearly highs)
- 1.20 psychological level and 2021 highs
Support Levels:
- 1.1750 Intermediate Pivot (+/- 150 pips)
- 1.1650 Key support
- 1.16 Main support
- 1.1470 Pivotal Support (bearish below this)
Dollar Index (DXY) breaks its range support, what next?
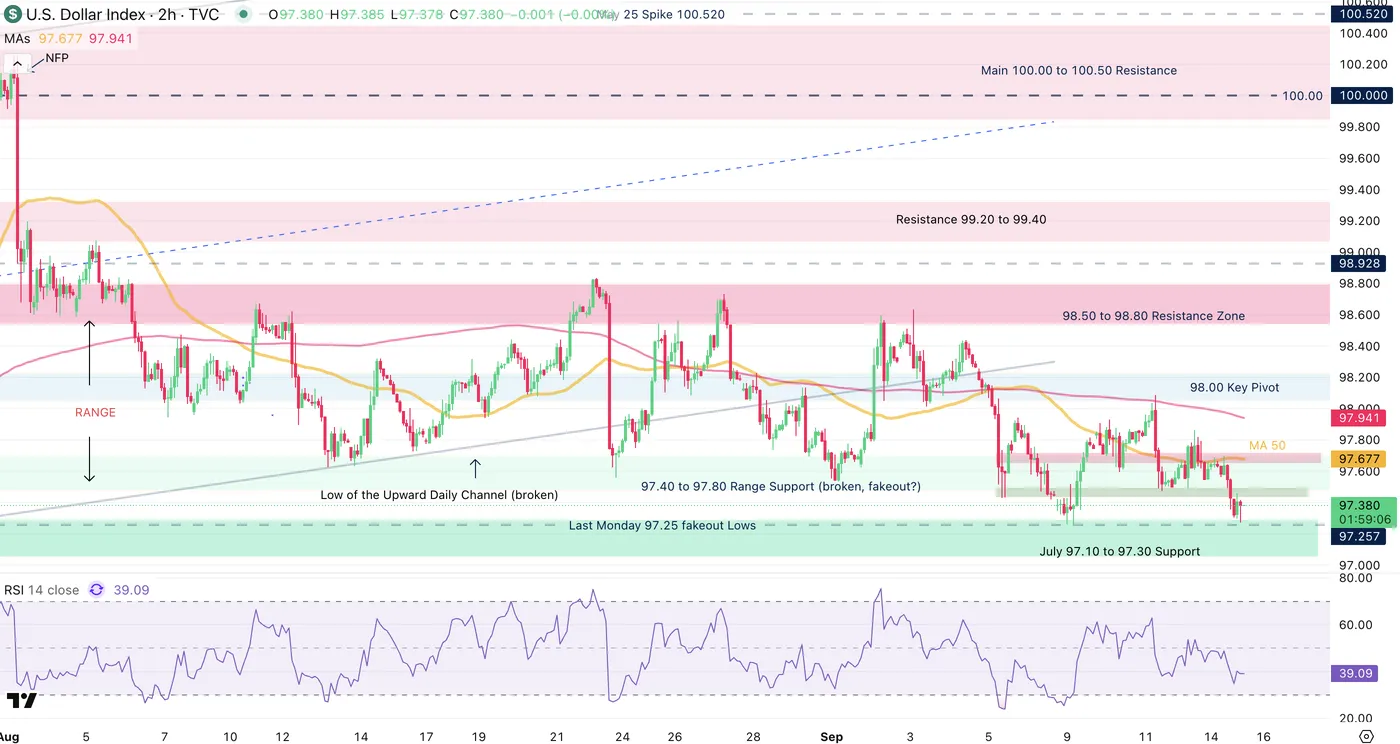
It is surprising to see that the range that held so strongly amid many dovish data points (dovish NFPs, last week's CPI and PPI) just before breaking at the weekly open.
These days, everything can happen in Markets but in the past, action tended to stay more rangebound throughout the first few days of the week before the Wednesday meetings. However, everything is possible!
A test of the past week fakeout-lows is approaching and breaching it could lead to further technical downside.
However, the fundamentals of players putting more positions right before the FOMC are not adding up too much, so my guess would be that participants are currently hedging for a potential 50 bps cut, leading to the current moves.
Watch the 97.25 lows, buyers are currently mean-reverting right just above these lows.
Levels to watch for the Dollar Index:
Support Levels:
- 97.40 to 97.80 Range Support (currently getting broken, fakeout?)
- Last Pivot before run-higher 97.15 Zone acting as Key Support
- 2025 Lows Major support 96.50 to 97.00
Resistance Levels:
- 98.00 Mid-Range pivot
- 98.50 to 98.80 Resistance Zone
- Mid-line of the ascending channel and psychological level 99.50
- 100.00 Main resistance zone
Safe trades and a successful FOMC week!
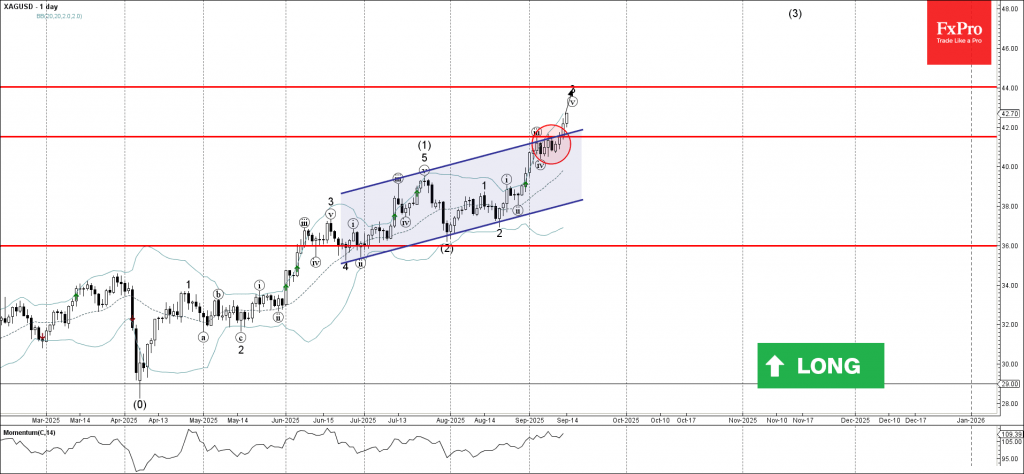
Silver Wave Analysis
Silver: ⬆️ Buy
- Silver broke the resistance area
- Likely to rise to resistance level 44.00
Silver recently broke the resistance area between the key resistance level 41.50 (which stopped the previous impulse wave iii) coinciding with the resistance trendline of the daily up channel from June.
The breakout of this resistance area accelerated the active impulse wave v of the higher-order impulse waves 3 and (3).
Given the clear daily uptrend, Silver can be expected to rise to the next resistance level 44.00, target for the completion of the active impulse wave 3.
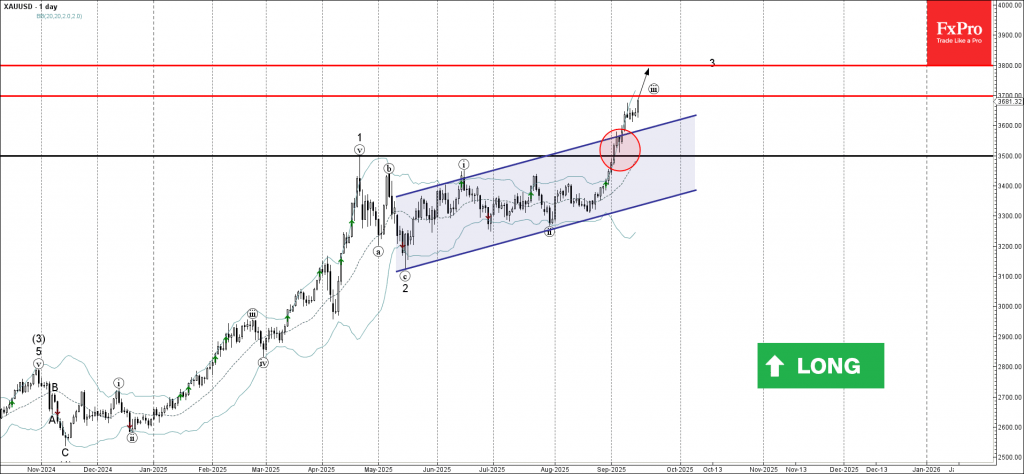
Gold Wave Analysis
Gold: ⬆️ Buy
- Gold broke resistance area
- Likely to rise to resistance levels 3700.00 and 3800.00
Gold recently broke the resistance area between the key resistance level 3500.00 (which stopped the sharp impulse wave 1 in April) and the resistance trendline of the daily up channel from May.
The breakout of this resistance area accelerated the active impulse wave iii of the medium-term impulse wave 3 from the start of May.
Given the clear daily uptrend, Gold can be expected to rise to the next resistance level 3700.00 – followed by 3800.00 (target for the completion of the active impulse wave 3).
Nasdaq-100 Wave Analysis
Nasdaq-100: ⬆️ Buy
- Nasdaq-100 broke key resistance level 24000.00
- Likely to rise to resistance level 25000.00
Nasdaq-100 index recently broke above the key resistance level 24000.00 (upper border of the narrow sideways price range inside which the index has been trading from July).
The breakout of the resistance level 24000.00 accelerated the active impulse wave v of the higher order impulse wave 5 from June.
Given the clear daily uptrend, Nasdaq-100 index can be expected to rise to the next resistance level 25000.00, target for the completion of the active impulse wave v.

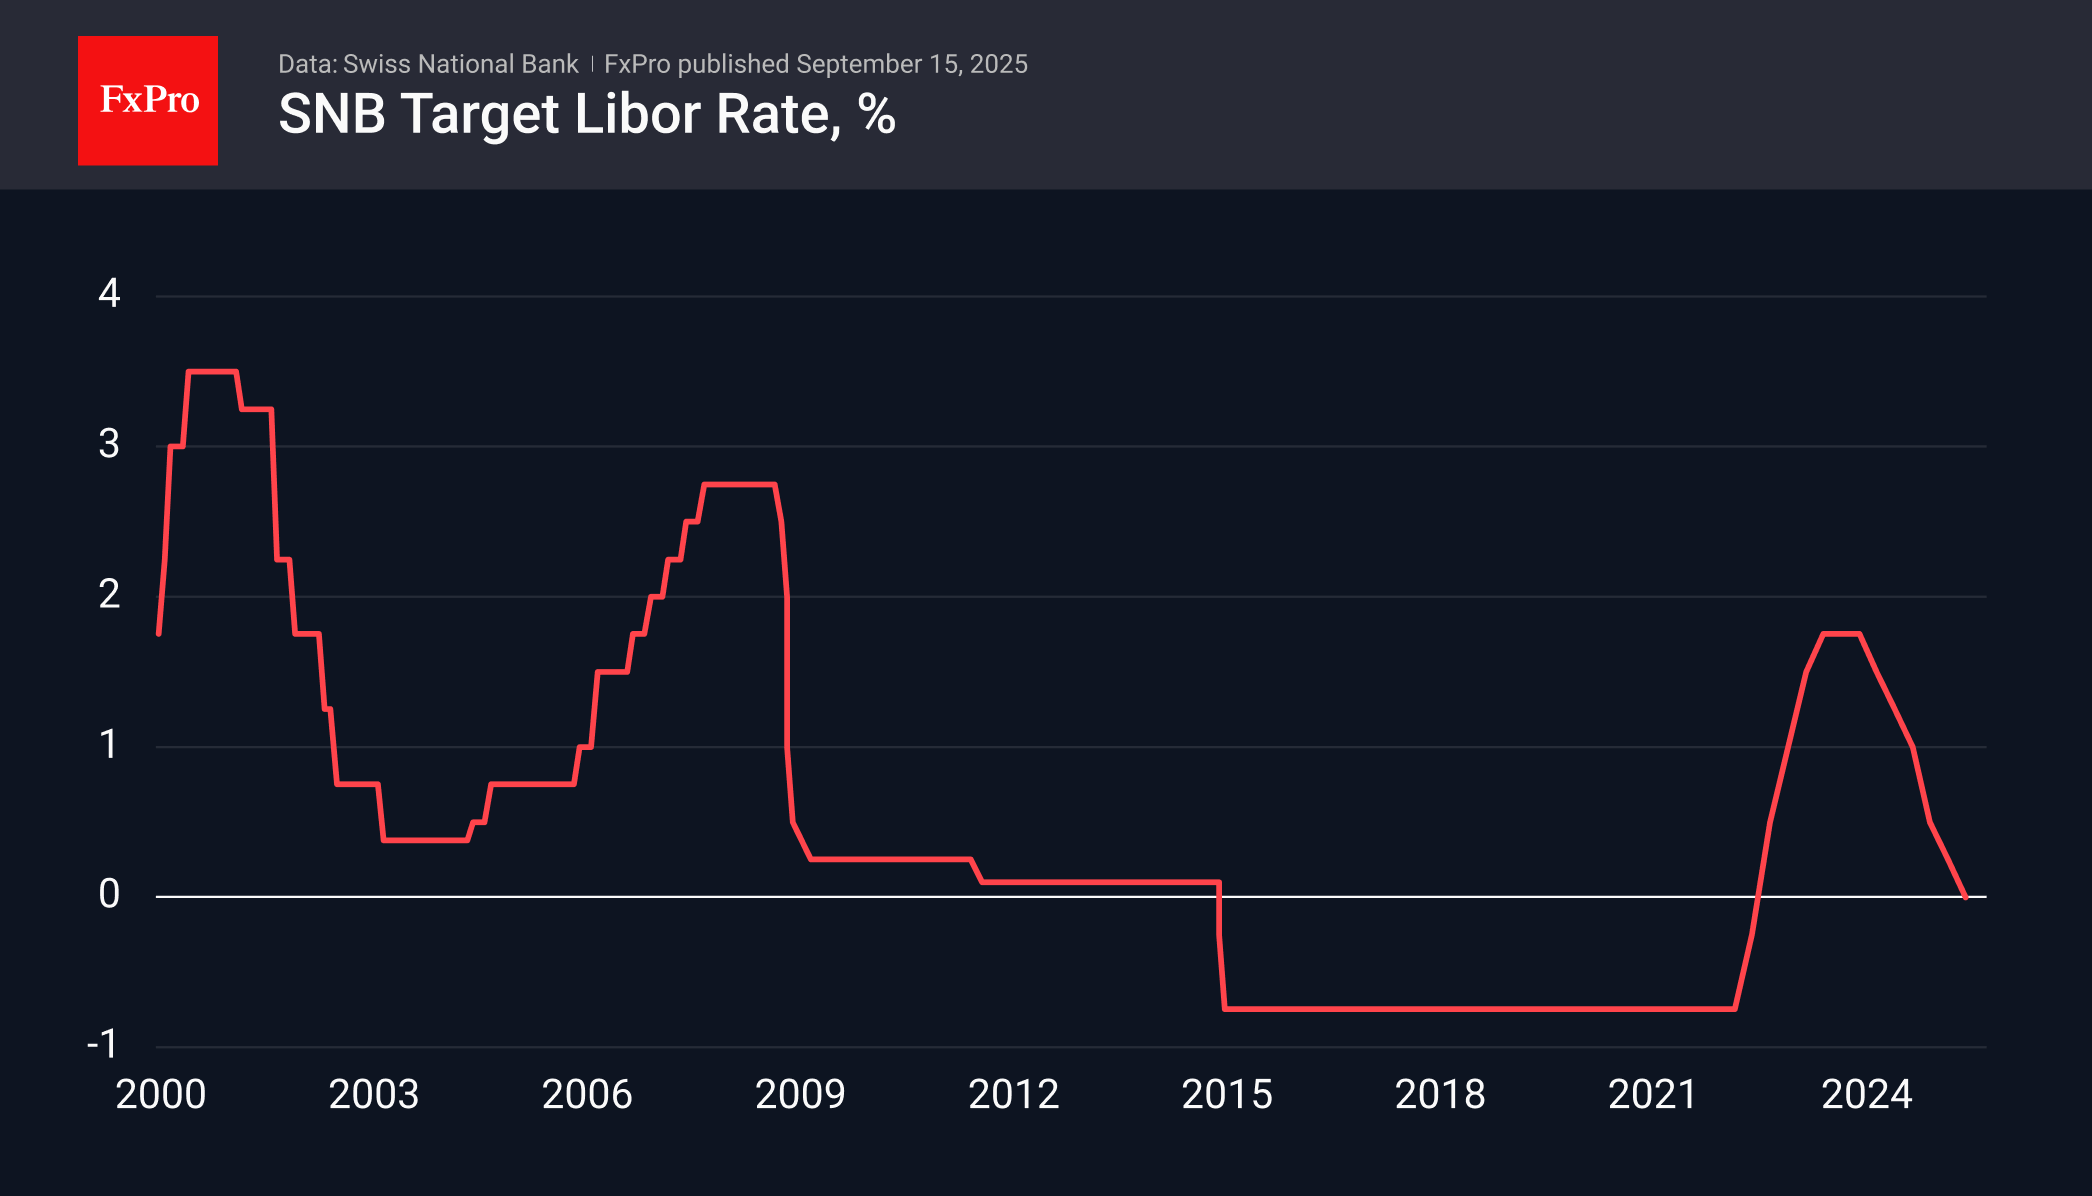
Franc Entered Turbulence Zone, Ball on the Side of SNB
USDCHF is trading below 0.8000, returning to the area of 14-year lows after rebounding from these levels in July. Earlier, in 2010 and 2014, the pair traded lower only in free-fall mode, forcing the central bank to intervene and reverse the trend. Although the Swiss National Bank has cut its key rate twice this year, and the Fed did so most recently in December last year, the dynamics of the currency market clearly show how the market values policy predictability and trade surplus this year.
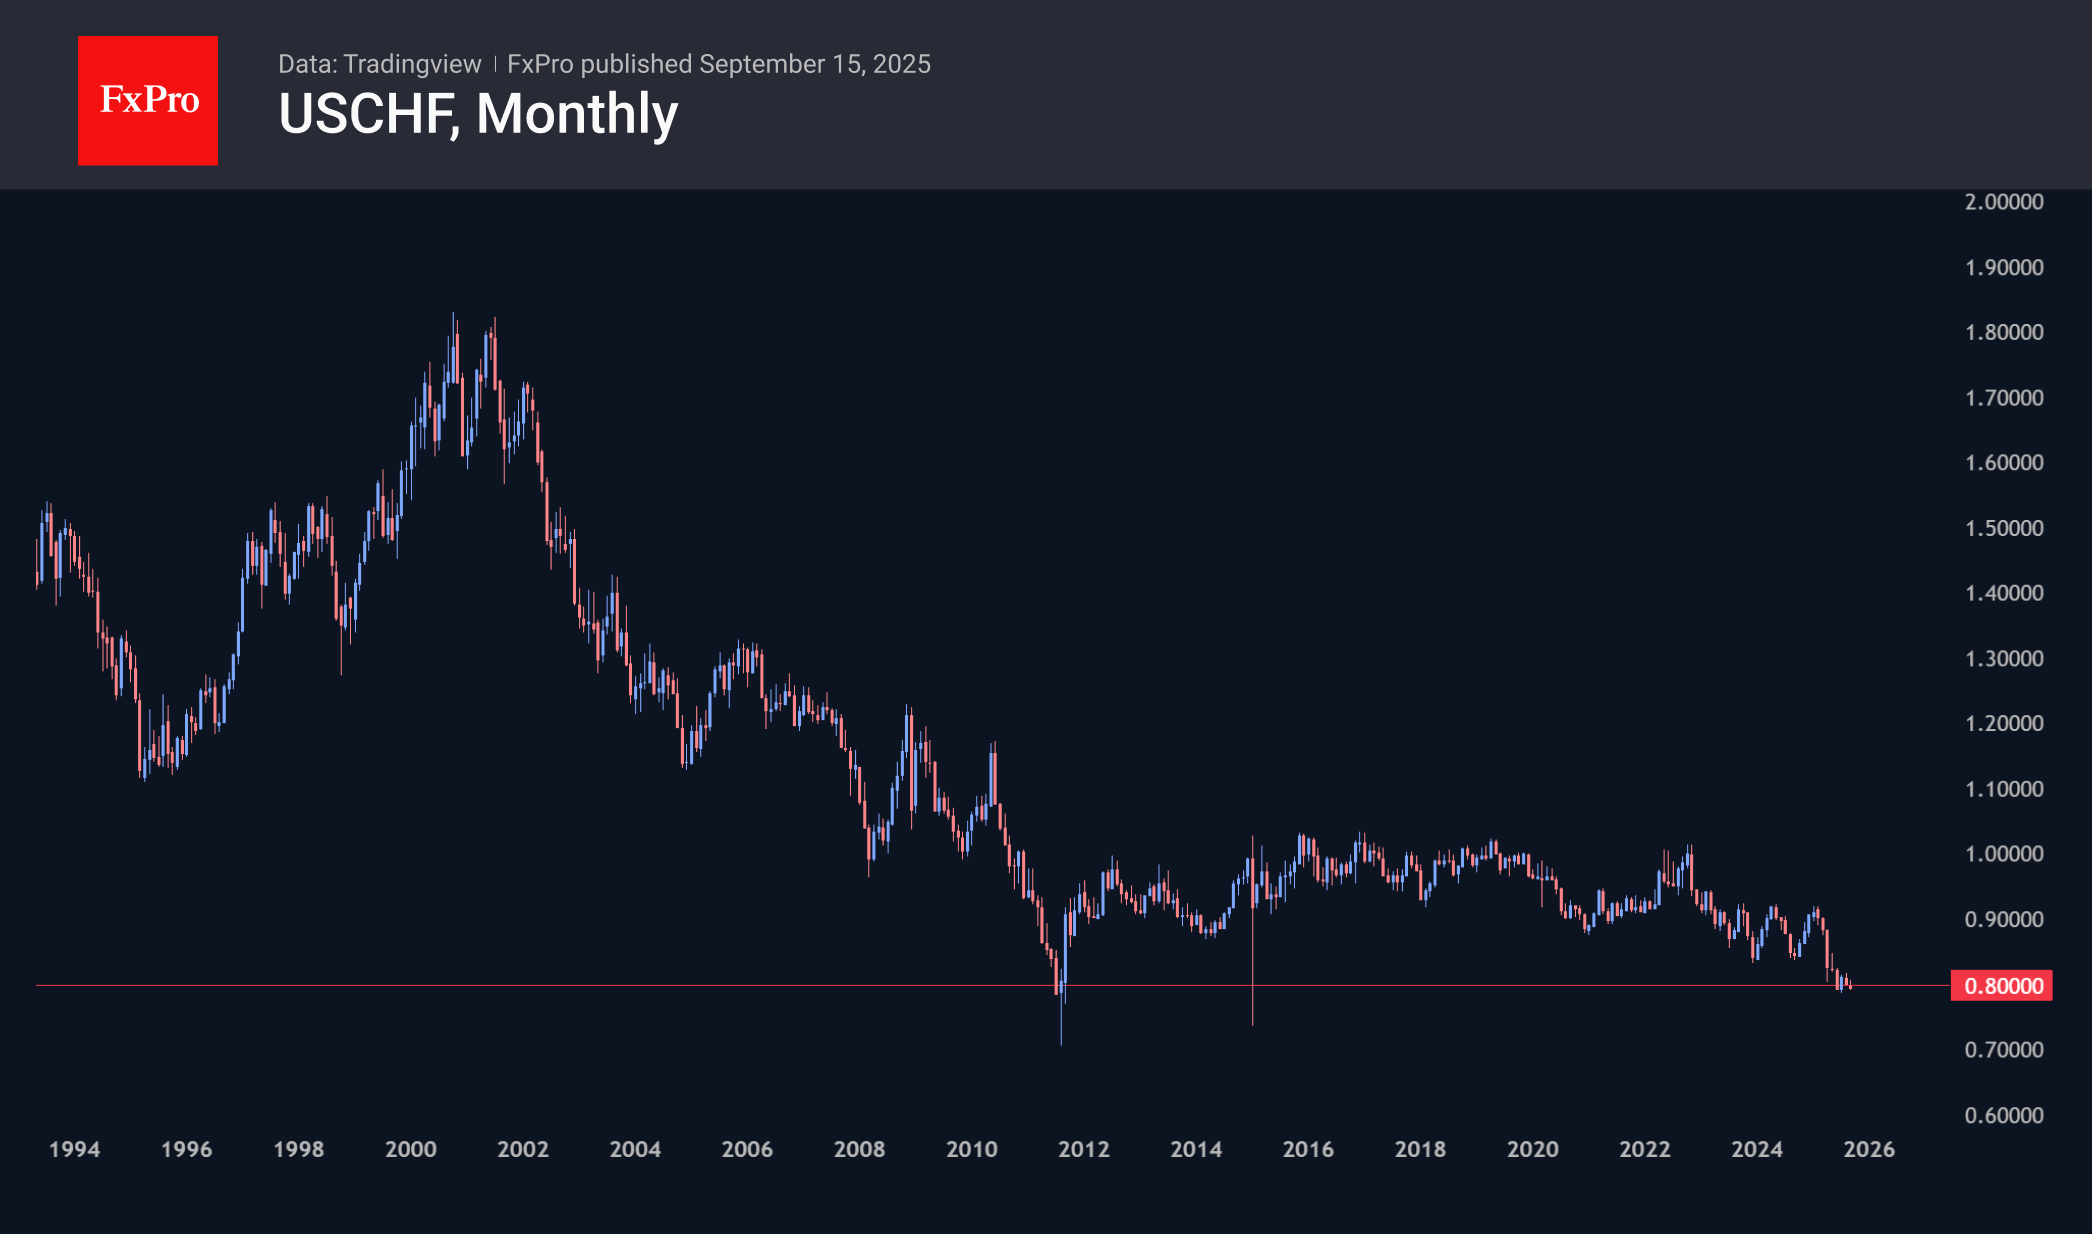
At its quarterly meeting on 25 September, the SNB has every opportunity to increase pressure on the currency by easing monetary policy, as other competitors (the ECB, the Bank of England and colleagues from New Zealand and Australia) have implemented more easing measures this year.
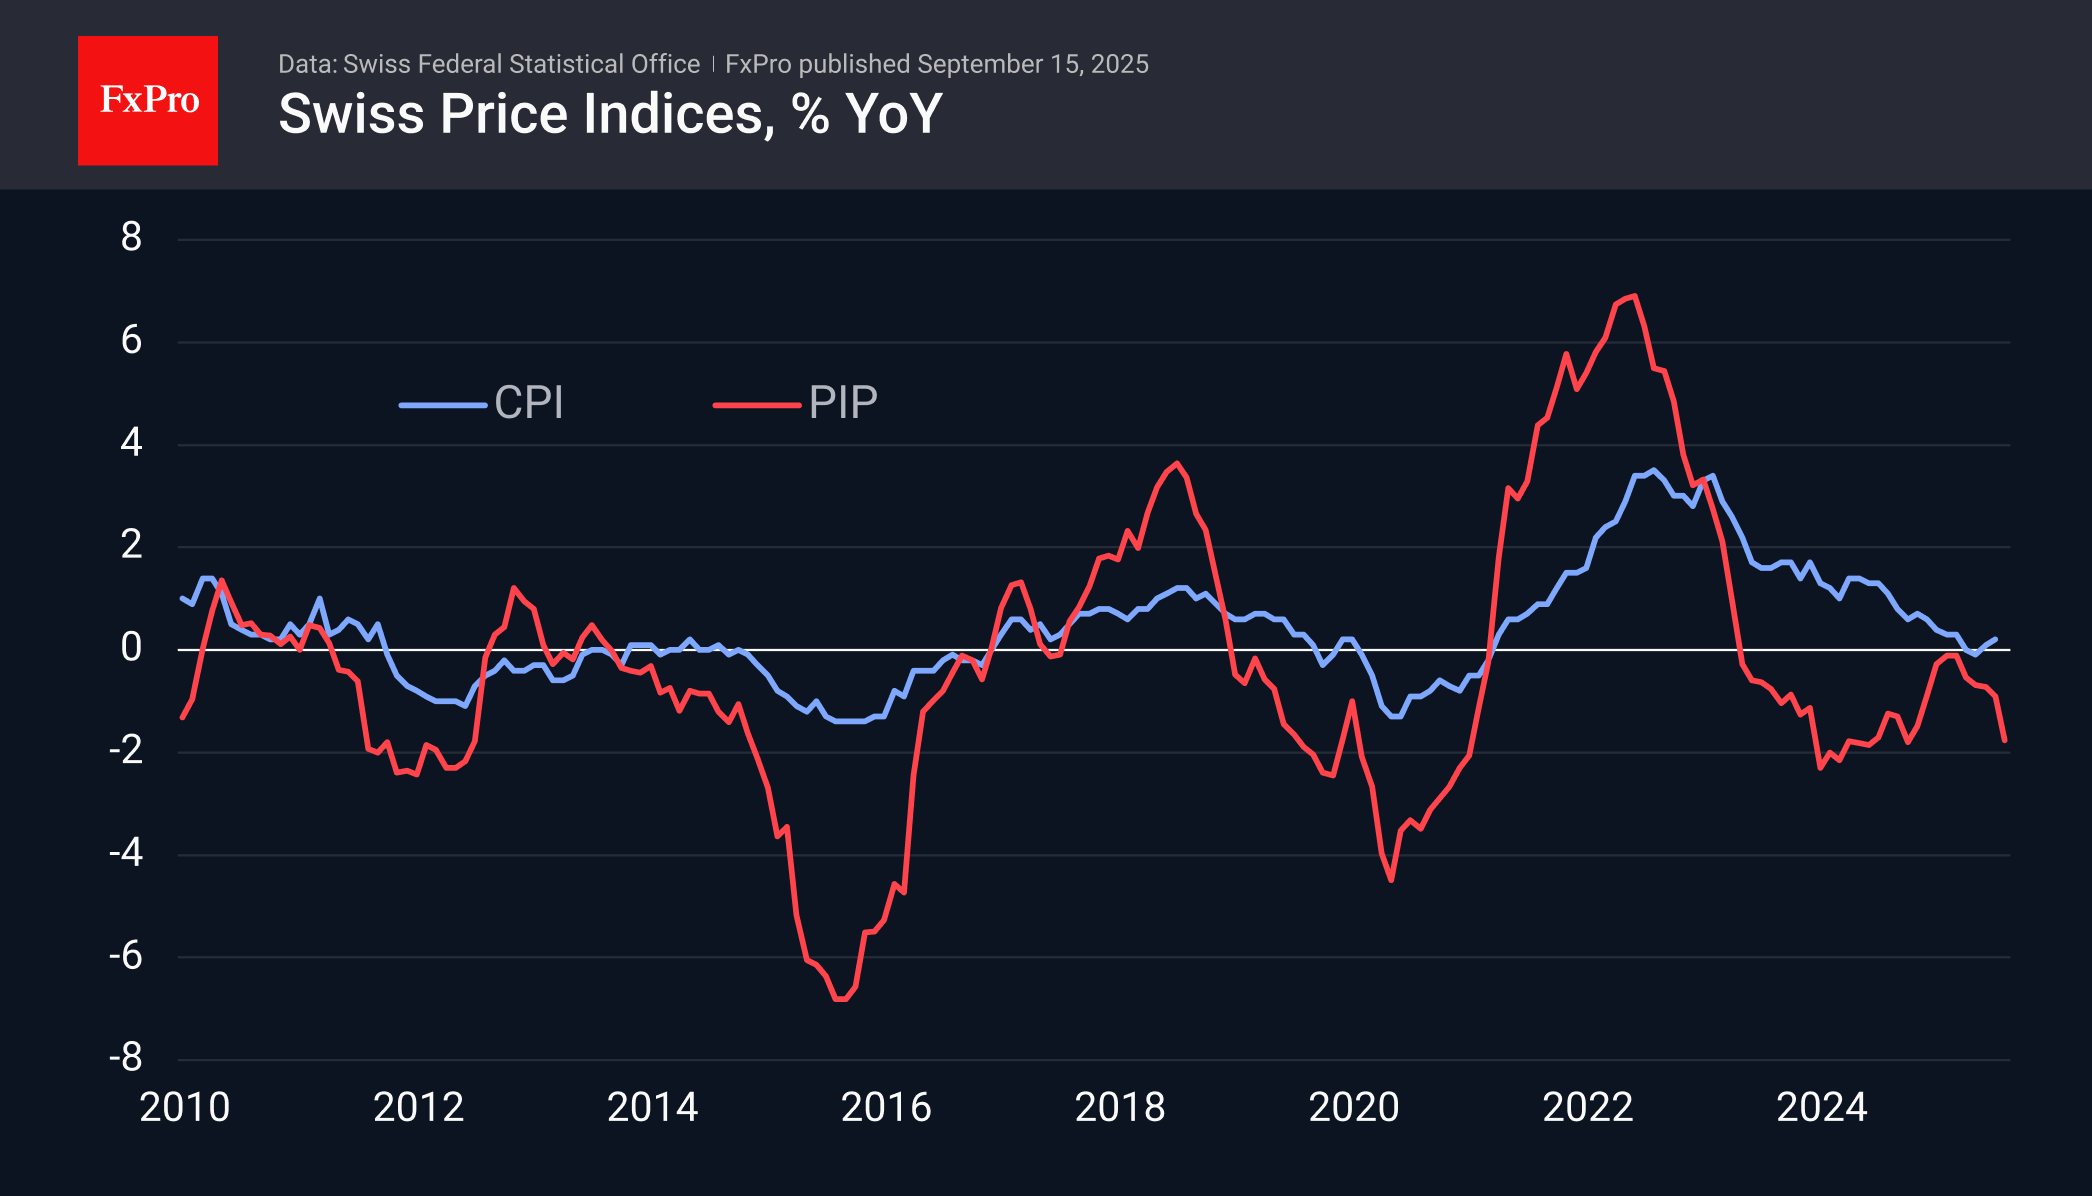
Inflation needs support, not restraint. A recent report on 15 September noted the fourth consecutive month of decline in the producer and import price index, totalling 1.3%, with August accounting for almost half of this decline. From August last year, the decline had accelerated to 1.8%, the largest since June 2024, remaining in negative territory for the last 28 months. Annual consumer price inflation is close to zero, and the sharp decline in PIP increases the risks of deflation in the coming months.
Foreign trade is also showing the first signs of problems amid the strong franc. July estimates showed exports falling by almost a quarter compared to March’s peak, with imports down more than 22%.
The consumer climate index also resumed its decline in August, which should help strengthen the position of doves in the central bank.
The SNB already lowered its target rate to 0% in June, returning to zero or negative rates for the first time. The bank has previously indicated that it is prepared to go lower. Still, we also believe that further steps carry the risk of a resumption of forex interventions involving the printing of francs to buy foreign currency. These measures are designed to increase the supply of CHF on the global market. Such measures could halt the franc’s appreciation against key global currencies, which is beginning to harm the national economy.
If these assumptions are confirmed, current levels could prove to be a turning point for USDCHF and other crosses with the franc.