Sample Category Title
Nikkei 225 Technical: Bullish Trend Remains Intact Despite Japan’s PM Resignation
The price actions of the Japan 225 CFD Index (a proxy of the Nikkei 225 futures) have staged the expected bullish reversal after the test on the 41,760 key short-term pivotal support on 2 September 2025 (printed an intraday low of 41,688) and rallied by 3.6% to hit 43,203 on last Friday. 5 September.
In today’s Asia session, it gapped up and added 1.7% to print a current intraday high of 43,850, just a whisker away from the recent all-time high of 43,942 printed on 18 August, on the backdrop of the resignation of Japan’s Prime Minister Ishiba on Sunday.
Japan’s PM contenders are likely to advocate for fiscal stimulus measures
The Liberal Democratic Party (LDP) members are likely to vote for their leader in early October, with two leading contenders being Sanae Takaichi, a former internal affairs minister, and Agriculture Minister Shinjiro Koizumi, the son of a former prime minister.
Both contenders tend to have a more liberal stance towards fiscal policy and support more fiscal stimulus measures.
Let’s now take a closer look at the latest key technical elements to decipher its next short-term (1 to 3 days) directional bias and key levels to watch on the Japan 225 CFD Index.
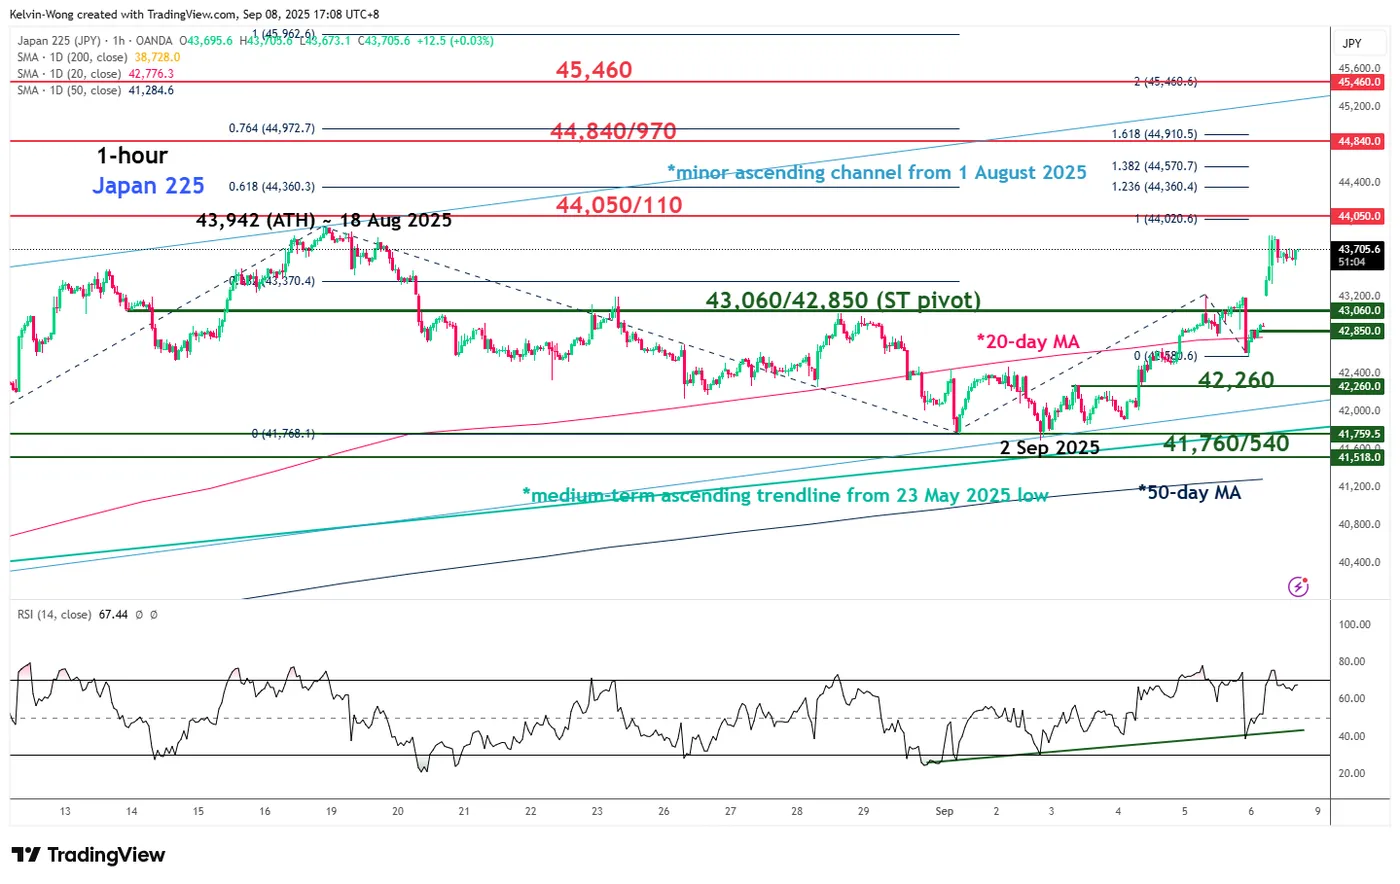
Fig. 1: Japan 225 CFD Index minor trend as of 8 Sep 2025 (Source: TradingView)
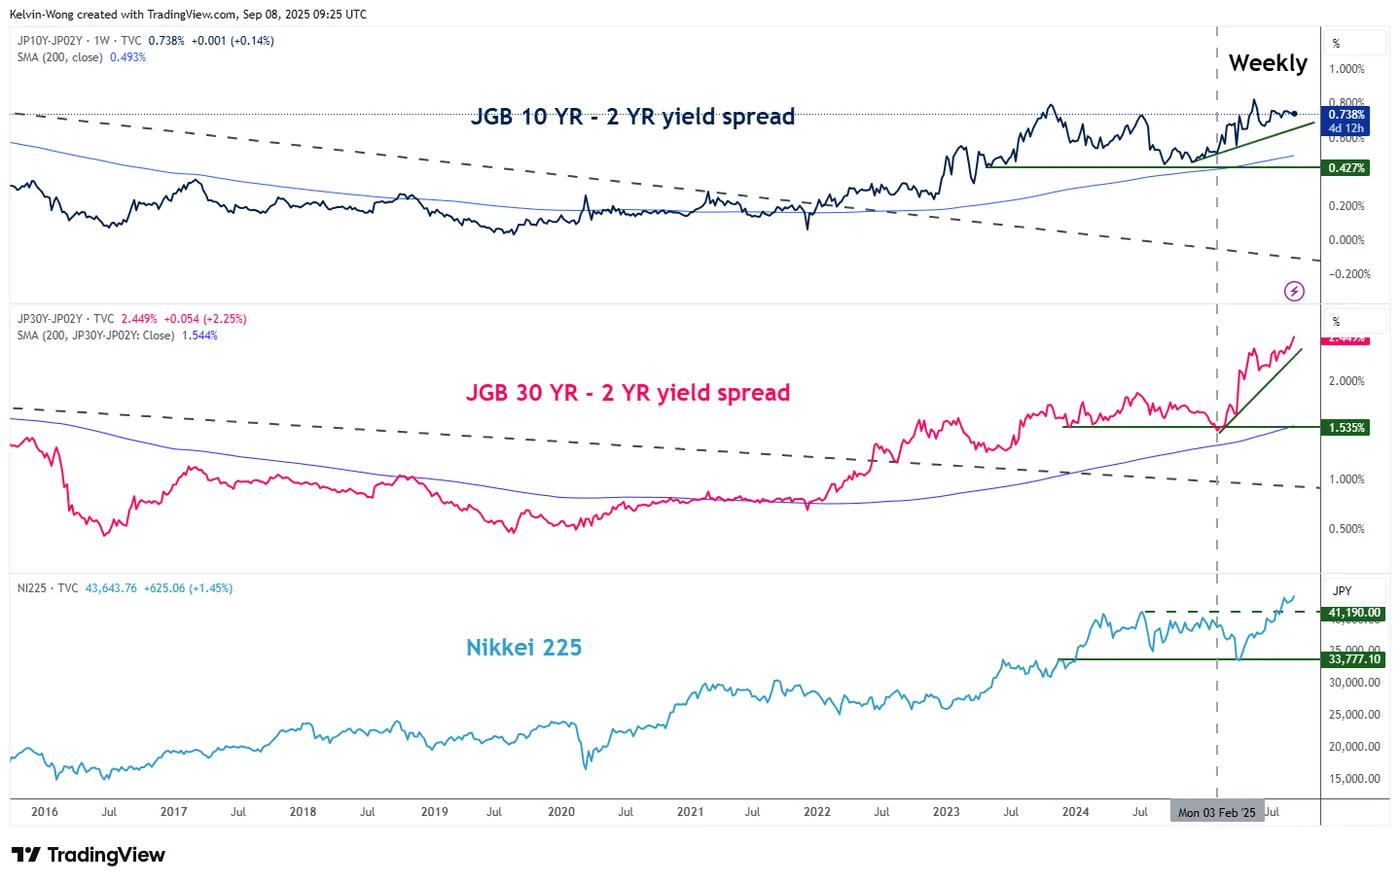
Fig. 2: JGB yield curves (30-YR/2-YR & 10-YR/2-YR) major trends as of 8 Sep 2025 (Source: TradingView, click to enlarge chart)
Preferred trend bias (1-3 days)
Maintain the bullish bias on the Japan 225 CFD Index with a tightened short-term pivotal support now at 43,060/42,850 for the next intermediate resistances to come in at 44,050/44,110 and 44,840/44,970 (Fibonacci extension cluster and towards the upper boundary of a minor ascending channel from 1 August 2025 low) (see Fig. 1).
Key elements
- Price actions of the Japan 225 have traded back above the 20-day moving average, which reinforces the ongoing short-term/minor bullish impulsive up move sequence.
- The hourly RSI momentum indicator has not flashed at a bearish divergence condition as it hit its overbought zone (above 70 level) in today’s Asia session.
- The major bullish breakout (steepening conditions) of the JGB yield curves since June 2022 has a direct correlation with the movements of the Nikkei 225, and the major uptrend phases of the JGB yield curves' steepening remain intact so far, in turn, may trigger a further positive feedback loop into the Nikkei 225 (see Fig. 2).
Alternative trend bias (1 to 3 days)
Failure to hold at the 43,060/42,850 key short-term support for the Japan 225 CFD Index negates the bullish tone for a minor corrective decline to expose the next intermediate support at 42,260.
Cryptocurrency Market Uncertainty as a Sign of Suppressed Retail Risk Appetite
Market Overview
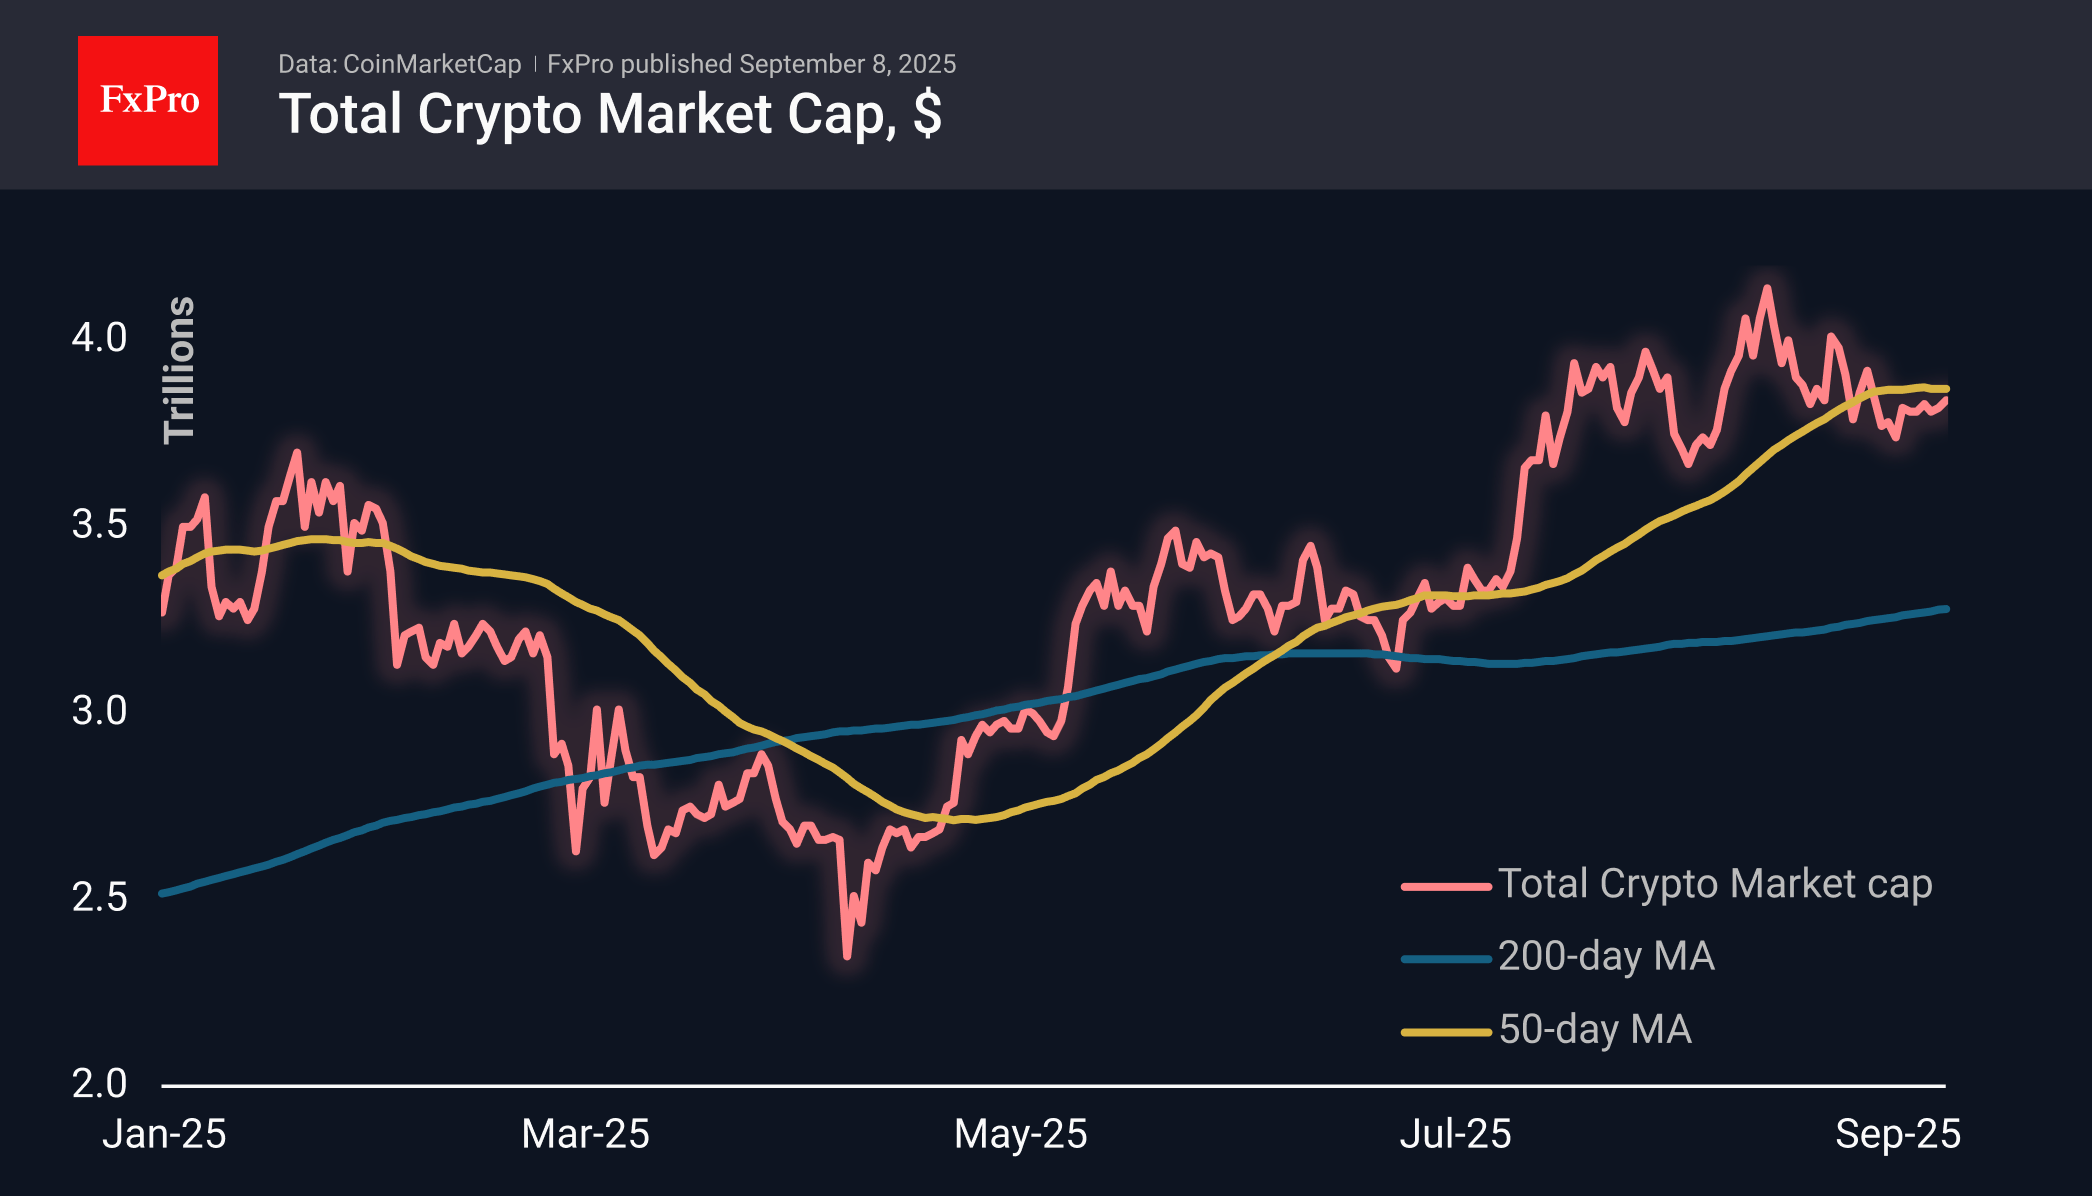
Cryptocurrency market capitalisation has gained 2.5% over the past seven days to $3.85 trillion, demonstrating a very modest and erratic recovery without buyer euphoria or significant volumes. The crypto market capitalisation remains below its 50-day moving average, indicating the prevalence of bears in the market. This is a very worrying indicator of underlying risk appetite in financial markets. Although stocks are offsetting the weakness in the labour market with growth in anticipation of Fed dovishness, the weakness of the economy is still negative for retail customers, the driving force behind prices.
The sentiment index fell into fear territory on Sunday at 44, but returned to a neutral 51 on Monday, reflecting a wait-and-see stance.
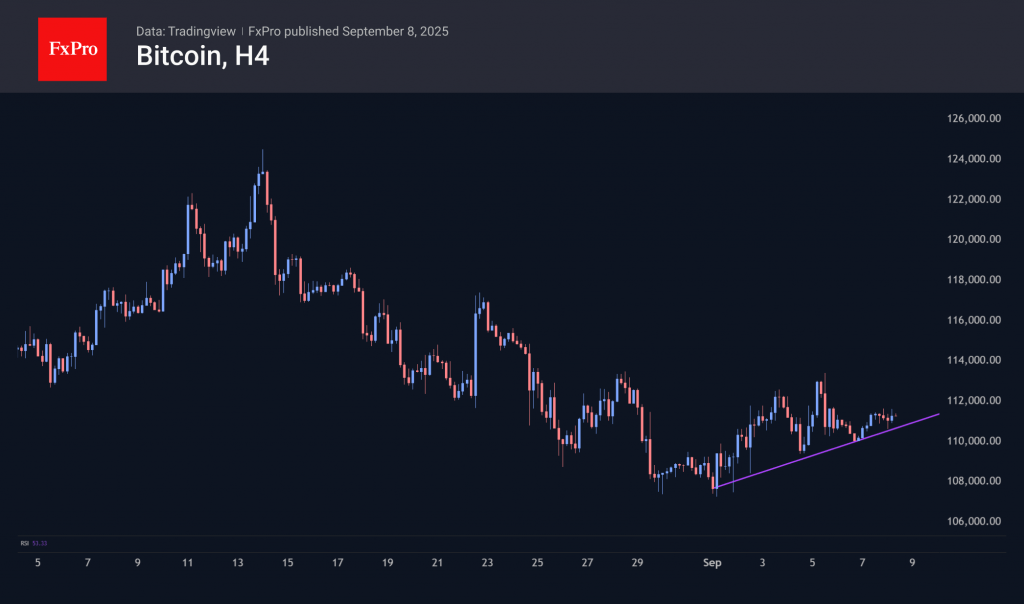
Bitcoin continues to hover around $111K, crossing this mark up or down every day for the past seven days. Since the beginning of September, an upward line can be drawn through the local price lows, but BTC has gained about 3.6% during this time, more than the losses on 28 August alone.
News Background
The total volume of corporate Bitcoin reserves reached a record 840,000 BTC in August, but their growth rate and transaction volume fell to annual lows, according to CryptoQuant. This indicates a weakening of institutional demand.
The altcoin season has already begun, but only for those coins that large companies have included in their reserves, according to Bloomberg. Another potential driver of the alt season could be the approval of crypto ETF applications in the US. About 10 assets are expected from the SEC, including Dogecoin, Chainlink, Stellar, Bitcoin Cash, Avalanche, Litecoin, Shiba Inu, Polkadot, Solana and Hedera.
Stablecoins are gaining popularity because they offer businesses faster, cheaper and more reliable payments than traditional systems, said Stripe CEO Patrick Collison.
The Financial Times has learned of Tether’s plans to buy gold. According to the publication’s sources, the issuer of the USDT stablecoin has been discussing investing in the entire precious metal supply chain, which includes mining, processing, trading, and royalties.
Nikkei 225 Rises Following Resignation of Prime Minister Shigeru Ishiba
As the chart shows, Japan’s Nikkei 225 stock index (Japan 225 on FXOpen) today approached its historic peak (B) around the 43,900 level.
Bullish sentiment was driven by political news. According to Reuters, Prime Minister Shigeru Ishiba has stepped down. The leading candidate to replace him, Sanae Takaichi, is regarded as a supporter of stimulus measures and unprecedented monetary easing – a bullish factor for companies.
Technical Analysis of the Nikkei 225
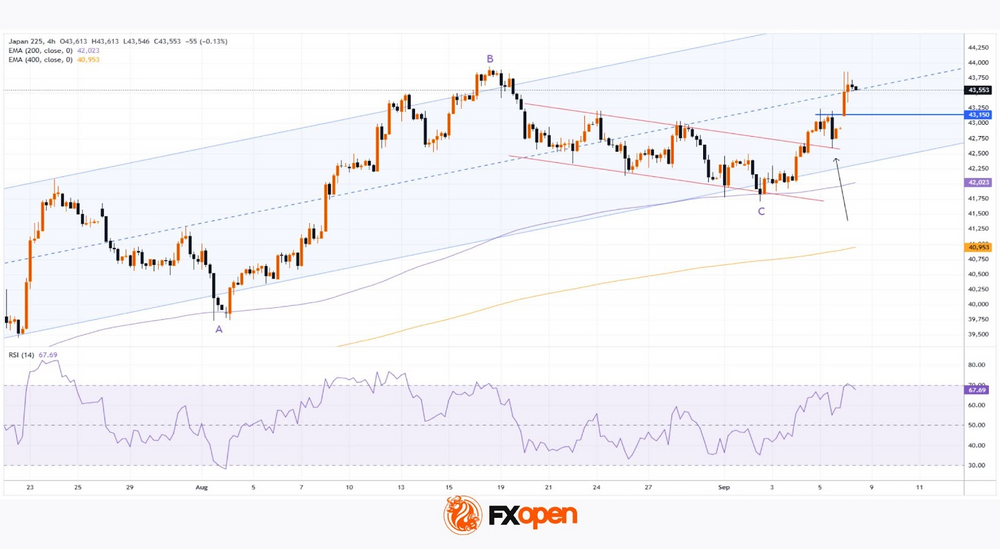
As indicated by the 200- and 400-period moving averages on the 4-hour chart, Japan’s stock market remains in a long-term uptrend. This summer, index movements have been forming an ascending channel, highlighted in blue, with the lower boundary acting as strong support.
Other bullish signs include:
→ A bullish structure, highlighted by a normal pullback of around 50% (B→C) following the A→B impulse.
→ During the B→C decline, price movements formed a corridor (marked with red lines) resembling a bullish flag pattern. Its breakout suggests an attempt to resume the upward trend after an interim correction.
→ Recent price action, indicating that former resistance levels have turned into support. This applies both to the upper red line (marked with an arrow) and to last week’s former resistance at 43,150.
On the other hand:
→ Long upper shadows on today’s candles point to increased selling pressure near the historic peak.
→ The RSI indicator has risen to the overbought territory.
Given that the index is now around the median of the ascending channel (a level where supply and demand tend to balance), we could assume the market may consolidate in the short term. Possible scenarios include:
→ Attempts to break through the historic high, which may fail – potentially trapping overly optimistic participants and creating signs of a bearish ICT Liquidity Sweep pattern above peak B.
→ A correction with a retest of the 43,150 level.
Trade global index CFDs with zero commission and tight spreads. Open your FXOpen account now or learn more about trading index CFDs with FXOpen.
This article represents the opinion of the Companies operating under the FXOpen brand only. It is not to be construed as an offer, solicitation, or recommendation with respect to products and services provided by the Companies operating under the FXOpen brand, nor is it to be considered financial advice.
Aussie strength meets Loonie weakness, AUD/CAD targets 0.9128 and above
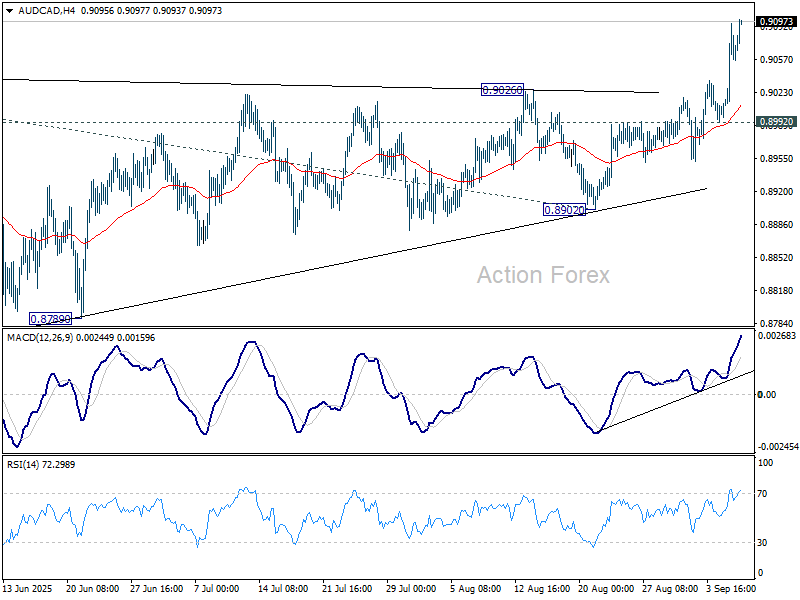
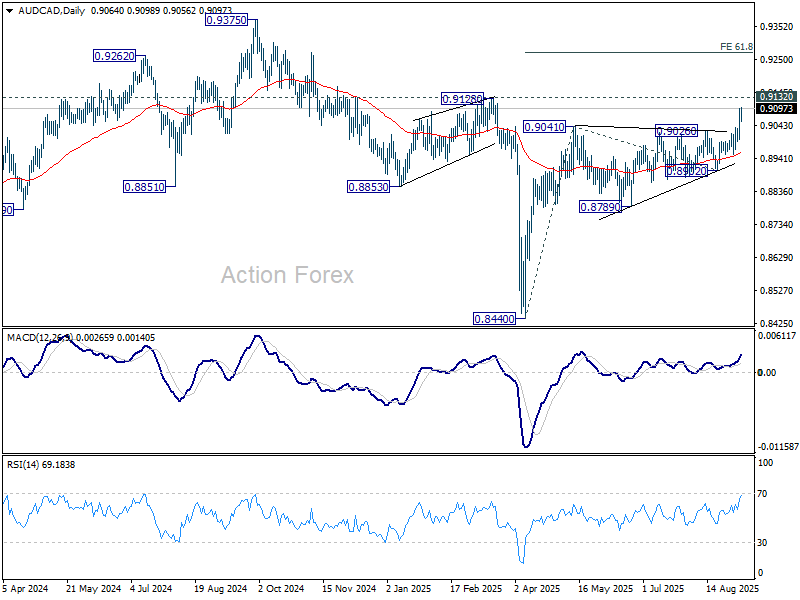
AUD/CAD resumed its rally from 0.8440 last week, breaking decisively through 0.9041 resistance level. The move reflects diverging fundamentals between Canadian Dollar, which is weighed down by weak domestic data, and Australian Dollar, which is drawing support from stronger consumption and external demand.
For loonie, the trigger was August’s disappointing jobs report, which reignited expectations that the BoC will resume easing at its September 17 meeting. While markets have not fully priced a rate cut yet, sentiment is shifting toward renewed stimulus. Still, policymakers are likely to wait for the August CPI release on September 16 before making the final call.
Underlying inflation dynamics remain sticky, with CPI common holding at 2.6% yoy for a third consecutive month in July. That has kept some uncertainty in market pricing. But once tariff-driven price pressures ease, the BoC will have scope to bring rates down from the current 2.75% to around 2.00%.
In contrast, the RBA’s easing path looks less certain. Strong consumption data prompted Governor Michele Bullock to caution that fewer cuts may ultimately be delivered. The Australian Dollar has also found support from a sharp rally in Chinese equities, which has helped stabilize sentiment around regional growth prospects.
Technically, AUD/CAD's rise from 0.8440 should be reversing the whole downtrend from 0.8375. Further rise is expected as long as 0.8992 support holds, to 0.9128 structural resistance first. Firm break there will pave the way to 61.8% projection of 0.8440 to 0.9041 from 0.8902 at 0.9273.
Eurozone Sentix confidence sinks to five-month low, summer optimism disintegrating at rapid pace
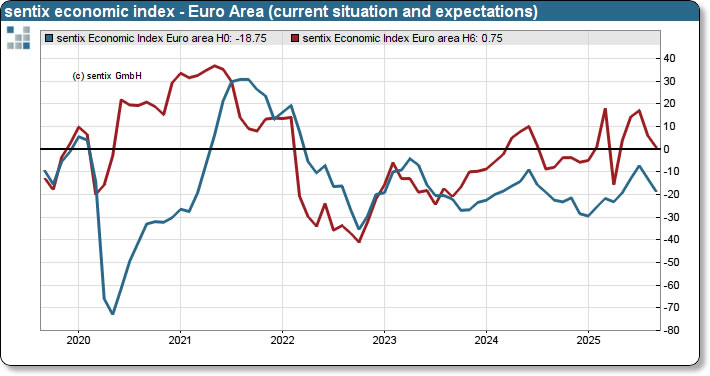
Eurozone investor sentiment deteriorated sharply in September, with the Sentix Confidence Index falling from -3.7 to -9.2, well below expectations of -1.1 and the weakest since April. Current Situation Index weakened to -18.8 from -13.0, while Expectations tumbled to 0.8 from 6.0.
Germany was the clear weak spot. Its investor confidence plunged from -12.8 to -22.1, while Current Situation gauge collapsed from -29.0 to -39.0. Expectations turned negative again, falling from 5.0 to -3.5, highlighting growing pessimism about Europe’s largest economy emerging from recession.
Sentix attributed the downturn to a mix of political and external headwinds: government instability in France, persistent weakness in German industry, an unfavorable tariffs arrangement with the US, and the ongoing war in Ukraine. These factors, it said, are exerting an “oppressive effect” on Eurozone sentiment.
The institute warned that summer optimism has “disintegrated at a rapid pace” and sees little sign of an autumn rebound. With export-oriented sectors facing more pressure under U.S. tariffs and rising concern over sovereign debt — particularly in France — the outlook for the Eurozone remains fragile heading into year-end.
Gold Poised to Test Fresh Highs
Gold held near historic levels on Monday, trading around 3,590 USD per ounce, bolstered by a softer-than-expected US labour market report for August. Employment growth fell short of forecasts, while the unemployment rate climbed to its highest level since 2021. This has reinforced market expectations of an imminent Federal Reserve rate cut as early as September, with investors pricing in a 92% probability of such a move.
Further supporting the bullish sentiment are growing doubts over the Fed’s independence, as former President Donald Trump continues to criticise the central bank – driving increased safe-haven demand for gold.
Demand was also reinforced by the People’s Bank of China, which added to its gold reserves for the tenth consecutive month in August as part of a broader strategy to diversify its holdings away from the US dollar.
Additionally, the metal gained support from trade policy developments, with the Trump administration exempting gold and certain other metals from its latest tariff list.
In summary, gold remains near all-time highs due to a combination of dovish Fed expectations, political uncertainty, and sustained central bank demand.
Technical Analysis: XAU/USD
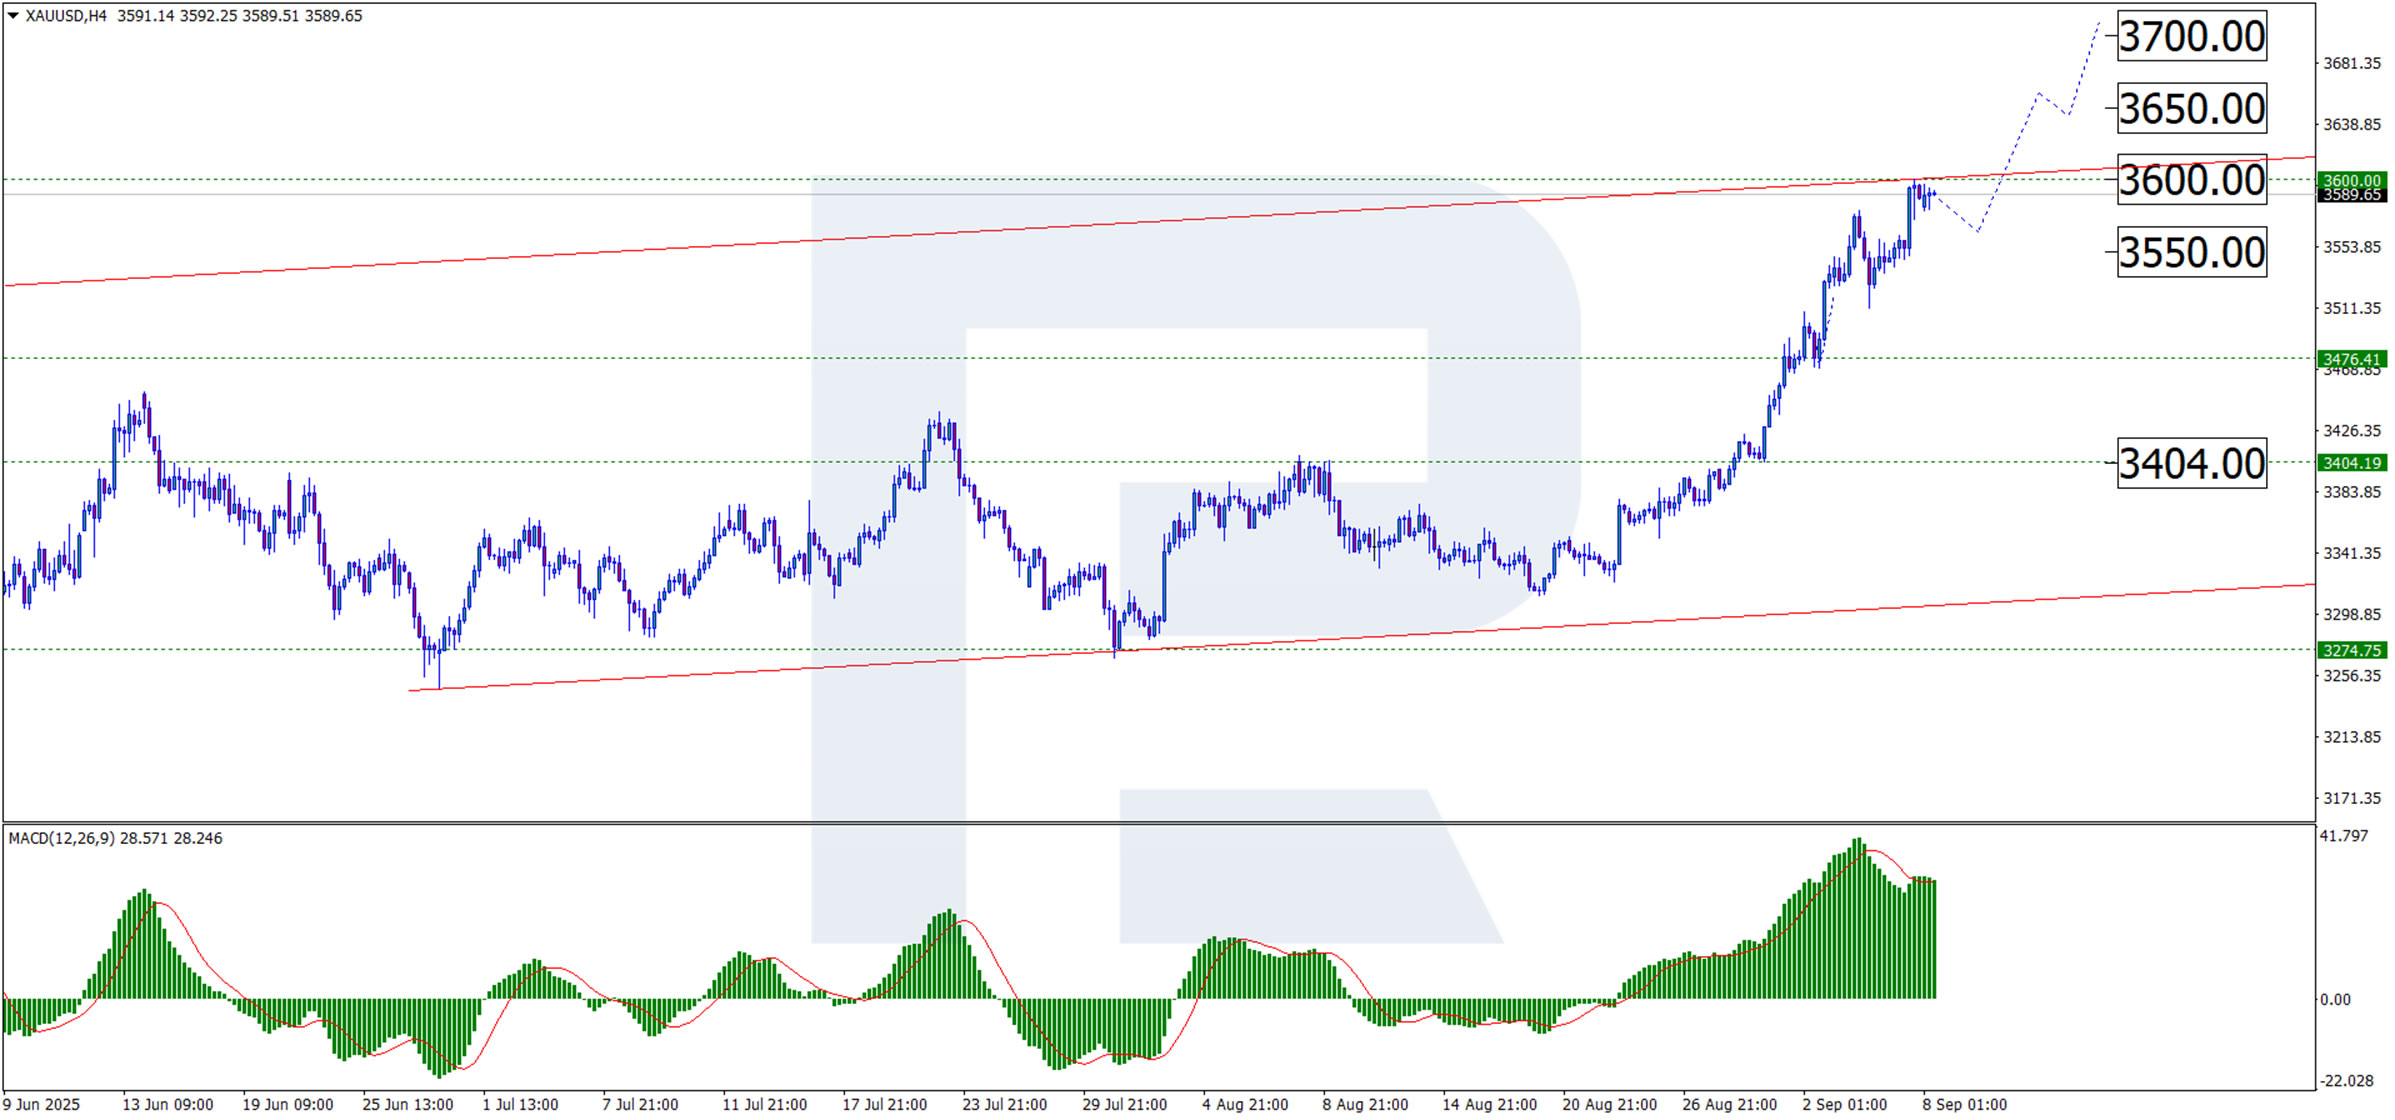
H4 Chart:
On the H4 chart, XAU/USD has completed another leg higher, reaching 3,600.07 USD. A corrective pullback toward the former resistance, which has now turned into support at around 3,550 USD, appears likely. Given the current fundamental backdrop, any test of this support may be followed by another upward wave, with initial targets at 3,600 USD and then 3,650 USD. The MACD indicator provides technical support for this scenario. Although the histogram and signal line remain above zero, both are declining – suggesting a near-term correction before the broader uptrend resumes.
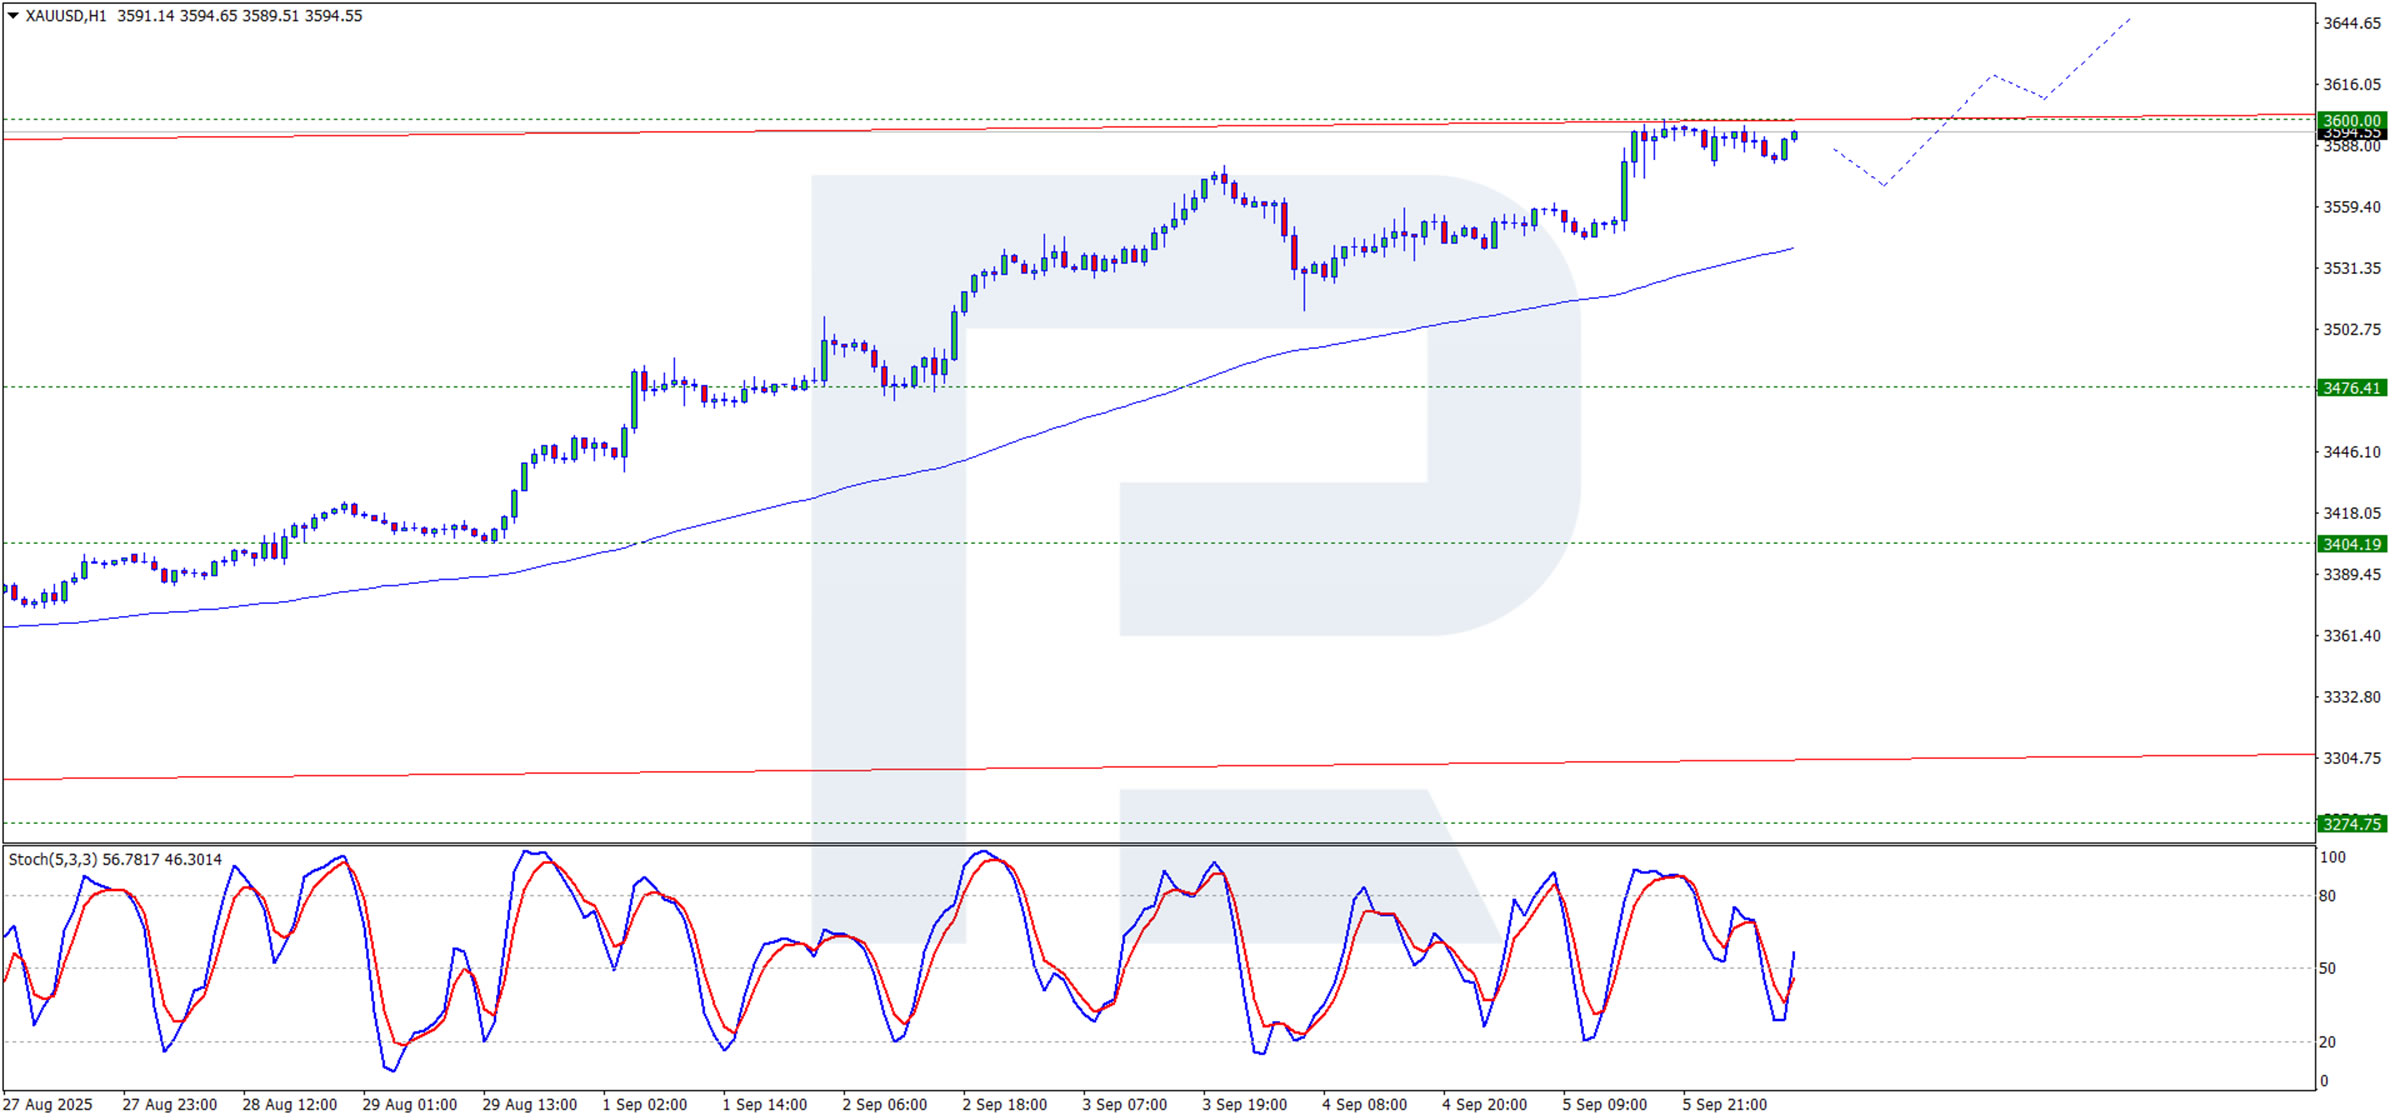
H1 Chart:
On the H1 chart, the pair tested 3,600.07 USD and is now forming a corrective decline. The initial support target is 3,550 USD. Holding this level could prompt renewed buying, supporting a continuation of the upward trend. The Stochastic oscillator aligns with this view, with its signal line testing the 50.0 level, indicating potential for further near-term consolidation or a mild retracement.
Conclusion
Gold remains well-supported by a confluence of fundamental factors, including expectations of Fed easing, geopolitical tensions, and robust institutional demand. While a short-term technical correction is likely, the broader bullish trend remains intact, with scope for further gains towards 3,650 USD.
Canadian Dollar Falls After Labour Market Data Release
On Friday, disappointing figures showed that in August the Canadian economy lost 65,500 jobs (the forecast had been for an increase of 10,000), while the unemployment rate rose to 7.1%. This is the highest level of unemployment since May 2016, excluding the pandemic period.
It is believed that:
→ the deterioration in the labour market (primarily in manufacturing) is a consequence of the trade war with the United States;
→ the fall in employment in Canada has increased the likelihood that the Bank of Canada will resume its monetary easing campaign.
As a result, the CAD weakened sharply against other currencies. However, the depreciation against the US dollar was less pronounced, as the USD itself is under pressure from various factors.
Technical Analysis of USD/CAD
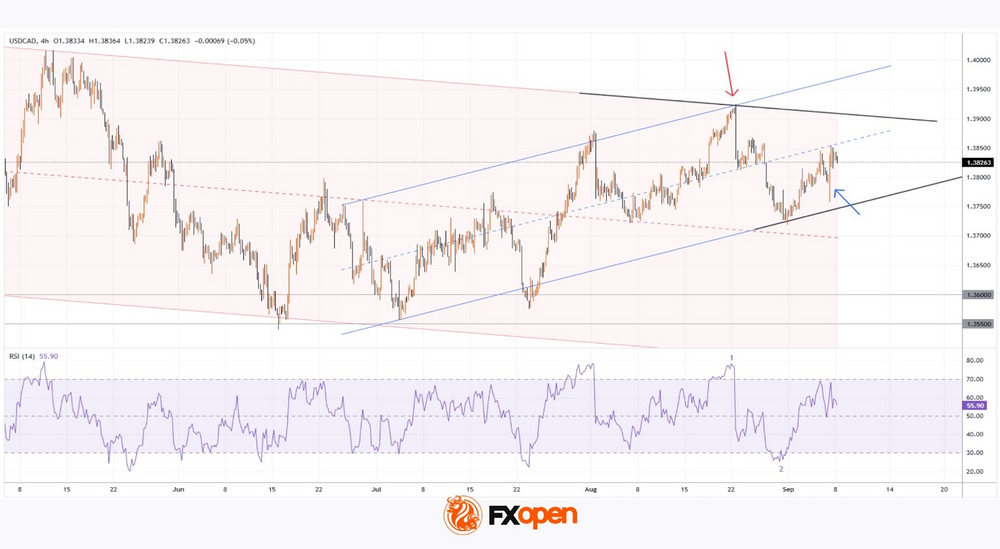
From a long-term perspective, the USD/CAD pair remains within a downward trend, highlighted by a red descending channel.
From a medium-term perspective, since July the rate has risen from the 1.3550–1.3600 support zone, forming an ascending channel (shown in blue).
Price action (indicated by arrows) shows that:
→ sellers are aggressive, pushing the price down from the upper boundary of the red channel;
→ buyers are aggressive, driving the price up from the lower boundary of the blue channel. Its median line acts as resistance.
This is compressing USD/CAD fluctuations into a pattern resembling a symmetrical narrowing triangle (shown in black), with recent overbought (1) and oversold (2) conditions on the RSI marking price reversals back into the triangle from its boundaries.
Thus, we could assume that supply and demand forces will keep USD/CAD in a state of temporary balance while awaiting key news next week:
→ 16 September – Canada CPI report;
→ 17 September – interest rate decisions from both the Bank of Canada and the Federal Reserve.
Trade over 50 forex markets 24 hours a day with FXOpen. Take advantage of low commissions, deep liquidity, and spreads from 0.0 pips. Open your FXOpen account now or learn more about trading forex with FXOpen.
This article represents the opinion of the Companies operating under the FXOpen brand only. It is not to be construed as an offer, solicitation, or recommendation with respect to products and services provided by the Companies operating under the FXOpen brand, nor is it to be considered financial advice.
NZD/USD and AUD/USD Rally Attempts, Will Buyers Stay in Charge?
AUD/USD started a decent increase above 0.6580. NZD/USD is also rising and might aim for more gains above 0.5920.
Important Takeaways for AUD USD and NZD USD Analysis Today
- The Aussie Dollar started a decent increase above 0.6545 against the US Dollar.
- There was a break above a contracting triangle with resistance at 0.6530 on the hourly chart of AUD/USD at FXOpen.
- NZD/USD is consolidating gains above the 0.5880 pivot level.
- There was a break above a major bearish trend line with resistance at 0.5870 on the hourly chart of NZD/USD at FXOpen.
AUD/USD Technical Analysis
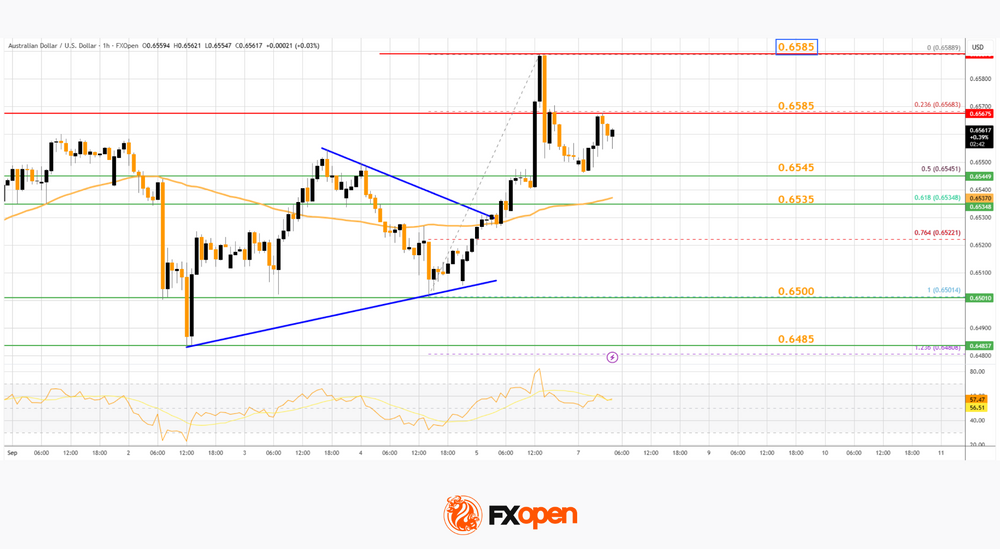
On the hourly chart of AUD/USD at FXOpen, the pair started a fresh increase from 0.6500. The Aussie Dollar was able to clear 0.6520 to move into a positive zone against the US Dollar.
The bulls cleared a contracting triangle with resistance at 0.6530. There was a close above the 0.6550 resistance and the 50-hour simple moving average. Finally, the pair tested 0.6585. A high was formed near 0.6588 and the pair recently started a consolidation phase.
There was a move below the 23.6% Fib retracement level of the upward move from the 0.6501 swing low to the 0.6588 high. On the upside, the AUD/USD chart indicates that the pair is now facing resistance near 0.6585.
An upside break above 0.6585 might send the pair further higher. The next stop is near 0.6640. Any more gains could clear the path for a move toward the 0.6700 handle.
On the downside, initial support is near the 50% Fib retracement at 0.6545. The next area of interest could be near the 50-hour simple moving average at 0.6535.
If there is a downside break below 0.6535, the pair could extend its decline toward the 0.6500 zone. Any more losses might signal a move toward 0.6485.
NZD/USD Technical Analysis
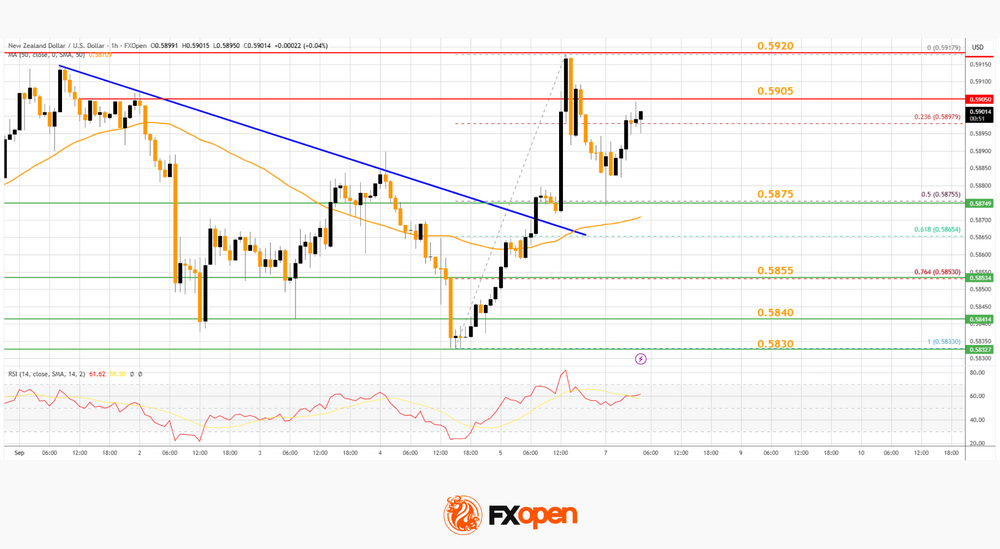
On the hourly chart of NZD/USD at FXOpen, the pair started a decent increase from 0.5830. The New Zealand Dollar broke the 0.5855 barrier to start the recent rally against the US Dollar.
Moreover, there was a break above a major bearish trend line with resistance at 0.5870. The pair settled above 0.5875 and the 50-hour simple moving average. It tested 0.5920 and is currently consolidating gains.
There was a move below the 23.6% Fib retracement level of the upward move from the 0.5833 swing low to the 0.5917 high. The NZD/USD chart suggests that the RSI is stable above 50.
On the upside, the pair might struggle near 0.5905. The next major resistance is near the 0.5920 level. A clear move above 0.5920 might even push the pair toward 0.5965. Any more gains might clear the path for a move toward the 0.6000 handle in the coming days.
On the downside, immediate support is near the 0.5875 level. The first key zone for the bulls sits at 0.5855 and the 76.4% Fib retracement. The next key level is 0.5840. If there is a downside break below 0.5840, the pair might slide toward 0.5800. Any more losses could lead NZD/USD in a bearish zone to 0.5750.
Trade over 50 forex markets 24 hours a day with FXOpen. Take advantage of low commissions, deep liquidity, and spreads from 0.0 pips. Open your FXOpen account now or learn more about trading forex with FXOpen.
This article represents the opinion of the Companies operating under the FXOpen brand only. It is not to be construed as an offer, solicitation, or recommendation with respect to products and services provided by the Companies operating under the FXOpen brand, nor is it to be considered financial advice.
Market Focus Turns to Political Issues
Markets
After a series of mediocre labour market data/subindices published earlier last week, the US payrolls report gave the final go-ahead for the Fed to restart its easing cycle and move the policy rate to a more neutral level. The US economy on August only added 22k of new jobless (75K expected) and releases of the previous two months were slightly downwardly revised. Job growth even declined in several cycle sectors. The jobless rate rose to 4.3% from 4.2%. Average hourly earnings at 0.3% M/M and 3.7% Y/Y were close to expectations but also suggest some mild easing. The soft payrolls release pulled the trigger from markets to prepare for a scenario of the Fed reducing its policy rate by 25 bps at each of the 3 remaining months of the year (+/- 70 bps cumulative discounted). US bond yields declined between 6.4 bps (5-y) and 9.5 bps (30-y). Even as the report wasn’t a reason to amend expectations on ECB policy, Germany yields in lockstep eased between 5.7 bps (10-y) and 3.5 bps (2-y). The dollar softened on losing interest rate support but the damage could have been bigger, probably as other competitors like the euro, sterling and the yen also have to cope with ‘domestic issues’. For now major US cross rates held within the established range as no key support levels were broken (DXY 97.75 from 98.24; EUR/USD 1.1717 from 1.165 & USD/JPY 147.43 from 148.49). US equities opened at record levels for the three main indices (Dow, S&P500 and Nasdaq) but gains could not be sustained (S&P 500 -0.32%).
This morning, the market focus post the US payrolls turns to political issues. There are few important eco data on the calendar in Europe or the US today. In Japan, markets are pondering the (fiscal) consequences of Japanese PM resigning. In Europe, fiscal sustainability also remains on the radar as the French government of PM Bayrou is unlikely to survive a confidence vote. President Macron can try to install a new PM/government or call early elections. However, both options provide little prospect for progress on the highly needed fiscal consolidation. The issue might weigh on intra-EMU risk premia and cap any sustained gains in EUR/USD. Sterling this morning also trades in the defensive (EUR/GBP 0.868) after PMI Starmer end last week reshuffled his government. Question remains whether this will facilitate Fin Min Reeves task of fixing the UK budget. Different indicators published this morning (Incomes Data research, KPMG & Rec) suggest ongoing cooling in the labour market and in wage growth.
News & Views
Fitch lowered Poland’s credit rating outlook to negative from stable. It kept the rating itself at A-. The outlook downgrade reflects the deteriorating public finances and the lack of credible fiscal consolidation as well as increased political challenges to implement it in the future. The rating agency said the next parliamentary elections in 2027 will likely complicate any efforts to do so. Deficits are projected to increase to 6.9% in 2025 and to remain well above 6% at least through 2027. Debt by the end of that horizon is seen rising to 68.3%, to be compared to <50% in 2023. The high credit quality Poland’s A- rating represents is supported by a large, diversified and resilient economy, a record of sound macroeconomic policies, solid external finances and a higher and more stable government revenue base than peers. Fitch said. It expects 3.2% growth in 2025 and 2026 and average inflation of 3.9% and 3.3% respectively.
Japanese prime minister Ishiba announced yesterday that he’ll resign from office. Ishiba pre-empted a vote within his own Liberal Democratic Party scheduled for today whether to bring forward a leadership election. But that increasingly risked turning into a confidence vote in which defeat was near-certain. Ishiba’s position became untenable after suffering major election losses that stripped the LDP from its majority in both chambers of parliament. The LDP is rumoured to hold leadership elections early October. The LDP leader traditionally becomes the new prime minister. Ishiba will remain in post until then. The political uncertainty comes against the backdrop of growing concerns about public finances. Ishiba so far resisted calls for even more fiscal largesse (eg. consumption tax cuts) but his successor might not. The long end of the Japanese yield curve underperforms this morning with the 30-year yield adding almost 3 bps. The Japanese yen lags peers.
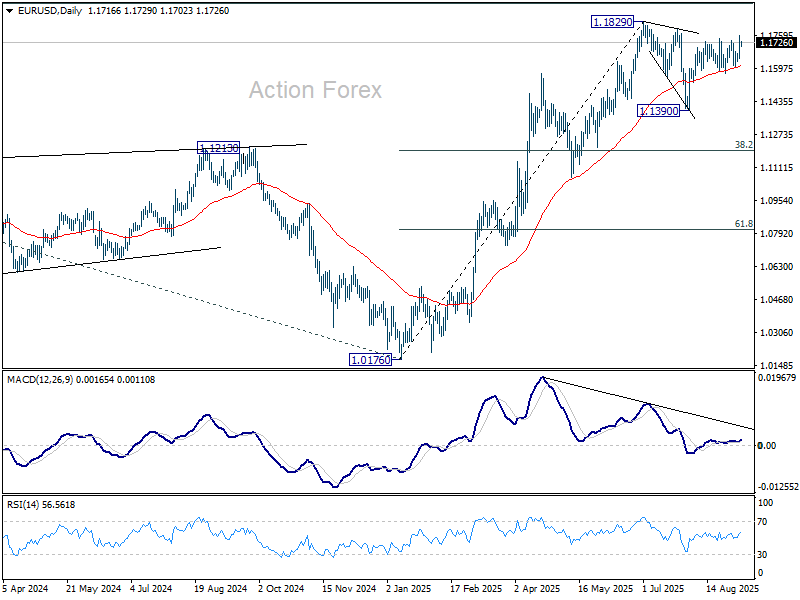
EUR/USD Daily Outlook
Daily Pivots: (S1) 1.1656; (P) 1.1708; (R1) 1.1771; More...
Intraday bias in EUR/USD remains on the upside for the moment. Rise from 1.1390 is resuming and further rally should be seen to retest 1.1829 high. Firm break there will resume larger up trend to 1.1916 projection level. For now, risk will stay on the upside as long as 1.1607 support holds, in case of retreat.
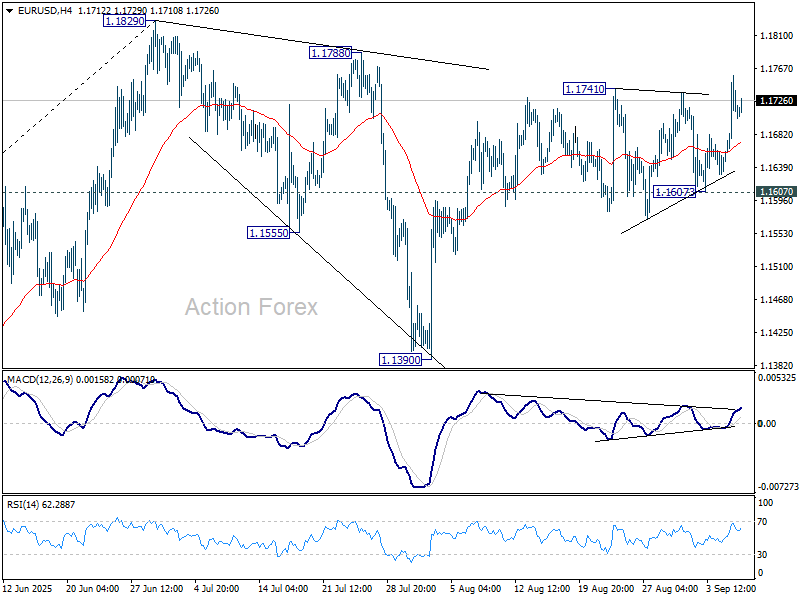
In the bigger picture, rise from 0.9534 (2022 low) long term bottom could be correcting the multi-decade downtrend or the start of a long term up trend. In either case, further rise should be seen to 100% projection of 0.9534 to 1.1274 from 1.0176 at 1.1916. This will remain the favored case as long as 1.1604 support holds.