Sample Category Title
USDJPY Cracks 160 Barrier, Traders Cautious of Potential Intervention
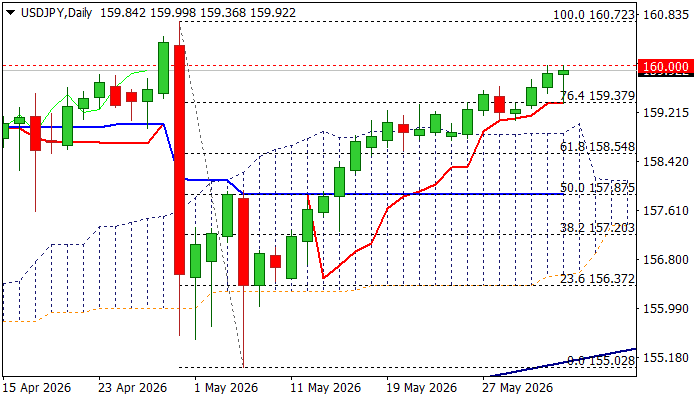
USDJPY hit important 160 resistance but stays below this level for the second consecutive day, as traders remain very cautious after the previous intervention commenced at this zone and Japan’s officials repeated today their readiness to intervene again.
The notion is supported by today’s comments from BoJ’s Governor who highlighted an increased inflationary risk from the energy shock sparked by the war in the Middle East that boosts expectation for a rate hike in central bank’s June policy meeting.
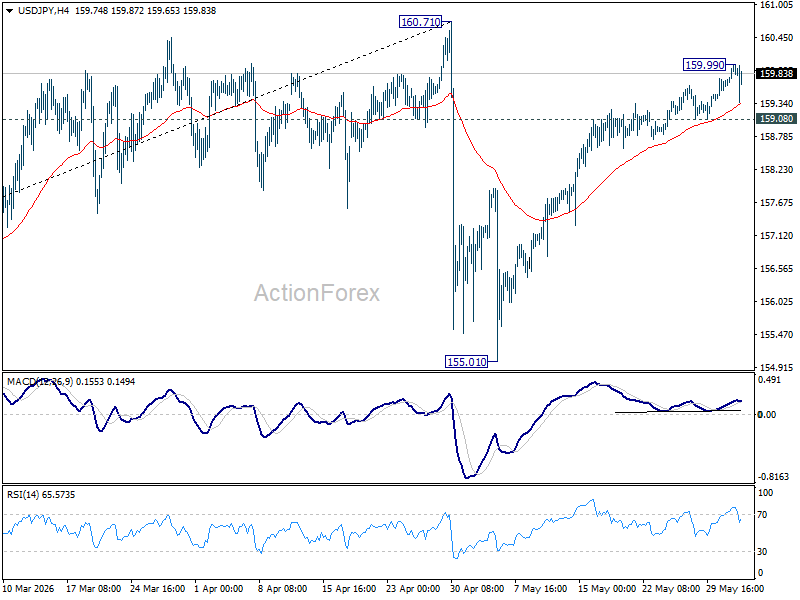
Initial signals of potential stall of larger rally are developing on daily chart (overbought stochastic / 14-d momentum bearish divergence) and contribute to scenario of 160 zone capping the rally from 155.02 (May 6 low), as today’s action was so far shaped in Hanging Man candle that also marks an initial reversal signal.
On the other hand, today’s dips were contained by the first support (daily Tenkan-sen at 155.38) and near-term action is expected to keep bullish bias while holding above daily cloud (top at 159.03), but cloud starts to thin from tomorrow and will twist next week that could attract fresh bears.
Look for initial negative signal on violation of daily Tenkan-sen, which would be boosted on price drop into daily cloud.
On the upside, violation of 160 barrier cannot be ruled out, though upticks are likely to be limited (like on previous attempts in Mar / Apr) on persistent intervention threats.
Res: 160.00; 160.45; 160.72; 161.00
Sup: 159.38; 159.00; 158.54; 157.87
Sunset Market Commentary
Markets
A corresponding rise in the oil price, bond yields and the dollar & softer equities were testament to some investor enervation. For now, we don’t want to call it outright risk aversion yet. Further evidence of the stalemate in the negotiations to solve the US-Iran conflict was the most evident ‘usual suspect’. The concept ‘ceasefire’ these days is undergoing a genuine rebranding/redefining. While officially still in place, the US and Iran again reported several reciprocal (‘defensively inspired’) military actions in the Persian Gulf region. Any solution, including a reopening of the Strait of Hormuz for now remains a far fata morgana. This morning, (US) trade policy also returned to the forefront as a factor of global economic uncertainty. The Office of the US Trade Representative after an investigation into alleged use of forced labour in imported goods of 60 trading partners, proposed a 10% (or 12.5%) levy on imports from those countries to avoid an ‘uneven’ level playing field for US workers, providing a substitution for the reciprocal tariffs that were found unconstitutional. Last but not least, two private credit funds limiting withdrawals also didn’t help to support market confidence risk sentiment. The whole mixed resulted in the Brent oil price regaining some further ground to currently trade near $97.5 p/b. The EuroStoxx50 currently cedes 0.6%. US indices open mixed to marginally softer. On yield markets, a risk-off sentiment as it is often linked to inflationary risks (oil, maybe also tariffs) likewise tends to translate into higher rather than lower yields. EMU/German yields add 3-4 bps across the curve. Markets over the previous days already concluded that an ECB rate hike next week has become ‘unavoidable’. ECB board member Elderson at least supported the tightening case as he indicated that it is increasingly unlikely the ECB can look through Iran shock. A September hike is now also fully discounted. EU April producer prices accelerating to 4.9% Y/Y (cf infra) are pointing in the same direction. US yields in a congruent move add between 3.5 bps (30-y) and 4.5 bps (5-y). May ADP private job growth at 122k was solid (admittedly close to expectations). After finishing this report, the services ISM might further finetune the US growth/inflation picture.
The dollar today profited a bit more from the risk-off that often was the case recently. EUR/USD is testing the 1.16 barrier. DXY at 99.45 is nearing the short-term range top (99.54 May top ). Some interesting price swings also occurred USD/JPY as the pair continues testing the 160 barrier. The pair this morning briefly dipped to the 159.4 area as PM Takaichi in Parliament repeated the country intends to take appropriate steps on FX and that it might happen in an context of international cooperation, including with the US. However, the ‘yen rebound’ was very short-lived. Later, BOJ Governor Ueda in general terms supported the case to continue policy normalization as/if price risks outweigh a potential hit on the economy. Even so, the message that the BOJ will continue to assess ‘the pros and cons of a hike’ was too balanced to support any lasting yen gains. USD/JPY again trades only a whisker away from 160.
News & Views
The OECD updated its economic outlook. Soaring commodity prices pushed up inflation, putting pressure on real economies and economic growth. The global GDP forecast for this year faced a downward revision from 3.4% to 2.8%, while next year’s prognosis remained unchanged at 3.1%. Apart from the base – “time-limited disruption” – scenario, they also produced a “prolonged disruption” scenario which lasts well into 2027 and in which growth is projected at respectively 2.1% and 1.8% Both scenarios occur against a background of an otherwise solid underlying momentum in the global economy, with output boosted by strong AI-related investment, production and trade, lower tariff barriers and supportive financial and fiscal conditions. Global inflation is expected to peak at respectively 4.1% and 5.2% by the end of the year in the two scenarios compared with a pre-war projection of 2.9%. The OECD advises monetary policy to remain vigilant. Temporarily higher headline inflation can only be looked through provided longer-term inflation expectations remain well-anchored. Regarding fiscal policy, they suggest to keep energy relief support temporary and targeted.
Eurozone producer prices rose by 0.6% M/M in April with annual headline PPI surging from 2% to 4.9%, the fastest pace since March 2023. Core PPI (excluding energy) accelerated to 0.9% M/M and 2.3% Y/Y (highest since June 2023). Interestingly, only energy prices were lower on a monthly basis (-0.3% but +12.3% Y/Y) with especially intermediate good prices moving up (+1.8% M/M & 3.9% Y/Y).
US ISM Services Beats Expectations as Price Pressures Hit Highest Since 2022
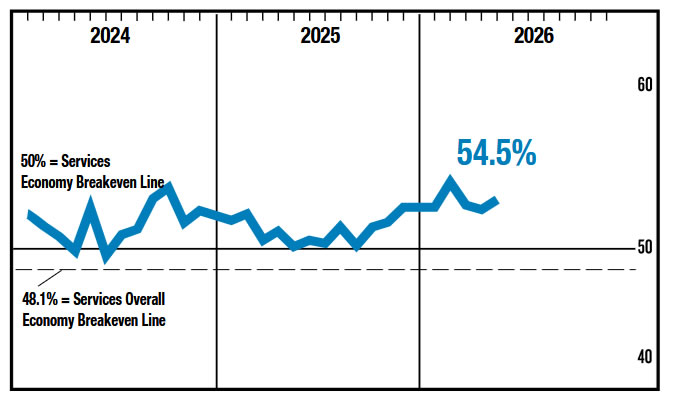
US services sector activity accelerated in May, providing fresh evidence that the economy remains resilient despite elevated interest rates. ISM Services PMI rose from 53.6 to 54.6, beating expectations and marking one of the strongest readings of the past year. Business activity increased from 55.9 to 57.7, while new orders climbed sharply from 53.5 to 57.3, signaling healthy demand across the sector. Seventeen industries reported growth during the month, up from fourteen in April, while only one industry reported contraction.
The report also pointed to a broadening expansion in economic activity. Historically, a Services PMI reading of 54.6 is consistent with roughly 2% annualized real GDP growth, suggesting the US economy continues to expand at a solid pace. The strength in business activity and new orders stands in sharp contrast to recent surveys from Europe, where PMIs have increasingly pointed toward contraction and recession risks.
For markets and policymakers, however, the most notable detail may have been inflation. The prices-paid component rose from 70.7 to 71.3, its highest level since August 2022. Meanwhile, employment remained soft at 47.9, down from 48.0, indicating businesses are meeting demand through productivity gains rather than aggressive hiring.
| Indicator | April | May | Expectation |
|---|---|---|---|
| ISM Services PMI | 53.6 | 54.6 | 53.6 |
| Business Activity | 55.9 | 57.7 | — |
| New Orders | 53.5 | 57.3 | — |
| Employment | 48.0 | 47.9 | — |
| Prices Paid | 70.7 | 71.3 | — |
Dollar Rises as Markets Price Out Quick Iran Deal and Price In Higher Fed Rates
Dollar regained momentum today as two important market narratives moved in its favor simultaneously. First, investors became increasingly skeptical that a US-Iran agreement would be reached quickly, pushing oil prices higher again. Second, stronger-than-expected US employment data reinforced confidence in the economy and strengthened the case for maintaining restrictive monetary policy. Together, those developments helped lift the Dollar broadly across the foreign exchange market.
The biggest shift came from the geopolitical front. Brent crude climbed through $98 as traders reassessed the likelihood of a near-term diplomatic breakthrough. While US President Donald Trump said Iran had agreed not to possess nuclear weapons, he also warned that the country could still reverse its position. Meanwhile, hostilities continued to flare in the Gulf region, with attacks in Kuwait highlighting the fragile security environment. Markets appear to be pricing not an immediate escalation, but a prolonged period of uncertainty that keeps a risk premium embedded in energy prices and sustains inflation concerns.
The second pillar of Dollar strength came from the labor market. ADP private employment increased by 122k in May, beating expectations and indicating hiring remains healthy. Wage growth also remained elevated, suggesting underlying inflation pressures have not faded. The report reinforces the view that the Fed does not need to worry about labor-market weakness and can remain focused on inflation risks. Markets now see around a 60% probability of a Fed rate hike by the end of the year, a figure that could rise further if oil prices stay elevated at current or even higher levels.
Adding to the inflation story was a new trade development. The Office of the U.S. Trade Representative proposed additional tariffs of up to 12.5% on imports from 60 economies, including China, the European Union, and Japan. If implemented, the measures would add another source of upward pressure on import costs at a time when energy-driven inflation risks are already increasing.
Against this backdrop, the divergence between the US and Eurozone remains a key driver in currency markets. While the ECB is expected to raise rates next week, weak PMI surveys suggest recession risks are rising. The Fed, by contrast, faces an economy that continues to generate jobs and absorb higher interest rates. That difference in growth dynamics is helping preserve the Dollar's yield advantage.
Among major currencies, Dollar emerged as the strongest performer of the day so far. Yen ranked second as intervention warnings from Japan slowed the advance in USD/JPY, while Canadian Dollar benefited from the rebound in crude oil. Commodity-linked currencies such as Aussie and Kiwi struggled alongside Swiss Franc as markets shifted toward a more defensive posture. The combination of rising oil, resilient US data, and fading hopes for a quick Iran deal is increasingly becoming a powerful Dollar story.
US ADP Employment Tops Forecasts With 122k Growth as Hiring Broadens Across Industries
The US labor market continues to show surprising resilience. ADP reported stronger-than-expected hiring in May, with job gains spread across industries and business sizes. Combined with steady wage growth, the report suggests the economy is entering the summer with solid employment momentum ahead of Friday's crucial payrolls release. Read More.
Market Heard Japan's Intervention Warning. But USD/JPY 160 Test Still Alive.
Tokyo fired another warning shot at currency markets and the Yen bounced, but the reaction was remarkably limited. USD/JPY remains near 160, suggesting traders are still willing to challenge Japan's intervention line. With a BoJ hike largely priced in, attention is shifting to Friday's US jobs report, which could determine whether the next move is a retreat from 160 or a direct assault on it. Read More.
Eurozone PPI Jumps 0.6% mom, 4.9% yoy as Pipeline Inflation Pressures Build
Another inflation report, another problem for the ECB. Eurozone producer inflation accelerated more than expected in April, with intermediate goods prices posting the strongest monthly increase. The data suggest cost pressures are continuing to move through supply chains, reinforcing the case for a June rate hike even as growth indicators weaken. Read More.
Eurozone PMI Signals 4% Inflation and GDP Contraction. ECB Faces Tough Choice.
The ECB's inflation problem is getting worse just as its growth problem deepens. Eurozone PMI data now point to a possible GDP contraction in the second quarter, while price indicators suggest inflation could approach 4% in coming months. The result is an increasingly uncomfortable dilemma for policymakers heading into next week's meeting. Read More.
UK Services PMI Finalized Below 50 as Inflation and Geopolitics Hurt Confidence
The UK economy lost momentum sharply in May as the services sector slipped into contraction for the first time in more than a year. Businesses cited weaker demand, rising fuel and transportation costs, and growing uncertainty linked to the Middle East conflict. With inflation pressures still running at levels not seen since the 2022 energy crisis, the Bank of England faces an increasingly difficult balancing act. Read More
Bitcoin's Next Stop Could Be $60k. The Bigger Risk May Be $40k.
Bitcoin is facing pressure from both fundamentals and flows. Elevated oil prices are reinforcing higher-for-longer rate fears, while ETF redemptions are creating a steady stream of forced selling. The result is a technical breakdown that could have much further to run. Read More.
Australia Q1 GDP Grows 0.3% qoq, Misses Forecasts as Exports and Mining Drag Growth
Australia's economy started 2026 on a softer footing than expected. Exports recorded their biggest quarterly decline in two years as cyclone disruptions hit mining and trade, while government spending also slowed. A surge in data-centre investment provided a bright spot, but not enough to prevent GDP growth from missing forecasts. Read More.
Japan's PMI Services Stagnates While Cost Pressures Surge
Japan's economy is starting to feel the impact of the Middle East conflict. Services activity stagnated for the first time in over a year as rising prices squeezed household budgets, while businesses faced near-record cost pressures. Manufacturing is still supporting growth, but much of that strength appears linked to precautionary stockpiling rather than underlying demand. Read More.
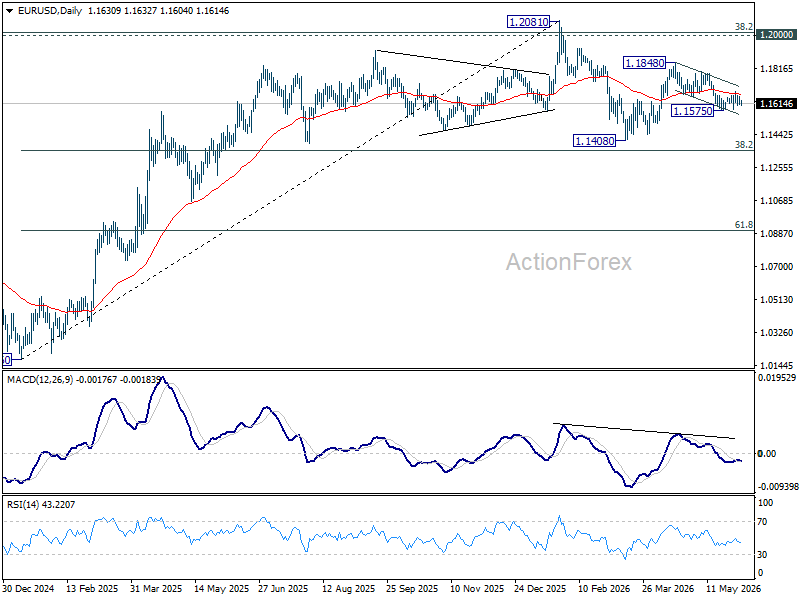
EUR/USD Daily Outlook
Intraday bias in EUR/USD stays neutral as range trading continues. On the downside, break of 1.1575 support will resume the fall from 1.1848 to retest 1.1408 low. Above 1.1865 will target 1.1795 resistance. Firm break there will argue that rise from 1.1408 is ready to resume through 1.1848.
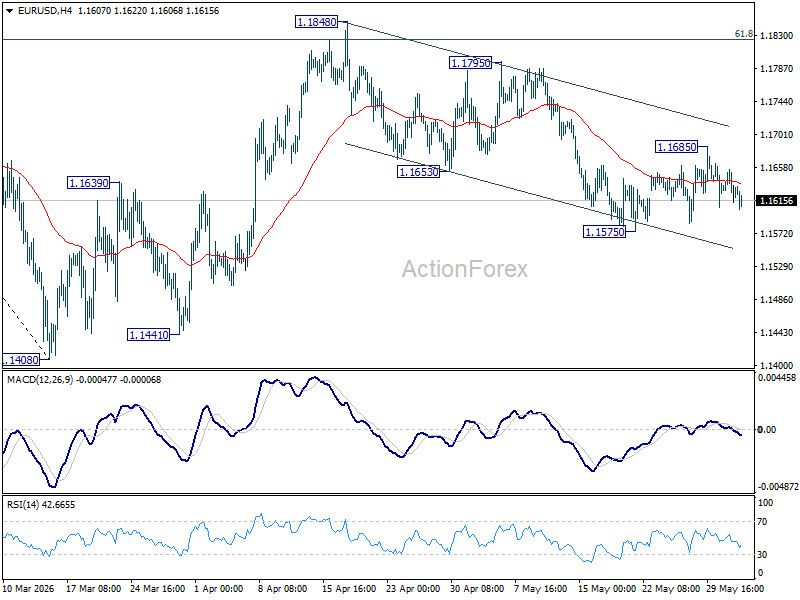
In the bigger picture, the strong support from 38.2% retracement of 1.0176 to 1.2081 at 1.1353 suggests that the pullback from 1.2081 is more likely a corrective move. Strong support was also found in 55 W EMA (now at 1.1542). Focus is back on 1.2 key cluster resistance level. Decisive break there will carry long term bullish implications. Nevertheless, break of 1.1408 support will revive the case of medium term bearish trend reversal.
Forex Market Sceptical About a Swift Deal
- Geopolitics continues to support the US dollar.
- Japan is ready to resume currency interventions.
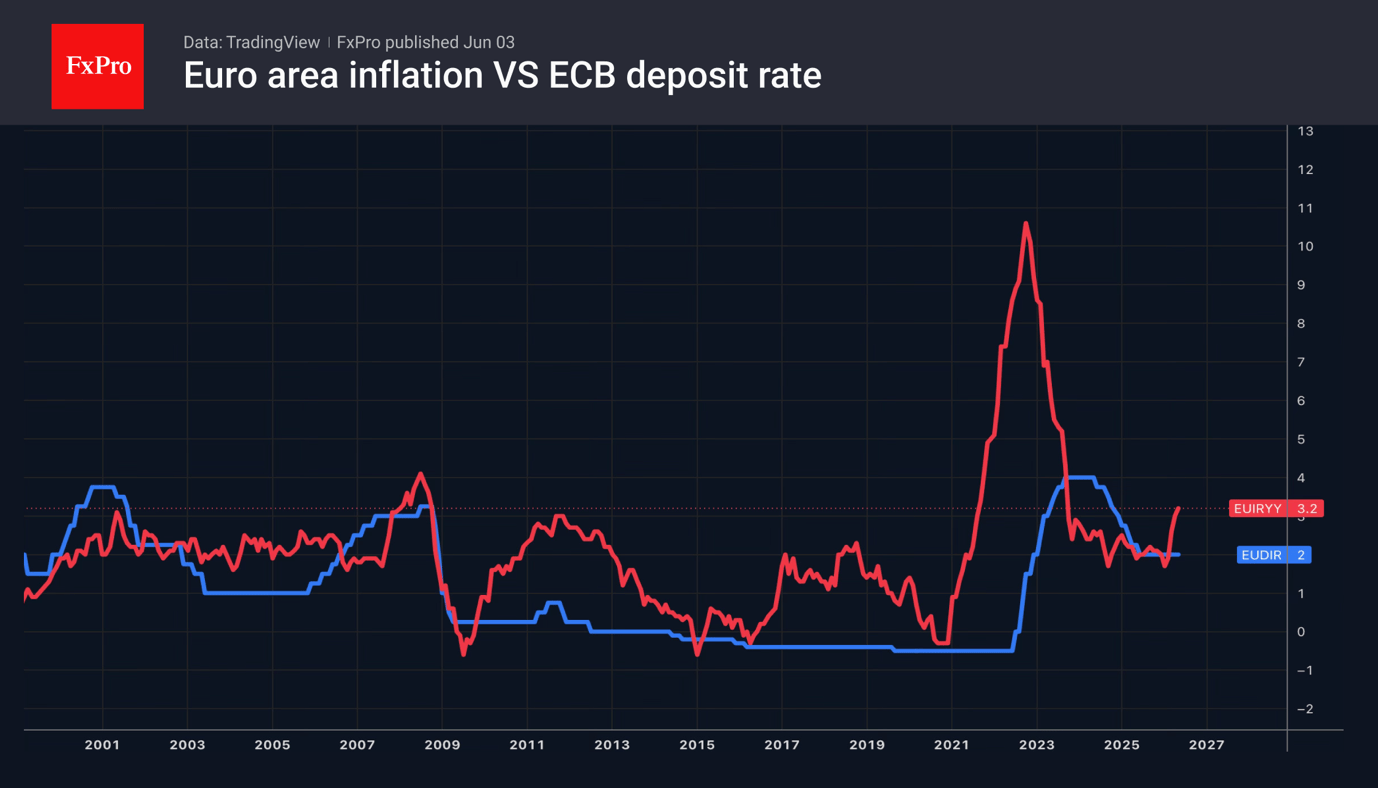
The US dollar has gained fresh momentum following the escalation between the US and Iran. With consumer price inflation in the eurozone rising to 3.2%, the ECB’s decision to raise its deposit rate from 2% to 2.25% in June is virtually a foregone conclusion. Still, the EURUSD pair was far more strongly influenced by disappointment over events in the Middle East, which boosted demand for the greenback.
US attacks on an Iranian tanker led to Tehran bombing its regional neighbours and the Americans striking Qeshm Island. Opponents continue to insist that this kind of escalation does not constitute a breach of the ceasefire, but investors’ faith in a swift peace deal is fading. Polymarket puts the probability of peace being achieved by the end of June at 27% and the chance of the Strait of Hormuz being opened by that time at 22%, compared with 75% and 60% respectively on 23 May, when Donald Trump stated that a deal with Iran had largely been agreed.
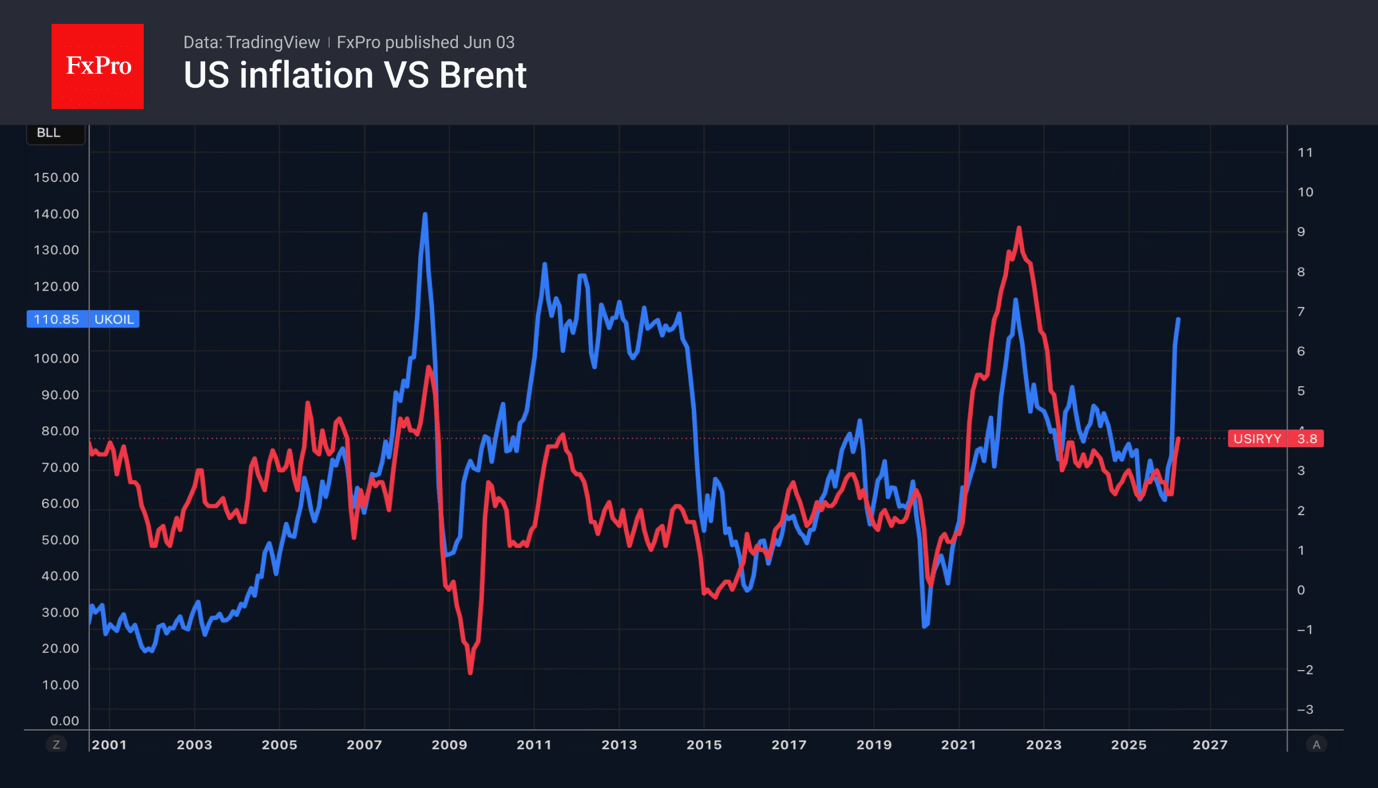
The longer the conflict in the Middle East drags on, the greater the risk of a renewed upward trend in Brent prices and the higher the likelihood that high inflation will become entrenched in the US. According to Beth Hammack, President of the Cleveland Fed, if this happens, the Fed will be forced to act. As hopes for a deal between Washington and Tehran fade, the futures market has pushed the probability of a Fed rate hike in 2026 back up to 56%. Moreover, the chances of at least two hikes have risen to 15%.
This is leading to a strengthening of the US dollar not only against the euro, but also against other global currencies, including the yen. USDJPY is within touching distance of the psychologically significant 160 mark and is currently at levels seen at the turn of April and May. At that time, Japan resorted to currency interventions and pushed the rate down to 155. However, so far, officials from the Land of the Rising Sun have managed to buy time, but not to reverse the trend.
Kazuo Ueda’s latest speech ahead of the BoJ meeting could provide a catalyst for currency interventions. The probability of an overnight rate hike in June stands at 83%. Disappointing rhetoric from the central bank governor could push USDJPY above 160.
Crypto Market Falling, Approaching a Final Sell-off
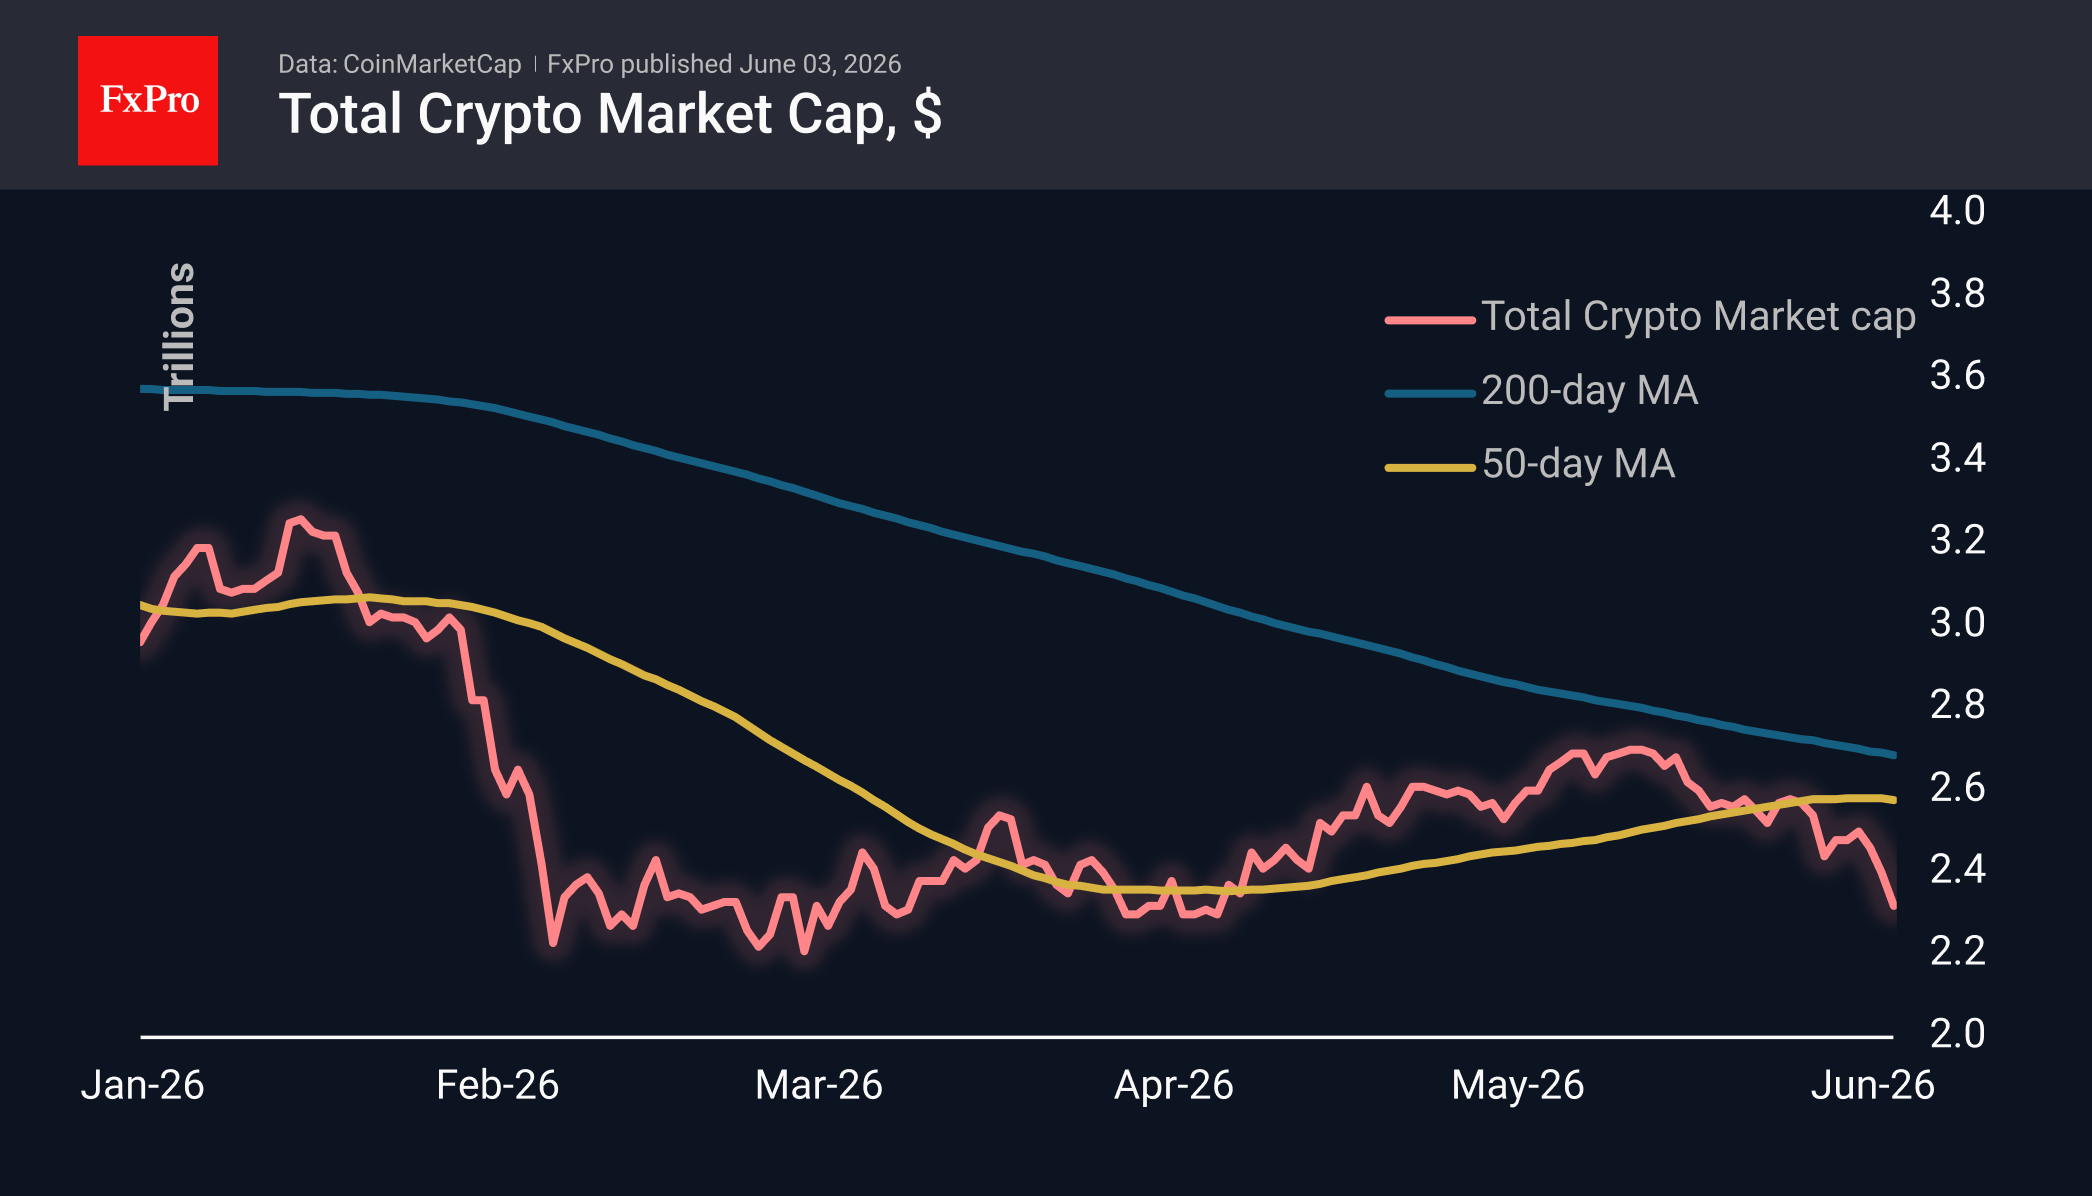
Market Overview
The crypto market has lost a further 5% over the past 24 hours, currently standing at $2.32T, after slipping to $2.27T at the start of Asian trading. The market has not been this low since late March, and this marks a further development of the downward momentum that began in the middle of last month. Capital interest remains focused on equity markets, but the Nasdaq 100 is hitting new highs, despite the alarming pace of market capitalisation contraction with which it was previously closely correlated. Among the top coins, the day’s top gainers were Zcash (+12%), Internet Computer (+9%) and NEAR Protocol (+8.6%). The biggest fallers were Bitcoin Cash (-11.5%), Aptos (-7%) and IOTA (-6.4%).
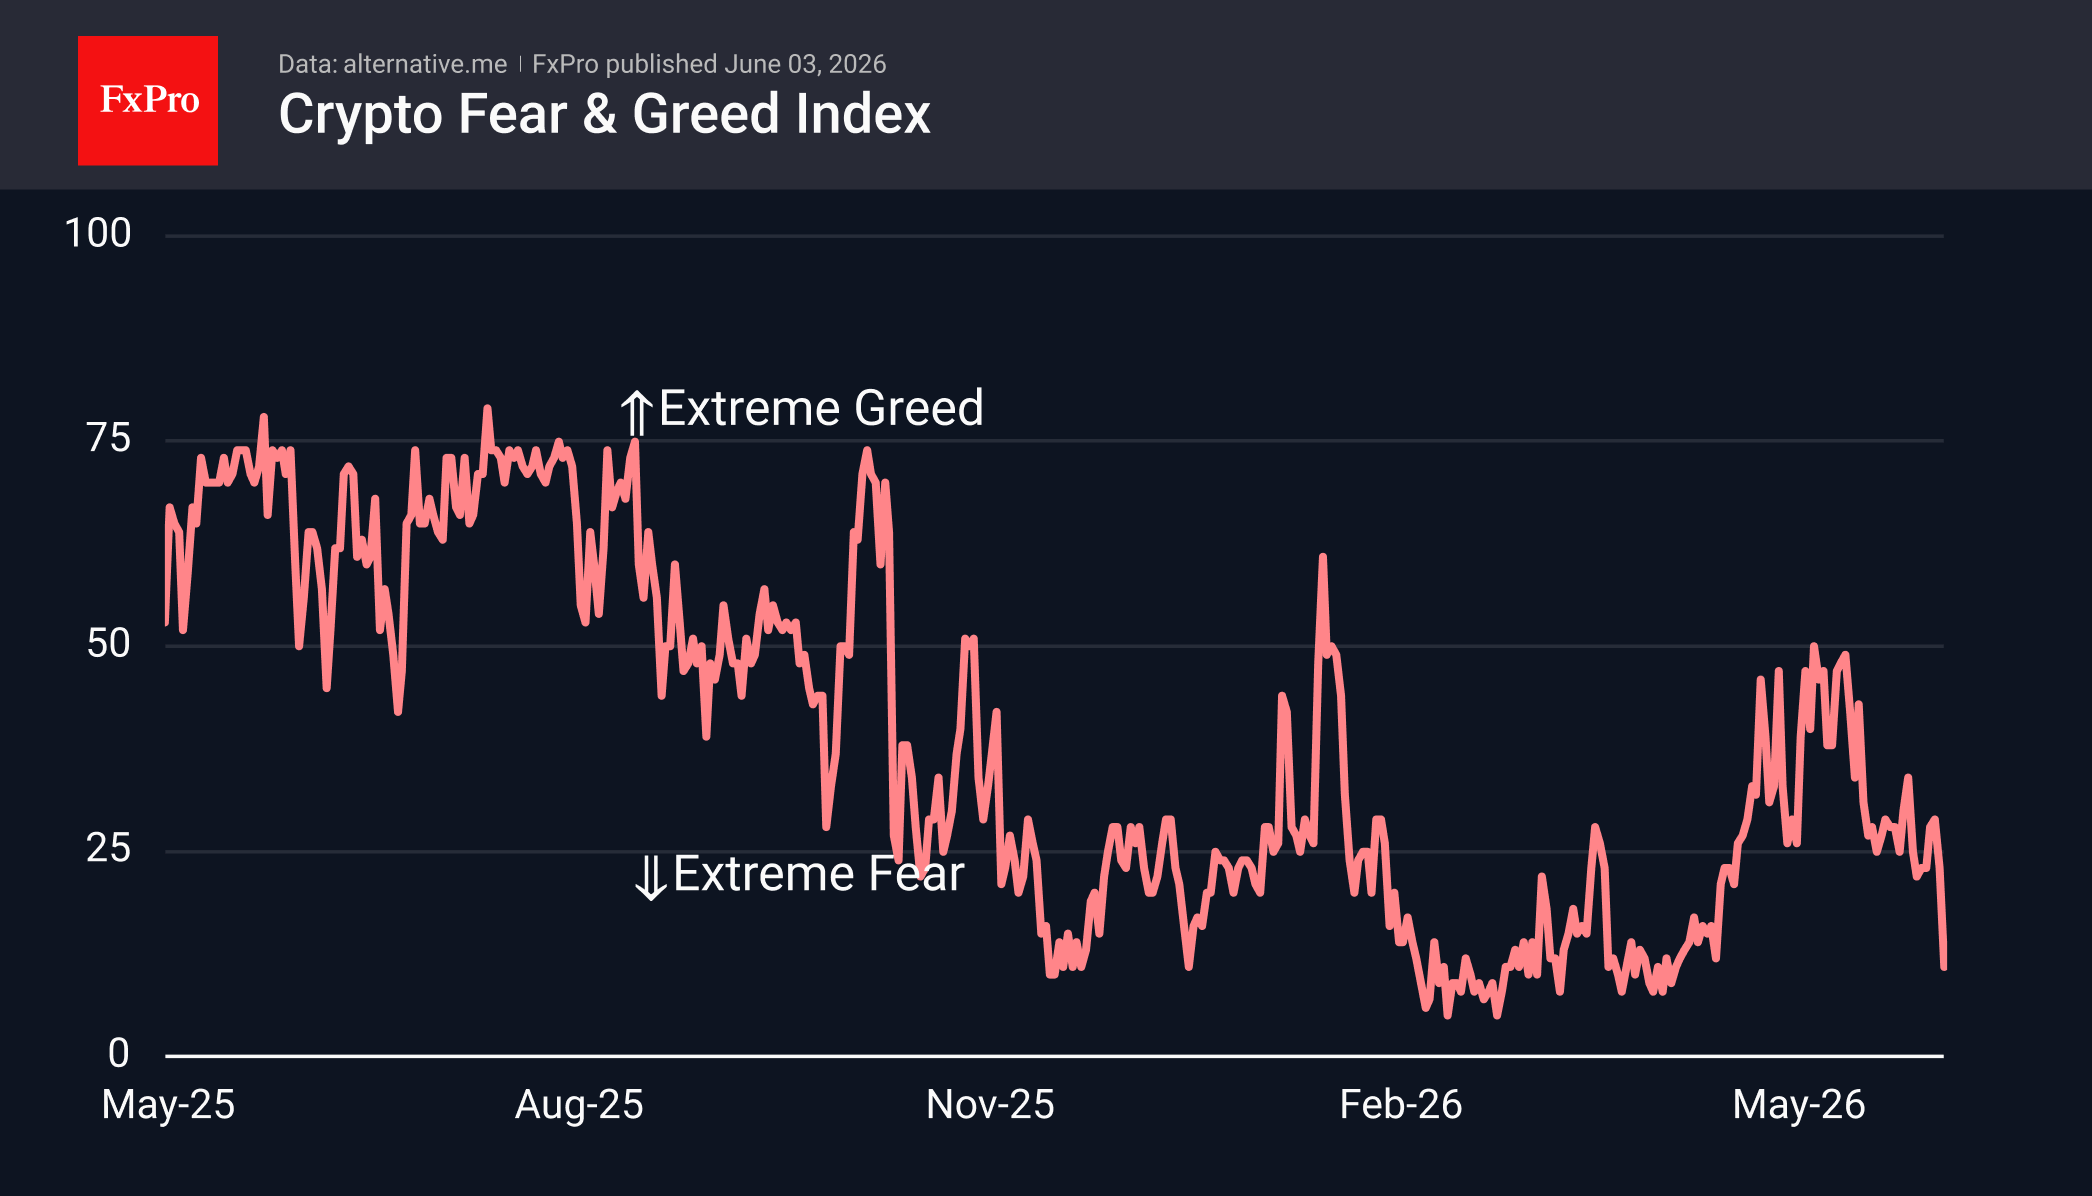
The sentiment index plummeted to 11, its lowest level since early April. In line with the bear market pattern, the indicator stalled near 50 at the start of last month, followed by a decline in price momentum and a deterioration in sentiment.
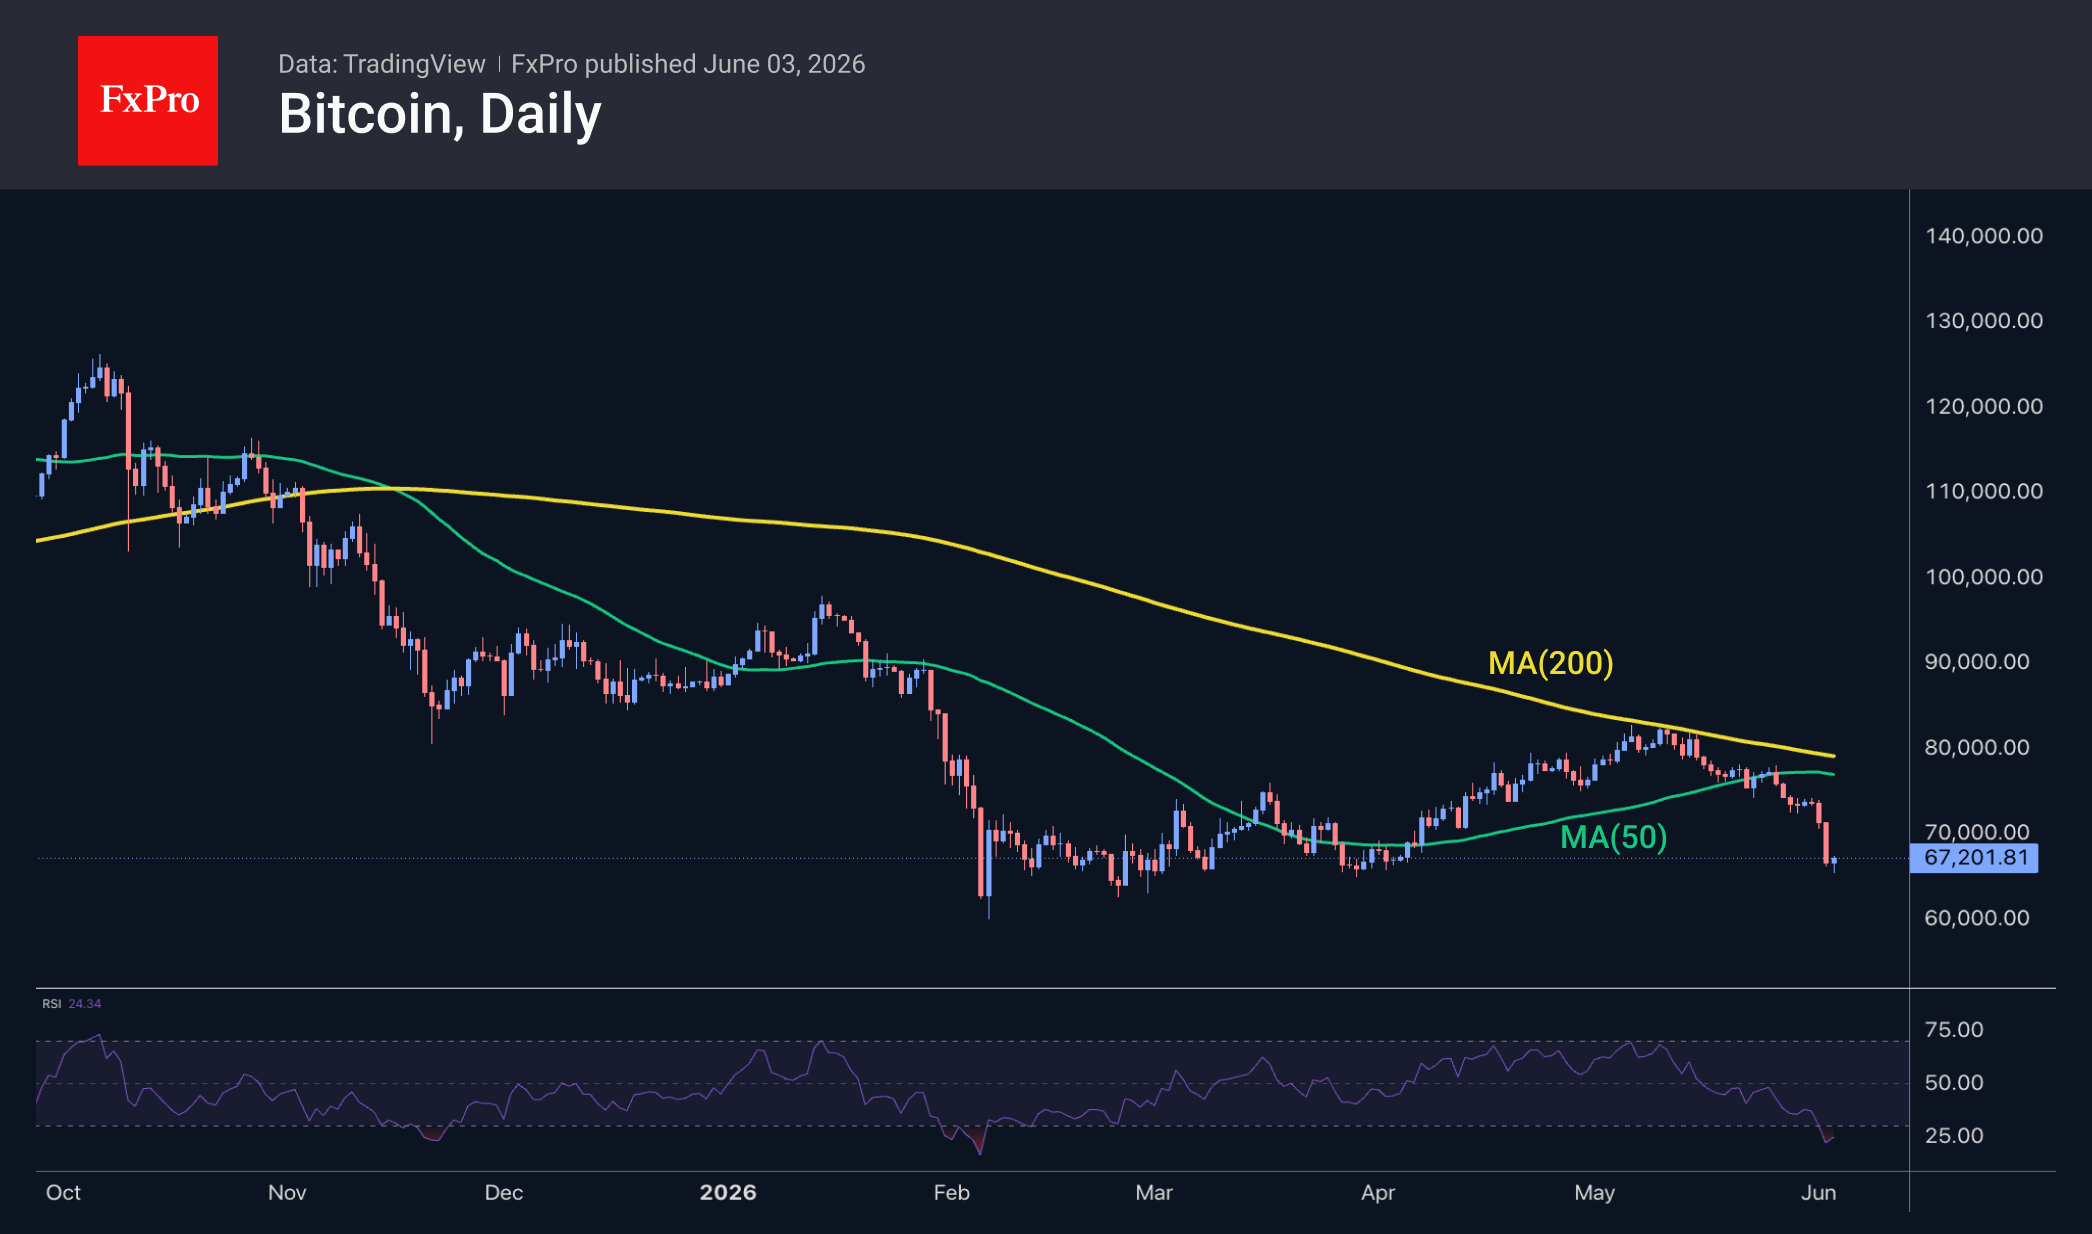
Bitcoin fell below $65.5K at its low point at the start of active Asian trading on Wednesday, bringing the price back to levels that served as strong support in February and March. On daily timeframes, the RSI dropped to 22, a level last seen before the acceleration of the decline in early February. This is dangerous territory where a hunt for stop-loss orders on long positions could begin, followed by an even greater increase in volatility. Starting with Bitcoin, such dynamics often become even more volatile in altcoins.
News Background
BTSE views this as a negative psychological signal, indicating that even the largest holders are feeling pressure from the recent price decline.
According to SoSoValue, outflows from US Bitcoin ETFs have continued for 11 consecutive trading sessions. During this period, investors have withdrawn $3.45 billion from the funds, almost 1.5 times as much as in the whole of May.
Inflows into DAT companies, which accumulate cryptocurrency in their reserves, fell in May to their lowest levels since October 2024. Premiums on crypto treasury shares have begun to decline, Galaxy notes, as investors are no longer willing to overpay simply for access to Bitcoin or Ethereum via the stock market.
US investment firm Strive purchased an additional 2,500 bitcoins ($185.2 million) last week through a preferred share placement. The average purchase price was $74.1K per coin. Strive now holds 19,000 BTC on its balance sheet, moving the company up to seventh place among the largest public holders of BTC.
Tether, the issuer of the USDT stablecoin, transferred 204.3 BTC from its Bitcoin wallet to the Bitfinex crypto exchange. Such transactions may indicate an imminent sale of the asset, EmberCN suggested. Previously, there had been no reports of BTC sales from Tether’s reserves.
According to Arkham, the bankrupt crypto exchange MtGox has moved 10,423 bitcoins ($739 million) to a new address. This is MtGox’s first major transaction since November 2025.
Chart Alert: Bitcoin (BTC/USD) Potential Near-Term Bullish Reversal Emerging from the Sub-$70K Plunge
Key takeaways
- Bitcoin plunged 16% over the past two weeks and briefly fell below the US$70,000 psychological level after MicroStrategy’s partial Bitcoin sale shattered the long-standing “never sell” narrative that had supported market sentiment.
- Despite the sharp decline, several contrarian indicators suggest selling pressure may be nearing exhaustion, including an extremely oversold daily RSI reading, a surge in long-position liquidations, and signs of renewed accumulation by long-term holders.
- Technical and on-chain metrics indicate the potential for a near-term bullish reversal above the key US$62,250 support level, with upside targets at US$74,880 and US$82,815 if buying momentum returns.
Let’s unpack the primary drivers and the technical setup.
The plunge and its fundamental catalysts
On Monday and Tuesday (1–2 June 2026), the cryptocurrency market absorbed a significant psychological blow. Spot BTC/USD tumbled sharply, slipping below the $70,000 psychological threshold and falling 16% over the past two weeks. It printed an intraday low of $65,370 on Wednesday, 3 June 2026.
The dominant driver of this week’s movement was the revelation that MicroStrategy, the world’s largest corporate holder of Bitcoin, sold a portion of its holdings for the first time in four years.
While the market impact is less about the absolute volume of the sale and more about the erosion of consensus, it effectively shattered founder Michael Saylor’s widely echoed “never sell” iron law.
This pivot disrupted the pricing anchor the market had historically relied on, injecting uncertainty and triggering a wave of defensive selling.
Technical and on-chain analysis suggesting a setup for a bullish reversal
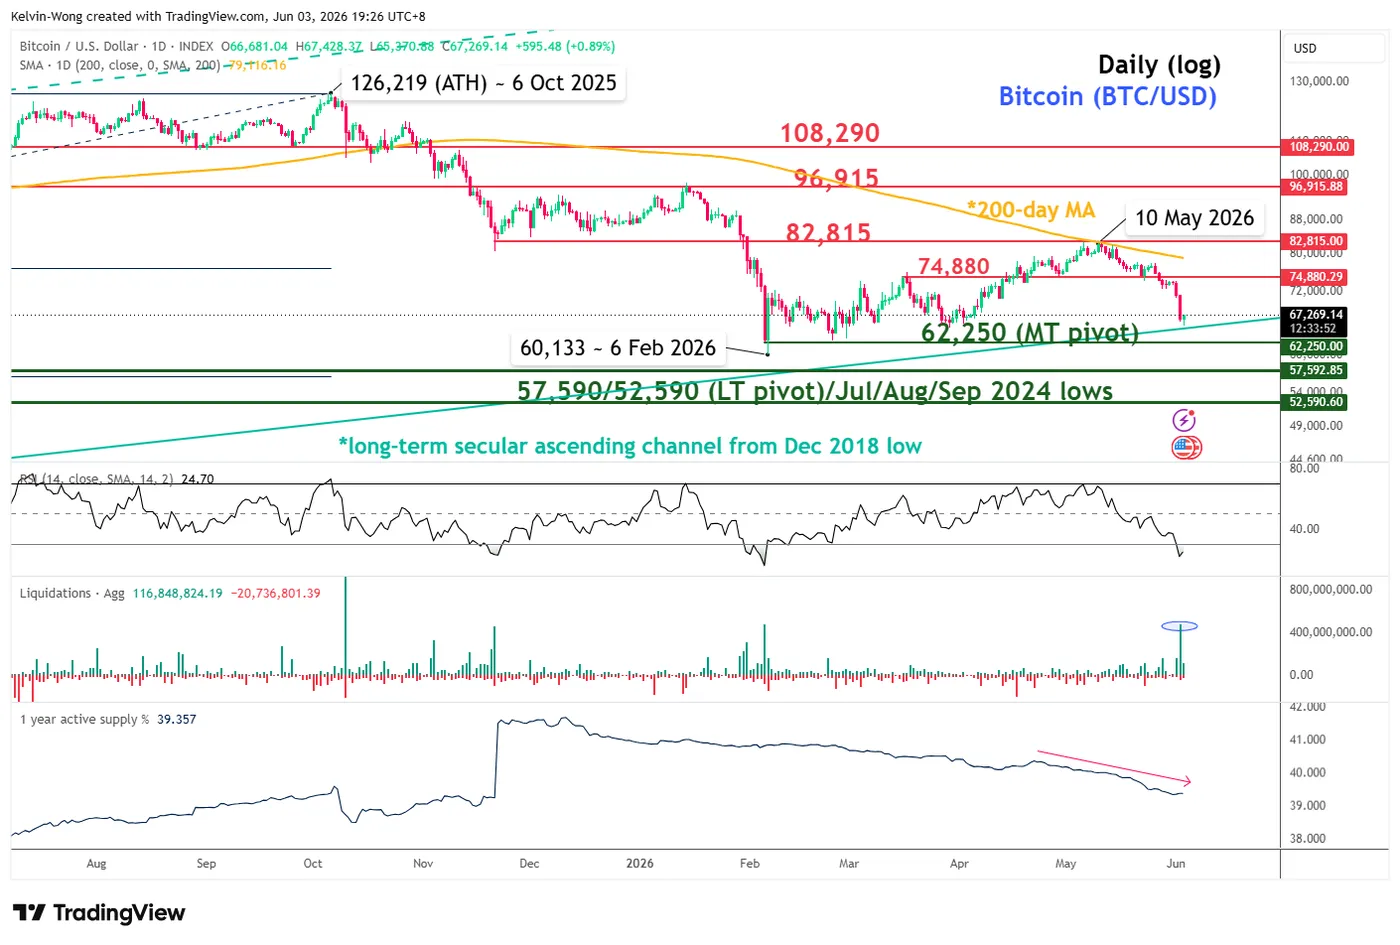
Fig. 1: Bitcoin (BTC/USD) medium-term trend as of 3 Jun 2026 (Source: TradingView). The information presented is historical information, and past performance is not indicative of future performance.
The 16% plunge in BTC/USD has left it hovering just above its $62,250 key medium-term pivotal support and the lower boundary of its long-term secular ascending channel running from the December 2018 low.
In addition, the daily RSI momentum indicator hit a significant oversold level of 21.8 on Tuesday, 2 June 2026, its lowest since 5 February 2026, triggering a 35% rally in BTC/USD over the next three months.
Secondly, utilising TradingView’s crypto derivatives indicators for crypto futures and perpetual swaps, such as from Bybit, Binance, and OKX.
Aggregated long liquidation data (derived from various exchanges) spiked to $482 million on Tuesday, 2 June 2026, indicating that many leveraged long positions in Bitcoin futures and perpetual swaps were forced closed due to margin calls.
A similar rise in long liquidations ($481 million) also occurred on 5 February 2026, when capitulation led to a 35% rally in BTC/USD.
Thirdly, on-chain indicator: the percentage of 1-year active supply for Bitcoin has declined steadily over the past three weeks, from 40.3% on 23 April 2026 to 39.3% on Wednesday, 3 June 2026, at the time of writing.
Active supply 1-year measures the total number of unique cryptocurrency units that have moved at least once over the past 1 year. This metric tracks the portion of supply that has been involved in on-chain transactions during the trailing 365-day period.
A decreasing active supply often signals accumulation by long-term holders, a bullish condition for Bitcoin in the current context.
Hence, based on these factors, BTC/USD is now ripe for a potential near-term bullish reversal above the $62,250 key medium-term support, with intermediate resistance at $74,880. A clearance above it would signal a retest of the $82,815 medium-term resistance (also close to the 200-day moving average).
On the other hand, a daily close below $62,250 invalidates the recovery scenario and extends the corrective decline towards the $57,590/52,590 long-term pivotal support zone.
US ADP Employment Tops Forecasts With 122k Growth as Hiring Broadens Across Industries
US ADP private-sector employment increased by 122k in May, beating expectations of 110k and pointing to continued resilience in the labor market ahead of Friday's closely watched non-farm payrolls report. Hiring was concentrated in services, which added 114k jobs, while goods-producing industries contributed 8k. Small businesses led job creation with 67k new positions, followed by large firms with 40k and medium-sized employers with 17k.
The report also suggested wage pressures remain elevated but stable. Annual pay growth for workers who stayed in their jobs held steady at 4.4%, while pay growth for job changers eased slightly from 6.6% to 6.5%. The figures indicate that wage inflation is not accelerating, but it remains well above levels typically associated with the Federal Reserve's 2% inflation objective.
ADP Chief Economist Nela Richardson said, "Hiring was more broad-based in May than we've seen in the last few years," adding that "the labor market continues to show sustained momentum going into the summer hiring season." For markets, the report reinforces the view that the US economy remains on solid footing despite higher interest rates and elevated energy prices. While ADP is not always a reliable predictor of the official payrolls report, the stronger-than-expected reading may modestly reduce concerns about an abrupt slowdown in employment growth and keep attention focused on inflation rather than labor-market weakness.
| Indicator | May | Expectation |
|---|---|---|
| ADP Private Employment Change | +122k | +110k |
| Sector | Jobs Added |
|---|---|
| Goods-Producing | +8k |
| Service-Providing | +114k |
| Total | +122k |
| Establishment Size | Jobs Added |
|---|---|
| Small Businesses | +67k |
| Medium Businesses | +17k |
| Large Businesses | +40k |
| Category | April | May |
|---|---|---|
| Job-Stayers | 4.4% | 4.4% |
| Job-Changers | 6.6% | 6.5% |
EUR/USD Daily Outlook
Intraday bias in EUR/USD stays neutral as range trading continues. On the downside, break of 1.1575 support will resume the fall from 1.1848 to retest 1.1408 low. Above 1.1865 will target 1.1795 resistance. Firm break there will argue that rise from 1.1408 is ready to resume through 1.1848.
In the bigger picture, the strong support from 38.2% retracement of 1.0176 to 1.2081 at 1.1353 suggests that the pullback from 1.2081 is more likely a corrective move. Strong support was also found in 55 W EMA (now at 1.1542). Focus is back on 1.2 key cluster resistance level. Decisive break there will carry long term bullish implications. Nevertheless, break of 1.1408 support will revive the case of medium term bearish trend reversal.
USD/JPY Daily Outlook
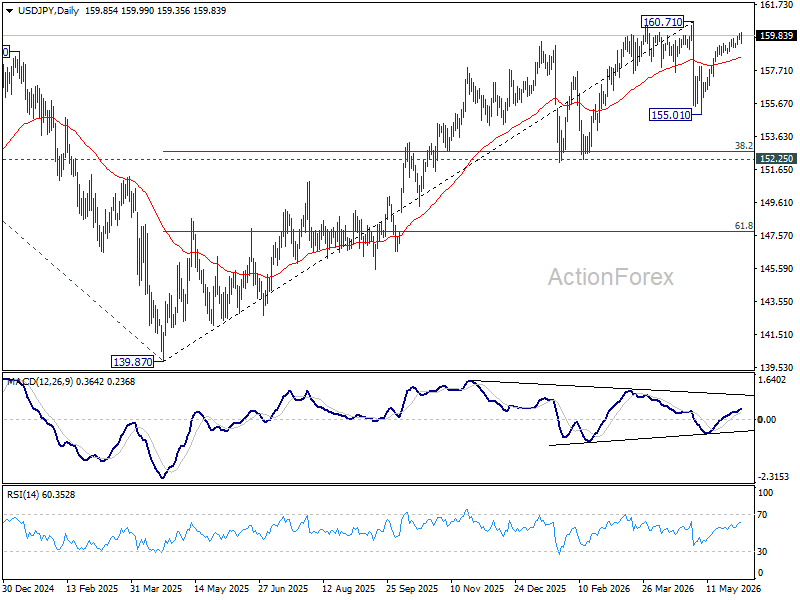
Intraday bias in USD/JPY is turned neutral with current retreat. On the upside, above 159.99 will resume the rally from 155.01. Strong resistance should be seen from 160.71 high to limit upside. On the downside, break of 159.08 minor support will turn bias back to the downside for 55 D EMA (now at 158.46) and below.
In the bigger picture, for now, corrective pattern from 161.94 (2024 high) is still seen as completed at 139.87. Rise from there is seen as resuming the long term up trend. So, break of 161.94 is expected at a later stage to resume the long term up trend. However, sustained break of 55 W EMA (now at 154.55) will dampen this view and bring deeper fall back towards 139.87 to extend the pattern from 161.94.