Sample Category Title
Dollar Falls as Peace Hopes Return, But Risks Haven’t Gone Away
Financial markets traded with a mixed tone today as investors tried to balance fresh signs of diplomatic progress in the Middle East against lingering concerns that the region's energy and security risks are far from resolved. The shift in sentiment was reflected most clearly in currency markets, where Dollar weakened broadly as traders scaled back some of the safe-haven demand that had supported the greenback earlier in the week.
The latest optimism came after US President Donald Trump said in a social media post that he was "in the middle of my final negotiations to end the War with the Islamic Republic of Iran." The comments revived hopes that Washington and Tehran could still reach some form of agreement despite several days of conflicting headlines, military incidents, and reports suggesting talks had stalled.
Supporting the more constructive mood was news of a new US-mediated ceasefire agreement between Israel and Lebanon. Lebanese President Joseph Aoun said the ceasefire could come into force within 24 hours after approval by all concerned parties. While Hezbollah has yet to publicly comment, markets interpreted the development as another sign that diplomatic efforts across the region are continuing rather than collapsing.
Oil prices responded accordingly. Brent crude slipped back below $95 a barrel, reversing part of this week's rebound. The decline suggests traders are once again assigning a higher probability to some form of ceasefire extension or interim agreement rather than an immediate escalation toward a broader regional conflict. Yet the move lower in oil was relatively modest, reflecting continued caution about the underlying situation.
Indeed, few market participants appear willing to fully embrace the peace narrative. The US-Iran negotiations have repeatedly swung between optimism and disappointment over recent months. Traders know that a single headline can quickly reverse sentiment, particularly when key issues surrounding regional security, energy flows, and sanctions remain unresolved. The result is a market that is reducing risk premiums rather than removing them altogether.
There are also growing concerns that even if diplomacy succeeds, the economic damage may already be accumulating. According to a Politico report, energy industry executives have recently warned senior White House officials that global petroleum inventories are being steadily depleted as disruptions linked to the Middle East continue. Refiners are reportedly relying more heavily on storage inventories to replace barrels no longer arriving from the region, raising the prospect of tighter supply conditions later in the summer.
That warning helps explain why oil traders remain cautious despite improving geopolitical headlines. The concern is not limited to whether the Strait of Hormuz remains open. Instead, the market is increasingly focused on how long current supply disruptions can persist before inventory drawdowns begin to create a more visible shortage. In that sense, lower oil prices may reflect improving sentiment today, but not necessarily confidence about the outlook several weeks from now.
Elsewhere, risk appetite was also restrained by weakness in US equity futures. S&P 500 futures pointed lower as Broadcom led semiconductor shares down following a fiscal second-quarter revenue miss. The decline threatens the S&P 500's nine-week winning streak and raises questions about whether the AI-driven equity rally can maintain its momentum.
In currency markets, Dollar was the weakest performer of the day as easing geopolitical concerns reduced safe-haven demand. Canadian Dollar followed as lower oil prices weighed on sentiment, while Yen also underperformed. Swiss Franc led gains, benefiting from the retreat in energy prices and lower global yield pressure, followed by Euro and Sterling. Aussie and Kiwi traded in the middle of the pack as markets searched for clearer direction. For now, markets are willing to price progress on Iran, but they remain unwilling to conclude that the risks have disappeared.
US Initial Jobless Claims Jump to 225K vs Exp. 211k
The US labor market may be losing a little momentum, but it is not showing signs of breaking. Initial jobless claims rose more than expected last week, yet continuing claims remained relatively stable, suggesting layoffs are increasing only gradually. With Friday's payrolls report approaching, markets are still waiting for a definitive signal on employment conditions. Read More.
USD/CAD Surges on New US Tariff Threats. A Break Above 1.40 Could Change Everything.
Oil is rising, but the Canadian Dollar is falling. That's because markets are increasingly worried about a proposed 12.5% US tariff that could bypass Canada's traditional trade protections and hit an economy already struggling with stagnant growth. With USD/CAD approaching the critical 1.40 level, the question is whether this bounce is merely a correction—or the start of a much bigger trend. Read More.
Swiss Inflation Misses Expectations, unchanged at 0.6% in May
Swiss May CPI held at just 0.6%, well below expectations and comfortably within the SNB's target range. The data reinforce the view that Switzerland remains largely insulated from the inflation pressures forcing other policymakers toward a more hawkish stance. Read More.
EUR/CHF and GBP/CHF Gain Breakout Momentum as US-Iran Stalemate Keeps Oil Elevated
Most investors associate geopolitical uncertainty with a stronger Swiss Franc. This time, the opposite may be true. As US-Iran negotiations drag on and oil prices remain elevated, inflation concerns are pushing the ECB and BoE toward tighter policy while Switzerland remains comfortably within its inflation target. The result is a widening policy divergence that may continue to support EUR/CHF and GBP/CHF. Read More.
RBA's Bullock Warns Second-Round Inflation Risks Are Emerging
The RBA believes its rate hikes are finally starting to work. The problem is that a new inflation threat is emerging. Governor Michele Bullock warned that higher fuel costs linked to the Middle East conflict are beginning to spread through the economy, raising concerns that energy-driven inflation could become embedded in a broader range of goods and services. Read More.
EUR/USD Daily Outlook
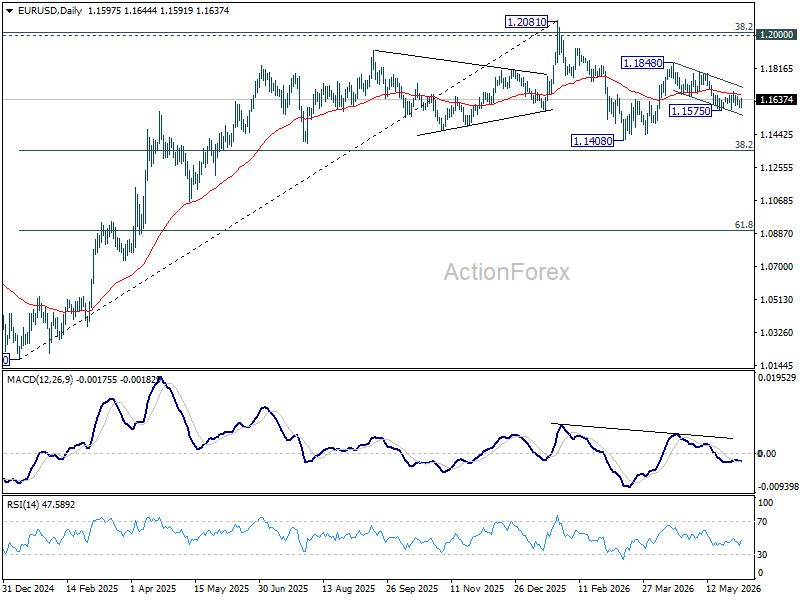
EUR/USD is staying in range above 1.1575 and intraday bias remains neutral. On the downside, break of 1.1575 support will resume the fall from 1.1848 to retest 1.1408 low. Above 1.1865 will target 1.1795 resistance. Firm break there will argue that rise from 1.1408 is ready to resume through 1.1848.
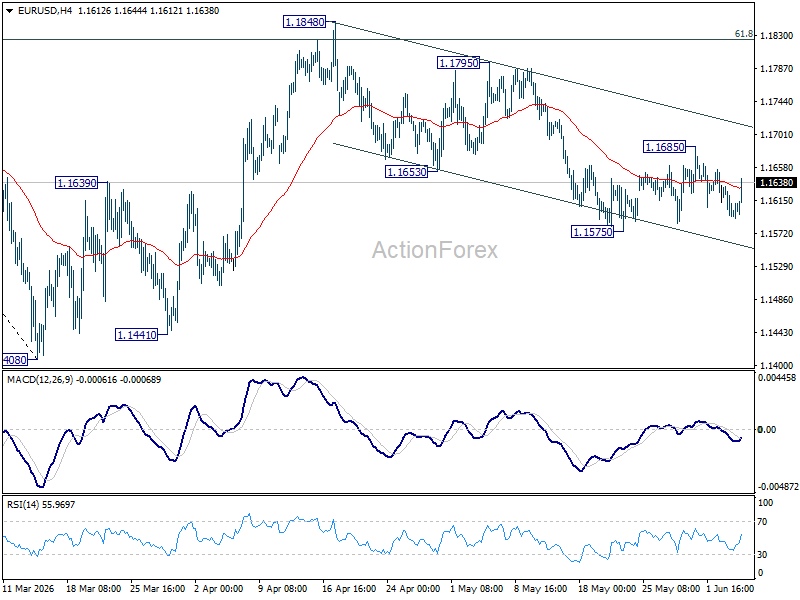
In the bigger picture, the strong support from 38.2% retracement of 1.0176 to 1.2081 at 1.1353 suggests that the pullback from 1.2081 is more likely a corrective move. Strong support was also found in 55 W EMA (now at 1.1542). Focus is back on 1.2 key cluster resistance level. Decisive break there will carry long term bullish implications. Nevertheless, break of 1.1408 support will revive the case of medium term bearish trend reversal.
US Initial Jobless Claims Jump to 225K vs Exp. 211k
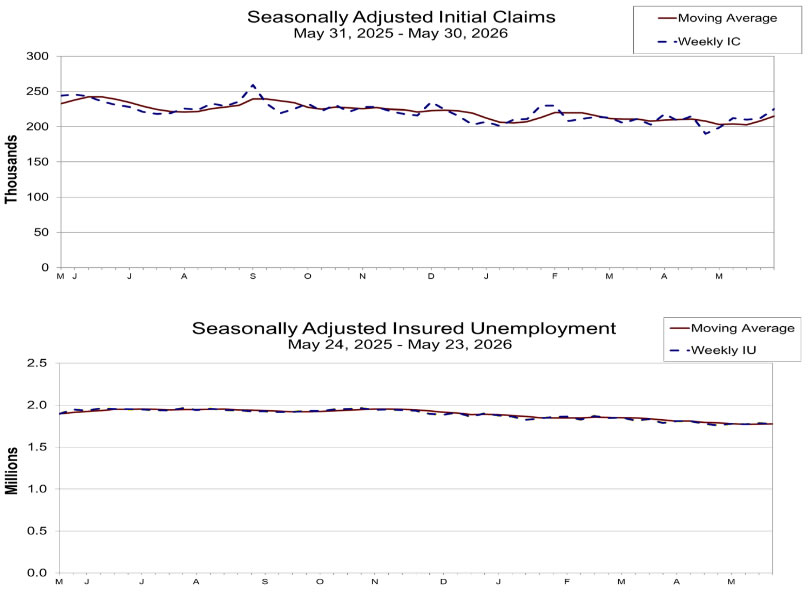
US initial jobless claims rose by 13k to 225k in the week ending May 30, exceeding expectations of 211k and marking a modest softening in labor market conditions ahead of Friday's closely watched non-farm payrolls report. The four-week moving average, which smooths out weekly volatility, increased by 6.5k to 214.75k, suggesting layoffs have edged higher in recent weeks.
However, the broader picture remains far from alarming. Continuing claims fell by -8k to 1.777m in the week ending May 23, indicating that unemployed workers are not finding it significantly more difficult to secure new jobs. While the four-week average of continuing claims ticked up slightly to 1.777m, overall claims levels remain historically consistent with a labor market that is slowing only gradually.
| Indicator | Previous | Latest | Expectation |
|---|---|---|---|
| Initial Jobless Claims | 212k | 225k | 211k |
| Four-Week Avg. Initial Claims | 208.25k | 214.75k | — |
| Continuing Claims | 1.785m | 1.777m | — |
| Four-Week Avg. Continuing Claims | 1.772m | 1.777m | — |
EUR/USD Daily Outlook
EUR/USD is staying in range above 1.1575 and intraday bias remains neutral. On the downside, break of 1.1575 support will resume the fall from 1.1848 to retest 1.1408 low. Above 1.1865 will target 1.1795 resistance. Firm break there will argue that rise from 1.1408 is ready to resume through 1.1848.
In the bigger picture, the strong support from 38.2% retracement of 1.0176 to 1.2081 at 1.1353 suggests that the pullback from 1.2081 is more likely a corrective move. Strong support was also found in 55 W EMA (now at 1.1542). Focus is back on 1.2 key cluster resistance level. Decisive break there will carry long term bullish implications. Nevertheless, break of 1.1408 support will revive the case of medium term bearish trend reversal.
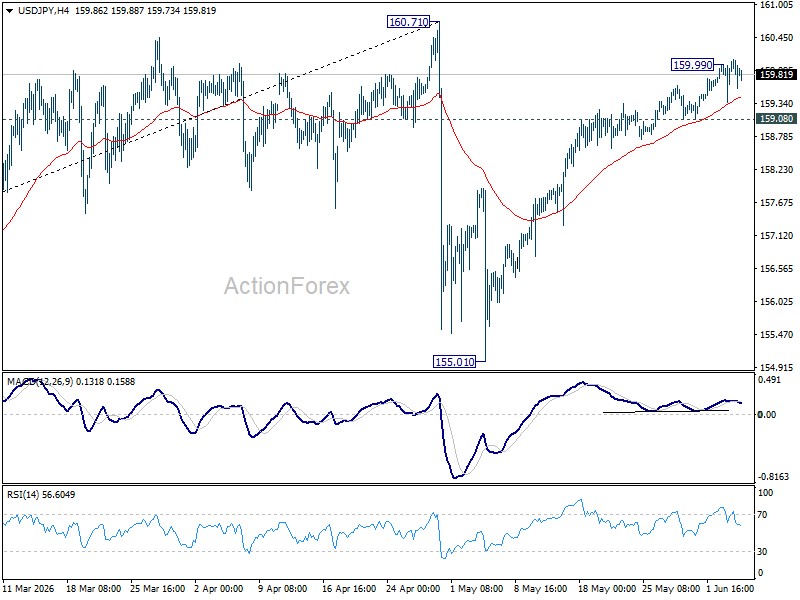
USD/JPY Daily Outlook
Intraday bias in USD/JPY is back on the upside with breach of 159.99. Further rise would be seen to retest 160.71. Strong resistance shold be seen there to limit upside. On the downside, break of 159.08 minor support will turn bias back to the downside for 55 D EMA (now at 158.56) and below.
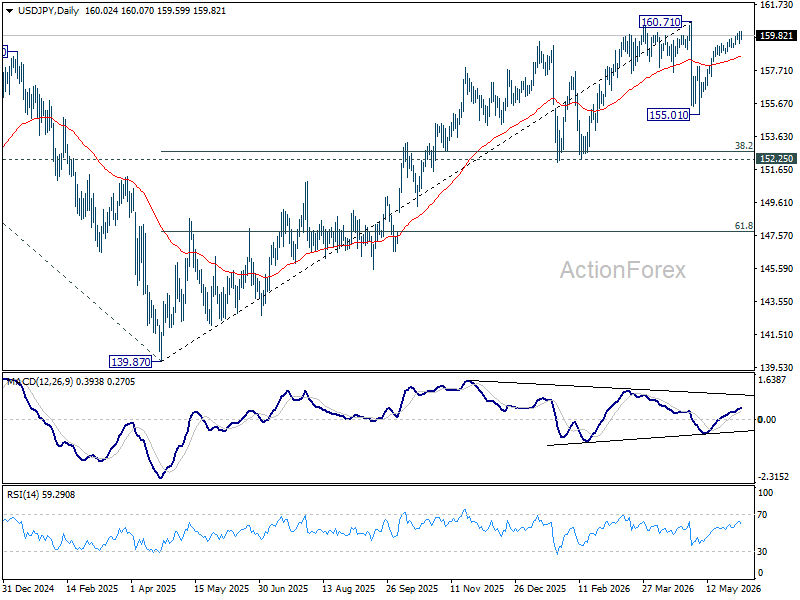
In the bigger picture, for now, corrective pattern from 161.94 (2024 high) is still seen as completed at 139.87. Rise from there is seen as resuming the long term up trend. So, break of 161.94 is expected at a later stage to resume the long term up trend. However, sustained break of 55 W EMA (now at 154.55) will dampen this view and bring deeper fall back towards 139.87 to extend the pattern from 161.94.
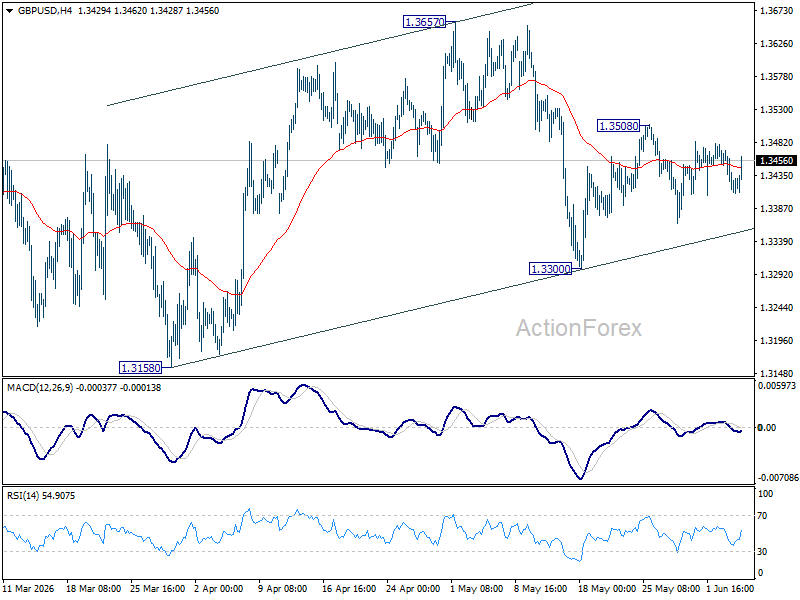
GBP/USD Daily Outlook
GBP/USD is still bounded in range trading. Intraday bias remains neutral for the moment. On the upside, above 1.3508 will extend the rebound from 1.3300 to 1.3657 resistance first. On the downside, below 1.3300 will bring deeper fall back to 1.3158 support instead.
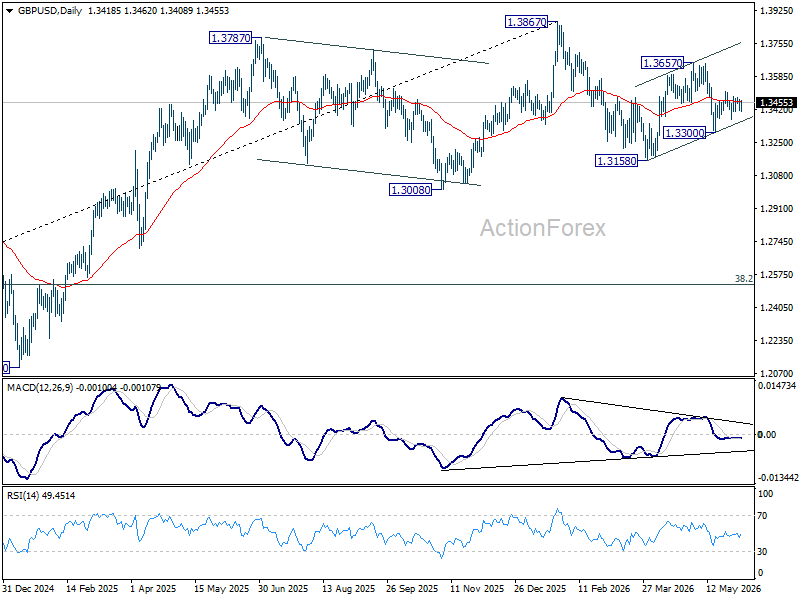
In the bigger picture, price actions from 1.3867 are a corrective pattern within the broader up trend from 1.0351 (2022 low). With 1.3008 support intact, medium term bullishness is maintained and break of 1.3867 is in favor for a later stage, towards 1.4248 key resistance (2021 high). However, firm break of 1.3008 will at least bring deeper fall to 38.2% retracement of 1.0351 to 1.3867 at 1.2524, with increased risk of bearish reversal.
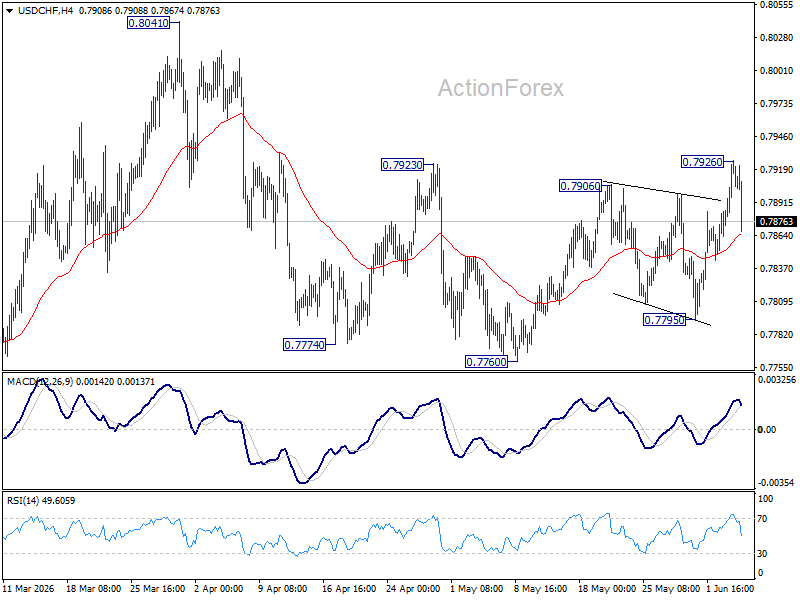
USD/CHF Daily Outlook
USD/CHF edged higher to 0.7926 but retreated sharply from there. Intraday bias remains neutral at this point. On the upside, firm break of 0.7926 will resume the rebound from 0.7760 to retest 0.8041. On the downside, below 0.7795 will bring deeper fall to 0.7760 support instead.
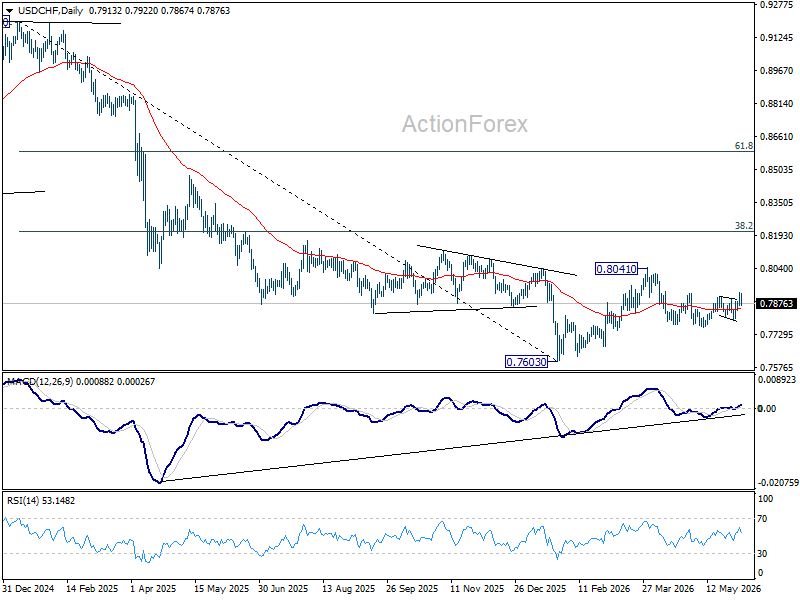
In the bigger picture, as long as 55 W EMA (now at 0.8028) holds, fall from 0.9200 is expected to continue, as part of the larger down trend. Firm break of 0.7603 will target 100% projection of 1.0146 (2022 high) to 0.8332 from 0.9200 at 0.7382.
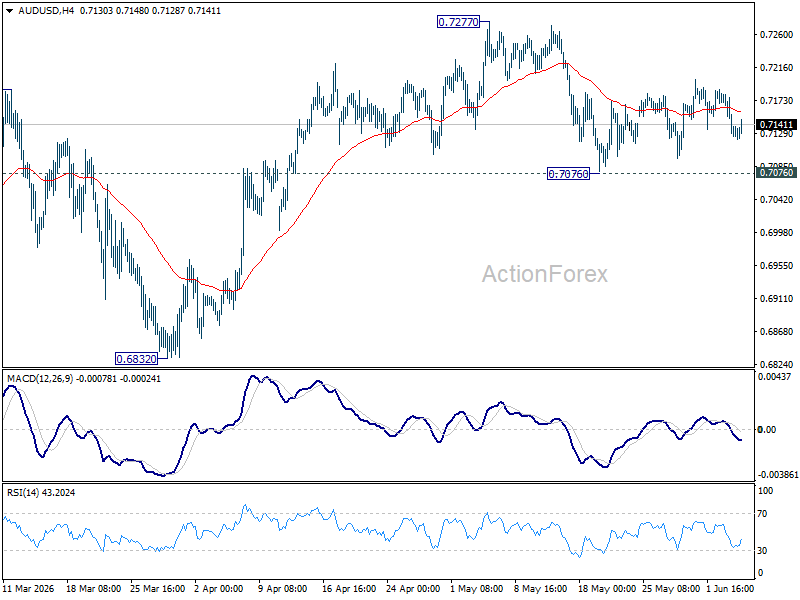
AUD/USD Daily Report
Intraday bias in AUD/USD remains neutral for the moment. Outlook will remain mildly bullish as long as 0.7076 support holds. Firm break of 0.7277 will resume larger up trend. However, sustained break of 0.7076 will bring deeper fall back towards 0.6832 support instead.
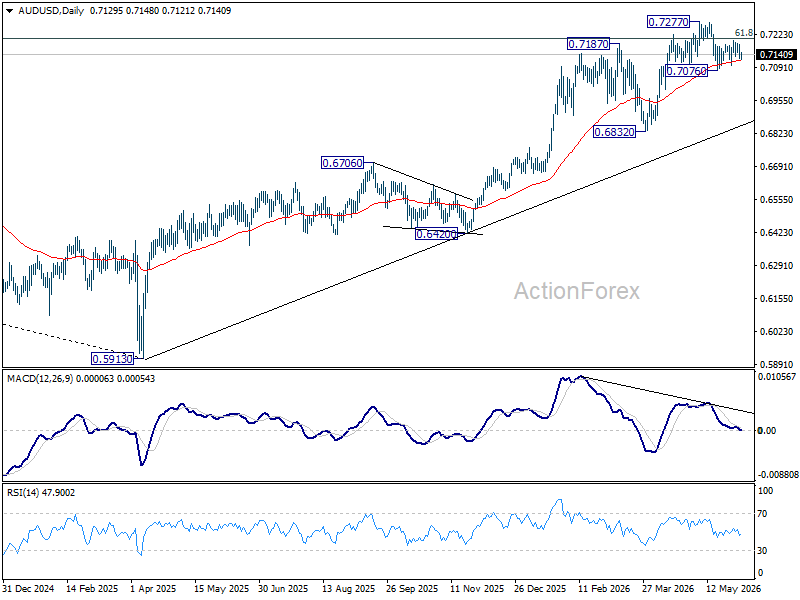
In the bigger picture, rise from 0.5913 (2024 low) is still in progress. Decisive break of 61.8% retracement of 0.8006 to 0.5913 at 0.7206 will solidify the case that it's already reversing the down trend from 0.8006 (2021 high). Further rally should then be seen to retest 0.8006. For now, outlook will remain bullish as long as 0.6832 support holds, in case of pullback.
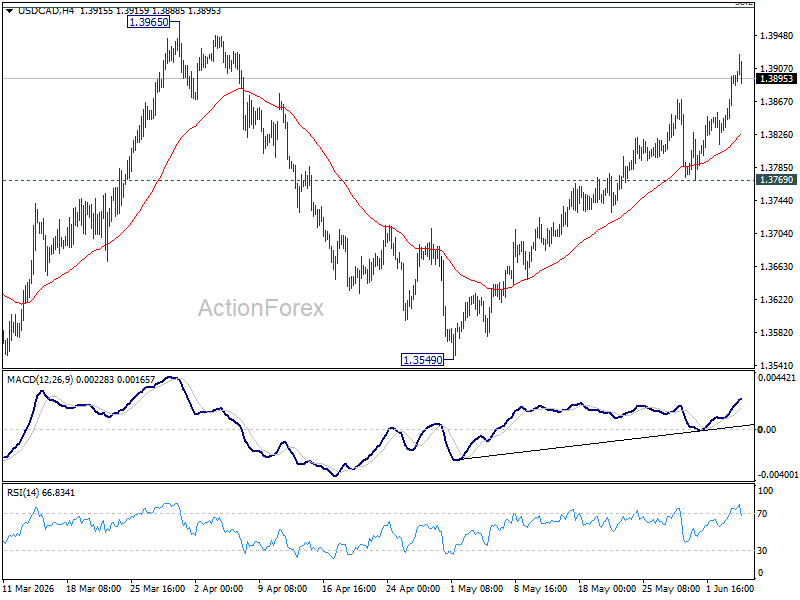
USD/CAD Daily Outlook
USD/CAD's rise from 1.3549 resumed by breaking through 1.3868 temporary top. Intraday bias is back on the upside for 1.3965 resistance next. Further rally will remains in favor as long as 1.3769 support holds, in case of retreat.
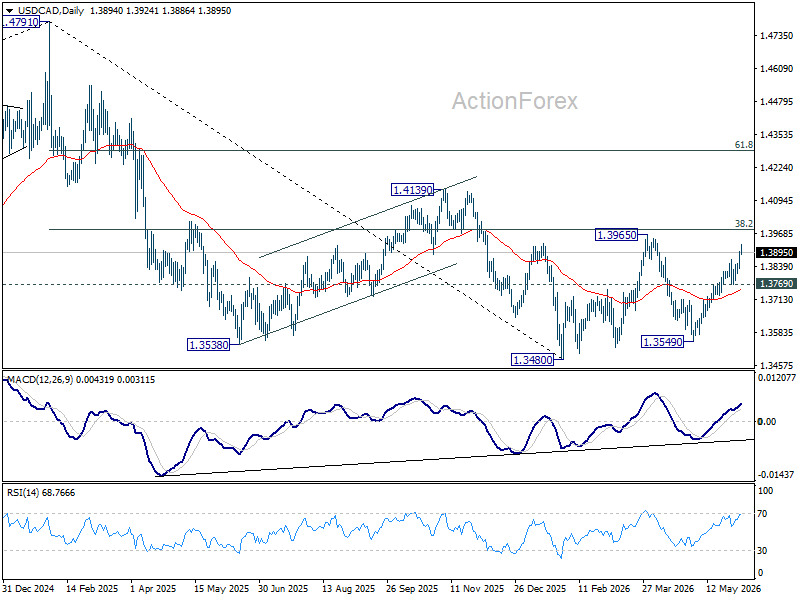
In the bigger picture, price actions from 1.4791 are seen as a corrective pattern to the whole up trend from 1.2005 (2021 low). Deeper fall could be seen, as the pattern extends, to 61.8% retracement of 1.2005 to 1.4791 at 1.3069. However, decisive break of 38.2% retracement of 1.4791 to 1.3480 at 1.3981 will argue that the correction has completed with three waves down to 1.3480 already.
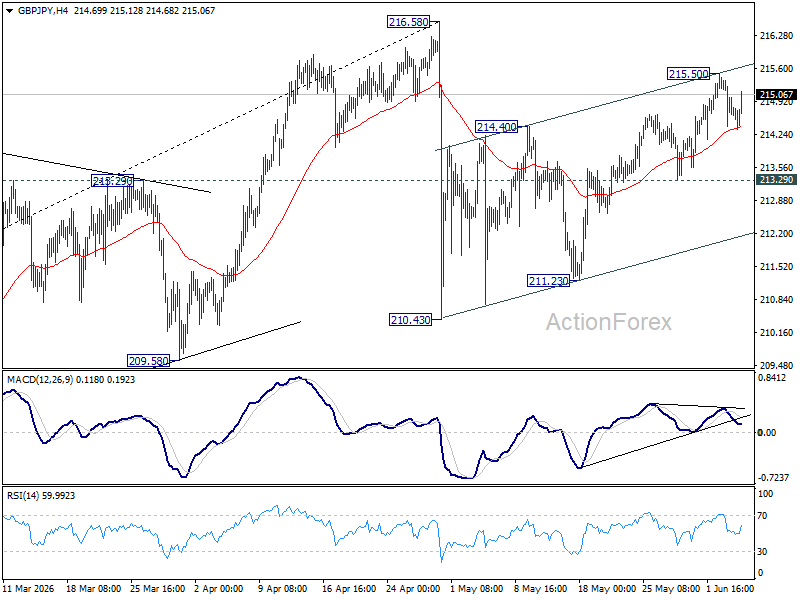
GBP/JPY Daily Outlook
Intraday bias in GBP/JPY remains neutral for the moment. Further rise is expected as long as 213.29 support holds. Above 215.50 will resume the rebound from 210.43 to retest 216.58 high. Strong resistance should be seen there to cap upside, at least on first attempt.
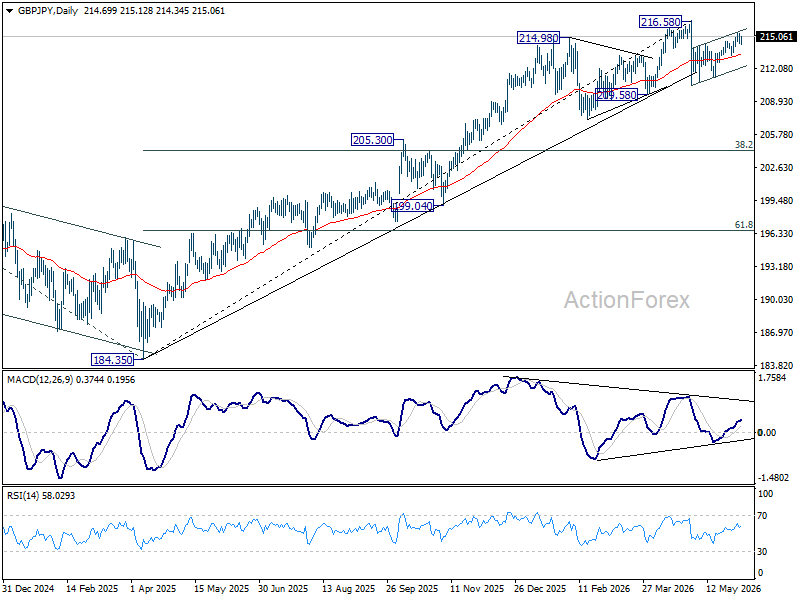
In the bigger picture, while the fall from 216.58 is steep, there is no clear sign of trend reversal yet. The long term up trend could still extend to 61.8% projection of 148.93 (2022 low) to 208.09 (2024 high) from 184.35 at 220.90 on resumption. However, sustained break of 55 W EMA (now at 206.56) will argue that it's already in medium term down trend for 184.35 support.
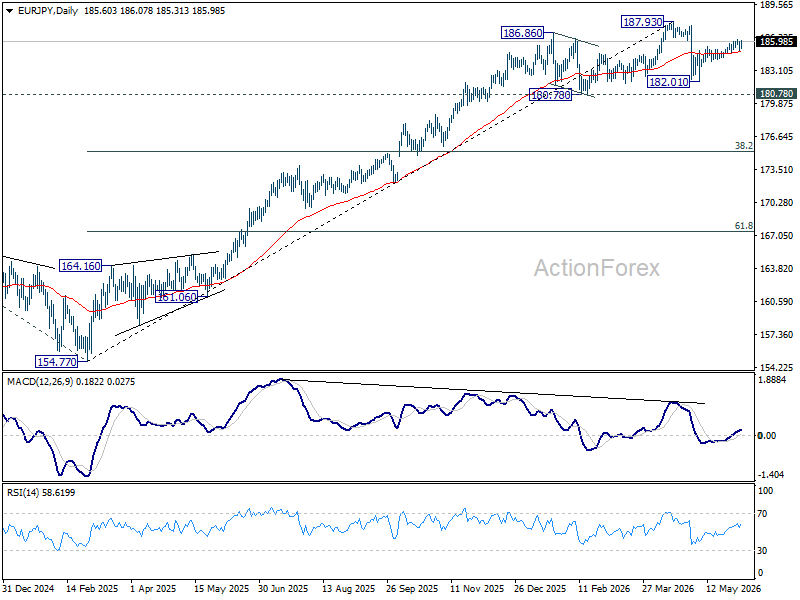
EUR/JPY Daily Outlook
Intraday bias in EUR/JPY remains neutral for the moment. Further rise is expected as long as 184.42 support holds. Above 186.18 will extend the rebound from 182.01. Firm break of 61.8% projection of 182.01 to 185.44 from 184.42 at 186.53 will pave the way to 100% projection at 187.85.
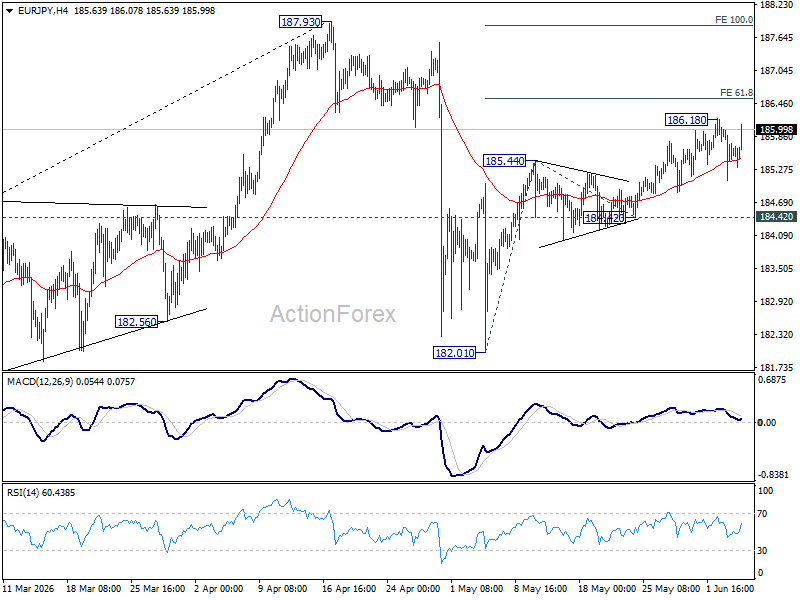
In the bigger picture, the pullback from 187.93 was steep, there is no sign of reversal yet. Uptrend from 114.42 (2020 low) is still expected to resume at a later stage to 78.6% projection of 124.37 (2022 low) to 175.41 (2025 high) from 154.77 at 194.88. However, sustained break of 55 W EMA (now at 178.78) will argue that it's already in a medium term down trend to 175.41 resistance turned support and below.