
Sample Category Title
NFP Is a Gatekeeper for Fed Policy and Gold’s Next Move
Gold traders have spent the past week waiting. After falling steadily from 4,889.24, the precious metal has settled into a tense standoff between 4,400 support and 4,600. Neither bulls nor bears have been willing to commit before today's US Non-Farm Payrolls report. The reason is simple. The jobs data may not decide the Fed's next move, but it could determine how much freedom the central bank has to focus on inflation, and that could ultimately decide Gold's next breakout.
The market backdrop is very different from earlier this year. Back then, every weak labor-market report fueled speculation about rate cuts. Today, that discussion has largely disappeared. Elevated oil prices and concerns about energy-driven inflation have pushed Fed officials in a distinctly hawkish direction. Policymakers increasingly view labor-market risks as balanced rather than deteriorating. The question is no longer whether the Fed will cut. The question is whether inflation eventually forces another hike.
| GMT | Ccy | Events | Cons | Prev |
|---|---|---|---|---|
| 12:30 | USD | Nonfarm Payrolls May | 85K | 115K |
| 12:30 | USD | Unemployment Rate May | 4.30% | 4.30% |
| 12:30 | USD | Average Hourly Earnings M/M May | 0.30% | 0.20% |
The first scenario is a report that lands close to expectations. Economists are looking for payroll growth around 85k-96k, unemployment steady at 4.3%, and wage growth of 0.3% mom. Such an outcome would probably leave both the Fed and markets exactly where they are today. Policymakers would continue watching inflation developments, while investors would continue pricing roughly even odds of a rate hike by year-end. Gold might initially react, but any move could quickly fade as traders return their attention to inflation and oil prices.
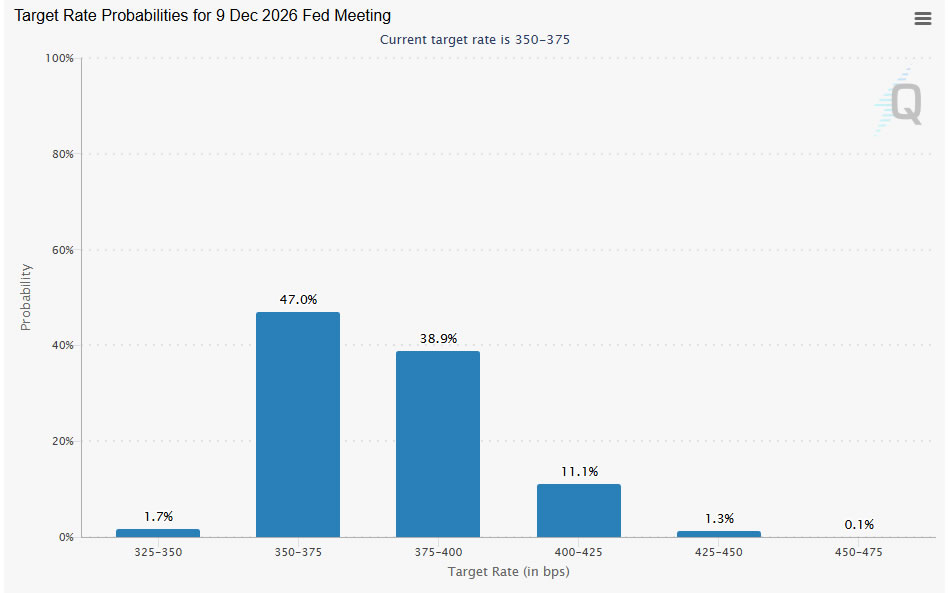
The second, a much stronger report would have a different implication. Strong payroll growth by itself would mostly confirm labor-market resilience. However, if stronger hiring is accompanied by faster wage growth or a lower unemployment rate, markets could conclude that inflation risks are becoming more entrenched. That combination would not guarantee another Fed hike, but it would make it easier for policymakers to keep a tightening bias and harder for markets to dismiss the possibility of higher rates later this year.
The third scenario is a softer report. Payroll growth below expectations would raise concerns about the economy, but not necessarily enough to change Fed policy. A moderate miss would likely make officials more cautious about discussing future hikes, but inflation concerns would remain firmly in place. Only a genuinely weak report featuring a negative print or a surging unemployment rate would significantly challenge the current market view that the next policy move could still be upward.
That is why this payrolls report acts as a gatekeeper. It is unlikely to trigger an immediate policy response. Instead, it determines how much freedom the Fed has to focus on combating inflation coming from the energy sector. Strong employment gives policymakers room to keep watching inflation.
For Gold traders, the key transmission mechanism is Dollar. The strongest bullish case for Dollar would come from a report featuring stronger wages and lower unemployment. Otherwise, reactions may be more restrained. A payroll figure near expectations may ultimately leave markets focused on oil prices, inflation data, and Fed commentary rather than the jobs report itself.
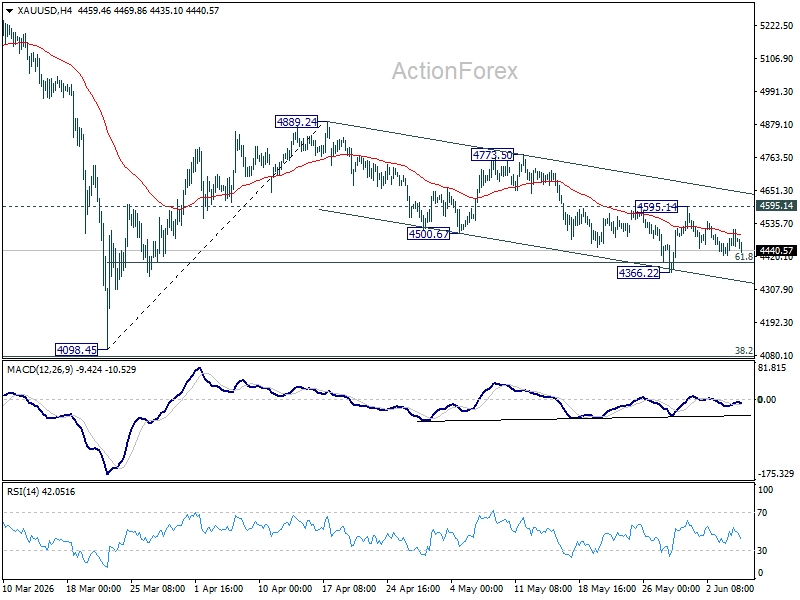
Technically, Gold remains trapped inside a near term descending channel and below the falling 4H EMA. While buyers have successfully defended 61.8% retracement of 4,098.45 to 4,889.24 at 4,400.53, they have shown little ability to sustain momentum above 4,595.14. As long as this resistance holds, risk will remain on the downside. A break below 4366.22 would resume the decline from 4889.24 and bring deeper fall to retest, 4098.45 low.
On the other hand, a break above 4,595.14 would be the first meaningful signal that sentiment is turning and open the way toward channel resistance near 4,644.92.
Japan Wage Growth Surges to 34-Year High Streak, Consumption Still Lags
Japan's wage story continues to move in the direction the Bank of Japan has long hoped for. Nominal wages rose 3.5% yoy in April, accelerating from 3.1% yoy and beating market expectations of 3.2% yoy. The increase marked the third straight month with wage growth above 3%, something not seen in more than three decades. Combined with a modest inflation rate of 1.5%, real wages rose 1.9% yoy, extending their positive streak to four consecutive months.
The underlying details suggest wage pressures are becoming more entrenched. Bonus payments surged 7.4% yoy while overtime earnings accelerated to 4.2% yoy, both signs that labor demand remains firm. The wage data also align with this year's strong spring wage negotiations. Preliminary results from Rengo indicate average wage settlements of just over 5%, while major companies surveyed by Keidanren reported increases exceeding 5.4%. These outcomes strengthen confidence that higher wages are becoming a structural feature rather than a temporary phenomenon.
The government's fuel subsidy program also played an important supporting role. By offsetting part of the rise in energy costs caused by the Middle East conflict, the program helped keep the inflation measure used in wage calculations relatively low at 1.5%. As a result, workers were able to retain more of their income gains in real terms. For the BoJ, this combination of stronger wage growth and contained inflation is precisely the dynamic policymakers have been seeking to sustain.
Consumer behavior, however, remains more cautious than the wage figures alone would suggest. Household spending fell -0.5% yoy in April, although that was significantly better than the -1.4% decline expected by economists and a notable improvement from March's -2.9% fall. Spending on necessities such as food and beverages remained weak, while clothing purchases dropped sharply. Nevertheless, stronger vehicle-related spending helped support transportation and communications expenditure. The mixed consumption picture suggests that while Japan's wage recovery is clearly gaining traction, households are not yet spending with the confidence that would fully validate the BoJ's normalization ambitions.
| Indicator | March | April | Expectation |
|---|---|---|---|
| Real Wages Y/Y | 1.4% | 1.9% | — |
| Nominal Wages Y/Y | 3.1% | 3.5% | 3.2% |
| Inflation Index Used for Wages | 1.6% | 1.5% | — |
| Household Spending Y/Y | -2.9% | -0.5% | -1.4% |
Cliff Notes: Downside Risks to Persist
Key insights from the week that was.
In Australia, GDP rose 0.3% (2.5%yr) in Q1, in line with our expectations. Our analysis suggests the data centre build-out was responsible for all of the growth in the quarter. This manifested as the largest jump in new business investment since the early 2010s mining investment boom – up 5.7% to be 10.4% higher over the year. A large portion of the relevant inputs are imported, hence net exports 0.6ppt subtraction from GDP and a widening in the current account deficit to –$27.1bn, but there is still material value-add in the construction of this infrastructure. To the extent that April’s goods trade data showed imports of data centre-related components still running at pace, this trend will continue to have a significant bearing over activity and productivity for the foreseeable future.
Elsewhere across the economy, activity was soft. Spending by the public sector was little changed as infrastructure projects drew closer to completion and energy bill rebates rolled off. Household consumption growth across discretionary categories was also sluggish – a risk flagged well in advance by our card tracker. This is not a surprise given the cost of living, restrictive interest rates and bracket creep. Having declined 0.2% in Q1, real household disposable income will face additional pressure in coming quarters as the full impact of these forces transmits through.
This tension between inflation and incomes was at the heart of the Fair Work Commission’s decision to raise award wages by 4.75% from 1 July 2026. While this will go some way towards protecting more vulnerable workers’ wages, it won’t fully offset the impact of inflation. As firms face rising costs of production and, at the margin, labour market slack builds, workers’ bargaining power is likely to remain limited outside of jobs where the Fair Work Commission’s decision dictates terms.
For housing, the initial impact of 2026’s rate increases and the uncertainty created by the proposed Federal tax changes saw the Cotality house price index dip another 0.1% in May after a 0.2% fall in April (revised down from a 0.1% gain). This weakness was concentrated in Sydney and Melbourne, though price gains across the smaller capitals are expected to moderate in the months ahead. Higher building costs and tighter financing terms are adding pressure to supply, evinced by the 3.4% decline in dwelling approvals in April.
Data received from offshore was secondary in nature and had little market impact. Participants’ focus instead remained on the outlook for US tech firms and developments in the Middle East. On the latter, terms agreeable to both sides are yet to be found; but both sides continue to signal an intent to resolve their differences, with hostilities limited to small skirmishes and ‘defensive’ actions. The market also remains hopeful, Brent Oil this week trading a circa USD93-97 per barrel range versus the recent peak of USD110 despite the ongoing depletion of global inventories.
On the data front, the Federal Reserve’s latest Beige Book was arguably the key release for the week. It highlighted the disparate conditions faced by households of different income and wealth levels and that, as more were squeezed by the cost of living, "residential mortgages, consumer, and agricultural loan delinquencies were noted as rising in several of the Districts". The labour market was characterised as stagnant, and aggregate wages growth in line with inflation. For businesses, “Non-labor input costs continued to rise faster than selling prices, contributing to broader concerns about margin compression." Without relief from the current conflict, the US economy is likely to come under growing pressured and uncertainty, particularly as the FOMC and market recognise the bind the economy is in vis a vis capacity outside of technology.
Over in the Euro Area, while this week’s inflation print justifies the ECB hiking next week, as we and the market expected, this decision is likely to be one of only two increases in 2026, in effect a minor recalibration of the stance of policy to fend off inflation risks without material impact on economic growth or the labour market. Businesses and households across Europe should therefore remain confident in the outlook, allowing growth to re-accelerate through 2027 and 2028.
USD/JPY Support Holds Strong As Bulls Target A Fresh Breakout
Key Highlights
- USD/JPY remained supported and climbed above 159.80.
- A bullish trend line is forming with support at 159.70 on the 1-hour chart.
- EUR/USD is struggling to clear the 1.1680 resistance zone.
- Bitcoin declined heavily and tested the $62,000 support.
USD/JPY Technical Analysis
The US Dollar remained well bid above 159.20 against the Japanese Yen. USD/JPY climbed above the 159.50 and 159.60 resistance levels.
Looking at the 1-hour chart, the pair gained strength for a move toward 160.00. A high was formed at 160.04, and the pair is now consolidating gains near the 23.6% Fib retracement level of the upward move from the 159.54 swing low to the 160.04 high.
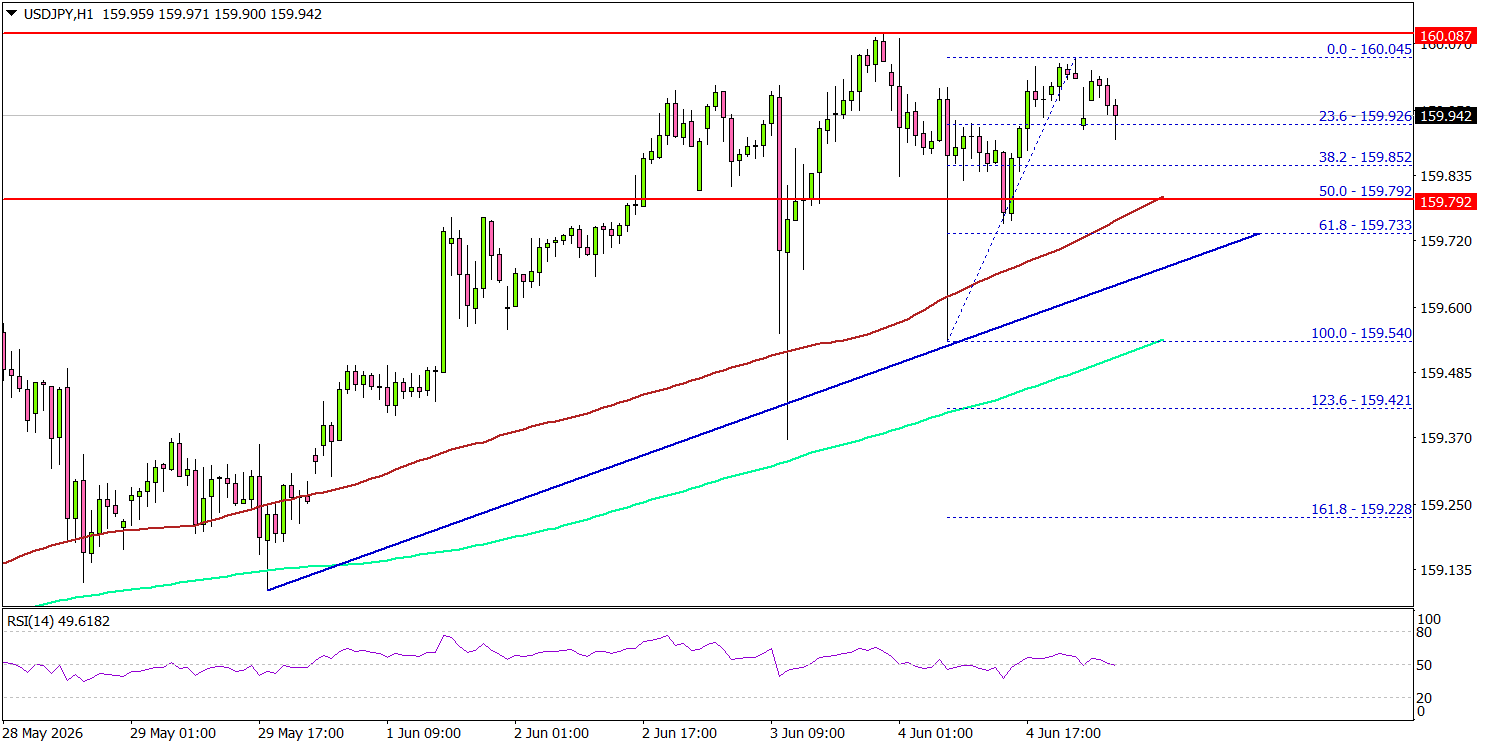
On the downside, the pair could find bids near 159.80, the 100 simple moving average (red, 4-hour), and the 50% Fib retracement level of the upward move from the 159.54 swing low to the 160.04 high.
The first major support might be 159.70. A close below 159.70 might initiate a drop to 159.20 and the 200 simple moving average (green, 4-hour). Any more losses might open the doors for a drop toward the 158.80 zone.
On the upside, an immediate resistance could be 160.00. The next major resistance might be 160.50. A close above 160.50 could open doors for gains above 161.20. In the stated case, the bulls could aim for a move to 162.00.
Looking at EUR/USD, the pair failed to continue higher, started a fresh decline, and might move below the 1.1575 support.
Upcoming Key Economic Events:
- US nonfarm payrolls for May 2026 – Forecast 85K, versus 115K previous.
- US Unemployment Rate for May 2026 - Forecast 4.3%, versus 4.3% previous.
Eco Data 6/5/26
| GMT | Ccy | Events | Act | Cons | Prev | Rev |
|---|---|---|---|---|---|---|
| 23:30 | JPY | Labor Cash Earnings Y/Y Apr | 3.50% | 3.20% | 2.70% | 3.10% |
| 23:30 | JPY | Overall Household Spending Y/Y Apr | -0.50% | -1.40% | -2.90% | |
| 05:00 | JPY | Leading Economic Index Apr P | 115.9 | 114.3 | 114 | |
| 07:00 | CHF | Foreign Currency Reserves (CHF) May | 711B | 716B | ||
| 09:00 | EUR | Eurozone GDP Q/Q Q1 F | -0.20% | 0.10% | 0.10% | |
| 12:30 | USD | Nonfarm Payrolls May | 172K | 85K | 115K | 179K |
| 12:30 | USD | Unemployment Rate May | 4.30% | 4.30% | 4.30% | |
| 12:30 | USD | Average Hourly Earnings M/M May | 0.30% | 0.30% | 0.20% | |
| 12:30 | CAD | Net Change in Employment May | 87.8K | 10.2K | -17.7K | |
| 12:30 | CAD | Unemployment Rate May | 6.60% | 6.90% | 6.90% | |
| 14:00 | CAD | Ivey PMI May | 58.2 | 55 | 57.7 |
| 23:30 | JPY |
| Labor Cash Earnings Y/Y Apr | |
| Actual | 3.50% |
| Consensus | 3.20% |
| Previous | 2.70% |
| Revised | 3.10% |
| 23:30 | JPY |
| Overall Household Spending Y/Y Apr | |
| Actual | -0.50% |
| Consensus | -1.40% |
| Previous | -2.90% |
| 05:00 | JPY |
| Leading Economic Index Apr P | |
| Actual | 115.9 |
| Consensus | 114.3 |
| Previous | 114 |
| 07:00 | CHF |
| Foreign Currency Reserves (CHF) May | |
| Actual | 711B |
| Consensus | |
| Previous | 716B |
| 09:00 | EUR |
| Eurozone GDP Q/Q Q1 F | |
| Actual | -0.20% |
| Consensus | 0.10% |
| Previous | 0.10% |
| 12:30 | USD |
| Nonfarm Payrolls May | |
| Actual | 172K |
| Consensus | 85K |
| Previous | 115K |
| Revised | 179K |
| 12:30 | USD |
| Unemployment Rate May | |
| Actual | 4.30% |
| Consensus | 4.30% |
| Previous | 4.30% |
| 12:30 | USD |
| Average Hourly Earnings M/M May | |
| Actual | 0.30% |
| Consensus | 0.30% |
| Previous | 0.20% |
| 12:30 | CAD |
| Net Change in Employment May | |
| Actual | 87.8K |
| Consensus | 10.2K |
| Previous | -17.7K |
| 12:30 | CAD |
| Unemployment Rate May | |
| Actual | 6.60% |
| Consensus | 6.90% |
| Previous | 6.90% |
| 14:00 | CAD |
| Ivey PMI May | |
| Actual | 58.2 |
| Consensus | 55 |
| Previous | 57.7 |
Weekly Focus – Rate Hikes Coming from the Big Central Banks
Last week's optimism on a reopening of the Strait of Hormuz faded this week as both US and Iran officials toned down the prospect of agreement and military action flared up again, including in Lebanon. The oil price is back above USD 97 for Brent. In our new economic forecasts published this week, we have assumed a very gradual normalisation of oil prices over several years in line with market pricing, which implies that there is some progress in getting shipments through the Strait but not a real solution soon. Clearly, there are risks in both directions from this.
Economic data from the US has been to the positive side this week, with the ISM survey pointing to increasing manufacturing production and employment, job openings higher than expected and the unofficial ADP employment report showing 122,000 private sector jobs added in May. However, the most important data point will be the Friday job report. The US economy continues to be boosted by tech-related investments which is also reflected in the stock market, where the strong performance of tech stocks continues. The US Treasury announced the result of their so-called Section 301 investigation of 60 economies regarding forced labour, which paves the way for replacing the current 10% tariffs when they expire on 24 July. However, also these tariffs are likely be to challenged in the courts. Currently, there is close to zero net revenue from tariffs, as incomes are matched by refunds of tariffs that have previously been found to be illegal. Hence, US fiscal policy is more expansionary than intended, which is part of the reason we now expect the next move from the Fed to be a hike.
In the euro area, May inflation rose to 3.2% y/y as expected, but perhaps more worryingly for the ECB, services inflation rose to 3.5% from 3.0% y/y, a bigger rise than can be explained by technical factors such as the timing of Easter. The extremely weak May PMI numbers for the service sector were revised up significantly, but the aggregate number of 48.5 still point to contraction. The ECB has quite clearly signalled that it will hike rates by 25bp at its meeting next week, where it will also present updated economic projections. These will likely reflect the same dilemma as the May data, namely that the economy is weakening but inflation is rising, both related to higher oil prices than in the bank's latest base case scenario from March. Hence, uncertainty remains as to whether and when there will be another rate hike, but we do not expect to get clear guidance from the ECB on that.
A string of other central banks will follow with rate announcements. In the Fed, Kevin Warsh will host his first press conference as chairman. He has expressed scepticism of guidance tools such as the so-called dot plot of FOCM member expectations which are due to be updated at this meeting. Expectations of an autumn rate hike are increasing, though.
We expect the Bank of Japan to hike its policy rate to 1%, the highest since 1995. Hawks on the policy board have become more outspoken recently, and real wage growth has finally turned positive.
Weekly Focus will not be published next week, so the next issue will be on 19 June.
ECB Preview: And So, The Hiking Begins
- We expect the ECB to hike the deposit rate by 25bp to 2.25% on Thursday 11 June in line with consensus and markets.
- We expect Lagarde to keep full optionality on the future policy rate path, including a potential summer hike but not pre-committing.
- We expect a final 25bp hike in Q3 bringing the deposit rate to 2.50%.
We expect the ECB to hike policy rates by 25bp, bringing the deposit rate to 2.25% on June 11 in line with market pricing and consensus. The recent communication from ECB’s GC members have clearly signalled a rate hike in June, both from the hawkish and dovish side of the spectrum. The size and particularly the persistency of the energy shock means that “We can no longer look through this shock. The risk of deanchoring inflation expectations is rising”, according to Schnabel. The main reason for ECB hiking is thereby to keep inflation expectations anchored by signalling a willingness to act.
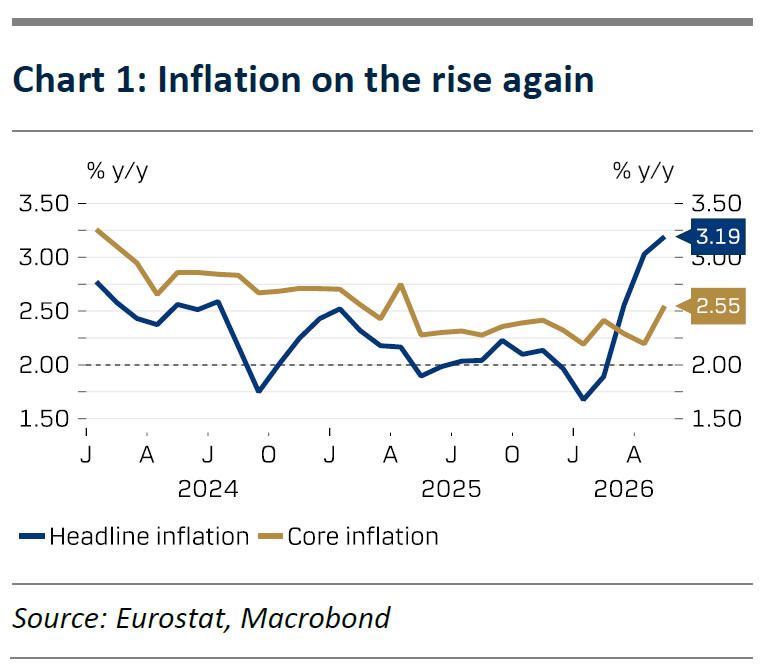
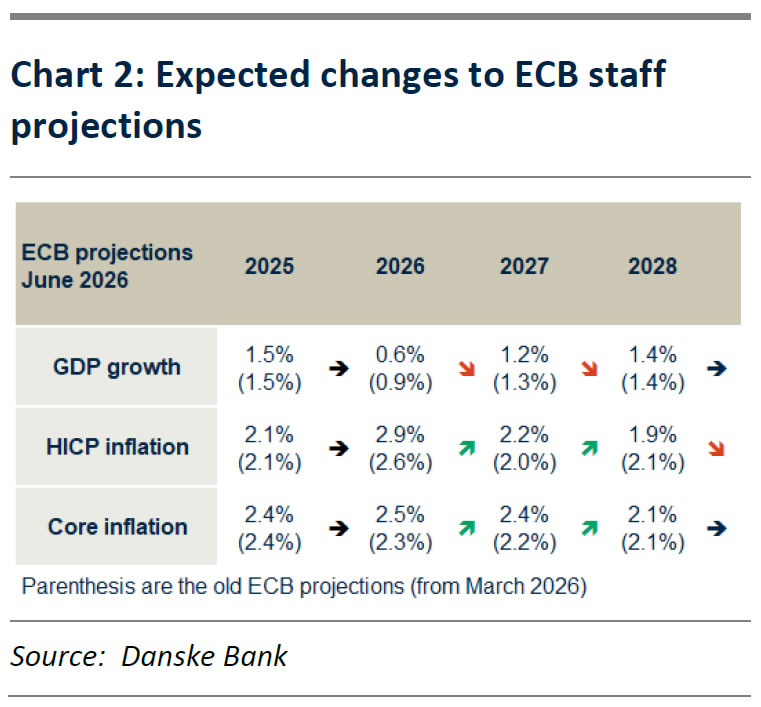
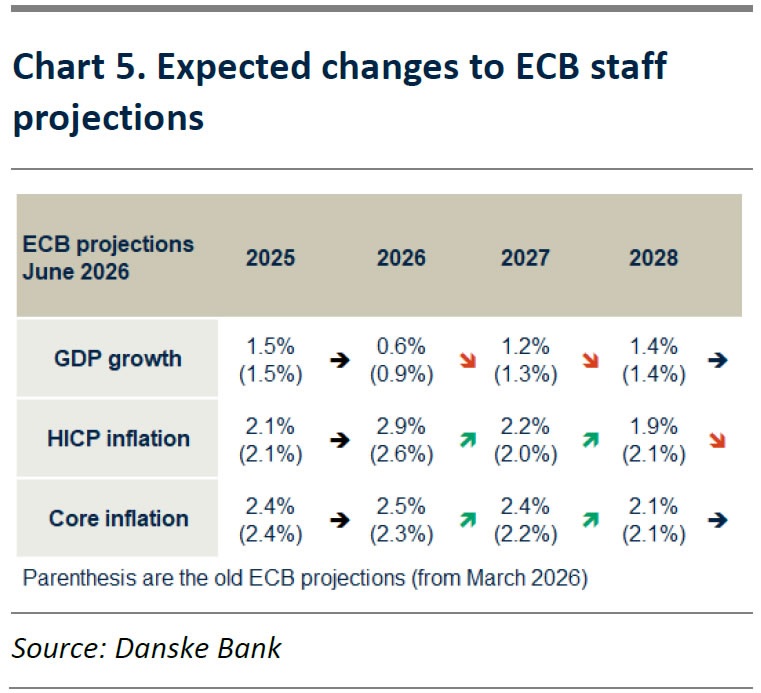
Since the April meeting, headline inflation has evolved broadly as expected by the ECB while core inflation has surprised on the upside due to a strong services reading in May. Oil futures have moved higher compared to the baseline staff projections in March and we thus expect the new staff projections to increase the 2026 inflation forecast to 2.9% y/y (from: 2.6%) and 2027 to 2.2% y/y (from: 2.0%). Growth data has surprised on the downside both in terms of Q1 GDP and survey-based indicators in Q2, so we expect a downward revision of the 2026 GDP growth to 0.6% y/y (from: 0.9% y/y) and 2027 to 1.2% y/y (from: 1.3%). See chart 2 and next page for more details. As the new staff projections likely assume around 68bp worth of hikes in the technical assumptions, we believe they give the GC arguments for hiking twice this year.
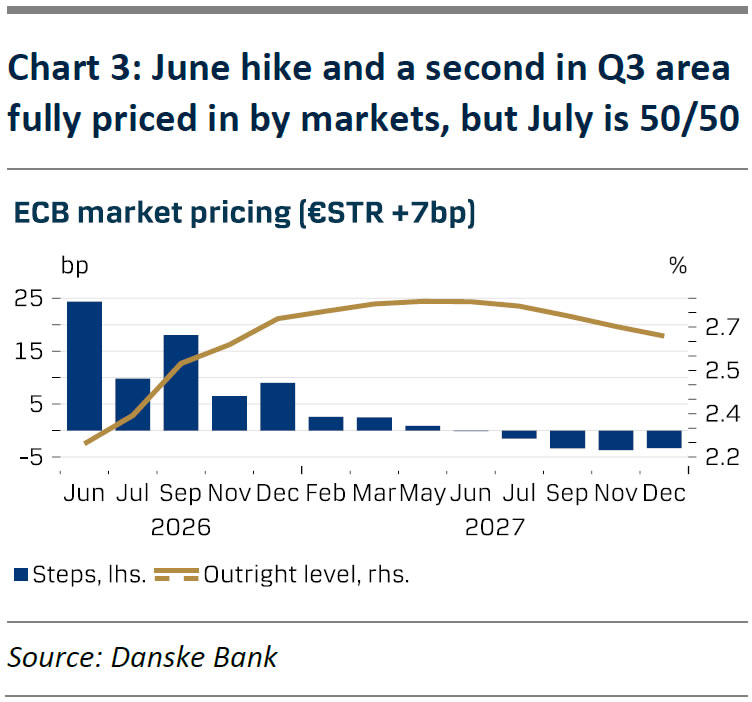
With the June hike fully priced in by markets, all focus during the press conference is on signals. We expect Lagarde to keep full optionality on the future policy rate path, including a potential second summer hike. The well telegraphed policy hike coming next week reveals a preference for curbing upside inflationary risks rather than addressing downside growth risks. As one hike is not significantly changing economic conditions, we expect the ECB to deliver another 25bp hike in Q3. Limited new data will be available by the July meeting, making a firm assessment of potential second round effect difficult, which increases the uncertainty of the exact timing of a potential second hike. We stress that the decision of a hike in July or September does not significantly affect the economic outlook nor our overall view on rates markets where we still favour playing the move for lower short-end swap rates.
New staff projections to show higher inflation and lower growth
The June ECB meeting will feature a new set of staff projections, which will be important for the monetary policy outlook. In this section, we review data since the last meeting and preview what to expect from the new staff projections. There will both be new baseline projections and updated scenarios. Starting with inflation, the March print came in slightly lower than implied by the staff projections while April and May point to Q2 headline inflation broadly as expected in the baseline projections. On the other hand, core inflation has surprised on the upside due to the surprisingly strong services print of 3.5% y/y (0.5% m/m s.a.) in May, which means Q2 core inflation is set to come in higher than both the baseline and the “adverse” scenario.
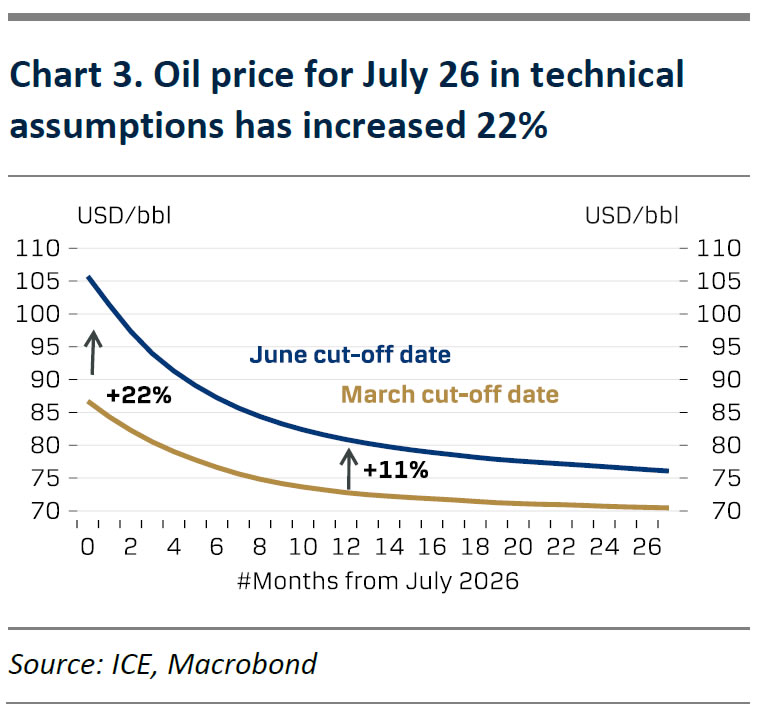
Regarding the inflation outlook, headline is likely to be revised up to 2.9% y/y in 2026 (from 2.6% y/y) and to 2.2% y/y in 2027 (from: 2.0% y/y) as the technical assumptions for the June meeting will feature higher commodity price assumptions for oil amid broadly unchanged gas prices. Specifically for the July 2026 delivery the oil future has risen by 22% from 87 USD/bbl to 106 USD/bbl and the delivery price for July 2027 has risen by 11% (see chart 3). The gas futures are broadly similar to the March cut-off date. With car fuels having a weight of 4% in the HICP index compared to gas at 1.6% we expect the higher oil futures to dominate and thus contribute to higher headline inflation. We expect core inflation to be revised up to 2.5% in 2026 (from: 2.3%) and 2027 to 2.4% (from: 2.2%), which is partly due to the upside surprise in Q2 and due to indirect effects from higher oil prices. Working in the other direction is the fact that wage growth is still clearly on a declining trend according to the ECB wage tracker and as growth in negotiated wages in Q1 was surprisingly low. Hence, we still expect a return to 2.1% y/y 2028 as in the March projections, see chart 5.
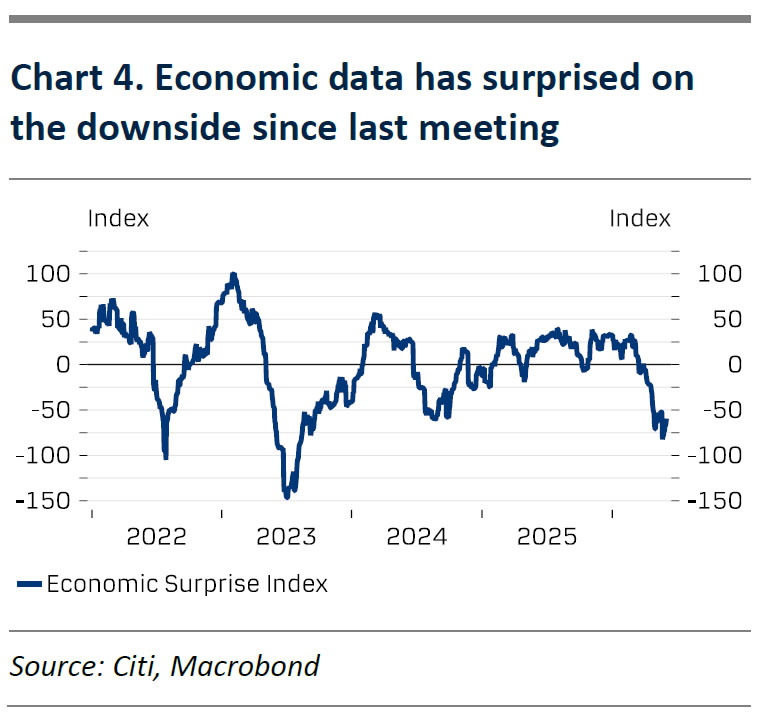
In terms of the growth outlook, we expect a sharp downward revision of 2026 GDP growth to 0.6% y/y (from: 0.9% y/y). We also expect 2027 growth to be revised down to 1.2% y/y (from: 1.3%) while 2028 is expected unchanged at 1.4% y/y. Economic data has surprised on the downside since the March meeting (see chart 4) with particularly the Q1 GDP growth rate at 0.15% q/q. The previous staff projections saw Q1 GDP growth at 0.3% q/q both in the baseline and adverse scenario. The PMI data for April and May was also surprisingly weak, and we thus expect ECB staff to assume quarterly growth of 0.0% q/q in Q2. The economy is thus expected to just remain out of negative growth territory in Q2 and likely to show a small rebound of 0.1% q/q in Q3 in the new projections. The technical assumptions on 3M Euribor will also feature around one extra 25bp hike compared to March projections, which in combination with higher oil price assumptions contribute to the weaker growth outlook in 2026 and a lowering of the 2027 forecast.
With the economy avoiding a recession in the forecast and as the technical assumptions likely assume more than two full hikes (68bp by 2026 YE), we believe the revised staff projections will provide the Governing Council arguments for hiking the policy rate twice by 25bp to bring inflation back to 2.0%.
The Pound: Heading Towards 1.31 or 1.37?
- Conflicting drivers are preventing GBPUSD from finding a clear direction.
- The Bank of England is set to disappoint markets with the scale of its monetary tightening.
The British pound is consolidating against the US dollar amid persistent high geopolitical risks and uncertainty regarding the Bank of England’s monetary policy. The futures market expects the BoE to raise the repo rate by September and again in December. However, the OECD believes that the central bank will turn a blind eye to the highest inflation among G10 countries and keep borrowing costs at 3.75% throughout 2026.
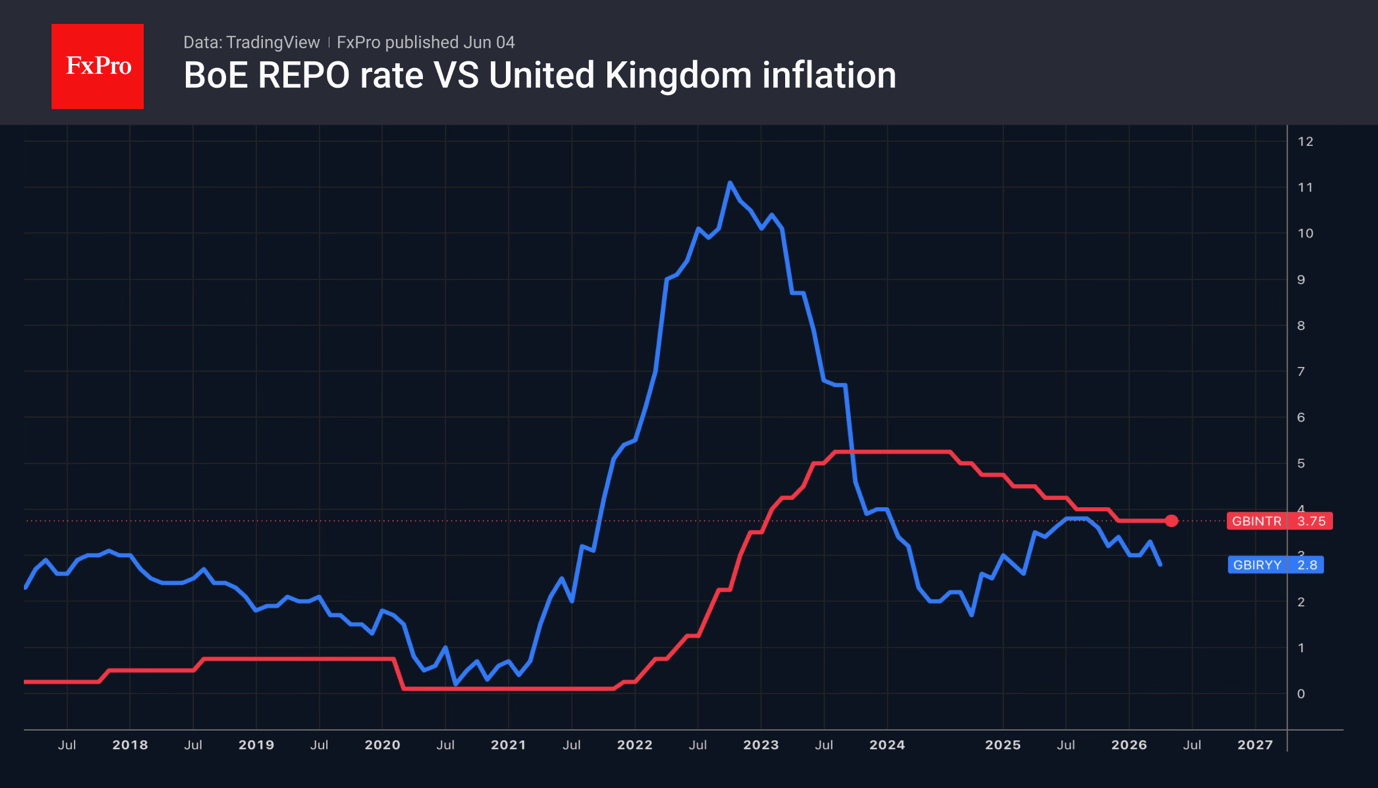
Due to high yields on UK debt, sterling is sensitive to shifts in global risk appetite and to the futures market’s expectations of faster monetary tightening by the Bank of England compared to the Fed. This factor, coupled with five consecutive record highs for the S&P 500, has provided support for GBPUSD. As soon as the broad stock index retreated, the pair plummeted.
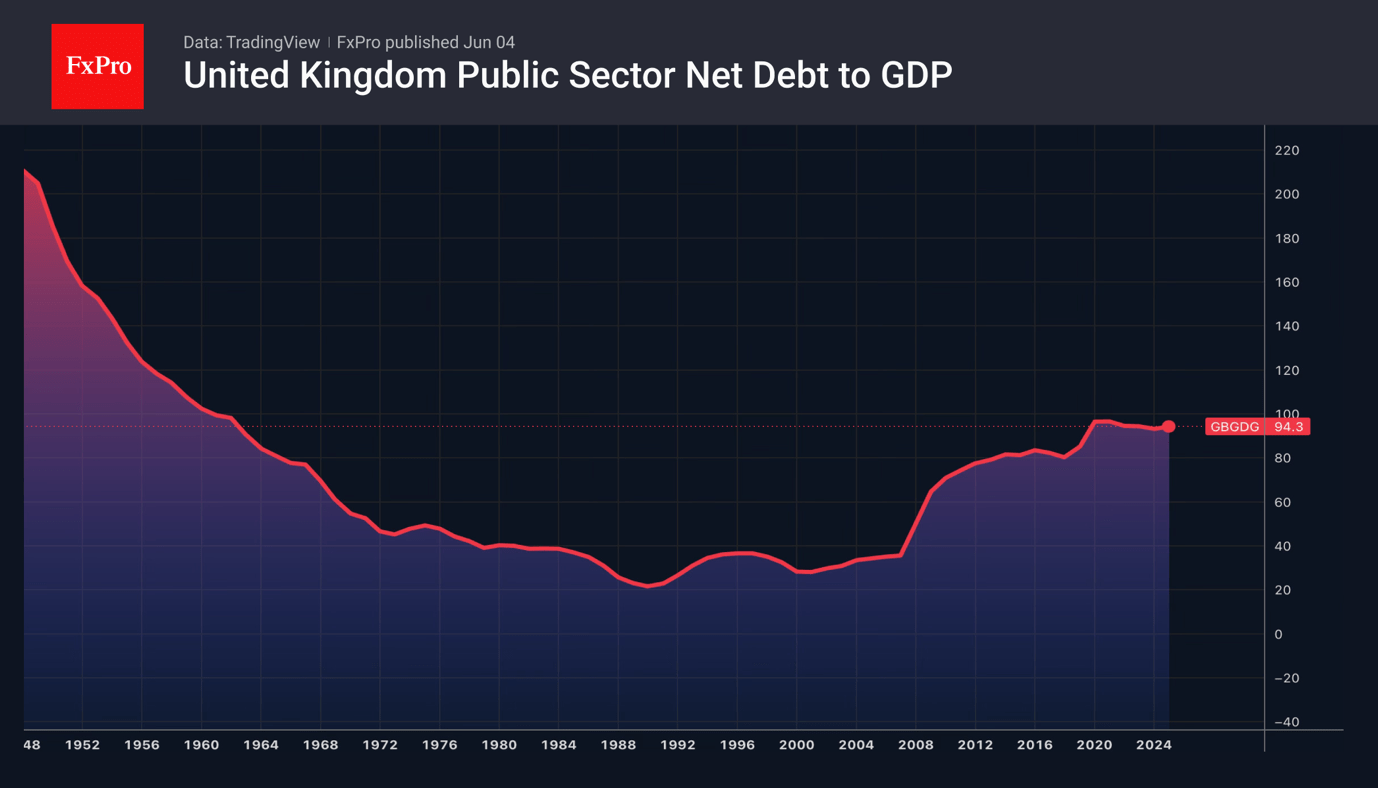
Pressure on the pound is being exerted by the weakness of the UK economy and labour market, as well as the risks of a change of prime minister following Labour’s defeat in the local elections. Investors fear that the new head of government will use fiscal stimulus aggressively, thereby inflating public debt and requiring a new bond issue. The OECD forecasts that the country’s debt will rise from 98.8% of GDP in 2023 to 105.4% in 2027 and recommends that London adhere to the principles of fiscal consolidation.
Thus, a variety of factors are contributing to a medium-term consolidation in GBPUSD. Developments in the Middle East will help the pair determine the direction of its future movement. For now, the White House appears reluctant to significantly escalate military action against Iran unless the situation deteriorates further. If this happens, an escalation of the conflict will boost demand for the US dollar as a safe-haven asset and push the pound towards $1.31.
On the other hand, the conclusion of a deal with Iran, even if its terms are vague and key issues are deferred to a later date, will provide fresh impetus for a rally in US stock indices and an improvement in global risk appetite. GBPUSD will head towards 1.37.
Traders should also factor in a possible surprise from the Fed. According to Morgan Stanley, the first FOMC meeting under Kevin Warsh’s leadership will shock financial markets and lay the foundations for a prolonged downtrend in the US dollar.
Sunset Market Commentary
Markets
Chipmaker Broadcom’s after-market earnings results sapped sentiment to some extent. A weaker-than-expected sales outlook in particular caused some renewed AI valuation concerns. The sector has had a mindboggling rally so perhaps not much was needed for the market to take some chips off the table. European stock markets still eke out a 0.5% gain but diving into the sectors, semiconductors and AI-related sectors (tech hardware, storage) are clearly lagging. Nasdaq on Wall Street opens with losses of around 1% with Broadcom slipping 15%, be it from record highs. The jury’s out whether we’re witnessing the start of a larger and broader correction or not.
The US dollar loses ground with the risk mood outside AI holding on pretty decently for now. EUR/USD rebounded from a sub 1.16 reading yesterday to 1.164 currently, calling off the immediate threat for a downside technical break that may have paved the way for a return all the way to 1.1392. DXY eased from yesterday’s highest closing level since the April 8 ceasefire to 99.23. Even USD/JPY marched lower. The proximity of the 160 barrier is clearly helping. This psychologically important barrier has been a trigger for Japanese officials to intervene before. Markets are wary to push USD/JPY beyond that level, for now at least. The yen also drew some support from a Bloomberg citing “people familiar with the matter” that the Bank of Japan is mulling a June hike with another one possible later in 2026. Money markets currently assume “later” to be December. EUR/GBP recovers marginally for a second day with the pair currently at 0.865 in technically insignificant trading.
Another reason for USD weakness is oil. Brent is trending lower to $94.6 per barrel. This compares to yesterday’s $97.81 and follows a new US-brokered ceasefire between Lebanon and Israel. Americans hope it keeps the peace talks with Iran on track. The Middle East country insists that any deal must include Lebanon too, which is home to the Iran-backed Hezbollah. Ongoing missile fire is testament to the shaky nature of the truce though. Core bonds enjoy it anyway with yields in the US down between 3 and 5 bps in a bull steepening move. German rates ease 1.2-2.5 bps. A June rate hike remains fully priced in. Prior to the ECB’s quiet period, which has kicked in as of today, most officials struck a hawkish tone that steered markets into their current positioning.
News & Views
Swiss inflation stayed subdued in May, according to data published by the Statistical Office (FSO). Consumer prices rose 0.2% M/M and 0.6% Y/Y, slightly softer than expected (was 0.3% M/M and 0.6% Y/Y in April). Prices increases thus stay on the lower side of the SNB 0%-2% price stability target band. Core inflation also printed at a mild 0.1% M/M and 0.3% Y/Y (unchanged from April). FSO said the monthly rise was due to factors including rising housing rentals, higher prices in the hotel sector. Prices for vegetables, petrol, car rental and car sharing also increased. Prices for air transport and heating oil eased, amongst others. Yesterday, SNB President Schlegel indicated that medium term prices pressure essentially stay unchanged. SNB policy is still expansive. However, with current inflation data SNB probably has every room, more than other CB’s, to await the impact on growth and inflation from geopolitical tensions/the supply shock. As such, it can keep a close eye on the FX-component of policy. Looking at prices of imported goods (-0.1%M/ and 0.7% Y/Y), the franc still contributes to containing inflation. This also allows SNB to keep its ‘warning’ on increased willingness to intervene in FX markets if necessary. After strengthening to the EUR/CHF 0.91 area last week, the franc this week eased to currently trade near EUR/CHF 0.918.
Czech May CPI increased by 0.1% M/M and 2.1% Y/Y. The outcome was below expectations. Last month headline inflation was 0.5% M/M and 2.5% Y/Y. Core inflation (ex-energy and un processed food) slowed to 0.1% M/M and 2.3% Y/Y (from 2.9%) in April, with especially processed food prices easing. Energy prices declined 0.3% M/M (to +1.8% Y/Y from 1.5%). Services inflation printed at 0.4% M/M and 4.7% Y/Y (from 4.8%). Goods prices were unchanged on the month and 0.6% Y/Y (from 1.1%). Today’s data at first sight should give Czech National Bank some comfort. The CNB early May left is policy rate unchanged at 3.5%, saying policy needs to be kept relatively tight. At the same time, Q1 labour market data showed very strong nominal and real wage growth at 8.1% Y/Y and 6.4% Y/Y respectively. This is a source of concern for CNB. The 2-y swap yield today eases about 7 bps to 4.24% with money markets pushing back expectations for a hike in the near future. Markets still discount a policy rate near 4% toward the end of the year. The Czech koruna trades little changed in a daily perspective at EUR/CZK 24.20.
Chart Alert: Dow Jones (DJIA) Under Pressure, Medium-Term Uptrend at Risk
Key takeaways
- The Dow Jones Industrial Average is showing increasing signs of relative weakness, underperforming major US equity benchmarks since the March 2026 market recovery and now facing a potential bearish reversal after breaking below a key ascending channel support.
- Renewed US-Iran geopolitical tensions, rising oil prices, and a hawkish repricing of Federal Reserve policy have tightened financial conditions, creating headwinds for cyclical sectors that dominate the Dow Jones.
- A bear-flattening US Treasury yield curve is raising concerns about bank profitability and financial-sector performance, particularly given Financials’ large weighting in the DJIA.
Following up on our earlier structural concerns regarding narrow market breadth and the underlying vulnerabilities of traditional cyclical sectors, on Wednesday, 3 June 2026, price action offered a stark confirmation.
The Dow Jones Industrial Average (DJIA) posted a significant pullback, dropping 1.21% to close at 50,692. Notably, the index opened near its high of 51,220.92 and steadily ground lower throughout the day, closing exactly on the session lows.
So far, since the start of the current medium-term bullish trend on 30 March 2026, the DJIA has remained the underperformer among its peers despite hitting a recent fresh all-time high earlier this week with a gain of just 12.1% versus the S&P 500 (+19.1%), small-cap Russell 2000 (+19.9%), and the tech-heavy Nasdaq 100 (+33.2%) (see. Fig. 1).

Fig. 1: Dow Jones (DJIA) & other major US stock indices performance from 30 Mar 2026 to 3 Jun 2026 (Source: MacroMicro). The information presented is historical information, and past performance is not indicative of future performance.
Geopolitical risks, rising yields, and bear flattening on the yield curve
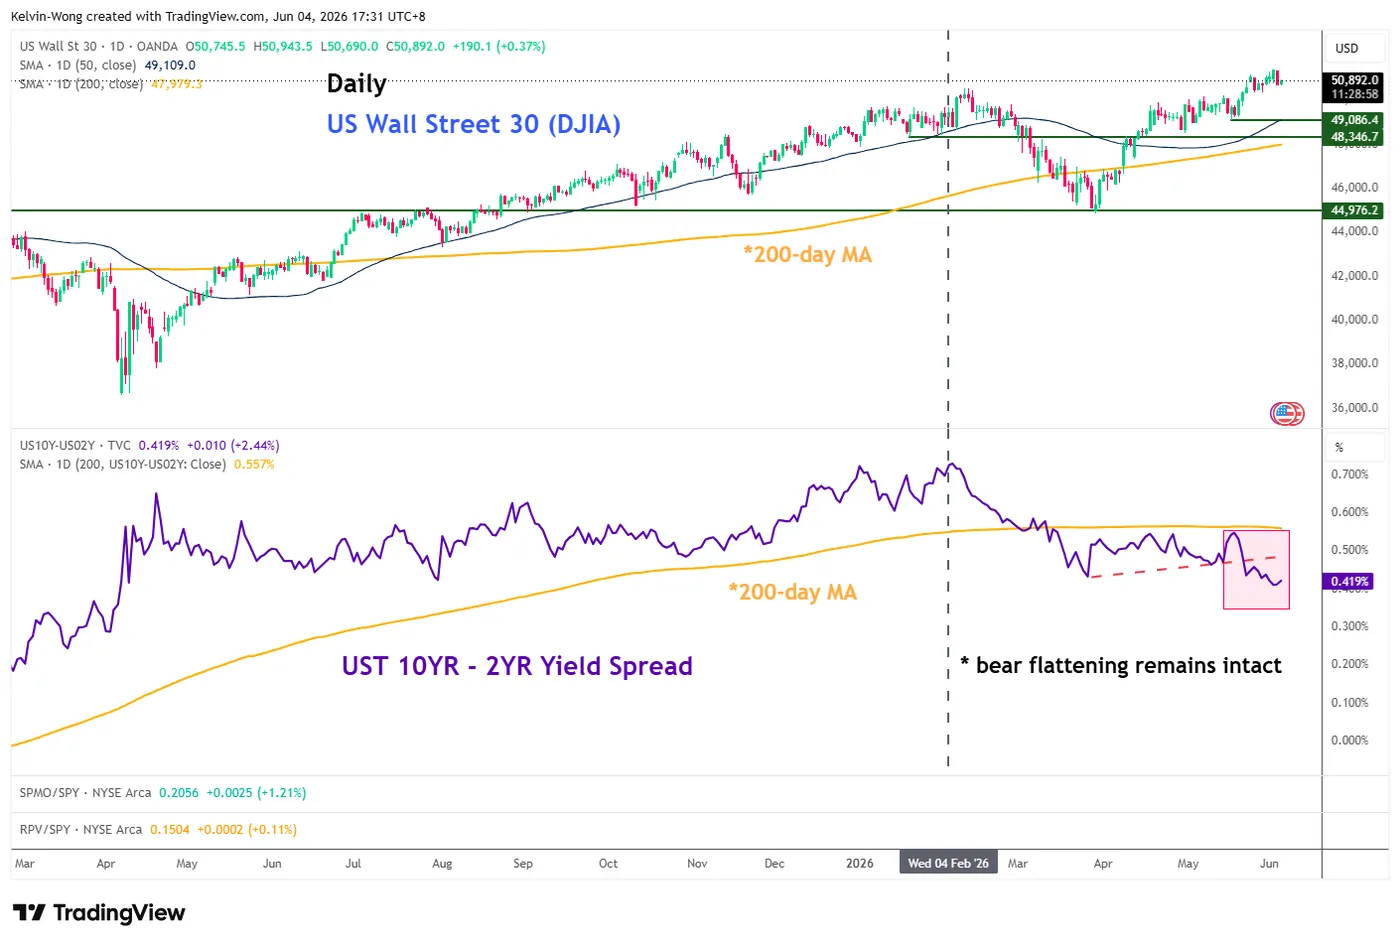
Fig. 2: US Treasury yield curve (10-YR -2-YR) with US Wall Street 30 CFD as of 4 Jun 2026 (Source: TradingView). The information presented is historical information, and past performance is not indicative of future performance.
The primary catalyst for this aggressive risk-off rotation was an escalation in Middle Eastern geopolitics. Fresh threats to the fragile US-Iran ceasefire, alongside reports of launched or attempted retaliatory strikes, sent shockwaves through risk assets.
This geopolitical premium immediately bid up the energy complex, with both WTI and Brent crude jumping by around 2%.
Adding fuel to the fire, the US Treasury market resumed its hawkish repricing. The rising expectations of a more hawkish Fed under new Chair Kevin Warsh have been putting sustained upward pressure on yields.
Yesterday, Treasury yields climbed once again, placing a heavier discount rate on equities and tightening financial conditions further.
In addition, the hawkish repricing has pushed the 2-year US Treasury yield up by 40 basis points since mid-April 2026, outpacing the 10-year yield and resulting in a bear-flattening of the yield curve (see Fig. 2).
Bear flattening typically signals tighter financial conditions, which pressure bank profitability and, in turn, create a negative feedback loop in the DJIA, as the Financials sector carries the largest weight of around 27%.
Let’s now unpack the short-term trajectory (1 to 3 days) of the DJIA from a technical analysis perspective.
Dow Jones (DJIA) – Broke Below Minor Ascending Channel Support
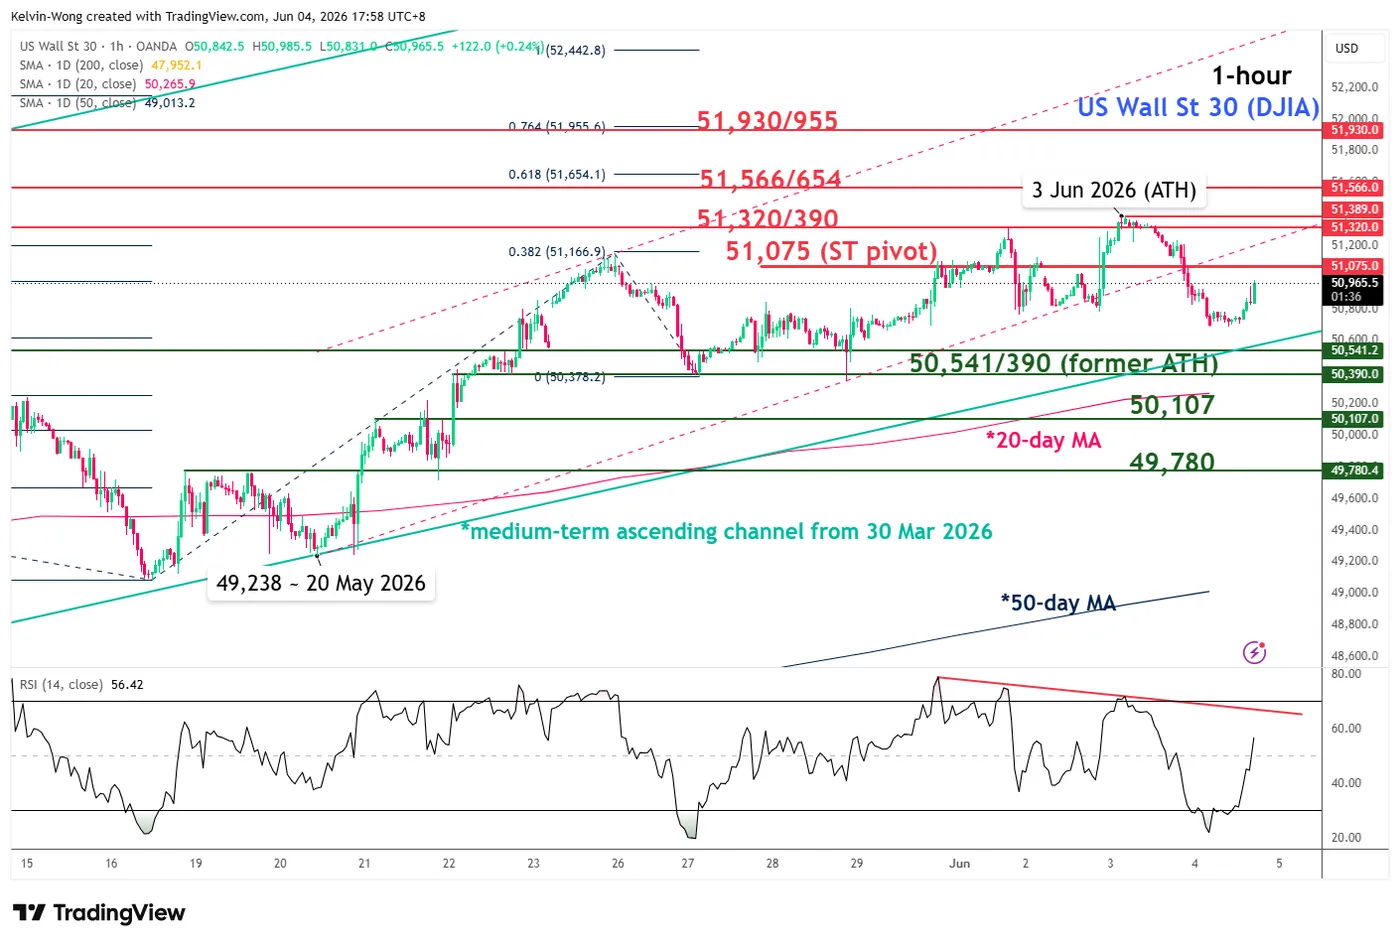
Fig. 3: US Wall Street 30 CFD minor trend as of 4 Jun 2026 (Source: TradingView). The information presented is historical information, and past performance is not indicative of future performance.
Trend bias: Bearish reversal of medium-term uptrend, 51,075 key short-term pivotal resistance (see Fig. 3).
Supports: 50,541/390 (former all-time high area of 10 February 2026), 50,107 (also close to the 20-day moving average), 49,780 (former minor highs of 18 May/19 May 2026).
Next resistances: 51,320/390 (current all-time high area), 51,566/654 (Fibonacci extension cluster), 51,930/955 (Fibonacci extension).
Key Elements to Support the Short-Term Bearish Bias on Dow Jones (DJIA)
- The price action of the US Wall Street 30 CFD has broken below its minor ascending channel support from the 20 May 2026 low, putting the near-term bullish trend in jeopardy.
- The hourly RSI momentum indicator has flashed a bearish divergence signal.