
Sample Category Title
EURUSD Looks for Direction Signal to End Extended Sideways Mode
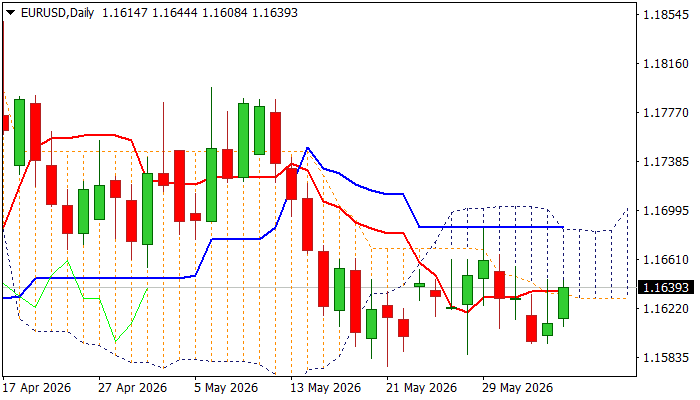
The Euro firmed on Friday and probes again through initial barrier at 1.1635 (daily cloud base / daily Tenkan-sen) after short-lived cloud penetration on Thursday which left daily candle with long upper shadow.
Daily cloud continues to cap upticks for almost two weeks, contributing to overall bearish daily structure (cluster of converged DMAs stays just above the price and created several bear-crosses / 14-d momentum remains in negative territory).
On the larger timeframe, the price remains underpinned by ascending and thick weekly cloud for the ninth consecutive week, that contributes to mixed signals, keeping the price action in directionless mode and holding within 1.1595/1.1685 range, with violation of either range boundary needed to generate initial direction signal.
Res: 1.1664; 1.1685; 1.1697; 1.1712
Sup: 1.1600; 1.1576; 1.1500; 1.1443
Dollar: Is History Repeating Itself?
- Mixed news from the Middle East is helping the greenback.
- Growing similarities with the 1970s for the Fed.
The US dollar has recovered after Donald Trump said negotiations with Iran are in their final stages. This contradicts Tehran’s statement that talks with Washington have made no progress and Hezbollah’s refusal to comply with the US-imposed ceasefire with Israel. Confusing developments in the Middle East are heightening uncertainty and boosting demand for safe havens.
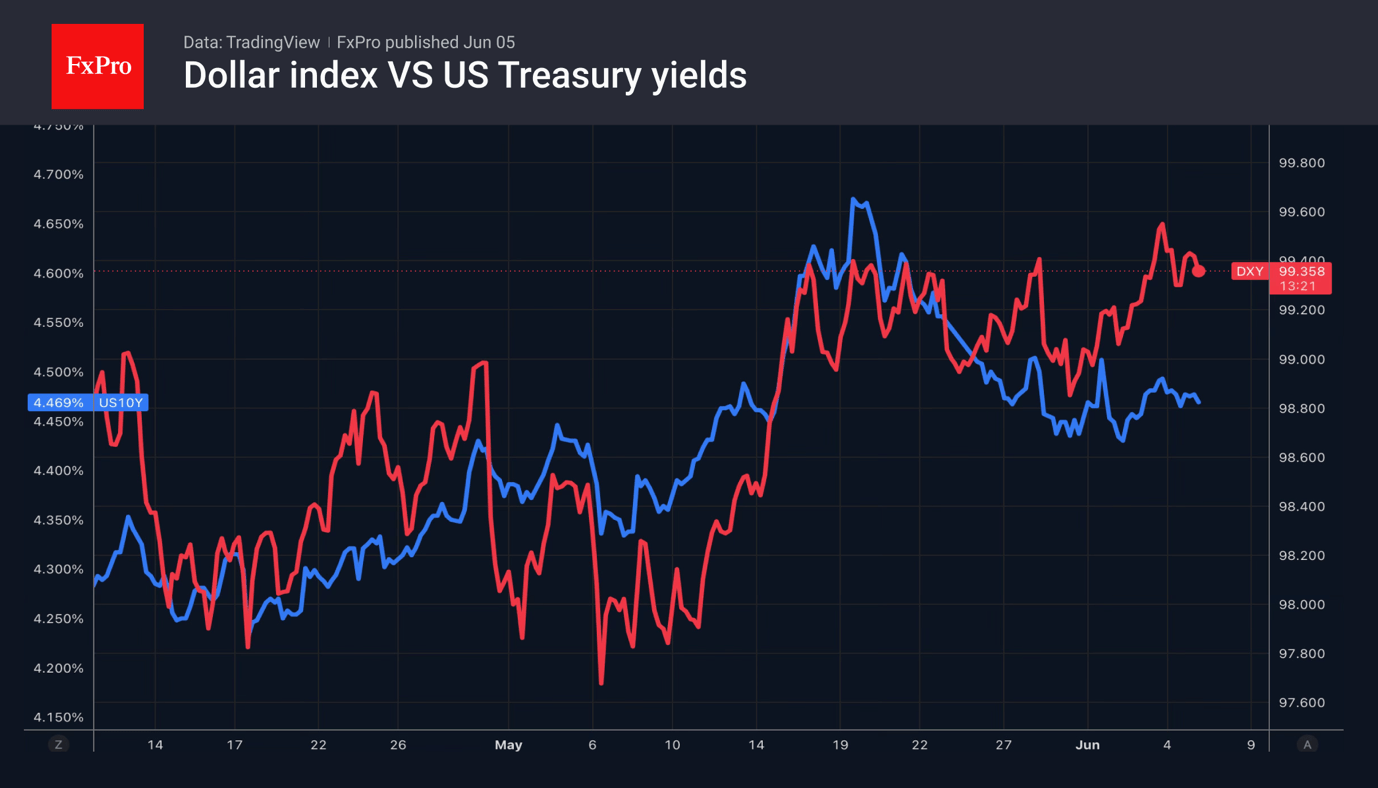
The US dollar has stabilised despite the fall in Brent crude and the resulting decline in Treasury yields. The likelihood of the Fed tightening monetary policy in 2026 is now below 50%. According to MLIV Pulse, 45% of investors surveyed believe the federal funds rate will remain unchanged this year, 35% expect it to rise, and 15% expect it to fall. More than half of respondents expect the US currency’s correlation with oil to strengthen. More than a third of investors expect the Dollar index and Brent crude to move lower together in the medium term.
This aligns with the Reuters consensus forecast for the EURUSD exchange rate to rise to 1.18, 1.19, and 1.20 over 1, 3, and 12 months, respectively. The baseline scenario is that the conflict in the Middle East will end, helping to shift Donald Trump’s focus from foreign policy to domestic issues. This probably means the White House will resume its pressure on the central bank to cut interest rates.
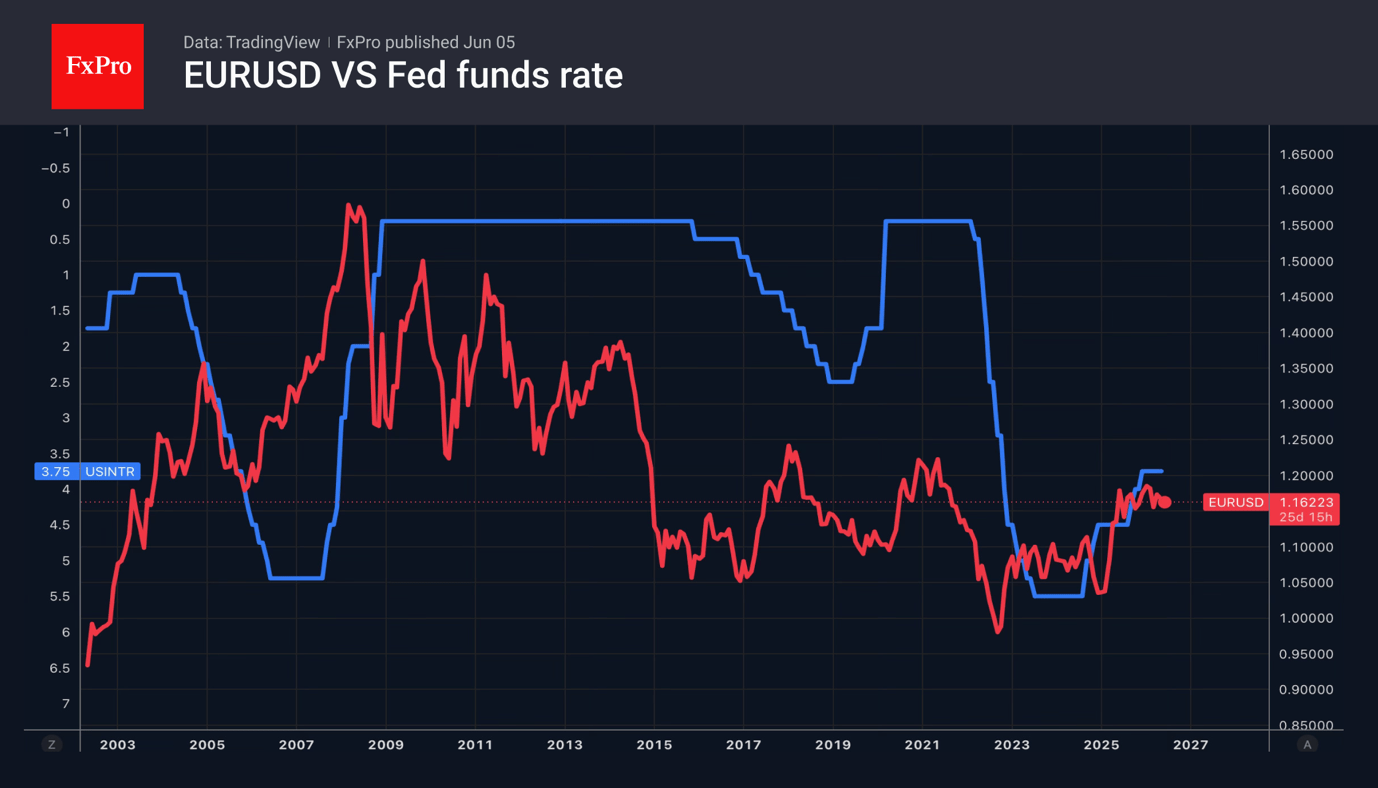
The current situation in financial markets and the global economy is, in many ways, reminiscent of the events of the 1970s. Back then, the oil crisis triggered a surge in inflation. However, instead of raising the federal funds rate, the central bank began to cut it under pressure from the White House. This led to uncontrolled price rises, successive rounds of aggressive monetary tightening, and a double-dip recession.
According to research by the Boston Fed, such a scenario is most likely to be avoided, as increased oil production has made the United States more resilient to oil shocks. Whereas in the 1970s inflation rose by 2.2 percentage points, it is now expected to rise by only 1.5 percentage points. Back then, unemployment jumped by 1.8 percentage points; today, the labour market is still generating new jobs, at least for now.
Intervention or Surrender? How Far Is Japan Willing to Draw on Its $1.3 Trillion War Chest?
Japan's latest reserve data have transformed the debate around the Yen. The question is not whether Tokyo is willing to intervene. It already has. The question now is how many times it is willing to do so. Data released on Friday showed Japan's foreign reserves fell by around USD 75 billion in May. The decline closely matches the Ministry of Finance's confirmation that Japan spent a record JPY 11.73 trillion, or roughly USD 73.4 billion, intervening in currency markets through May 28.
The figures strongly suggest that Japan financed much of the intervention by drawing down foreign securities, including US Treasuries. While the country's USD 1.3 trillion reserve stockpile remains enormous, the latest data provide the clearest evidence yet that intervention carries a real financial cost. Markets now have a benchmark for how much Tokyo is prepared to spend defending the currency. That benchmark is substantial, but it has not fundamentally altered the underlying trend. After briefly stabilizing, USD/JPY is once again pressing toward the psychologically important 160 level.
Japanese officials continue to signal readiness to act. Finance Minister Satsuki Katayama reiterated on Friday that authorities would respond "appropriately at any time when necessary" and retain the right to take "decisive action" against excessive volatility. She also stressed that Japan remains in close communication with the United States regarding exchange-rate developments. The verbal warnings have helped slow the pace of Dollar gains, but they have not changed the market's broader focus on widening policy divergence between the Federal Reserve and the Bank of Japan.
That divergence may face its next major test with the US non-farm payrolls report. A strong employment report, particularly one accompanied by faster wage growth or lower unemployment, could reinforce expectations that the Fed will remain focused on inflation risks rather than labor-market weakness. Such an outcome would likely push Treasury yields and Dollar higher across the board. If USD/JPY surges through 160 again, Japanese policymakers may soon face the same decision they confronted only weeks ago: intervene once more or tolerate further Yen weakness.
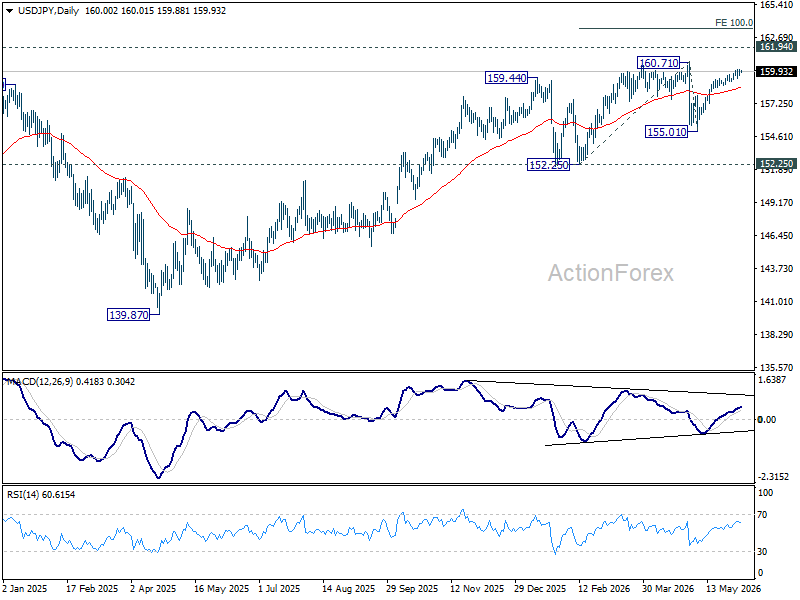
From a technical angle, the situation is finely balanced. The current rise from 155.01 is still viewed as the second leg of the corrective pattern from 160.71 high. Under that interpretation, another push higher should eventually be capped below 160.71 followed by a reversa. Firm break below 55 D EMA, currently around 158.62, would strengthen the case that the third leg lower has already begun and bring 155.01 back into focus.
However, the risks are not one-sided. Decisive break above 160.71 would invalidate the corrective view and suggest that the broader uptrend has resumed. Such a move would open the way to a through 2024 high at 161.94 to 100% projection of 152.25 to 160.71 from 155.01 at 163.47.
Eurozone Economy Contracts -0.2% qoq in Q1 as Trade and Investment Drag Growth Lower
The Eurozone economy contracted in the first quarter of 2026. GDP fell by -0.2% qoq, reversing the 0.2% expansion recorded in the previous quarter, while annual growth slowed sharply to 0.3% yoy from 1.2% yoy. Across the broader EU, GDP declined by -0.1% qoq, with annual growth easing to 0.7% from 1.4%.
The details suggest that domestic demand remained relatively resilient but was not strong enough to offset weakness elsewhere. Household consumption and government spending each contributed 0.1 percentage point to growth in both the Eurozone and EU, indicating that consumers and the public sector continued to provide modest support despite a challenging economic environment.
However, investment activity weakened, with gross fixed capital formation subtracting -0.1 percentage point from growth. Inventories also dragged on Eurozone GDP, while the largest negative contribution came from trade. Net exports reduced growth by -0.3 percentage point in the Eurozone and -0.2 percentage point in the EU, underscoring the impact of softer external demand and a sluggish global trade backdrop.
Performance across member states was highly uneven. Denmark led growth with a 1.9% quarterly expansion, followed by Estonia and Malta at 1.1%. At the other end of the spectrum, Ireland posted a sharp 12.1% contraction, while Lithuania, Sweden, and France also recorded declines.
The broad picture is one of a Eurozone economy losing momentum just as inflation remains elevated, complicating the ECB's task and reinforcing concerns about a stagflationary environment.
| Indicator | Q1 2026 | Q4 2025 | |
|---|---|---|---|
| Eurozone GDP Q/Q | -0.2% | +0.2% | |
| EU GDP Q/Q | -0.1% | +0.2% | |
| Eurozone GDP Y/Y | +0.3% | +1.2% | |
| EU GDP Y/Y | +0.7% | +1.4% |
| Component | Eurozone Contribution | EU Contribution |
|---|---|---|
| Household Consumption | +0.1 pp | +0.1 pp |
| Government Consumption | +0.1 pp | +0.1 pp |
| Fixed Investment | -0.1 pp | -0.1 pp |
| Inventories | -0.1 pp | 0.0 pp |
| Net Exports | -0.3 pp | -0.2 pp |
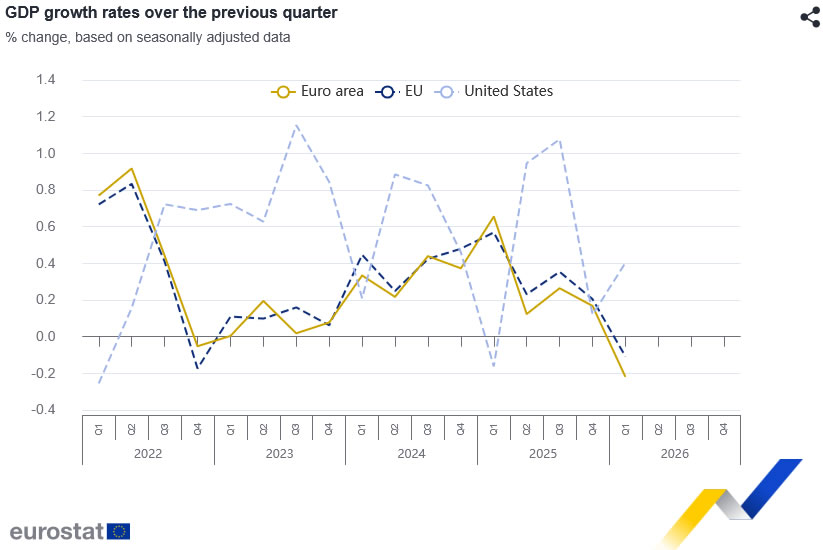
Chart Alert: EUR/USD Finds Support as ECB Hawkishness Offsets Fed Strength Ahead of NFP
Key takeaways
- EUR/USD remains resilient ahead of the US Nonfarm Payrolls report, supported by expectations that the European Central Bank will maintain a more aggressive tightening path than the Federal Reserve despite weak Eurozone growth.
- Interest-rate expectations are becoming increasingly supportive for the euro, with the Eurozone-US policy rate differential narrowing as markets price additional ECB rate hikes while the Federal Reserve faces a more balanced growth-versus-inflation trade-off.
- Technical indicators suggest EUR/USD may be forming a near-term base above key channel support at 1.1580, with improving momentum signalling a potential short-term recovery toward the 1.1645–1.1720 resistance zone.
Ahead of today’s critical US Nonfarm Payrolls release, the EUR/USD pair has been grinding sideways around the 1.1610-1.1620 zone, showing resilience amid a fundamentally strong US Dollar environment.
Diverging growth vs. converging hawkishness
The primary catalyst today will be the US labour market data. According to Reuters, the US economy is expected to have added 85,000 jobs in May, representing a slowdown from April’s 115,000, while the unemployment rate is forecast to remain unchanged at 4.3%.
A “slow-hire, slow-fire” equilibrium continues to anchor the US labour market, keeping conditions stable enough for the Federal Reserve to maintain its higher-for-longer stance. In fact, market pricing from the Fed funds futures market currently reflects a roughly 60% probability of a 25-basis-point hike by the Fed at its December 2026 meeting under new Chair Kevin Warsh.
Earlier this week, mixed signals, from stronger ADP and JOLTS data to an uptick in weekly jobless claims (225K), have kept traders cautious, clipping the USD slightly in recent sessions.
On the other side of the Atlantic, the Euro is being supported by an aggressively hawkish European Central Bank (ECB). Despite the Eurozone facing stagflation risks, with Q1 GDP growth a meagre 0.1% q/q, inflation remains sticky, hitting 3.2% y/y, largely driven by energy shocks.
Consequently, the latest Reuters polling indicates the ECB is highly likely to hike its deposit rate to 2.25% next week, providing a solid floor for the single currency and countering the dollar’s strength.
Further steepening of the Eurozone/US implied policy rate curve spread
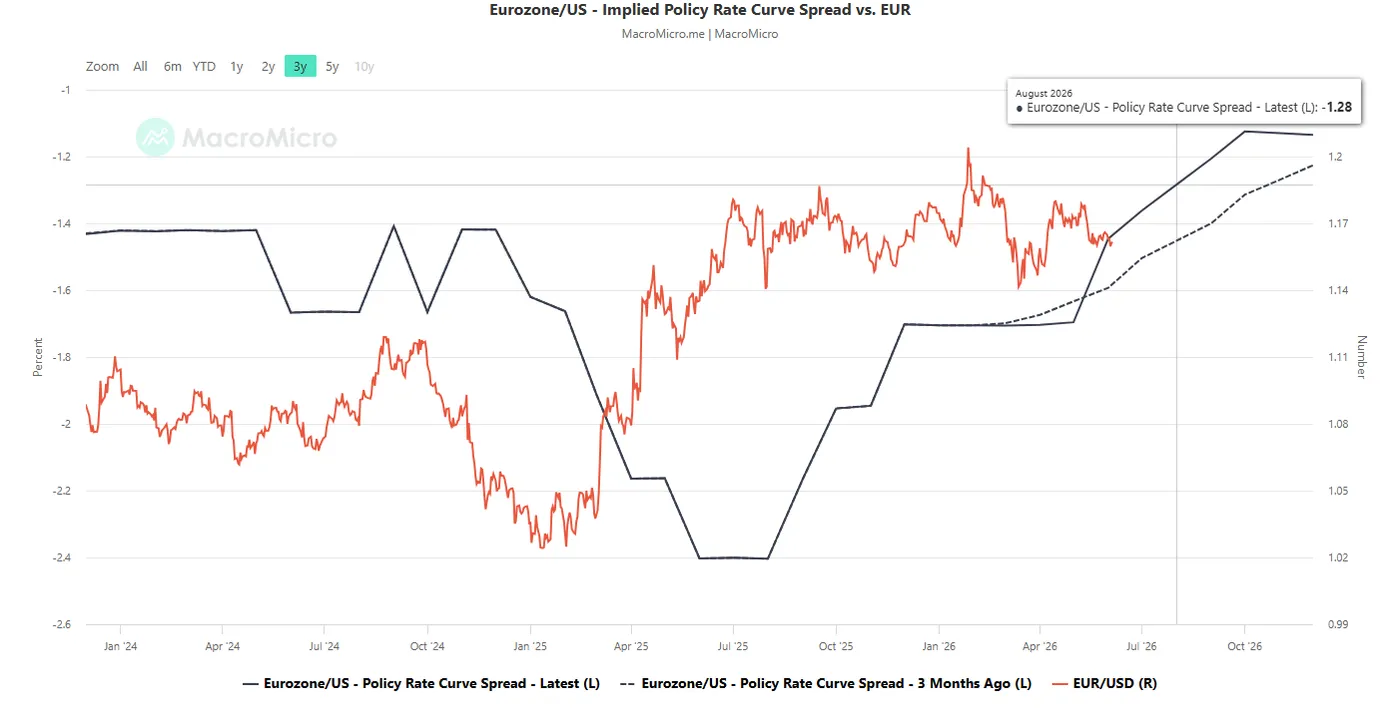
Fig. 1: Eurozone/US implied policy rate curve spread as of 5 Jun 2026 (Source: MacroMicro). The information presented is historical information, and past performance is not indicative of future performance.
Also, the monthly implied future policy interest rate curves for the Eurozone and the US, based on short-term interest rate futures, have steepened.
The Eurozone/US implied policy rate curve spread in August 2026 has increased to -1.28% from June 2026’s print of -1.45% and shifted upwards from -1.45% three months ago (see Fig. 1).
These observations suggest that the ECB is likely to be more hawkish or less dovish than the Fed, reinforcing a “floor” on the EUR/USD.
Let’s now focus on the short-term trajectory (1 to 3 days) of the EUR/USD from a technical analysis perspective.
Forming a potential minor base above the medium-term ascending channel support
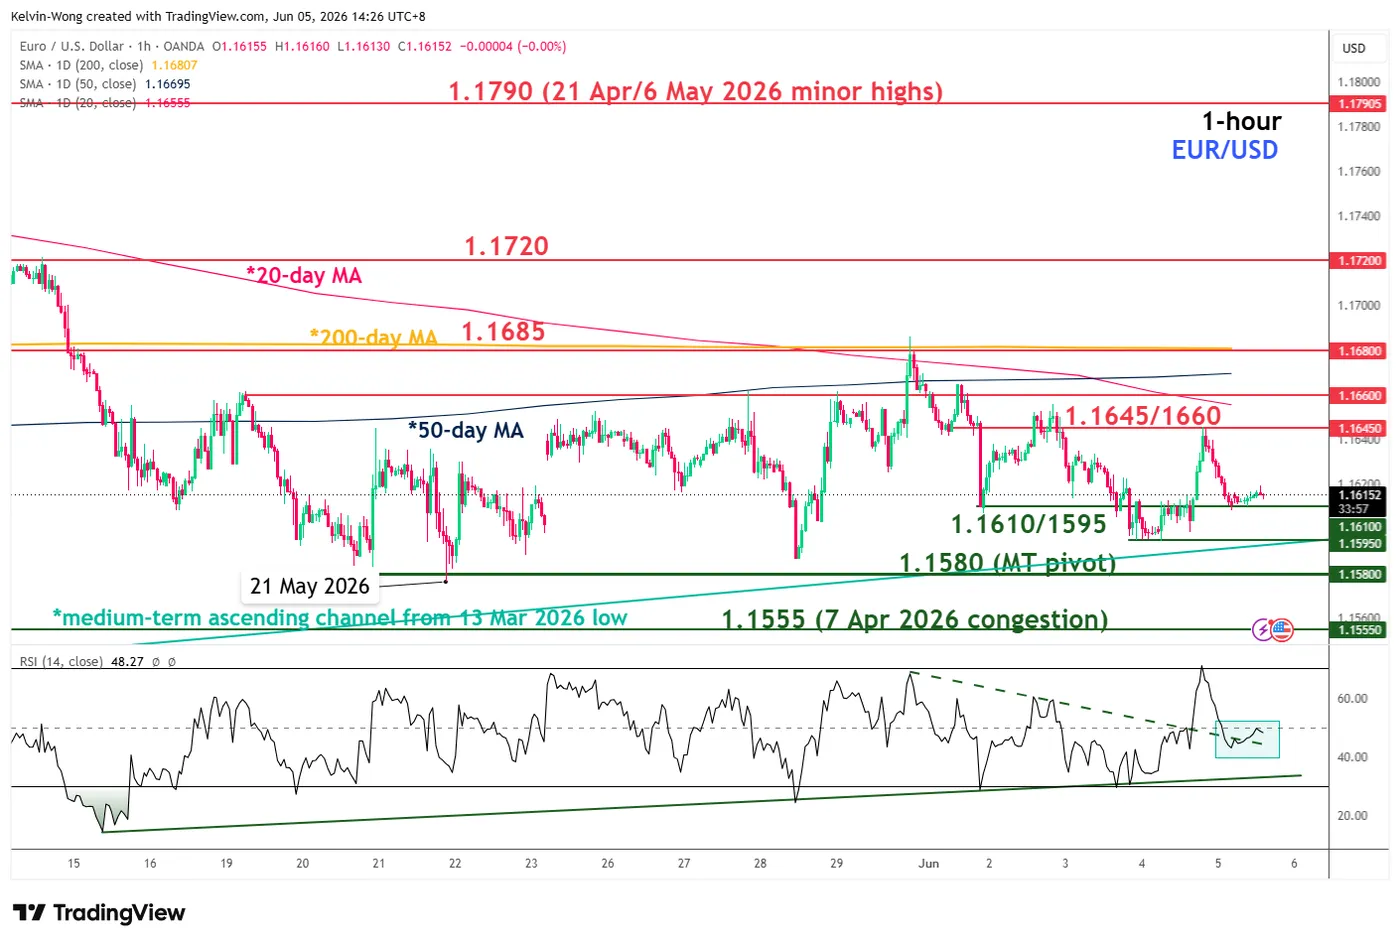
Fig. 2: EUR/USD minor trend as of 5 Jun 2026 (Source: TradingView). The information presented is historical information, and past performance is not indicative of future performance.
Trend bias: Bullish bias above 1.1580 medium-term pivotal support for a minor recovery (see Fig. 2).
Resistances: 1.1645/1660 (also the 20-day moving average), 1.1685 (also the 200-day moving average), 1.1720 (also the 61.8% Fibonacci retracement of prior decline from 6 May 2026 high to 21 May 2026 low).
Supports: 1.610/1595 (4 June 2026 minor low & medium-term ascending channel support from 13 Mar 2026 low), 1.1580 (MT pivot), 1.1555 (7 April 2026 congestion).
Key elements to support the near-term bullish bias on EUR/USD
- The recent sideways movement in EUR/USD since 21 May 2026 has formed a base/floor just above the lower boundary of the medium-term ascending channel in place since the 13 March 2026 low.
- The hourly RSI momentum indicator has staged a bullish breakout after finding support on its ascending trendline, suggesting a potential resurgence of short-term bullish momentum.
Brent: The Downtrend Begins to Crack
Fundamental backdrop
In April 2026, the closure of the Strait of Hormuz pushed Brent prices to their highest levels per barrel since 2022. However, diplomatic developments reversed the market’s direction: by the end of May, prices had fallen by around 19% — the worst monthly performance since the pandemic — amid ceasefire negotiations between the United States and Iran. Additional pressure came from OPEC+’s decision to increase production by 188,000 barrels per day in June.
The market remains cautious. Even if an agreement is reached, analysts continue to point to persistent risks for tanker traffic through the strait. US labour market data due on 5 June may also influence expectations regarding future energy demand.
Technical picture
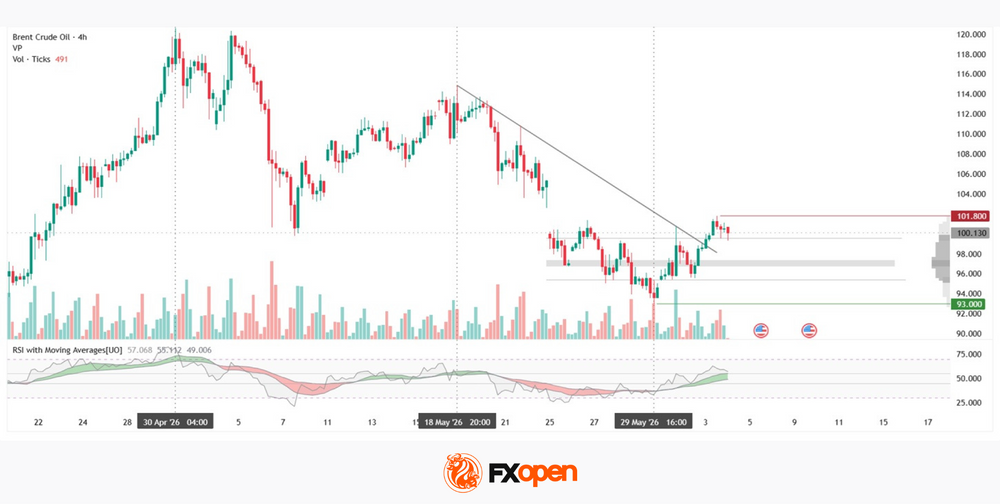
On the four-hour chart of Brent Crude Oil (XBRUSD on FXOpen), a short-term downtrend remains in place, having developed following the market reversal on 30 April and originating from the 114.5 area. In late May, the price tested the 93 region, which coincided with the green support level, before staging a recovery. The market is now attempting to break above the descending trendline and is testing the upper boundary of the current profile at 99.600 as support.
The profile spans the range between 95.400 and 99.600. The point of control (POC) is located in the 96.950–97.150 area — the price zone that attracted the highest concentration of trading activity during the reversal phase. The 101.800 area may act as the nearest resistance level; if prices remain above the profile, this level could become a key focus for market participants. Should the market fall back below 99.600, the POC may provide support for another attempt to move higher.
The RSI and its moving averages currently stand at 57, 55 and 49. The indicator remains above both moving averages, while their positive slope suggests strengthening short-term bullish momentum.
Key takeaways
The main factor likely to determine Brent’s direction in the coming weeks remains the progress of US-Iran negotiations. Any indication of delays or a breakdown in talks could reintroduce a geopolitical risk premium into prices. From a technical perspective, the market is approaching a decision point: the outcome of the current attempt to break the descending trendline may determine the next short-term direction of Brent prices.
Start trading commodity CFDs with tight spreads (additional fees may apply). Open your trading account now or learn more about trading commodity CFDs with FXOpen.
This article represents the opinion of the Companies operating under the FXOpen brand only. It is not to be construed as an offer, solicitation, or recommendation with respect to products and services provided by the Companies operating under the FXOpen brand, nor is it to be considered financial advice.
EUR/USD: All Eyes on Non-Farm Payrolls
EUR/USD was trading at 1.1613 on Friday. As the week draws to a close, the US dollar remains on track to post gains, supported by ongoing uncertainty in the Middle East and continued demand for safe-haven assets.
US President Donald Trump stated that negotiations aimed at resolving the conflict are approaching their final stage and that Washington has no interest in returning to a full-scale confrontation with Iran. However, Iranian Foreign Minister Abbas Araghchi noted that no significant progress has been achieved in the talks yet. Adding to market concerns, the Iranian-backed Hezbollah movement rejected a US-backed ceasefire proposal between Israel and Lebanon.
Investor attention is firmly focused on today’s Non-Farm Payrolls report. The labour market data is expected to provide fresh insight into the health of the US economy and the likely direction of future Federal Reserve policy.
Recent employment figures have highlighted the resilience of the US economy, reinforcing expectations that the Federal Reserve will maintain a hawkish stance. Against a backdrop of elevated energy prices and inflation risks linked to the Middle East conflict, markets continue to price in the possibility of another interest rate increase before the end of the year.
Technical Analysis
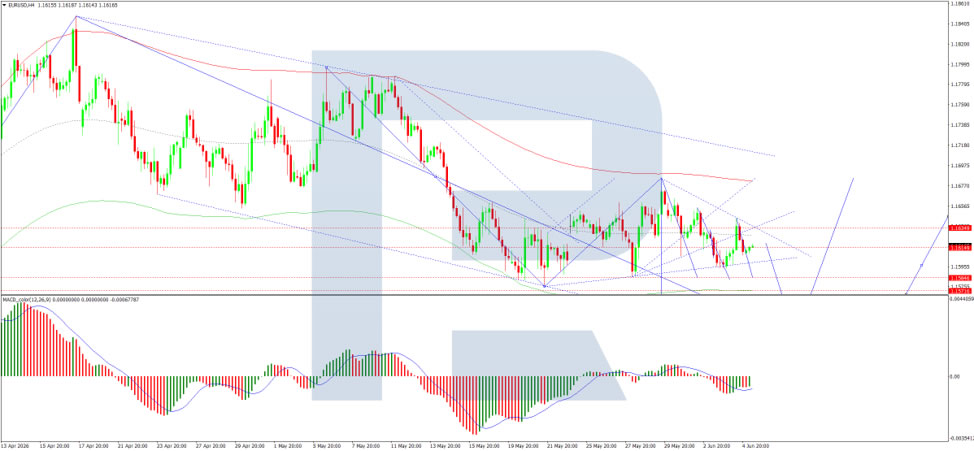
On the H4 chart, EUR/USD is trading within a compact consolidation range around the 1.1620 level. The current structure suggests a move lower towards 1.1525, with scope for an extension to 1.1500.
The MACD indicator supports this scenario, with its signal line below zero and pointing firmly downwards, reflecting persistent bearish momentum.
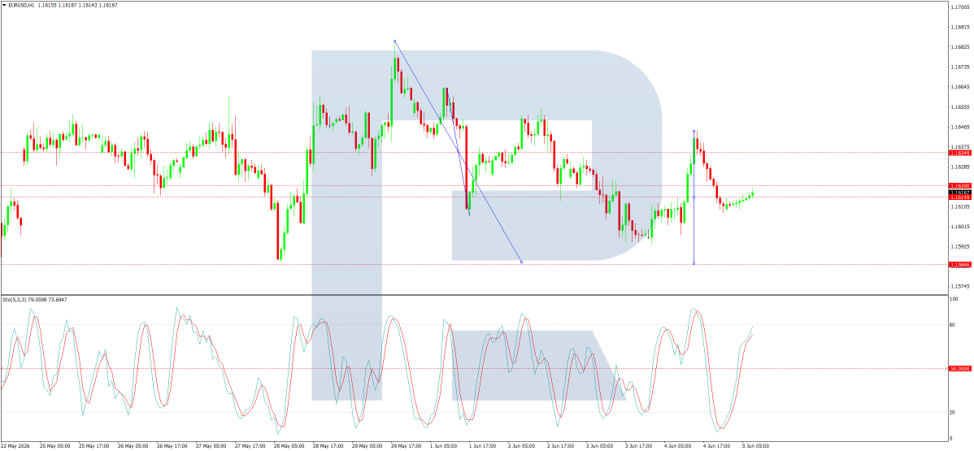
On the H1 chart, EUR/USD has reached 1.1644 before declining to 1.1607. In effect, the pair has formed the boundaries of a consolidation range around 1.1620.
A breakout above the range could trigger another upward move towards 1.1660, with scope for an extension to 1.1675 before the broader downtrend resumes towards 1.1500.
A downside breakout would strengthen the case for a direct move towards 1.1500, potentially marking the completion of the third wave within the current bearish trend.
The Stochastic oscillator confirms this outlook, with its signal line turning lower from 80 and pointing towards 20, indicating the beginning of a short-term decline.
Conclusion
EUR/USD remains under pressure as geopolitical uncertainty and expectations of prolonged restrictive US monetary policy continue to support the dollar. The Non-Farm Payrolls report will be the key catalyst for the market, while technical indicators suggest that downside risks remain dominant in the near term.
Sunrise Market Commentary
Markets
The stock sell-off that loomed following Broadcom’s earnings (outlook) miss turned out to be more of a sectoral rotation rather than a broad-based slump. The industrial Dow Jones Index rallied 1.7% while the Nasdaq was bought on a 1.1% opening dip. This tech-heavy index eventually finished virtually unchanged. When looking at Asian trading this morning, valuation concerns may not have fully subsided though. South Korean indices, seen as an AI-bellwether, slump up to 5% and Nasdaq futures, though still very early, trade 1% lower. Core bonds gained but closed off the intraday highs. Net daily changes for US yields varied between -1.8 and -3.8 bps in a bull steepening move. German rates ended less than 1.5 bps lower across the curve. Lower oil prices have inspired bond investors in doing so. Brent retreated from a close just shy of $98 on Wednesday to $95 yesterday after the US brokered a new ceasefire between Israel and Lebanon. But signs of it being respected are next to non-existent. Iran-backed Hezbollah in Lebanon also rejected some of the terms, saying they won’t cease their attacks unless Israel fully withdraws from Lebanon. Meanwhile the stalemate between the US and Iran persists, and with it the familiar opposing views of how peace talks are going. According to president Trump truce talks between the two are in the final stages while Iran said negotiations had stalled. Currency markets showed no major moves. A EUR/USD recovery already hit resistance around 1.165 and eventually settled at 1.161, marginally higher than the 1.16 open. USD/JPY recouped most of the intraday losses which were inspired by weaker oil (USD) and talk of BoJ rate hikes (JPY). The pair holds firm ground around the 160 interventionist barrier.
Today centers around the May US payrolls. The traditional beginning-of-the-month economic update so far has surprised to the upside: from Monday’s manufacturing ISM over Tuesday’s JOLTS to Wednesday’s ADP job report and services ISM. The string of solid data makes Fed hawks increasingly vocal. Cleveland Fed Hammack and Dallas Fed Logan hinted at a rate hike later (this year) if the current trends of higher inflation and a resilient economy with a stable labour market continue. That should be preluded by a change in wording of the policy statement. We expect the current dovish bias to disappear at the June policy meeting. The labour market report today should underpin this. Consensus expects an 88k job increase, slightly decelerating from April’s 115k. We think that bar is beatable. The unemployment rate is anticipated to stabilize around 4.3%. A first full Fed hike is priced in by March 2027 but there’s room to pull this forward in time, potentially supporting the USD and US (front-end) rates.
News & Views
The Reserve Bank of India left its policy rate unchanged at 5.25% this morning. Real GDP growth for 2026-27 is projected at 6.6% (down from 6.9%). Prolonged global supply chain disruptions, heightened volatility in global financial markets, and weather-related shocks continue to pose downside risks. CPI inflation for 2026-27 is projected to be 5.1% (up from 4.6%) with core inflation expected at 4.7%. Headline CPI is forecast to firm towards the upper tolerance level (6%) before subsiding as the energy shock wanes. These forecasts are subject to upside risks due to global supply chain disruptions and uncertainty about the spatial and temporal distribution of monsoon. The MPC for now retains a neutral stance, but admits that risks of higher inflation have amplified. The Indian rupee is a tad stronger this morning but overall holds near all-time lows against the dollar (USD/INR 95.35 vs 97). The currency is also part of future deliberations for the Indian central bank. The RBI vows to prevent disorderly FX movements and announced steps to boost capital inflows into the country (more bonds in fully accessible route for foreign investors and concessional FX swaps).
Anthropic argues in a blog post on its website that they believe it would be good for the world to have the option to slow or temporarily pause frontier AI development to enable societal structures and alignment research to keep up with the advance of the technology. AI systems are advancing so rapidly that they may soon be able to improve themselves without human intervention in ways that could pose significant societal risks. This is called recursive self-improvement. “We are not there yet, and recursive self-improvement is not inevitable. But it could come sooner than most institutions are prepared for.”
Elliott Wave Outlook: S&P 500 (SPX) Extends Impulsive Advance
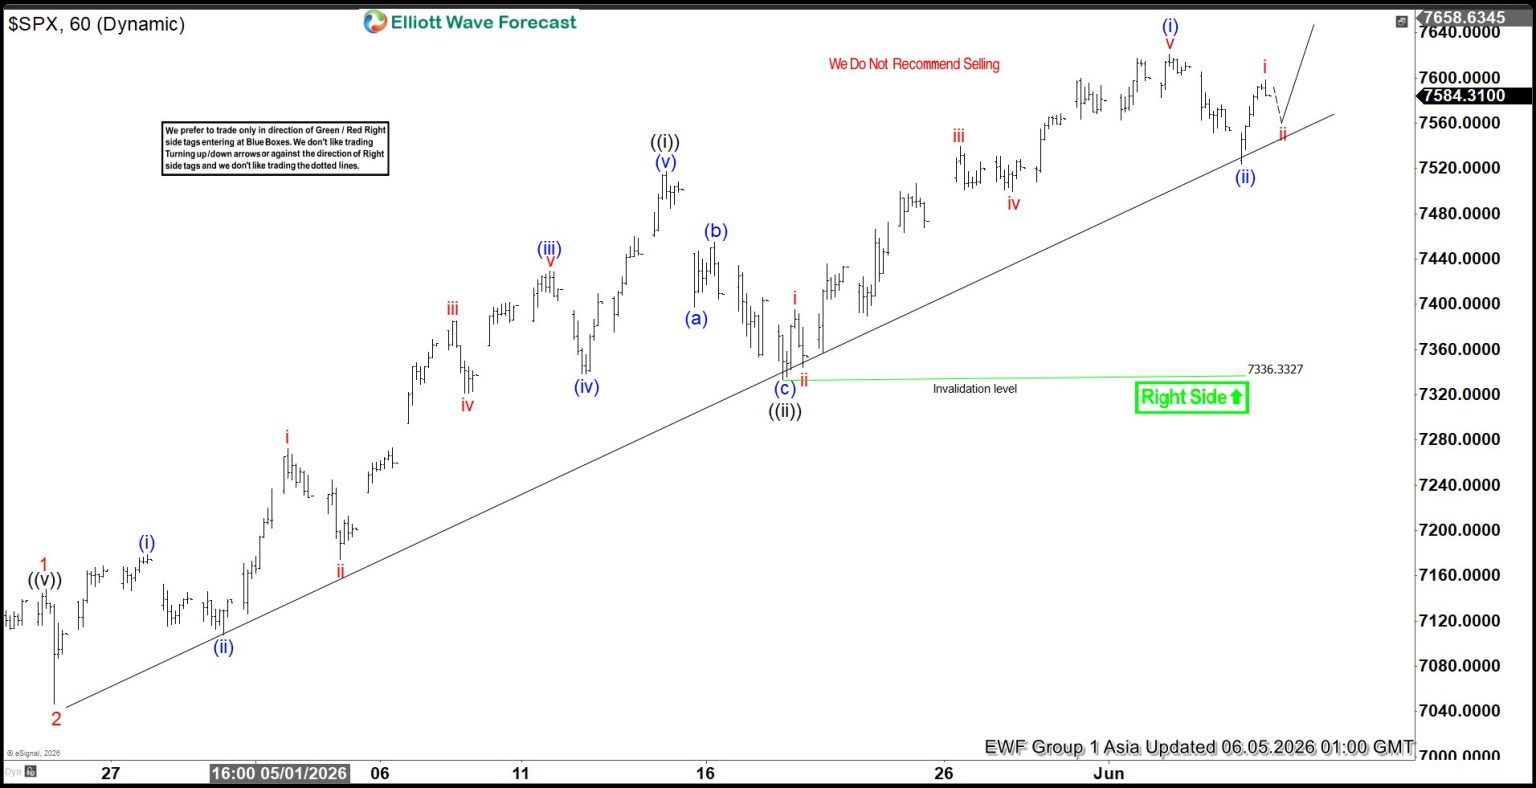
The S&P 500 (SPX) continues to push into new all‑time highs, advancing in a clear impulsive structure. The current cycle began from the March 30, 2026 low, where wave 1 concluded at 7147.78. A corrective dip followed, with wave 2 ending at 7046.55. From that point, the Index established a nested sequence higher in wave 3. Within this progression, wave ((i)) terminated at 7517.12, while the subsequent pullback in wave ((ii)) found support at 7336.33.
Momentum has since carried the Index higher in wave ((iii)). From the low of wave ((ii)), wave (i) ended at 7620.90, and the retracement in wave (ii) completed at 7523.58. As long as the pivot at 7336.33 remains intact, near‑term pullbacks are expected to hold support. These corrections should unfold in either three or seven swings before the Index resumes its upward trajectory.
However, risk management remains essential. If the pivot from May 19 at wave ((ii)) fails, the implication is that the cycle from the March 30, 2026 low has concluded. In that scenario, the Index would be positioned to correct a larger degree cycle against the March 30 low. Traders should therefore monitor the key levels closely, as the integrity of the impulsive structure depends on the preservation of these pivots.
S&P 500 (SPX) 60-Minute Elliott Wave Chart
SPX Elliott Wave Video:
https://www.youtube.com/watch?v=0lz7aDsJnQs
AI Rally Stalls on Broadcom Miss, While ‘Sell Indonesia’ Sweeps Markets
Key takeaways
- The AI-driven equity rally is showing signs of fatigue after Broadcom’s disappointing guidance triggered a sharp selloff in semiconductor and cybersecurity stocks, prompting investors to rotate into more defensive and cyclical sectors.
- The Dow Jones Industrial Average surged to a record high as falling oil prices eased inflation concerns, while hopes for progress in US-Iran negotiations supported industrial, financial, and value-oriented sectors.
- Indonesia has emerged as a major source of regional market stress, with the rupiah and local equities suffering significant capital outflows amid concerns over government intervention policies, raising broader emerging-market contagion risks across Asia.
- Chart of the day: Nasdaq 100 minor uptrend from 19 May 2026 at risk of breaking down below 30,535 key short-term resistance.
Chart of the day - Nasdaq 100 at risk of minor corrective decline
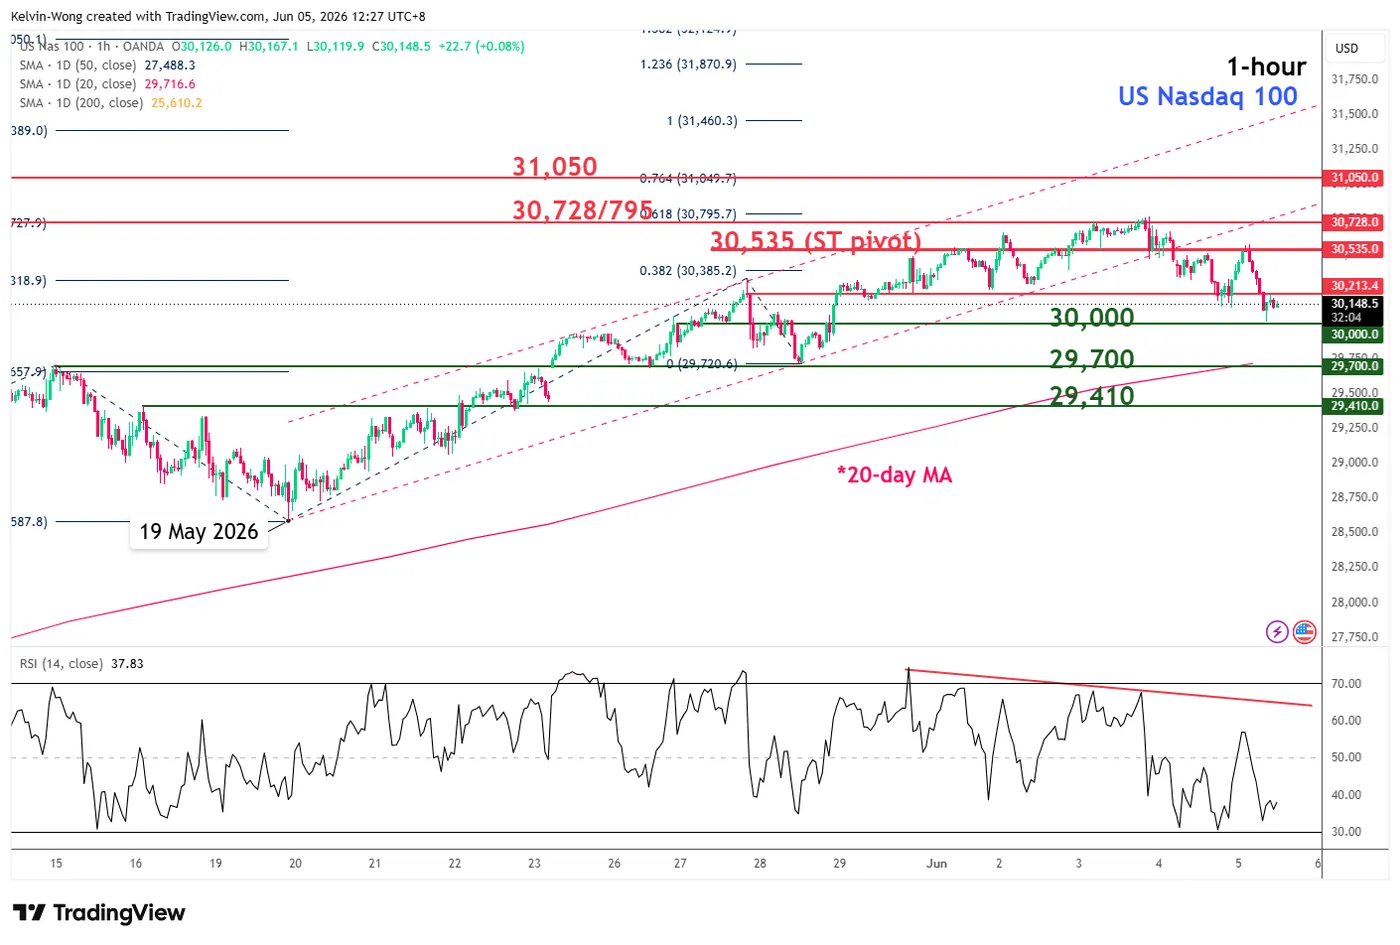
Fig. 1: US Nasdaq 100 CFD minor trend as of 5 Jun 2026 (Source: TradingView). The information presented is historical information, and past performance is not indicative of future performance.
The price action of the US Nasdaq 100 CFD (a proxy for the Nasdaq 100 E-mini futures) has staged a bearish breakdown below its minor ascending channel support, taken from the 19 May 2026 low, after it printed a fresh intraday all-time high of 30,773 on Wednesday, 5 June 2026.
Yesterday’s bearish reaction close to the former ascending channel support implies that the minor uptrend phase from the 10 May 2026 low is in jeopardy.
Watch the 30,535 key short-term pivotal resistance, and a break below 30,000 near-term support may trigger a minor corrective decline towards the next intermediate supports at 29,700 (also the 20-day moving average), and 29,410.
However, a clearance with an hourly close above 30,535 invalidates the bearish tone and extends the bullish impulsive up move, with the current all-time high area at 30,728/795, before the next intermediate resistance comes in at 31,050 (Fibonacci extension).
Top macro headlines
- Tech sector wobbles on Broadcom outlook: Broadcom Inc. shares slumped 14% to 15% in premarket trading after its semiconductor revenue forecast fell short of expectations. This triggered a broader tech selloff that also hit cybersecurity firms like CrowdStrike, which dropped 10%.
- Dow surges as oil eases: Reversing yesterday’s spike, WTI and Brent crude prices dropped by 2%-3% to fall back to around $95-83 a barrel as traders eyed a potential Iran deal following news of a Lebanon-Israel ceasefire. This relief in energy costs propelled the Dow Jones Industrial Average up 875 points (1.70%) to a record high.
- Middle East ceasefire complications: While oil prices initially fell on ceasefire hopes, US efforts to halt fighting in Lebanon were undermined after the pro-Iran Hezbollah movement rejected the new truce and Israel said it would not withdraw troops. Progress in US-Iran talks has also stalled.
- Indonesian markets plunge: Indonesian assets are in a severe selloff, with the benchmark stock index tumbling 36% from its record high five months ago, making it the worst-performing market globally this year. The rupiah fell by over 7% amid concerns about President Prabowo Subianto’s interventionist policies.
Key macro themes
- AI Enthusiasm meets reality check: The “parabolic” rally in semiconductor and AI stocks is taking a breather. Investors are rotating out of tech and into other sectors viewed as better positioned for a resilient economy, re-evaluating the immediate revenue returns of massive AI infrastructure spending.
- Emerging-market contagion risks: The rapid withdrawal of foreign capital from Indonesia underscores the vulnerability of emerging markets to populist political shifts. The South Korean won also fell to its weakest level since 2009 at 1,545 per USD, indicating broader pressure on Asian currencies as the Iran war drags on.
- Energy security and inflation: Oil markets remain sensitive to developments in the Middle East, with the Saudi energy minister calling for stability at a Russian economic forum to prevent a loss of energy sustainability. Markets are weighing whether oil-driven inflation pressures could force a US interest rate hike as soon as October.
Global markets impact (last 24 hours)
Equities: S&P 500 futures slipped to 0.4%, and Nasdaq 100 futures dropped 1.1% in today’s early Asia session. Conversely, the Dow Jones Industrial Average rose to a record high on sector rotation on Thursday, 4 June. Europe’s Stoxx 600 rose 0.5% amid its lower tech weighting. The UK’s FTSE 100 added 0.3%.
Fixed Income: Shorter-term US Treasuries rebounded, with the US 2-year yield declining 4 basis points to 4.05% ahead of today’s US non-farm payroll report, while the US 10-year yield held steady at around 4.48%.
FX: The US Dollar Index fell 0.1%. The euro rose 0.4% intraday to $1.1645 before closing lower at $1.1611 on Thursday, 4 June. The Japanese yen strengthened slightly to 159.77-159.85 per USD before rebounding to 160.00 (close to prior intervention levels).
Commodities: WTI crude fell by 3.4% to around $92.92/bbl. Spot gold rebounded by 0.9% to $4,475/oz but remained below its 20-day moving average at around $4,544/oz.
Asia Pacific impact
- Tech-heavy markets suffer: The MSCI Asia Pacific Index fell 0.8% to 1.3%, dragged down by the US tech selloff. South Korea’s KOSPI tumbled 5% intraday, acting as a bellwether for regional AI investments. Across the board, weakness was seen in key Asia Pacific benchmark stock indices today: Nikkei 225 (-1.6%), Hang Seng Index (-0.8%), China A50 (-0.1%), ASX 200 (-0.7%), and STI (-0.3%).
- Currency Interventions looming: The South Korean won hit its weakest level since 2009. Authorities in Indonesia and the Philippines are stepping up efforts to support their currencies as policymakers near the limits of their currency defences.
- Indonesian rout: The “sell Indonesia” trade is dominating the region, with massive foreign capital outflows from both bonds and equities following President Prabowo’s move to take direct control of key commodity exports.
Top 3 events to watch today
- US Nonfarm Payrolls (May) - 8.30 pm SGT (consensus: +85K, Apr: +115K) Impact: All asset classes
- US Unemployment Rate (May) - 8.30 pm SGT (consensus: 4.3%, Apr: 4.3%) Impact: All asset classes
- US-Iran peace talks/ceasefire developments Impact: All asset classes