
Sample Category Title
EUR/JPY Daily Outlook
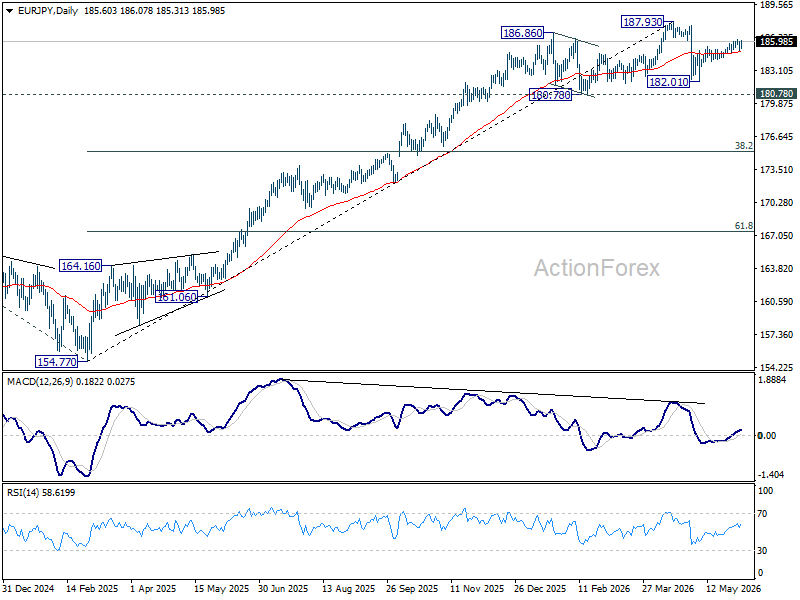
Intraday bias in EUR/JPY remains neutral for the moment. Further rise is expected as long as 184.42 support holds. Above 186.18 will extend the rebound from 182.01. Firm break of 61.8% projection of 182.01 to 185.44 from 184.42 at 186.53 will pave the way to 100% projection at 187.85.
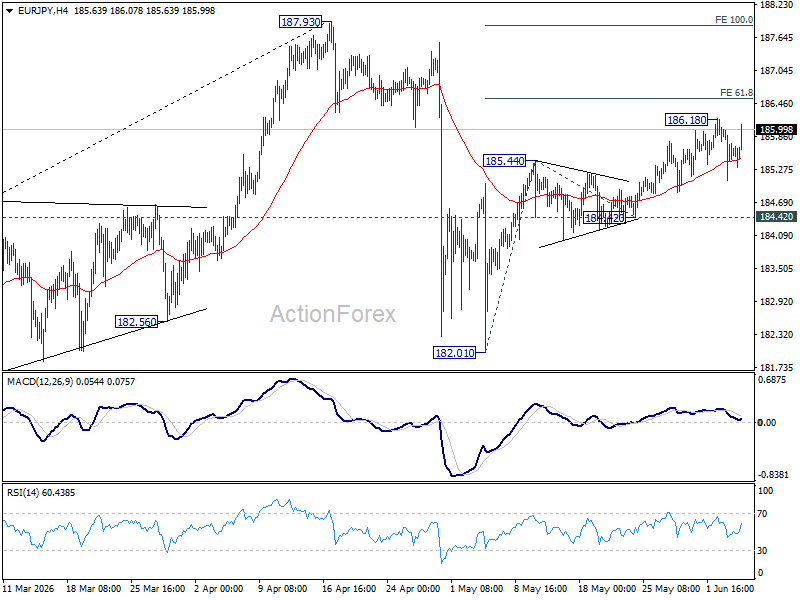
In the bigger picture, the pullback from 187.93 was steep, there is no sign of reversal yet. Uptrend from 114.42 (2020 low) is still expected to resume at a later stage to 78.6% projection of 124.37 (2022 low) to 175.41 (2025 high) from 154.77 at 194.88. However, sustained break of 55 W EMA (now at 178.78) will argue that it's already in a medium term down trend to 175.41 resistance turned support and below.
EUR/AUD Daily Outlook
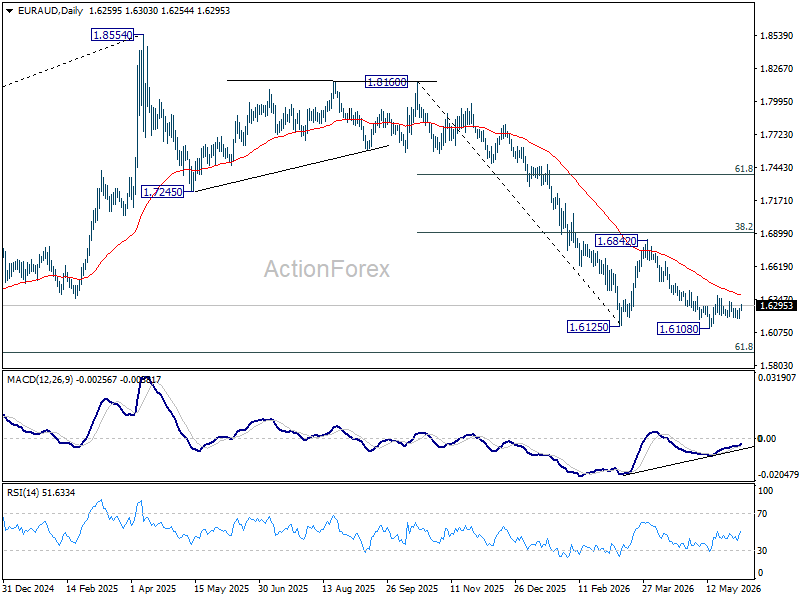
Intraday bias in EUR/AUD remains neutral at this point. Rise from 1.6108 is seen as the third leg of the corrective pattern from 1.6125. Above 1.6381 will bring stronger rebound back towards 1.6842 resistance. Nevertheless, firm break of 1.6108 will resume the larger down trend from 1.8554.

In the bigger picture, fall from 1.8554 (2025 high) is in progress and deeper decline should be seen to 61.8% retracement of 1.4281 to 1.8554 at 1.5913, which is slightly below 1.5963 structural support. Decisive break there will pave the way back to 1.4281 (2022 low). For now, risk will stay on the downside as long as 55 W EMA (now at 1.6956) holds, even in case of strong rebound.
EUR/GBP Daily Outlook
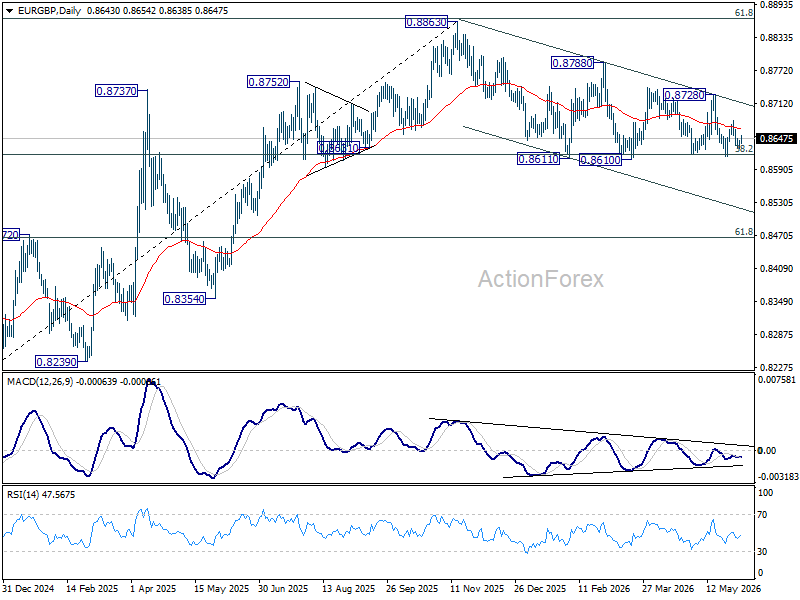
No change in EUR/GBP's outlook as range trading continues. Intraday bias stays neutral at this point. On the downside, decisive break of 0.8610 support will revive the case of bearish trend reversal. On the upside, break of 0.8728 resistance will bring stronger rally back to 0.8788 resistance and above.
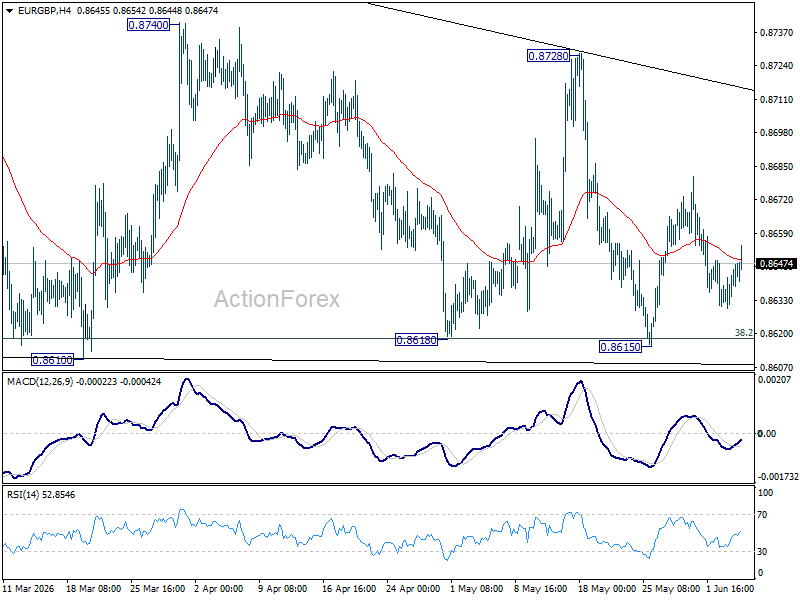
In the bigger picture, focus is staying on 38.2% retracement of 0.8821 to 0.8863 at 0.8618. Strong rebound from there will retain medium term bullishness. Rise from 0.8221 should resume through 0.8863 at a later stage. Nevertheless, sustained break of 0.8618 will confirm that whole rise from 0.8221 has completed at 0.8863. Deeper decline should then be seen to 61.8% retracement at 0.8466 at least.
EUR/CHF Daily Outlook
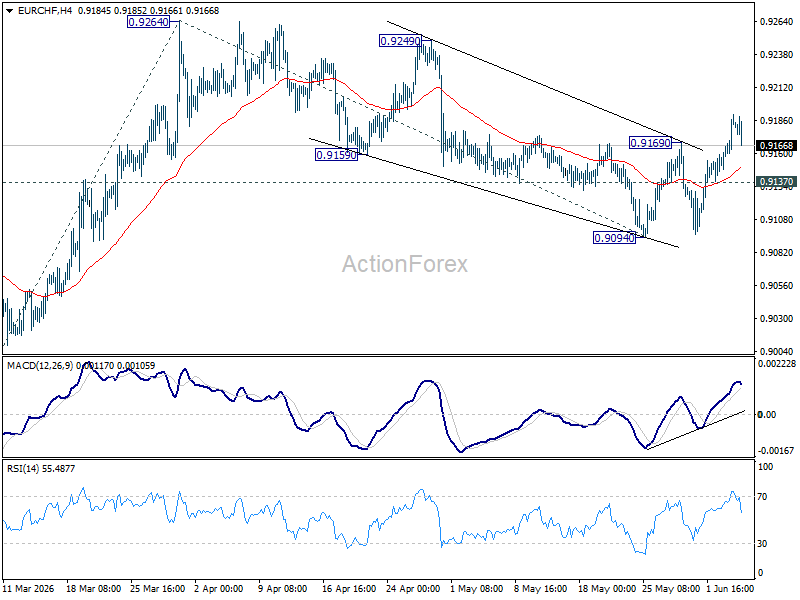
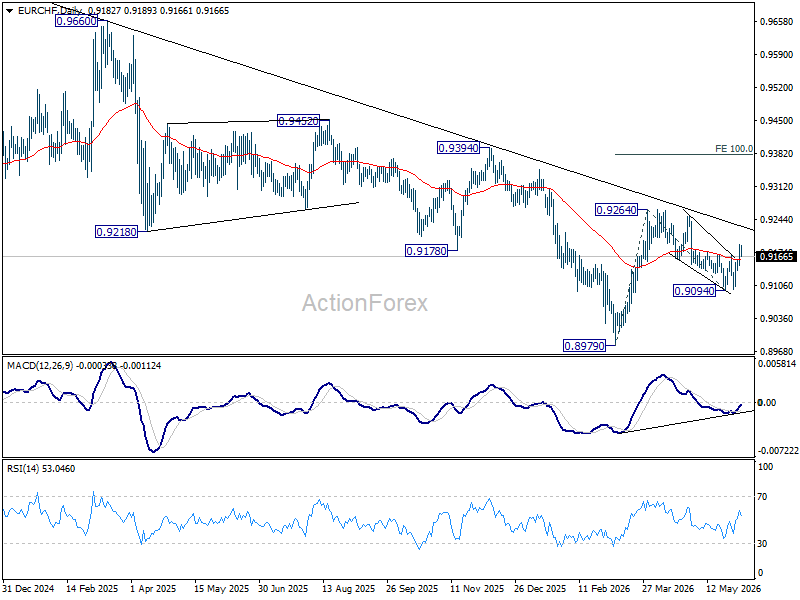
EUR/CHF's strong break of 0.9169 resistance suggests that fall from 0.9264 has completed as a correction at 0.9094. Intraday bias is back on the upside for retesting 0.9264 first. Firm break there will resume the rise from 0.8979 to 100% projection of 0.8979 to 0.9264 from 0.9094 at 0.9379. On the downside, break of 0.9137 minor support will mix up the outlook and turn intraday bias neutral again first.
In the bigger picture, as long as 0.9394 resistance holds, down trend from 0.9928 (2024 high) should still be in progress. Firm break of 0.8979 will confirm down trend resumption. However, decisive break of 0.9394 will be an important sign of medium term bullish reversal.
Crypto Market Continues to Plummet
Market Overview
The crypto market capitalisation has lost a further 3.5% over the past 24 hours in a sharp sell-off that began this month. During this period, the capitalisation has fallen to $2.22T, and at its lowest point early in the day, it dropped to $2.17T, compared to $2.50T on Sunday. In this environment, market movements are characterised solely by varying degrees of decline: from -0.6% (TRON) and -3% (Hedera) to -15% (NEAR, Toncoin).
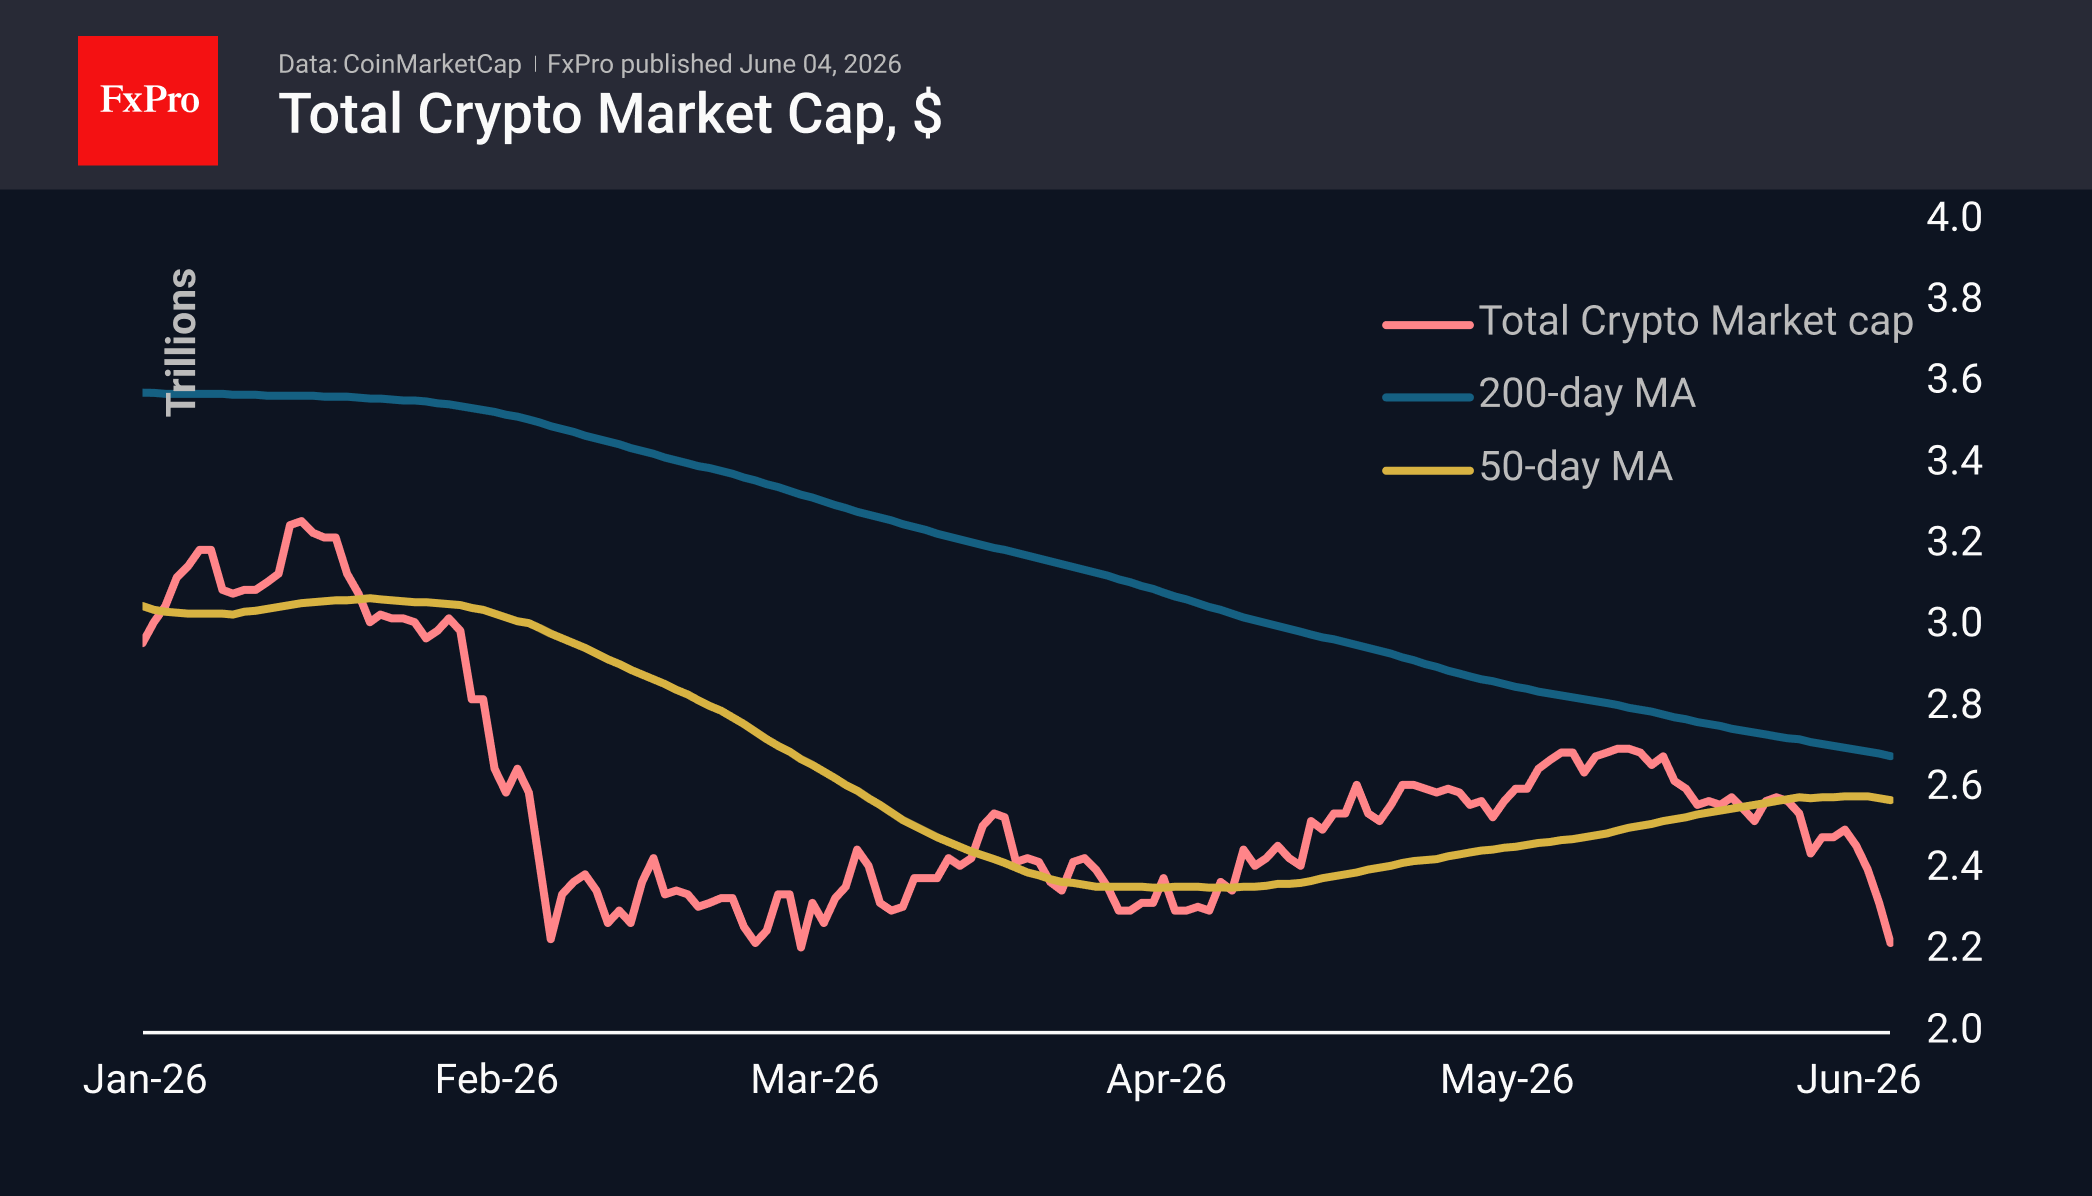
Bitcoin briefly fell to $61.3K early on Thursday, returning to the region of its February lows. In this region, the leading cryptocurrency found buyers during dips in February and March. A break below the lows from the start of the year would make the $53–55K range the next potential downside target. Although we do not see a sharp slide downwards, as was the case four months ago, the RSI is at roughly the same levels of extreme oversold conditions.
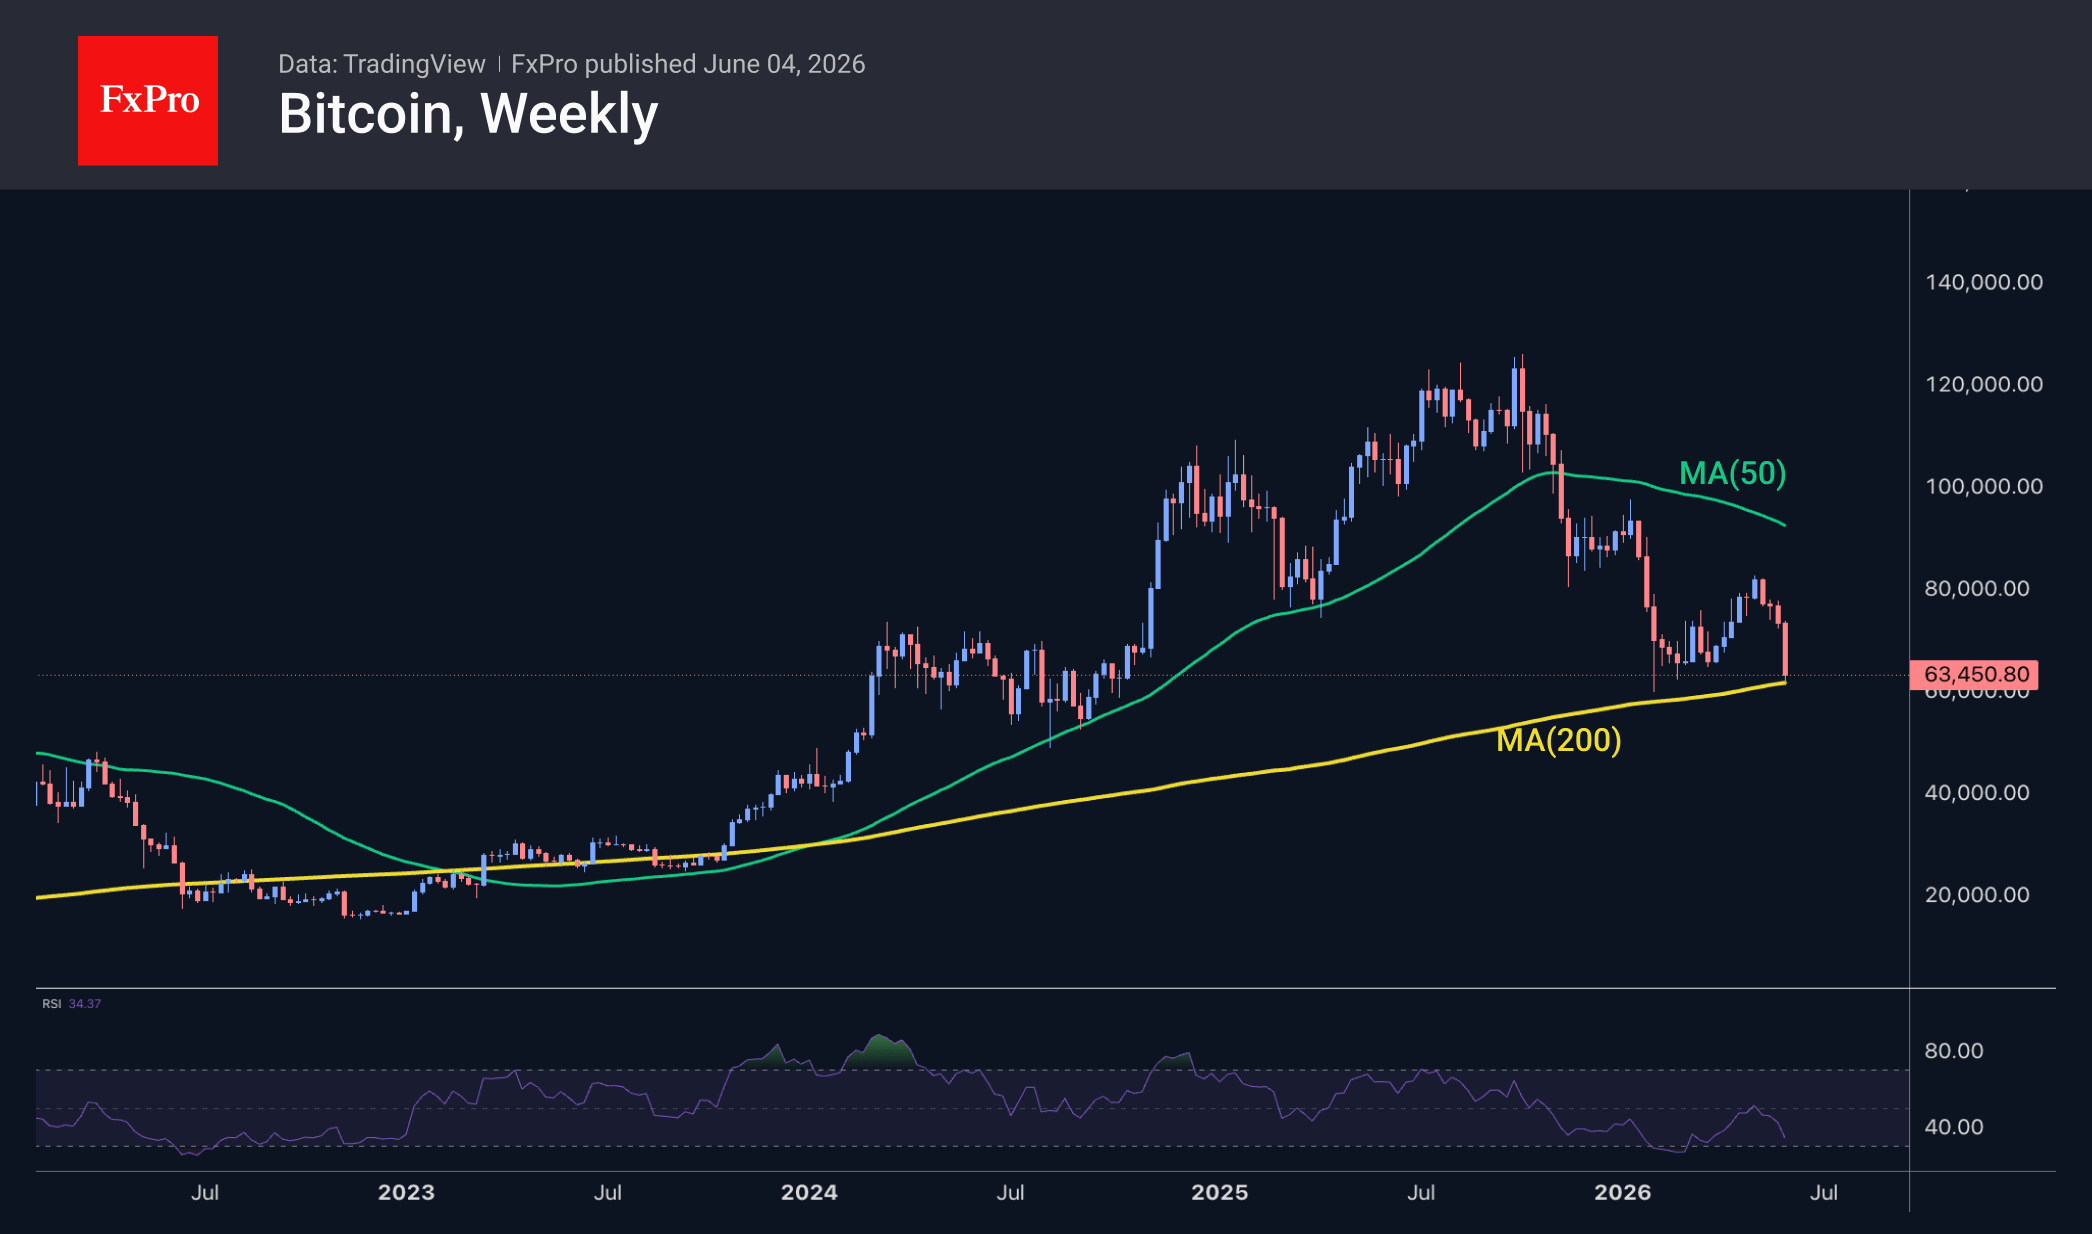
It is also significant that, on weekly timeframes, BTC is once again testing the 200-week moving average, which has historically been a strong support level: the only period of a break below it was in the second half of 2022. Although nervous selloffs and technical slippage during the automatic execution of orders at times of reduced liquidity cannot be ruled out, it is quite likely that the market will take a breather from its decline. After all, even bears need a rest now and then.
News Background
According to Arkham, Cameron and Tyler Winklevoss, the founders of Gemini, transferred 1,000 bitcoins from Gemini Custody to their exchange’s hot wallet. Such transfers are usually seen as a sign that a sale is in the works.
The crypto market is suffering losses amid a rising stock market, particularly for companies operating in robotics and artificial intelligence. Uncertainty surrounding Congress’s adoption of the CLARITY bill is also exerting pressure, Bitwise notes. Who needs cryptocurrency now, when the Nasdaq-100 index has risen by 43% over the past year?
The outflow of funds from Bitcoin ETFs is just normal market noise, while Wall Street continues to bet on cryptocurrencies, according to Bloomberg Intelligence analyst Eric Balchunas.
The crypto market’s decline is caused by investors pulling out, not the end of the bull cycle, says BitMine CEO Tom Lee. In his view, everything that is happening fits the classic scenario of a market bottom forming and may precede a new phase of growth.
According to CoinDesk, major payment systems Visa, Mastercard and Stripe are exploring the possibility of creating a unified stablecoin platform. The largest US crypto exchange, Coinbase, could become a project partner.
Gold Remains Under Pressure, but a Rebound Is Still Possible
Gold prices rose to 4,472 USD per troy ounce on Thursday. Despite the modest rebound, the precious metal is still attempting to recover from a weekly decline of nearly 2%.
Pressure on gold continues to build as expectations grow that major central banks, including the Federal Reserve, may need to maintain tighter monetary policy to combat inflation. Much of this concern stems from the recent surge in energy prices.
An additional negative factor has been the renewed escalation of tensions in the Middle East. Prospects for a near-term agreement between the US and Iran have deteriorated significantly following a fresh exchange of strikes between the two sides. Bahrain and Kuwait have also become involved in the conflict, marking the most serious escalation since the ceasefire was introduced in early April.
Ongoing tensions and de facto restrictions on shipping through the Strait of Hormuz are keeping oil prices elevated, increasing inflation risks and reinforcing expectations that interest rates will remain higher for longer.
Further support for this view came from comments made by Cleveland Federal Reserve Bank President Beth Hammack. According to Hammack, the Fed may be forced to raise interest rates again if inflationary pressures continue to intensify.
Investor attention is now firmly focused on Friday’s Non-Farm Payrolls report. US labour market data could significantly influence expectations regarding future Federal Reserve policy and, consequently, the outlook for gold.
Technical Analysis
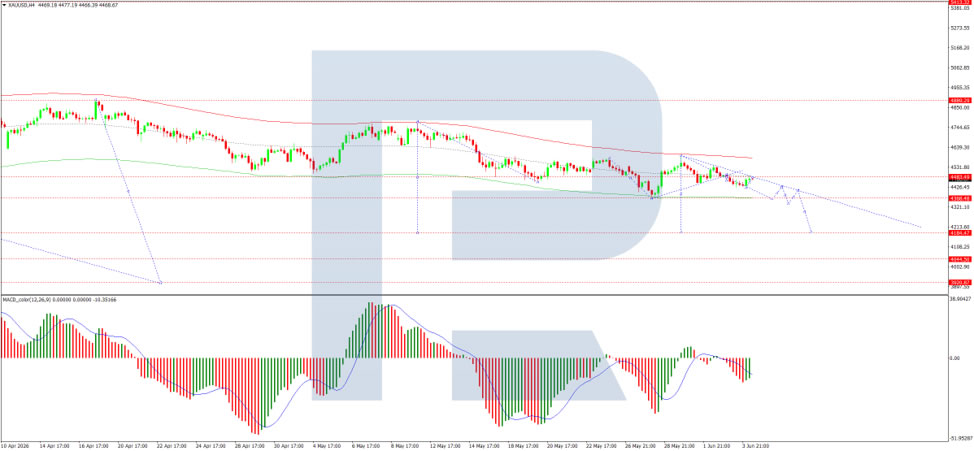
On the H4 XAU/USD chart, the market is trading within a consolidation range around the 4,478 USD level after a retest from below. A move lower towards 4,360 USD is expected, followed by a corrective rebound towards 4,420 USD. After that, the market may resume its decline towards 4,238 USD, with scope for a further move to 4,180 USD. The MACD indicator confirms the current bearish momentum, with the signal line below the centre line and pointing firmly downwards.
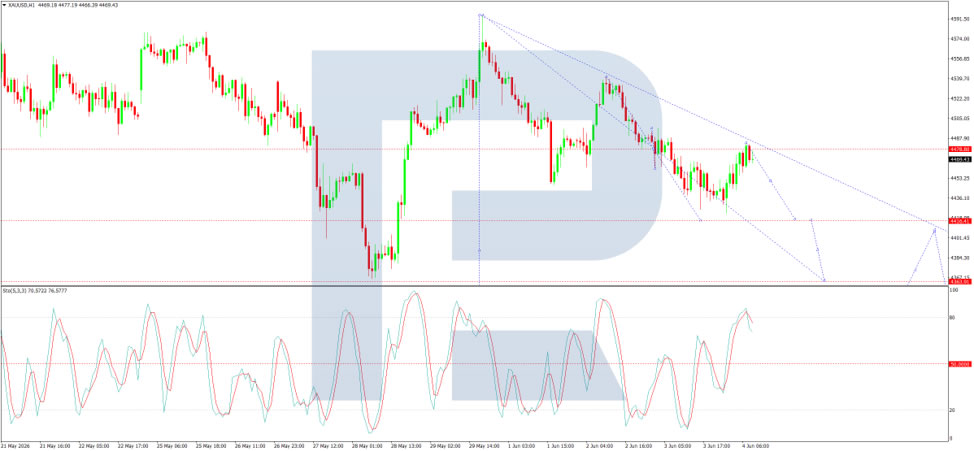
On the H1 chart, the market has broken below the 4,478 USD level and moved lower towards 4,422 USD. A corrective rebound towards 4,478 USD as a retest from below remains possible before another decline towards 4,250 USD. A subsequent recovery towards 4,390 USD may follow. The Stochastic oscillator supports this scenario, with the signal line below the 80 level and pointing downwards towards 20, indicating persistent downside pressure.
Conclusion
Gold remains vulnerable to further losses as elevated energy prices, geopolitical tensions, and expectations of tighter monetary policy continue to weigh on sentiment. However, short-term corrective rebounds remain possible, particularly as investors await key US labour market data that could reshape expectations for the Federal Reserve.
USD/CAD Surges on New US Tariff Threats. A Break Above 1.40 Could Change Everything.
Usually, rising oil prices have generally been a source of support for Canadian Dollar. This week, however, that relationship is breaking down. Despite Brent crude climbing back above $95 per barrel as US-Iran negotiations remain deadlocked, Canadian Dollar has weakened sharply against its US counterpart. The key reason is a new threat from Washington that could prove far more damaging to Canada's economy than higher oil prices are supportive.
The catalyst is the U.S. Trade Representative's proposal to impose tariffs of up to 12.5% on imports from 60 economies over forced-labor enforcement concerns. While the measure targets a broad group of countries, the implications for Canada are particularly severe. Unlike traditional trade disputes, the proposal relies on supply-chain compliance rather than trade deficits or national-security arguments, potentially bypassing many of the protections Canada normally enjoys under USMCA. Markets have long viewed Canada's free-trade status as a shield against major US protectionist actions. This proposal challenges that assumption and introduces additional uncertainty just as the Canadian economy is already struggling to gain momentum.
The timing could hardly be worse. Canada's economy was already showing signs of recession before even the Middle East conflicts. GDP contracted by -0.2% in both Q2 and Q4 of last year before flatlining at 0.0% in Q1 2026. At the same time, elevated oil prices are raising inflation risks across the economy. Under normal circumstances, a central bank might respond with tighter policy. However, the Bank of Canada faces a difficult dilemma. Raising rates to combat inflation could further weaken growth and place additional strain on heavily indebted households and the housing market. Cutting rates to support activity risks accelerating the decline in Canadian Dollar and importing even more inflation. The result is an increasingly uncomfortable stagflationary backdrop.
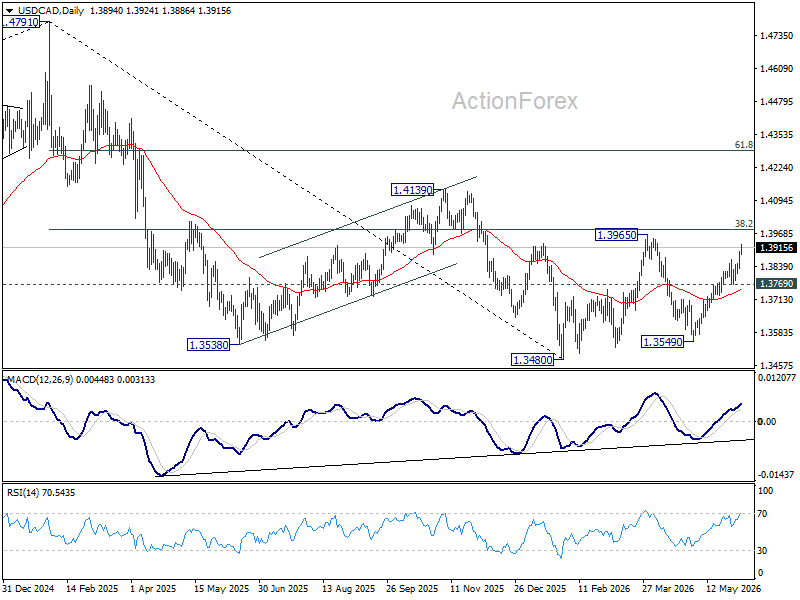
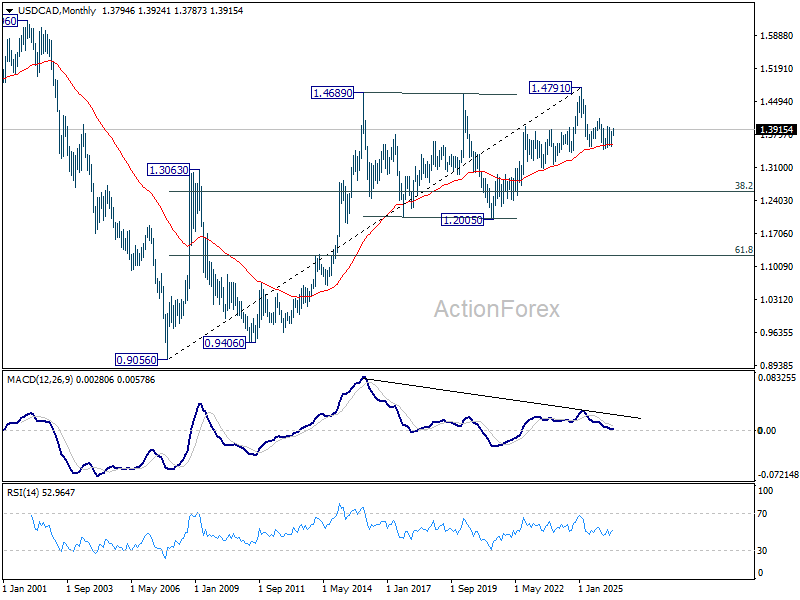
The technical picture is beginning to reflect these concerns. USD/CAD's rally from 1.3549 is accelerating and is rapidly approaching the 38.2% retracement of the decline from 1.4791 to 1.3480 at 1.3981. This area, effectively the 1.40 psychological level, could prove decisive for the longer-term outlook. Rejection there would keep the medium term down trend from 1.4791 intact and suggest the current advance is merely corrective.
However, a decisive break above 1.40 would tell a very different story. Such a move would argue that the entire decline from the 2025 high at 1.4791 has already completed and that strong support from the 55 M EMA has held. More importantly, it would signal that markets are reassessing Canada's medium-term outlook in a much more negative light. In that scenario, a retest of 1.4791 (2025 high) could become a realistic objective over the coming quarters.
Euro and Sterling Weaken as the Dollar Strengthens Ahead of Key US Data
The US dollar continues to hold firm against its major counterparts, supported by strong US macroeconomic data and expectations surrounding the release of further labour market indicators. Additional support for the greenback comes from persistent inflationary risks and the Federal Reserve’s cautious stance regarding further monetary policy easing. Against this backdrop, EUR/USD and GBP/USD remain under pressure, with market participants preferring to reduce long positions in the euro and sterling ahead of the next batch of economic releases.
EUR/USD
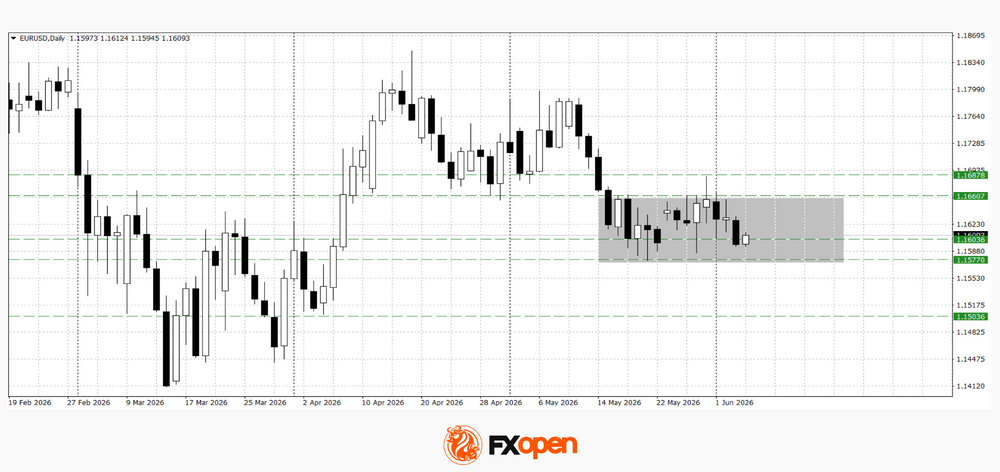
EUR/USD continues to trade within its established range following the recent decline, consolidating near the lower boundary.
Technical analysis of EUR/USD points to continued sideways trading within the 1.1570–1.1660 range. Should US data come in strong, pressure on the pair could intensify, potentially leading to a break below the lower boundary of the range and the beginning of a new bearish impulse. Conversely, if incoming data disappoint market expectations, EUR/USD may strengthen above 1.1660.
Key events for EUR/USD:
- today at 10:30 (GMT+3): Germany S&P Global Construction PMI;
- today at 15:30 (GMT+3): US Initial Jobless Claims;
- today at 20:00 (GMT+3): speech by Federal Open Market Committee (FOMC) member Mary Daly.
GBP/USD
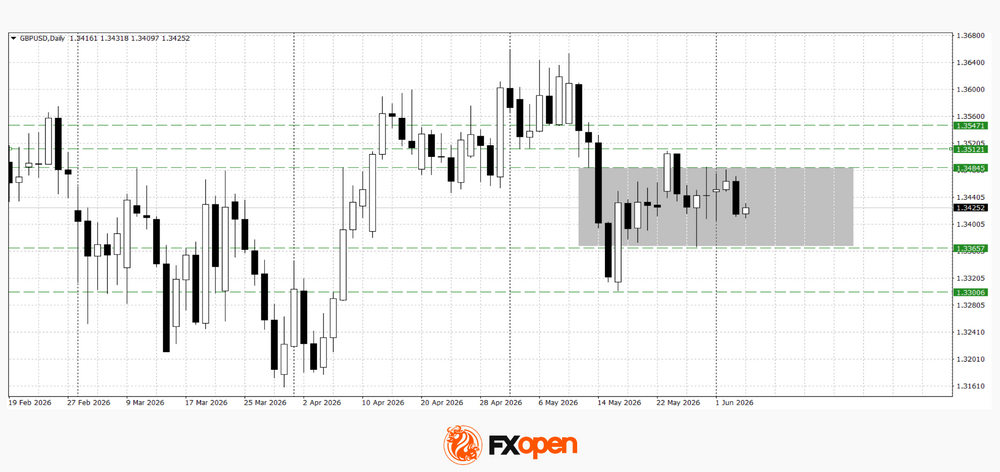
GBP/USD also remains under pressure following its recent decline. Sterling previously attempted to develop an upward correction; however, buyers failed to establish themselves above local resistance levels. As a result, the pair has returned to the range between 1.3360 and 1.3480, where a balance between buyers and sellers is currently taking shape.
Technical analysis of GBP/USD suggests the possibility of a test of the lower boundary of this range. A decisive move below 1.3360 could lead to a retest of the recent low near 1.3300. If buyers manage to secure a foothold above 1.3480, a move towards the 1.3510–1.3550 area may follow.
Key events for GBP/USD:
- today at 11:30 (GMT+3): UK Construction PMI;
- today at 18:40 (GMT+3): speech by Bank of England Governor Andrew Bailey;
- tomorrow at 13:30 (GMT+3): UK mortgage lending data.
Key takeaways
The dollar continues to enjoy an advantage thanks to resilient US economic indicators and expectations of further labour market data. At the same time, EUR/USD and GBP/USD are trading close to important technical support levels, making the upcoming data releases a key factor for the market’s next move. Strong US figures could increase pressure on European currencies and trigger downside breakouts from their respective ranges, while weaker data may support a corrective recovery in both the euro and sterling.
Trade over 50 forex markets 24 hours a day with FXOpen. Take advantage of low commissions, deep liquidity, and spreads from 0.0 pips (additional fees may apply). Open your FXOpen account now or learn more about trading forex with FXOpen.
This article represents the opinion of the Companies operating under the FXOpen brand only. It is not to be construed as an offer, solicitation, or recommendation with respect to products and services provided by the Companies operating under the FXOpen brand, nor is it to be considered financial advice.
Middle East Tensions Drive Oil Higher as S&P 500 Snaps Winning Streak
Key takeaways
- Renewed clashes between the U.S. and Iran involving Kuwait and Bahrain reignited geopolitical concerns, driving oil prices sharply higher and triggering a broad risk-off move across global equity markets.
- The AI-led technology rally faced its first meaningful challenge after Broadcom's disappointing guidance raised concerns about the pace of AI infrastructure revenue growth, prompting investors to reassess near-term earnings expectations across the sector.
- Rising energy prices, resilient economic activity, and persistent inflation pressures have reinforced expectations for tighter monetary policy, with markets increasingly pricing a more hawkish Federal Reserve and a near-certain June rate hike from the European Central Bank.
- Chart of the day: WTI crude minor bullish trend remains intact above $95.10/bbl, key support with potential upside trigger at $100.00/bbl.
Chart of the day - WTI crude minor bullish trend remains intact
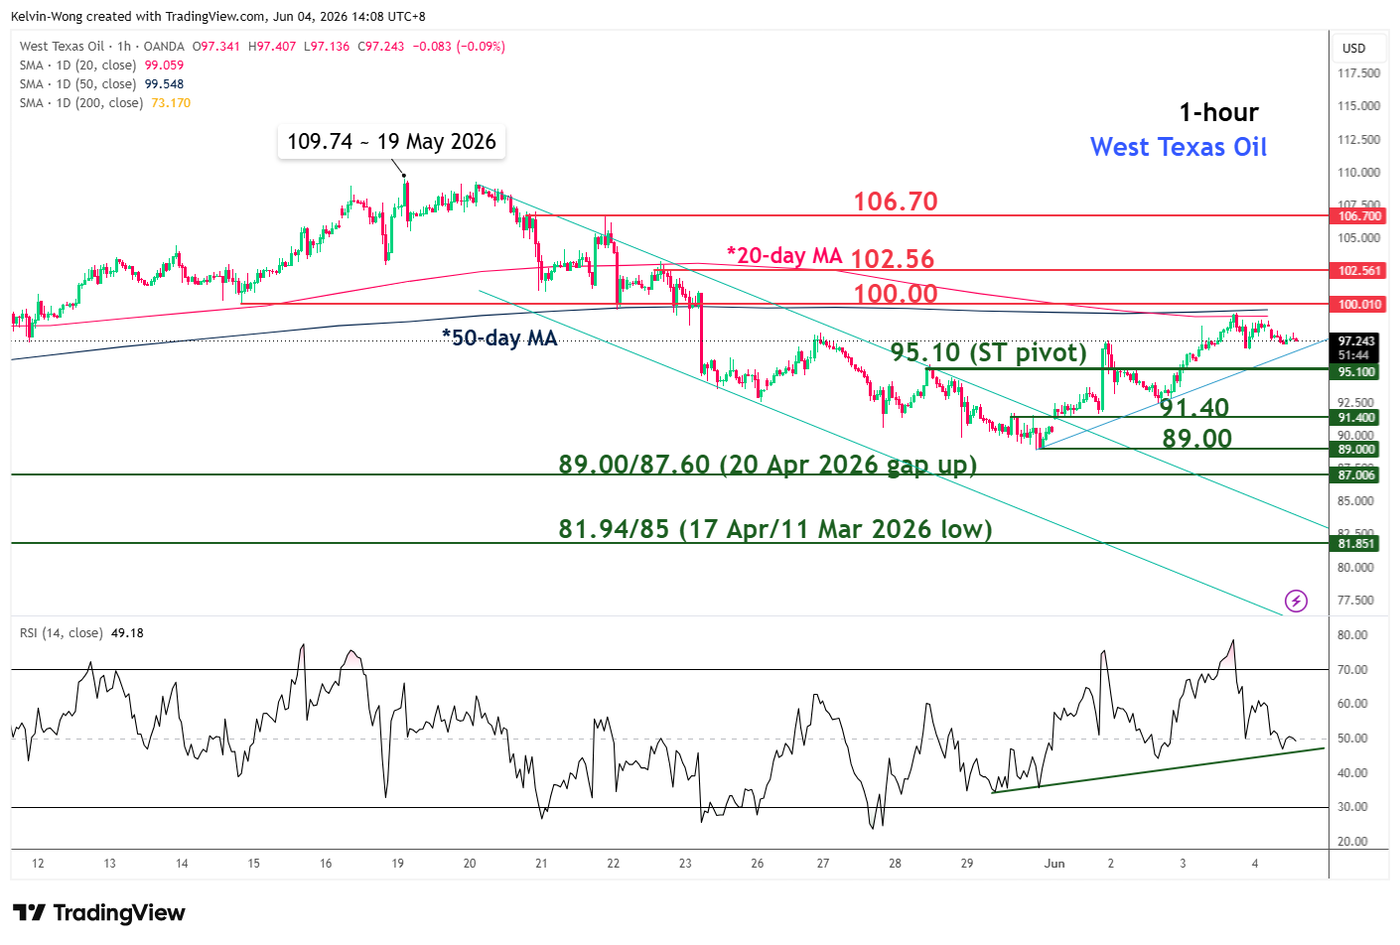
Fig.1: West Texas Oil CFD minor trend as of 4 Jun 2026 (Source: TradingView). The information presented is historical information, and past performance is not indicative of future performance.
The minor bullish trend of the West Texas Oil CFD (a proxy for WTI crude oil futures) from the last Friday, 29 May 2026 low of $88.90/bbl remains intact (see Fig. 1).
Supported by an ascending trendline, watch the 95.10 key short-term pivotal support, and a clearance above the 100.00 near-term resistance (also the 20-day and 50-day moving averages) is likely to reinforce a further potential minor recovery towards the next intermediate resistances at 102.56 and 106.70.
On the flipside, failure to hold and an hourly close below 95.10 invalidates the bullish tone, setting up a choppy decline to retest the next intermediate supports at 91.40 and 89.00.
Top macro headlines
- US-Iran clashes disrupt peace: Overnight clashes between the US and Iran involving Kuwait and Bahrain resulted in one of the most serious flare-ups since the early April ceasefire, driving a sharp risk-off rotation across global markets.
- Tech AI rally falters: Broadcom Inc. issued a disappointing forecast signalling decelerating AI-fueled sales growth. This dragged down the broader tech sector, overshadowing early enthusiasm for Alphabet Inc.’s upsized $84.75 billion equity raise and SpaceX’s planned $75 billion IPO at $135 a share.
- Inflation risks trigger hawkish bets: Resilient consumer demand, corporate job additions, and a fresh surge in energy costs are fueling expectations of a hawkish Federal Reserve. Markets are increasingly betting the next Fed move will be a hike, while fully pricing in a 25-basis-point rate hike for the ECB’s June 11 meeting.
Key macro themes
- Geopolitical threat to energy supply: The renewed escalation in Middle East hostilities threatens to derail negotiations to extend the recent truce and reopen the Strait of Hormuz. This is directly pressuring global energy supply lines and pushing crude prices higher.
- AI growth meets reality check: The stark contrast between massive capital raises in the tech space and Broadcom’s weak forward guidance suggests the AI sector is facing resistance, prompting investors to re-evaluate the near-term revenue potential of AI infrastructure.
- Central banks cornered by inflation: The combination of a robust labour market and a sudden commodity shock leaves central bankers trapped. Policymakers are under immense pressure to raise or maintain borrowing costs to prevent inflation from reigniting, directly stalling the recent equity rally.
Global market impact
Equities: The S&P 500 fell 0.7%, snapping a nine-day winning streak. The Dow dropped 1.2%, and the Nasdaq 100 declined 0.3%. Software ETFs slid 4.3%. Globally, the MSCI World Index reversed early record highs, closing down 0.7%.
Fixed Income: The US 10-year Treasury yield advanced 5 bps to 4.49%. In Europe, Germany’s 10-year yield rose 6 bps to 3.04%, and Britain’s 10-year yield climbed 7 bps to 4.93%.
FX: The US Dollar Index rose 0.3% on safe-haven flows and hawkish rate bets. The Euro declined 0.3% to $1.1598, and the British Pound fell 0.3% to $1.3420.
Commodities: WTI crude surged 2.8% to $96.20/bbl, while Brent briefly topped $97/bbl amid geopolitical fears. Spot gold fell 1.2% to $4,435/oz, pressured by higher yields and a stronger USD to retest its key 200-day moving average.
Asia Pacific impact
- Stock markets are undergoing a setback: Moving in line with weak performances seen in the US stock market overnight, key Asia Pacific stock indices are on the defensive and in profit-taking mode in today’s Asia session, where intraday losses were seen across the board. Nikkei 225 (-1.4%), KOSPI (-1.5%), Hang Seng Index (-1.5%), China A50 (-1.5%), CSI 300 (-0.8%), ASX 200 (-1.2%), and STI (-1.2%).
- Trade & tariffs optimism: Sentiment was partially supported by expectations of potential US tariff reductions on non-critical Chinese goods. Based on 2025 figures, this could cover approximately 10% of US imports from China, potentially revitalising direct exports.
- Yen intervention watch: The Japanese yen remained under significant pressure, falling 0.1% to hover near a multi-decade low of 160.08 per US dollar in today’s Asia opening session, leaving markets highly alert to potential intervention by the Bank of Japan. Key near-term support for the USD/JPY rests at 159.45 (Wednesday, 3 June 2026, minor swing low).
Top 4 events to watch today
- ECB President Lagarde Speech - 4:00 pm SGT Impact: EUR/USD, EUR crosses, DAX
- US Initial & Continuing Jobless Claims - 8:30 pm SGT Impact: USD, US Treasuries, US stock indices
- Fed Speak (Barkin) - 8:30 pm SGT Impact: USD, US Treasuries, US stock indices
- BoE Governor Bailey Speech - 11.40 pm SGT Impact: GBP/USD, GBP crosses, FTSE UK 100
Sunrise Market Commentary
Markets
US economic data for a third day straight surprised to the upside. Starting Monday with the US manufacturing ISM and continuing on Tuesday with the JOLTS job report, we’ve seen solid ADP employment growth (122k) and an above-consensus services ISM (54.5 from 53.6) yesterday. May business activity expanded at the second-fastest clip (57.7) in more than 1.5 years while new order inflow picked up as well (57.3). The employment index virtually matched April’s 48, which still weighed in the headline index. The supplier delivery index eased from April’s 4.5 year high to 55.2. The prices subseries (71.3) meanwhile hit the highest since August 2022. Ongoing decent-to-strong economic data fuel market bets for a Fed rate hike with the implied probability for a 25bps move by year-end growing to 80% yesterday. Fed speak is adding traction. Dallas president Logan said inflation isn’t headed for the 2% target but instead trending toward the mid 2s. With the labour market broadly balanced, AI investment booming and financial conditions accommodative, she is increasingly concerned that higher interest rates may be needed later this year to do the job. Logan was one of the dissenters over the dovish bias that still featured the April policy statement. Logan’s hawkish comments rhyme with Cleveland Fed Hammack’s, another April dissenter, earlier this week. US rates yesterday finished between 3.7 and 5.1 bps higher with rising oil prices ($97.8) on lingering geopolitical worries contributing to the move. EU yields rose in similar fashion. ECB’s Elderson was the latest in a series of policymakers (Schnabel, Wunsch, Simkus …) arguing that it is no longer possible to look through the Iran shock. The quiet period has now kicked in with a hike next week fully baked in. ECB president Lagarde speaks today but the rules in theory don’t allow her to touch on monetary policy. The US dollar strengthened against the backdrop of a souring risk mood. EUR/USD slid to 1.16 and DXY’s close (99.53) was the highest since the April 8 ceasefire was announced.
A disappointing after-market outlook from tech-giant Broadcom is weighing on stock sentiment this morning. A US-brokered truce between Israel and Lebanon is offering some counterweight though. Iran has repeatedly called for Lebanon to be included in any peace deal. Oil prices stabilize around $97, at least suggesting some form of market skepticism towards the ceasefire and by extension such a peace agreement. The (US) economic calendar is taking a backseat today before culminating into tomorrow’s May payrolls report. Elevated oil prices should support core bond yields and the dollar in a daily perspective. A speech by Bank of England governor Bailey is worth mentioning from a sterling point of view.
News & Views
National Bank of Poland governor Glapinski spoke a day after the central bank kept its policy rate unchanged at 3.75%. He believes that rates are sufficiently high to stabilize inflation under current conditions and that there is no reason to change them or even discuss changes. Glapinski highlighted that slowing wage growth is positive for the Polish CPI path with inflation currently running at 3.1%Y/Y (May) and within the NBP’s target range. He added that the inflationary shock is much smaller than the energy shock in 2021-2022, but also smaller than initially feared. It remains limited to raw materials and fuels. On top, demand growth is not excessive and the situation on the labour market less strained. Polish markets barely reacted to this week’s policy decision and press conference with EUR/PLN holding around the 4.24 mark. Polish money markets stick with a minor tightening bias, discounting a rate hike on a 6-month horizon.
The Republican-controlled US house voted 215-208 in favour of a resolution which directs US President Trump to remove US armed forces against Iran unless explicitly authorized by Congress, other than to defend America, an ally or partner from imminent attack. Four Republicans joined united Democrats in voting in favour. The resolution will now move on to the US Senate which blocked earlier attempts to install some kind of oversight on several occasions already. More and more signs of (war) fatigue are showing up though. Last month, a Senate resolution to end the war also advanced past a procedural hurdle, but hasn’t yet come to a formal vote.